Volume 2, Issue 1, 2011, Full Text - 5th International Conference on ...
Volume 2, Issue 1, 2011, Full Text - 5th International Conference on ...
Volume 2, Issue 1, 2011, Full Text - 5th International Conference on ...

You also want an ePaper? Increase the reach of your titles
YUMPU automatically turns print PDFs into web optimized ePapers that Google loves.
Sustainable C<strong>on</strong>structi<strong>on</strong> and Design <str<strong>on</strong>g>2011</str<strong>on</strong>g><br />
result didn’t show c<strong>on</strong>siderable change (no blending in the results), which mean there is no vital effect of<br />
the adhesi<strong>on</strong>. May be the presence of PTFE could have possibly reduced the adhesi<strong>on</strong> effect. To clearly<br />
study the rolling and the sliding coefficient values further experiments needed.<br />
Tribological tests <strong>on</strong> evaluating the fricti<strong>on</strong> characteristics uses temperature to explain the tendency as a<br />
outcome of fricti<strong>on</strong>al heating. In the current research the influence of fricti<strong>on</strong>al heating is made negligible by<br />
allowing enough cooling time between two measurements and by using the cleaning agents which removes<br />
the induced heat in the test cycle. On measuring the temperature of the c<strong>on</strong>tact surface from the composite<br />
disc temperature of 24±2°C was observed which is close to the room temperature. Even with <strong>on</strong>line<br />
m<strong>on</strong>itoring system the measured surface temperature fluctuates a little. The temperature of the c<strong>on</strong>tact<br />
surface has reached a maximum value of 26˚C which is very low c<strong>on</strong>sidering the earlier researches <strong>on</strong><br />
rolling/sliding c<strong>on</strong>tacts of polymers, where the increase in temperature was up till 80°. Investigati<strong>on</strong> <strong>on</strong> the<br />
image of the c<strong>on</strong>tact surface also briefs that there is no deposit of polymer <strong>on</strong> the counterface material.<br />
4 MICROGRAPH<br />
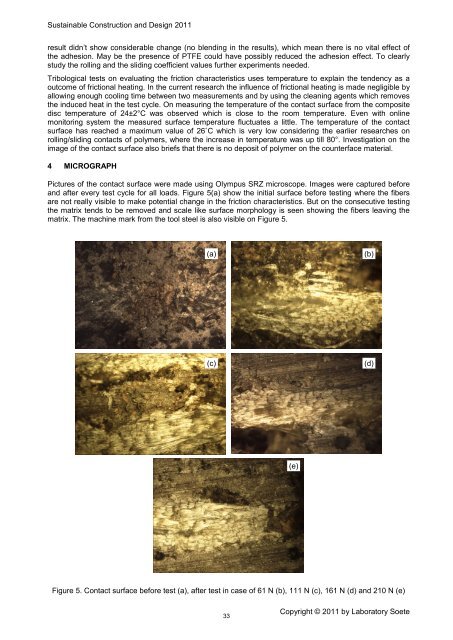
Pictures of the c<strong>on</strong>tact surface were made using Olympus SRZ microscope. Images were captured before<br />
and after every test cycle for all loads. Figure 5(a) show the initial surface before testing where the fibers<br />
are not really visible to make potential change in the fricti<strong>on</strong> characteristics. But <strong>on</strong> the c<strong>on</strong>secutive testing<br />
the matrix tends to be removed and scale like surface morphology is seen showing the fibers leaving the<br />
matrix. The machine mark from the tool steel is also visible <strong>on</strong> Figure 5.<br />
(a)<br />
(b)<br />
(c)<br />
(d)<br />
(e)<br />
Figure 5. C<strong>on</strong>tact surface before test (a), after test in case of 61 N (b), 111 N (c), 161 N (d) and 210 N (e)<br />
33<br />
Copyright © <str<strong>on</strong>g>2011</str<strong>on</strong>g> by Laboratory Soete