Volume 2, Issue 1, 2011, Full Text - 5th International Conference on ...
Volume 2, Issue 1, 2011, Full Text - 5th International Conference on ...
Volume 2, Issue 1, 2011, Full Text - 5th International Conference on ...

Create successful ePaper yourself
Turn your PDF publications into a flip-book with our unique Google optimized e-Paper software.
Sustainable C<strong>on</strong>structi<strong>on</strong> and Design <str<strong>on</strong>g>2011</str<strong>on</strong>g><br />
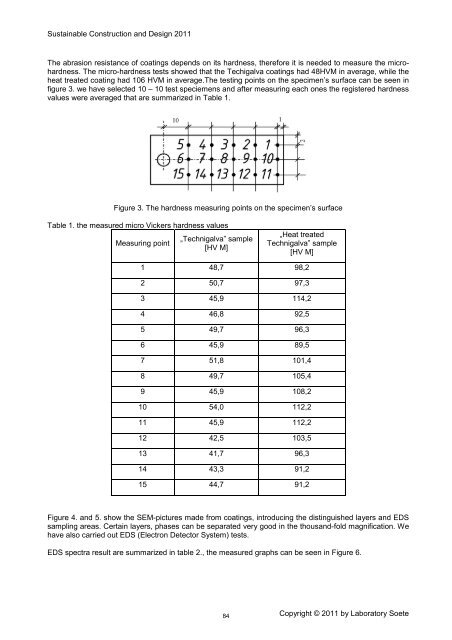
The abrasi<strong>on</strong> resistance of coatings depends <strong>on</strong> its hardness, therefore it is needed to measure the microhardness.<br />
The micro-hardness tests showed that the Techigalva coatings had 48HVM in average, while the<br />
heat treated coating had 106 HVM in average.The testing points <strong>on</strong> the specimen’s surface can be seen in<br />
figure 3. we have selected 10 – 10 test speciemens and after measuring each <strong>on</strong>es the registered hardness<br />
values were averaged that are summarized in Table 1.<br />
Figure 3. The hardness measuring points <strong>on</strong> the specimen’s surface<br />
Table 1. the measured micro Vickers hardness values<br />
Measuring point<br />
„Technigalva” sample<br />
[HV M]<br />
„Heat treated<br />
Technigalva” sample<br />
[HV M]<br />
1 48,7 98,2<br />
2 50,7 97,3<br />
3 45,9 114,2<br />
4 46,8 92,5<br />
5 49,7 96,3<br />
6 45,9 89,5<br />
7 51,8 101,4<br />
8 49,7 105,4<br />
9 45,9 108,2<br />
10 54,0 112,2<br />
11 45,9 112,2<br />
12 42,5 103,5<br />
13 41,7 96,3<br />
14 43,3 91,2<br />
15 44,7 91,2<br />
Figure 4. and 5. show the SEM-pictures made from coatings, introducing the distinguished layers and EDS<br />
sampling areas. Certain layers, phases can be separated very good in the thousand-fold magnificati<strong>on</strong>. We<br />
have also carried out EDS (Electr<strong>on</strong> Detector System) tests.<br />
EDS spectra result are summarized in table 2., the measured graphs can be seen in Figure 6.<br />
84<br />
Copyright © <str<strong>on</strong>g>2011</str<strong>on</strong>g> by Laboratory Soete