Volume 2, Issue 1, 2011, Full Text - 5th International Conference on ...
Volume 2, Issue 1, 2011, Full Text - 5th International Conference on ...
Volume 2, Issue 1, 2011, Full Text - 5th International Conference on ...

You also want an ePaper? Increase the reach of your titles
YUMPU automatically turns print PDFs into web optimized ePapers that Google loves.
Sustainable C<strong>on</strong>structi<strong>on</strong> and Design <str<strong>on</strong>g>2011</str<strong>on</strong>g><br />
resp<strong>on</strong>se of the polymer in the reinforced composite. The overall tendency of the curve shows exp<strong>on</strong>ential<br />
behaviour of the materials <strong>on</strong> testing against steel. It is interesting that the fricti<strong>on</strong> force increases by<br />
approximately 51% from 10 to 100 rpm <strong>on</strong> low and high load c<strong>on</strong>diti<strong>on</strong>. In case of high speeds between 100<br />
to 700 rpm the fricti<strong>on</strong> force increases just 26% at high loads and 42% in low load. This tendency might<br />
have been produced by having large rolling resistance, and there is also some effect due to the str<strong>on</strong>ger<br />
adhesi<strong>on</strong> during high loads.<br />
Table 2. illustrates the functi<strong>on</strong>s for the curves and their R 2 values where a linear increase in case of high<br />
load is seen and simultaneously the rate of increase in fricti<strong>on</strong> force is relatively more. But the high nominal<br />
values <strong>on</strong> changing to high speed since 100-700 rpm is 26% which means, the material <strong>on</strong> high load is less<br />
sensitive to the speed relative to the low load.<br />
Table 2. illustrates the functi<strong>on</strong>s for the curves and their R<br />
2<br />
values<br />
M238 and PA6 Equati<strong>on</strong> R 2 value<br />
61 N (77.23 MPa)<br />
-0.0897⋅n<br />
F = 3.367 ⋅(1- e ) + 0.004 ⋅ n + 1.718 0.8602<br />
210 N (143.30 MPa) -0.0256⋅n<br />
F = 6.895⋅(1- e ) + 0.007 ⋅ n + 9. 082 0.9656<br />
3.1 Effect of the temperature<br />
Most of the studies <strong>on</strong> fricti<strong>on</strong> force are evaluated based <strong>on</strong> the temperature effects but in fundamental<br />
research isolating a variable gives much more valuable informati<strong>on</strong> to design the system and the material<br />
accordingly. In the current research the effect of temperature has been eliminated by using limited time of<br />
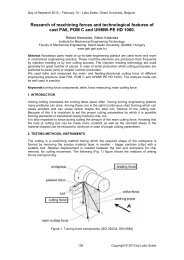
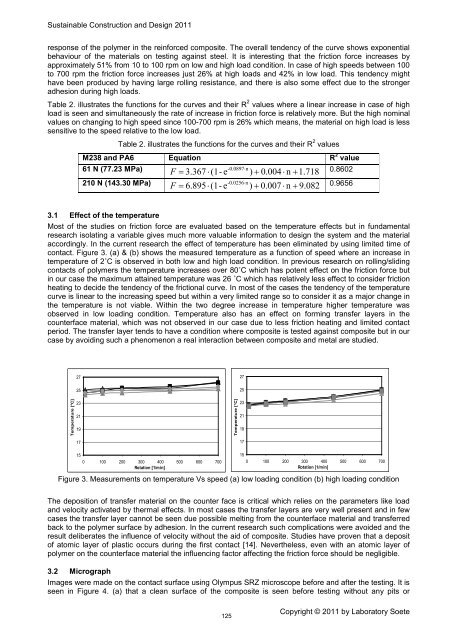
c<strong>on</strong>tact. Figure 3. (a) & (b) shows the measured temperature as a functi<strong>on</strong> of speed where an increase in<br />
temperature of 2˚C is observed in both low and high load c<strong>on</strong>diti<strong>on</strong>. In previous research <strong>on</strong> rolling/sliding<br />
c<strong>on</strong>tacts of polymers the temperature increases over 80˚C which has potent effect <strong>on</strong> the fricti<strong>on</strong> force but<br />
in our case the maximum attained temperature was 26 ˚C which has relatively less effect to c<strong>on</strong>sider fricti<strong>on</strong><br />
heating to decide the tendency of the fricti<strong>on</strong>al curve. In most of the cases the tendency of the temperature<br />
curve is linear to the increasing speed but within a very limited range so to c<strong>on</strong>sider it as a major change in<br />
the temperature is not viable. Within the two degree increase in temperature higher temperature was<br />
observed in low loading c<strong>on</strong>diti<strong>on</strong>. Temperature also has an effect <strong>on</strong> forming transfer layers in the<br />
counterface material, which was not observed in our case due to less fricti<strong>on</strong> heating and limited c<strong>on</strong>tact<br />
period. The transfer layer tends to have a c<strong>on</strong>diti<strong>on</strong> where composite is tested against composite but in our<br />
case by avoiding such a phenomen<strong>on</strong> a real interacti<strong>on</strong> between composite and metal are studied.<br />
27<br />
27<br />
25<br />
25<br />
Temperature [°C]<br />
23<br />
21<br />
19<br />
Temperature [°C]<br />
23<br />
21<br />
19<br />
17<br />
17<br />
15<br />
0 100 200 300 400 500 600 700<br />
Rotati<strong>on</strong> [1/min]<br />
Figure 3. Measurements <strong>on</strong> temperature Vs speed (a) low loading c<strong>on</strong>diti<strong>on</strong> (b) high loading c<strong>on</strong>diti<strong>on</strong><br />
15<br />
0 100 200 300 400 500 600 700<br />
Rotati<strong>on</strong> [1/min]<br />
The depositi<strong>on</strong> of transfer material <strong>on</strong> the counter face is critical which relies <strong>on</strong> the parameters like load<br />
and velocity activated by thermal effects. In most cases the transfer layers are very well present and in few<br />
cases the transfer layer cannot be seen due possible melting from the counterface material and transferred<br />
back to the polymer surface by adhesi<strong>on</strong>. In the current research such complicati<strong>on</strong>s were avoided and the<br />
result deliberates the influence of velocity without the aid of composite. Studies have proven that a deposit<br />
of atomic layer of plastic occurs during the first c<strong>on</strong>tact [14]. Nevertheless, even with an atomic layer of<br />
polymer <strong>on</strong> the counterface material the influencing factor affecting the fricti<strong>on</strong> force should be negligible.<br />
3.2 Micrograph<br />
Images were made <strong>on</strong> the c<strong>on</strong>tact surface using Olympus SRZ microscope before and after the testing. It is<br />
seen in Figure 4. (a) that a clean surface of the composite is seen before testing without any pits or<br />
125<br />
Copyright © <str<strong>on</strong>g>2011</str<strong>on</strong>g> by Laboratory Soete