Volume 2, Issue 1, 2011, Full Text - 5th International Conference on ...
Volume 2, Issue 1, 2011, Full Text - 5th International Conference on ...
Volume 2, Issue 1, 2011, Full Text - 5th International Conference on ...

You also want an ePaper? Increase the reach of your titles
YUMPU automatically turns print PDFs into web optimized ePapers that Google loves.
Sustainable C<strong>on</strong>structi<strong>on</strong> and Design <str<strong>on</strong>g>2011</str<strong>on</strong>g><br />
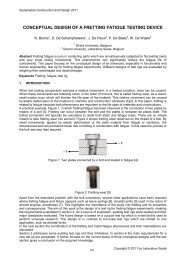
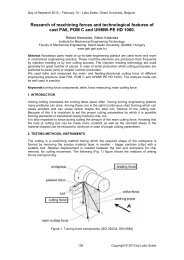
Two load cells are mounted between the adjusting screws and the pads (see figure 9) m<strong>on</strong>itor the c<strong>on</strong>tact<br />
load <strong>on</strong> separate digital displays. The frequency of the device can vary using an inverter up to a maximum<br />
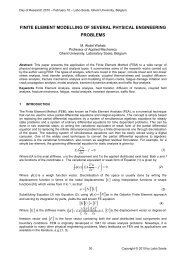
of 25 Hz. Two heating blowers <strong>on</strong> each side of the specimen were used to achieve the test temperature<br />
(Figure 10). The test temperature was measured and c<strong>on</strong>trolled using K-type thermocouples attached <strong>on</strong><br />
the pad surface and m<strong>on</strong>itored with digital display (Figure 11). Since the temperatures at the c<strong>on</strong>tact area<br />
and pads might be different, each test was c<strong>on</strong>ducted after measuring temperatures <strong>on</strong> the specimen and<br />
pads using a temperature calibrati<strong>on</strong> specimen. Before each test, the specimen was kept at 260°C for<br />
about an hour to have a uniform temperature distributi<strong>on</strong> over the gauge area of encompassing the c<strong>on</strong>tact<br />
area. Further details about test setup can be found in reference [11]. The experiments are c<strong>on</strong>ducted for<br />
stress ratio, R=0.1, frequency of 25 HZ at a c<strong>on</strong>stant force of F=1200 N, and working stresses of 110, 150,<br />
200, and 280 MPa. Furthermore, in order to validate the fretting fatigue tests results a number of tensile<br />
tests were c<strong>on</strong>ducted <strong>on</strong> specimens at different temperatures and the ultimate strength of material was<br />
measured. For each temperature, the specimens were heated up in a furnace for different time durati<strong>on</strong>s.<br />
This is because the durati<strong>on</strong> of fatigue tests depends <strong>on</strong> stress level and for low stresses; the specimens<br />
are exposed to heating for l<strong>on</strong>ger time. Also fractography of fractured surfaces and metallography are<br />
performed using optical microscopy.<br />
Figure 10. Heating blower<br />
Figure 11. Temperature display<br />
2.3 Test results<br />
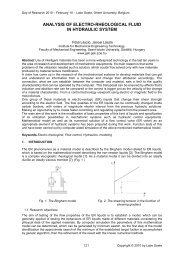
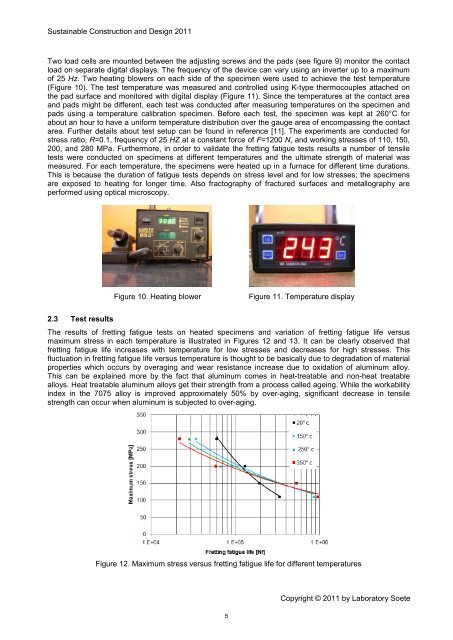
The results of fretting fatigue tests <strong>on</strong> heated specimens and variati<strong>on</strong> of fretting fatigue life versus<br />
maximum stress in each temperature is illustrated in Figures 12 and 13. It can be clearly observed that<br />
fretting fatigue life increases with temperature for low stresses and decreases for high stresses. This<br />
fluctuati<strong>on</strong> in fretting fatigue life versus temperature is thought to be basically due to degradati<strong>on</strong> of material<br />
properties which occurs by overaging and wear resistance increase due to oxidati<strong>on</strong> of aluminum alloy.<br />
This can be explained more by the fact that aluminum comes in heat-treatable and n<strong>on</strong>-heat treatable<br />
alloys. Heat treatable aluminum alloys get their strength from a process called ageing. While the workability<br />
index in the 7075 alloy is improved approximately 50% by over-aging, significant decrease in tensile<br />
strength can occur when aluminum is subjected to over-aging.<br />
Figure 12. Maximum stress versus fretting fatigue life for different temperatures<br />
Copyright © <str<strong>on</strong>g>2011</str<strong>on</strong>g> by Laboratory Soete<br />
5