
Create successful ePaper yourself
Turn your PDF publications into a flip-book with our unique Google optimized e-Paper software.
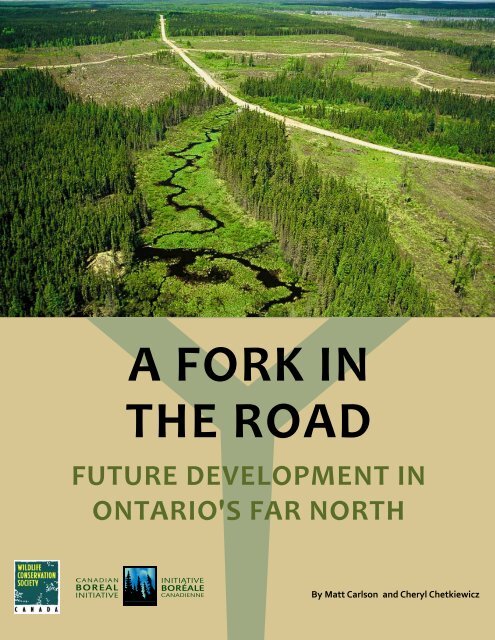
a fork in<br />
the Road<br />
Future development in<br />
Ontario's Far North<br />
By Matt Carlson and Cheryl Chetkiewicz
a fork in<br />
the road:<br />
future<br />
development<br />
in ontario's<br />
far north<br />
A <strong>report</strong> prepared by Matt Carlson 1 and Cheryl Chetkiewicz 2<br />
1 Canadian Boreal Initiative, mcarlson@borealcanada.ca<br />
2 Wildlife Conservation Society <strong>Canada</strong>, cchetkiewicz@wcs.org
About the Canadian Boreal Initiative<br />
The Canadian Boreal Initiative is a national convener for conservation in<br />
<strong>Canada</strong>’s Boreal Forest. We work with conservation organizations, First<br />
Nations, industry and other interested parties – including members of<br />
the Boreal Leadership Council – to link science, policy and conservation<br />
solutions across <strong>Canada</strong>’s Boreal Forest. For more information visit:<br />
www.borealcanada.ca<br />
About Wildlife Conservation Society <strong>Canada</strong><br />
Wildlife Conservation Society <strong>Canada</strong> was established in May 2004 as a<br />
Canadian non-government organization with a mission to save wildlife<br />
and wildlands by improving our understanding of and seeking solutions<br />
to critical problems that threaten key species and large wild ecosystems<br />
throughout <strong>Canada</strong>. We implement and support comprehensive field<br />
studies, particularly in Ontario’s Far North, gather information on wildlife<br />
and seek to address conservation challenges by working with First<br />
Nation communities, governments, regulatory agencies, conservation<br />
groups, and industry. For more information visit: www.wcscanada.org<br />
About the Authors<br />
Matt Carlson is an ecologist with the Canadian Boreal Initiative and the<br />
ALCES Group who is focused on the application of scenario analysis to<br />
inform land use policies capable of balancing resource development with<br />
the maintenance of ecological integrity.<br />
Cheryl Chetkiewicz is an Associate Conservation Scientist with <strong>WCS</strong><br />
<strong>Canada</strong> focused on broad-scale and community-based conservation<br />
planning in Ontario’s Far North, specifically wildlife research and monitoring<br />
and developing cumulative effects landscape models that address<br />
land use and climate change.<br />
Cover photo: Logging in the Red Lake region of Ontario by © Garth Lenz<br />
© 2013 The contents of this paper are the sole property of the authors<br />
and cannot be reproduced without permission of the authors.<br />
Canadian Boreal Initiative, 30 Metcalfe Street, Suite 402, Ottawa,<br />
Ontario, K1P 5L4<br />
Wildlife Conservation Society <strong>Canada</strong>, P.O. Box 10316, Thunder Bay,<br />
Ontario, P7B 6T8<br />
iv<br />
Canadian Boreal Initiative | Wildlife Conservation Society <strong>Canada</strong>
Executive Summary<br />
Ontario's Far North contains some of the world's most intact subarctic<br />
terrestrial and aquatic ecosystems. It is a stronghold for a<br />
number of fish and wildlife species such as woodland caribou,<br />
wolverine, and lake sturgeon. The region is also the homeland of<br />
Ojibwe, Oji-Cree and Cree First Nations who have established longstanding<br />
traditional cultural values and a unique relationship with<br />
this land that they have used and occupied for thousands of years.<br />
The environment in the Far North provides important "services" to<br />
people such as climate regulation, food, cultural values, and clean<br />
and abundant water supplies. The Far North also includes a wealth<br />
of natural resources such as minerals, hydropower development<br />
potential, timber resources, and other resource development opportunities.<br />
In 2010, the Government of Ontario committed to working<br />
with First Nation communities to develop land-use plans that support<br />
conservation and development of the Far North. An important<br />
step in the planning process is assessing whether the cumulative<br />
effects of the <strong>full</strong> suite of potential future developments are compatible<br />
with the aspirations of First Nations and Ontario.<br />
To support decision-making in this unique region, we applied a simulation<br />
model (ALCES®) to explore changes in the composition of<br />
regional landscapes associated with potential future mining, hydroelectric<br />
development, and forestry activity as well as forest fires,<br />
and the implications for woodland caribou, wolverine, moose, and<br />
the intactness of watersheds. Our study focused on the James Bay<br />
Lowlands, which includes the large mineral reserves in the Ring of Fire,<br />
numerous kimberlite deposits, including the Victor Diamond mine,<br />
and major rivers with hydropower potential such as the Attawapiskat,<br />
Moose, and Albany. To encompass the <strong>full</strong> extent of the Pagwachuan<br />
Caribou Range, the study area extended south of the James Bay<br />
Lowland thereby also incorporating portions of five Sustainable<br />
Forest Licenses that are managed primarily for timber production.<br />
To support decisionmaking<br />
in this unique<br />
region, we applied a<br />
simulation model (ALCES)<br />
to explore changes in the<br />
composition of regional<br />
landscapes associated<br />
with potential future<br />
mining, hydroelectric<br />
development, and<br />
forestry activity as well<br />
as forest fires, and the<br />
implications for woodland<br />
caribou, wolverine,<br />
moose, and the intactness<br />
of watersheds.<br />
The simulated development scenario resulted in a three-fold increase<br />
in anthropogenic footprint over 50 years, primarily due to road<br />
and transmission corridor expansion to support industrial developments.<br />
The spatial pattern of the simulated footprint differentiated<br />
between the dispersed road network associated with forestry in the<br />
south and the more isolated, but intensive, mining and hydroelectric<br />
A Fork in the Road: Future Development in Ontario’s Far North<br />
v
developments in the north. The simulated forestry activity in the<br />
south had consequences for the Pagwachuan Caribou Range where<br />
the risk to herd survival approached the high category and range disturbance<br />
exceeded a threshold of 35% – a guideline in the national<br />
caribou recovery strategy. Simulated impacts to wolverine were also<br />
greatest in the south, where expansion of the road network caused<br />
habitat suitability to decline. Land use impacts to wildlife such as<br />
caribou and wolverine may be exacerbated by climate change. As<br />
an example, the moose population was simulated to increase twofold<br />
when climate change was incorporated, which would likely<br />
cause the region’s wolf population to grow with negative implications<br />
for caribou herd viability. Simulated mining and hydroelectric<br />
developments were sufficiently isolated at a regional scale to avoid<br />
large impacts to caribou and wolverine. A greater concern, however,<br />
may be the consequences of these developments to the integrity<br />
of aquatic ecosystems. The watershed impact score increased<br />
for a number of northern watersheds, demonstrating that risk to<br />
aquatic ecosystems is likely to increase in watersheds that contain<br />
important natural resource regions such as the Ring of Fire due to<br />
the presence of multiple mining and hydroelectric developments.<br />
The outcomes of this pilot project offers important considerations<br />
when addressing cumulative effects in northern Ontario, including:<br />
the benefit to wildlife of limiting land use to isolated regions within<br />
an otherwise intact landscape; the need to improve understanding of<br />
the cumulative effects to aquatic ecosystems of multiple large-scale<br />
developments (e.g., mines, dams) within northern watersheds; and<br />
the potential for climate change to increase the sensitivity of wildlife<br />
to industrial land use. We hope these findings will inform land-use<br />
planning at both the community and regional scale and motivate<br />
additional analyses that are needed to comprehensively assess cumulative<br />
effects in Ontario’s Far North.<br />
vi<br />
Canadian Boreal Initiative | Wildlife Conservation Society <strong>Canada</strong>
Table of Contents<br />
1 Introduction ...................................................................<br />
1.1 Ontario’s Far North: A Region of Vital Ecological and<br />
Cultural Importance .........................................................<br />
1.2 The Far North’s Future .....................................................<br />
2 Study Area .....................................................................<br />
3 Methods ........................................................................<br />
3.1 Landscape Composition ...................................................<br />
3.1.1 Land Cover .....................................................................<br />
3.1.2 Human Footprint ............................................................<br />
3.2 Ecological Processes ........................................................<br />
3.2.1 Succession .....................................................................<br />
3.2.2 Fire .................................................................................<br />
3.3 Land Use .........................................................................<br />
3.3.1 Hydropower Sector .......................................................<br />
3.3.2 Mining Sector .................................................................<br />
3.3.3 Forestry Sector ...............................................................<br />
3.4 Ecological Indicators ......................................................... 26<br />
3.4.1 Caribou ..........................................................................<br />
3.4.2 Wolverine .......................................................................<br />
3.4.3 Moose ............................................................................<br />
3.4.4 Watershed Intactness .....................................................<br />
26<br />
27<br />
30<br />
31<br />
4 Results .......................................................................... 33<br />
5 Discussion ......................................................................<br />
5.1 Impacts of land use to wildlife in Ontario’s Far North .........<br />
5.2 Priorities for future scenario analyses ...............................<br />
43<br />
43<br />
48<br />
6 Conclusion ..................................................................... 50<br />
Acknowledgements .............................................................<br />
References ..........................................................................<br />
Appendix 1. Overview of ALCES ...........................................<br />
51<br />
52<br />
58<br />
Appendix 2. The Conservation Matrix Model (with Dr. Hilary<br />
Cooke, <strong>WCS</strong> <strong>Canada</strong>) ........................................<br />
Appendix 3. OMNR’s Cervid Management Zones ...................<br />
60<br />
61<br />
1<br />
1<br />
2<br />
4<br />
6<br />
6<br />
6<br />
7<br />
10<br />
10<br />
10<br />
11<br />
11<br />
16<br />
21<br />
A Fork in the Road: Future Development in Ontario’s Far North<br />
vii
viii<br />
Canadian Boreal Initiative | Wildlife Conservation Society <strong>Canada</strong>
1. Introduction<br />
1.1 Ontario’s Far North: A Region of Vital Ecological<br />
and Cultural Importance<br />
Ontario’s Far North 3 is a 450,000 km 2 subarctic, boreal landscape<br />
of international importance due to its intactness and the immense<br />
ecological goods and services that it provides. Combined with eastern<br />
Manitoba, the region constitutes one of the largest blocks of forest<br />
in the world free from industrial development (World Resources<br />
Institute 2010). The lowland portion of the region includes the<br />
world’s second largest peatland complex and North America’s largest<br />
wetlands along James Bay and Hudson Bay. Three of <strong>Canada</strong>’s<br />
largest rivers (Albany, Moose, Severn) flow through this region,<br />
which contains 5 of the 12 remaining undammed and unregulated<br />
watersheds in North America south of 55 degrees (Dynesius and<br />
Nillson 1994). The region’s ecosystems are a stronghold for a<br />
large number of plants, fish, and wildlife, including those exhibiting<br />
population declines elsewhere in Ontario and nationally such<br />
as woodland caribou and wolverine, as well as the most southerly<br />
subpopulation of polar bears. The abundant and diverse aquatic<br />
habitats, particularly unfragmented river systems, support at least 20<br />
species of freshwater fish, including lake sturgeon, a species of special<br />
concern under Ontario’s Endangered Species Act, 2007 (Golder<br />
Associates Ltd. 2011).<br />
The area is of particular importance to the 24,000 people who have<br />
been settled in 34 communities in the region (Statistics <strong>Canada</strong><br />
2006). The population is largely indigenous, consisting of Ojibwe,<br />
Oji-Cree and Cree First Nations who have established long-standing<br />
traditional cultural values and a unique relationship with this land<br />
that they have used and occupied for at least five millennia (Berkes<br />
2011).<br />
Ontario’s Far North ecosystems provide important social and cultural<br />
benefits to First Nations, including food, fiber, and water. Far<br />
North forests and especially peatland ecosystems contribute globally<br />
to climate regulation by storing approximately 40 billion tonnes of<br />
carbon (Far North Science Advisory Panel 2010). The hydrological<br />
and geochemical processes working in wetlands, peatlands, and forests<br />
provide habitat and clean drinking water for wildlife and people.<br />
3<br />
Ontario’s Far North is that part of<br />
the province north of the forestry<br />
allocation limit, at approximately<br />
51 degrees and defined by Ontario’s<br />
Far North Act, 2010.<br />
A Fork in the Road: Future Development in Ontario’s Far North<br />
1
These ecosystems also confer erosion control along coasts and river<br />
systems, protecting communities from storms and extreme weather.<br />
Taken together, these services have tremendous value to First<br />
Nations, Ontarians, and the world (Anielski and Wilson 2009).<br />
4<br />
In 1977, the Royal Commission<br />
on the Northern Environment<br />
was established by an Order-in-<br />
Council of the Ontario Cabinet<br />
to “inquire into any beneficial<br />
and adverse effects on the<br />
environment for the people of<br />
Ontario of any public or private<br />
enterprise north of the 50th<br />
parallel of north latitude relating<br />
to harvesting, supply and use of<br />
timber resources, mining, milling,<br />
smelting, oil and gas extraction,<br />
hydroelectric development,<br />
nuclear power development, water<br />
use, tourism and recreation,<br />
transportation, communications<br />
or pipelines.” Their <strong>report</strong>s, atlas<br />
and recommendations issued in<br />
1985 stressed the vulnerability of<br />
resident people and communities<br />
to impacts of large scale resource<br />
development, documented the<br />
physical and social environment<br />
of the region, and issued recommendations<br />
for development,<br />
particularly of forest resources.<br />
5<br />
http://www.e-laws.gov.on.ca/<br />
html/source/statutes/english/2010/elaws_src_s10018_e.<br />
htm<br />
6<br />
The Far North Science Panel<br />
was convened by the Ontario<br />
Government to obtain advice on<br />
broad-scale conservation for the<br />
Far North.<br />
1.2 The Far North’s Future<br />
Ontario’s Far North contains an abundance of natural resources,<br />
including rich mineral deposits, hydropower potential, and timber.<br />
While these resources remain largely undeveloped, pressure to open<br />
the region to development is building. Development south of the Far<br />
North has generally caused ecosystem degradation, including loss of<br />
species (e.g., Schaefer 2003), degradation of aquatic ecosystems (e.g.,<br />
Magurran 2009, Revenga et al. 2000), and changes in land cover.<br />
Exploitation of the Far North’s natural resources could likewise<br />
impact regional ecological integrity, and the Royal Commission on<br />
the Northern Environment 4 stressed the vulnerability of First Nation<br />
communities in the region to the impacts of large-scale resource<br />
development such as forestry. In 2010, the Government of Ontario<br />
passed the Far North Act 5 . The objectives state that First Nations<br />
communities and Ontario’s Ministry of Natural Resources (MNR)<br />
will work together to create community-based land-use plans that<br />
identify areas for future development and protection (at least 50% of<br />
the region), with the goal of securing sustainable development in the<br />
Far North and ensuring a role and benefit for First Nations.<br />
Identifying land-use approaches that achieve the desired balance<br />
between resource use and ecological integrity requires consideration<br />
of ecosystem response to potential land-use trajectories (DeFries et al.<br />
2004). Assessment of ecosystem response requires an understanding<br />
of the ecological effects, or response to a change to the environment,<br />
as well as the impact, or consequences of these changes (Wärnbäck<br />
and Hilding-Rydevik 2009). The need to proactively consider the<br />
consequences of land-use options was a key recommendation of the<br />
Far North Science Advisory Panel (2010) 6 . The Panel recommended<br />
that land-use planning follow the Conservation Matrix Model<br />
(Schmiegelow et al. 2006, Krawchuck et al. 2012 – see Appendix<br />
2), whereby conservation planning is integrated with renewable and<br />
non-renewable resource use through adaptive management with<br />
attention to managing “islands” of development. Further, the Panel<br />
identified cumulative effects assessment as a necessary component of<br />
proactive land-use planning in the region.<br />
2 Canadian Boreal Initiative | Wildlife Conservation Society <strong>Canada</strong>
Cumulative effects are changes caused by an action in combination<br />
with other past, present, and future actions (Hegmann et al. 1999,<br />
Johnson 2011). Cumulative effects assessment requires consideration<br />
of the environmental and socio-economic consequences of<br />
current and potential future activities. Given the complexity of<br />
such an assessment, the Far North Science Advisory Panel (2010)<br />
recommended the creation of decision-support systems capable of<br />
integrating available information to assess the consequences of management<br />
options. Decision-support systems in the form of computer<br />
simulation models are well-suited for cumulative effects assessment<br />
due to their ability to integrate knowledge related to human land<br />
use and ecosystems, and track the consequences of diverse relationships<br />
operating over various spatial and temporal scales. Although<br />
contingencies and uncertainty preclude prediction of future outcomes,<br />
scenario analysis can demonstrate the benefits and liabilities<br />
of a range of management alternatives and support decision-making<br />
that is consistent with environmental and socio-economic objectives<br />
(Peterson et al. 2003).<br />
To contribute to the knowledge and tools available to inform<br />
land-use planning in the region, we applied a simulation model to<br />
explore the consequences of potential future land use in the James<br />
Bay Lowlands to caribou (Rangifer tarandus), moose (Alces alces),<br />
wolverine (Gulo gulo), and watershed intactness. By providing an<br />
integrated assessment of potential impacts of mining, forestry, and<br />
hydroelectric development, the analysis is a step towards comprehensive<br />
assessment of the consequences of land use to Ontario’s Far<br />
North.<br />
Decision-support systems<br />
in the form of computer<br />
simulation models are<br />
well-suited for cumulative<br />
effects assessment due to<br />
their ability to integrate<br />
knowledge related to<br />
human land use and<br />
ecosystems, and track the<br />
consequences of diverse<br />
relationships operating<br />
over various spatial and<br />
temporal scales.<br />
A Fork in the Road: Future Development in Ontario’s Far North<br />
3
2. Study Area<br />
The pilot study area incorporates the entire James Bay Lowland<br />
ecoregion of the Hudson Plains ecozone in Ontario (Figure 1).<br />
The formerly submerged marine region (Abraham et al. 2011) is<br />
dominated by wetlands, flat terrain, and impervious soils creating a<br />
myriad of muskegs, bogs, and connecting water (Marshall and Jones<br />
2011). The study area extends south of the James Bay Lowland<br />
ecoregion into a portion of the Lake Abitibi ecoregion, within the<br />
Boreal Shield ecozone, to include the <strong>full</strong> extent of the Pagwachuan<br />
caribou range (OMNR 2012) and permit range-level considerations<br />
of land-use impacts to caribou. The Lake Abitibi portion of the<br />
study area also extends into the area of undertaking (AOU) and<br />
includes portions of five sustainable forest licenses (SFLs). The study<br />
area covers 158,844 km 2 .<br />
The climate is cool in the James Bay Lowland with a mean annual<br />
temperature of -2°C, while the summers are short and the winters are<br />
cold. The mean summer temperature is 11.5°C and the mean winter<br />
temperature is -16°C. The ecoregion is an area of transition, lying<br />
between the coniferous and mixed forests of the clay belt to the south,<br />
and the tundra to the north. Rivers are shallow and slow-moving and<br />
tidal influences may occur 15-20 km upstream of the major rivers<br />
in the James Bay Lowland ecoregion (e.g., Attawapiskat, Albany,<br />
Moose, Kenogami). In the southern section and along rivers, the<br />
forests are composed of balsam fir (Abies balsamea), white spruce<br />
(Picea glauca) and black spruce (Picea mariana), trembling aspen<br />
(Populus tremuloides), and paper birch (Betula papyrifera). Most<br />
of the ecoregion is dominated by peatlands and wetlands, while the<br />
dominant vegetation consists of sedge, mosses, and lichens with or<br />
without stunted black spruce and tamarack (Larix laricina).<br />
The study area contains valuable natural resources, including the<br />
Ring of Fire mineral deposits and large rivers with hydropower<br />
potential, making it likely that the largely intact region will experience<br />
increased development in the coming decades. Development<br />
in the study area is currently limited to the Victor Diamond Mine<br />
located west of Attawapiskat, four hydroelectric dams located along<br />
the Mattagami River, and timber harvest within SFLs in the south.<br />
4 Canadian Boreal Initiative | Wildlife Conservation Society <strong>Canada</strong>
!<br />
89°W 88°W 87°W 86°W 85°W 84°W 83°W 82°W 81°W 80°W<br />
!<br />
Wapekeka<br />
First Nation<br />
!<br />
!<br />
Wawakapewin<br />
First Nation<br />
!<br />
Wunnumin Lake<br />
! Webequie<br />
Attawapiskat River<br />
! First Nation<br />
First Nation<br />
!<br />
!<br />
Nibinamik<br />
First Nation<br />
Attawapiskat<br />
First Nation<br />
! Neskantaga<br />
!<br />
First Nation<br />
! Eabametoong<br />
!<br />
First Nation<br />
Marten Falls<br />
First Nation<br />
!<br />
Kashechewan<br />
First Nation<br />
Fort Albany<br />
First Nation<br />
!<br />
Aroland<br />
First Nation<br />
!<br />
Constance Lake<br />
First Nation<br />
! ! Moose Cree<br />
First Nation<br />
89°W<br />
88°W<br />
87°W<br />
86°W<br />
85°W<br />
84°W<br />
83°W<br />
82°W<br />
81°W<br />
80°W<br />
79°W<br />
50°N<br />
51°N<br />
52°N<br />
53°N<br />
50°N<br />
51°N<br />
52°N<br />
53°N<br />
Figure 1. The ALCES pilot project study area in northern Ontario.<br />
Manitoba<br />
ONTARIO<br />
Hudson<br />
Bay<br />
U.S.A.<br />
James Bay<br />
Albany River<br />
Moose River<br />
! First Nation Communities<br />
Area of Undertaking (AOU)<br />
Study Area for ALCES<br />
First Nation Reservations<br />
Protected Areas<br />
Pagwachuan Caribou Herd<br />
National Ecozones<br />
Boreal Shield<br />
Hudson Plains<br />
0 50 100<br />
Kilometers<br />
Quebec<br />
A Fork in the Road: Future Development in Ontario’s Far North<br />
5
3. Methods<br />
The project applied A Landscape Cumulative Effects Simulator<br />
(ALCES) to assess the long-term (i.e., 50 year) effects of land use<br />
in the region. ALCES and its companion mapping tool (ALCES<br />
Mapper) provide strategic land-use planning guidance by examining<br />
inter-relationships among the <strong>full</strong> range of relevant land-use sectors<br />
and natural disturbances, and exploring consequences at large<br />
temporal and spatial scales. ALCES has been extensively applied to<br />
assess cumulative effects in western <strong>Canada</strong> (Browne and Carlson<br />
2012, Carlson et al. 2011, Gunn et al. 2011, Schneider et al. 2010,<br />
Carlson et al. 2009, Jordann et al. 2009, Schneider et al. 2003) as<br />
well as other regions (e.g., Carlson et al. 2011). An overview of<br />
ALCES and ALCES Mapper is provided in Appendix 1.<br />
Parameterization of ALCES required the integration of available<br />
information to: a) assess the existing composition of the regional<br />
landscape; b) define assumptions for natural disturbance; c) define<br />
development trajectories and associated anthropogenic footprints for<br />
the major land-use sectors; and, d) establish coefficients that relate<br />
indicator status to simulated landscape composition and resource<br />
production.<br />
3.1 Landscape Composition<br />
The current composition of the landscape was derived from a variety<br />
of land cover and anthropogenic footprint inventories.<br />
7<br />
FRI data were current to 2007 for<br />
the Big Pic and Hearst SFLs, to<br />
2010 for the Gordon Cosens SFL,<br />
and to 2011 for Kenogami and<br />
Nagagami SFLs. The inventories<br />
were not updated to 2010 using<br />
fire data because disturbance in<br />
the SFLs is dominated by timber<br />
harvest.<br />
3.1.1 Land Cover<br />
The Earth Observation for Sustainable Development (EOSD) land<br />
cover inventory was used to estimate current land cover composition,<br />
with the exception of the 16,464 km 2 of productive forest<br />
located within the SFLs. Forest Resource Inventories (FRIs) were<br />
the preferred source of land cover information for productive forest<br />
because the inventories include age information, identify areas<br />
available for timber harvest, and are current (2007 to 2011, depending<br />
on the SFL 7 ). The EOSD dataset has a resolution of 25 m, was<br />
current to the year 2000, and does not provide an estimate of age<br />
because classification was derived from Landsat images. Time since<br />
disturbance (i.e., age) was added to the land cover data using a map<br />
of forest stand age created by Chen et al. (2003) from the Canadian<br />
6 Canadian Boreal Initiative | Wildlife Conservation Society <strong>Canada</strong>
Forest Inventory, fire polygon data, and other remote sensing. The<br />
forest stand age map has a resolution of 1 km 2 and was current to<br />
1998. The forest stand age map was updated to 2010 by increasing<br />
forest age by 12 years, with the exception of areas that burned<br />
between 1998 and 2010 according to provincial disturbance map<br />
data 8 . The age of burned areas equaled the number of years since<br />
the disturbance occurred.<br />
The FRI and EOSD inventories were used to create a single land<br />
cover data set by adopting the reclassification rules described in<br />
Table 1. The land cover types were identified to promote consistency<br />
across the two inventories while also providing sufficient detail for<br />
wildlife indicator models. Separate land cover types were created for<br />
forest that was available for timber harvest to ensure that forestry<br />
activity was properly constrained spatially during the simulation.<br />
To integrate with the forestry assumptions (e.g., growth and yield),<br />
merchantable forest type was based on provincial forest types: mixed<br />
conifer upland (MCU); mixed conifer lowland (MCL), mixedwood<br />
(MIX), and intolerant hardwood. For non-merchantable forest, it<br />
was not possible to distinguish between lowland and upland conifer<br />
due to limitations of the EOSD inventory. Water bodies (i.e., lakes<br />
and rivers) were defined using the CanVec waterbody polygon dataset.<br />
3.1.2 Human Footprint<br />
The abundance and location of footprint types was derived from a<br />
variety of footprint inventories through a data agreement between<br />
<strong>WCS</strong> <strong>Canada</strong> and OMNR (Table 2, Figure 2). Many of the footprint<br />
inventories were limited to line or point data and assumptions<br />
were made for footprint width. The widths of linear footprints were<br />
40 m for major roads, 24 m for minor roads, 20 m for rail, and 40<br />
m for transmission corridors based on assumptions used in previous<br />
ALCES analyses (e.g., ALCES Group 2011). Reported areas 9 were<br />
used to create reservoir polygons for the Smoky Falls, Harmon, and<br />
Kipling dams. Reservoir area was not available for the Highwood<br />
Rapids dam, but it was assumed to have a very small footprint (1<br />
ha) given that the dam is run-of-river.<br />
The land cover types<br />
were identified to<br />
promote consistency<br />
across the two<br />
inventories while also<br />
providing sufficient detail<br />
for wildlife indicator<br />
models. Separate<br />
land cover types were<br />
created for forest that<br />
was available for timber<br />
harvest to ensure that<br />
forestry activity was<br />
properly constrained<br />
spatially during the<br />
simulation.<br />
8<br />
Provincial Satellite Derived Disturbance<br />
Mapping Data released in<br />
2011.<br />
9<br />
http://www.moosecreeresourceprotection.org/existingdam.<br />
html<br />
A Fork in the Road: Future Development in Ontario’s Far North<br />
7
Table 1. Cover types used when parameterizing the ALCES simulation model, and associated FRI and EOSD cover types (see Appendix<br />
for cover type codes).<br />
ALCES cover type FRI cover type EOSD cover type Area (km 2 )<br />
Merchantable<br />
deciduous forest<br />
Forest belonging to provincial forest types BWT<br />
and POP and identified as available (i.e., for<br />
harvest)<br />
1,448<br />
Merchantable lowland<br />
coniferous forest<br />
Merchantable upland<br />
coniferous forest<br />
Merchantable<br />
mixedwood forest<br />
Non-merchantable<br />
deciduous forest<br />
Non-merchantable<br />
coniferous forest<br />
Non-merchantable<br />
mixedwood forest<br />
Forest belonging to provincial forest type MCL<br />
and identified as available<br />
Forest belonging to provincial forest types<br />
MCU, PJK, and PWR and identified as available<br />
Forest belonging to provincial forest type MIX<br />
and identified as available<br />
Forest belonging to provincial forest types BWT<br />
and POP and identified as unavailable<br />
Forest belonging to provincial forest types<br />
MCL, MCU, PJK, and PWR and identified as<br />
unavailable<br />
Forest belonging to provincial forest type MIX<br />
and identified as unavailable<br />
8,995<br />
4,209<br />
1,812<br />
Deciduous Forest and Broadleaf Dense/<br />
603<br />
Open/Sparse<br />
Coniferous Forest/Dense/Open/Sparse 19,822<br />
Mixedwood Forest/Dense/Open/Sparse 15,023<br />
Treed peatland Polytype TMS Wetland, Wetland – Treed 60,012<br />
Shrub peatland Wetland – Shrub 35,340<br />
Herbaceous peatland Polytype OMS Wetland – Herb 491<br />
Shrubs Polytype BSH Shrubland, Shrub tall/low, prostrate dwarf<br />
883<br />
shrub<br />
Herbaceous/Barren Polytype OMS, GRS, DAL, RCK Herb, Tussock graminoid tundra, Wet sedge, 1,579<br />
Graminoid tundra (various types), Grassland,<br />
Bryoid, Barren/Non-vegetated, Snow/<br />
Ice, Rock/Rubble, Exposed land, Sparsely<br />
vegetated bedrock/till-colluvium, Bare soil<br />
Water Classified using the CanVec hydrology data set 8,340<br />
Table 2. Proposed footprint types and data sources for the scenario analysis.<br />
Footprint type Data source Area (km 2 )<br />
Major road Ontario Road Network MNR class A 6.87<br />
Minor road Ontario Road Network MNR classes B, C, D 60.27<br />
Rail MNR Railroad dataset 6.18<br />
Transmission corridor MNR Utility Line dataset 23.59<br />
Diamond mine Ontario Ministry of Northern Development and Mines 15.32<br />
Hydroelectric dams and reservoirs MNR Waterpower Generation Station and Potential Hydrosite data sets 10 5.43<br />
Gravel pits MNR Aggregate Site Authorized data set 11 2.56<br />
Settlements (i.e., First Nation reservations) Digitized from aerial imagery 20.88<br />
10<br />
The MNR generation station data was point data. The area of reservoirs was from http://www.moosecreeresourceprotection.org/<br />
existingdam.html. Reservoir area was not available for the Highwood Rapids dam. The dam is run of the river, and was therefore assumed<br />
to have a very small footprint (1 ha).<br />
11<br />
The MNR aggregate data was point data. Area of aggregate sites was estimated from the polygonal CanVec aggregate dataset. OMNR<br />
aggregate sites that did not overlap with a CanVec aggregate site polygon were given the average age of aggregate site polygons in the<br />
study area.<br />
8 Canadian Boreal Initiative | Wildlife Conservation Society <strong>Canada</strong>
!<br />
Figure 2. Current land uses in the study area.<br />
!<br />
90°W<br />
!<br />
!<br />
!<br />
Kingfisher Lake<br />
First Nation<br />
89°W<br />
Wapekeka<br />
First Nation<br />
!<br />
!<br />
Wawakapewin<br />
First Nation<br />
Wunnumin Lake<br />
! Webequie<br />
Attawapiskat River<br />
First Nation<br />
! First Nation<br />
!<br />
!<br />
Winter Roads<br />
Mishkeegogamang<br />
First Railroads Nation<br />
Area of Undertaking (AOU)<br />
88°W<br />
Nibinamik<br />
First Nation<br />
87°W<br />
86°W<br />
! Neskantaga<br />
!<br />
First Nation<br />
! Eabametoong<br />
!<br />
First Nation<br />
85°W<br />
Marten Falls<br />
First Nation<br />
84°W<br />
83°W<br />
82°W<br />
Attawapiskat<br />
First Nation<br />
!<br />
81°W<br />
Kashechewan<br />
First Nation<br />
Fort Albany<br />
First Nation<br />
Moose Factory<br />
First Nation<br />
! !<br />
80°W<br />
Moose Cree<br />
First Nation<br />
79°W<br />
51°N<br />
52°N<br />
53°N<br />
51°N<br />
52°N<br />
53°N<br />
!<br />
Aroland<br />
First Nation<br />
#*<br />
!<br />
Constance Lake<br />
First Nation<br />
#*#*#*<br />
49°N<br />
50°N<br />
49°N<br />
50°N<br />
James Bay<br />
Albany River<br />
! First Nation Communities<br />
#* Generating Stations<br />
Utility Lines<br />
Roads<br />
Victor<br />
Diamond Mine<br />
Manitoba<br />
ONTARIO<br />
U.S.A.<br />
Hudson<br />
Bay<br />
Quebec<br />
Moose River<br />
Study Area<br />
Operating Mine<br />
Mining Claims in Study Area<br />
First Nation Reservations<br />
Protected Areas<br />
Sustainable Forest License (SFL)<br />
Big Pic Forest<br />
Gordon Cosens Forest<br />
Hearst Forest<br />
Kenogami Forest<br />
Nagagami Forest<br />
National Ecozones<br />
Boreal Shield<br />
Hudson Plains<br />
0 50 100<br />
Kilometers<br />
89°W 88°W 87°W 86°W 85°W 84°W 83°W 82°W 81°W 80°W<br />
A Fork in the Road: Future Development in Ontario’s Far North<br />
9
3.2 Ecological Processes<br />
3.2.1 Succession<br />
Simulation of timber harvest required that growth and yield curves<br />
be defined for merchantable forest types. Growth and yield curves<br />
were based on those used by Hearst Forest Management Inc. (2007a)<br />
in their strategic forest management model. Curves for the dominant<br />
forest unit belonging to each of the mixed conifer upland, mixed<br />
conifer lowland, mixedwood, and hardwood forest types in the SFL<br />
were used (Table 3). Distribution of available land belonging to each<br />
provincial forest type across forest units in the Hearst Forest is listed<br />
below (Hearst Forest Management Inc. 2007b). The forest unit<br />
whose growth and yield curve was used for each provincial forest<br />
type is identified in italics.<br />
• Mixed conifer upland: spruce pine (75%); spruce fir (16%); and<br />
jack pine (9%)<br />
• Mixed conifer lowland: spruce 1 (59%); spruce site class 3<br />
(31%); and lowland conifer (11%)<br />
• Mixedwood: mixedwood 2 (93%); and mixedwood 1 (7%).<br />
• Intolerant hardwood: poplar 1 (73%); and poplar 3 (27%)<br />
Based on Hearst Forest Management Inc. (2007a), forest reaching<br />
the final age class remained in that age class until disturbed by harvest<br />
or fire.<br />
14<br />
One million ha of the 1.9 million<br />
ha Moose River FMU is non-forest,<br />
and assumed to be peatland<br />
(i.e., bog). The composition of<br />
the 0.9 million ha of forest is<br />
estimated to be 85% lowland<br />
black spruce, 14% upland mixed<br />
conifer, and 1% poplar-, white<br />
birch-, or jack pine-dominated forest.<br />
Applying fire return intervals<br />
from Table 4 to this landscape<br />
composition results in an average<br />
fire return interval of 248 years.<br />
3.2.2 Fire<br />
Fire was simulated at rates assumed by Tembec (2008) for the<br />
Gordon Cosens Forest (Table 4). The natural fire rate assumed by<br />
Tembec (2008) is consistent with a fire return interval estimate of<br />
263 years for a large landscape (Moose River Forest Management<br />
Unit (FMU)) located in the James Bay Lowland ecoregion, north<br />
of the allocation limit (Ter-Mikaelian et al. 2009) 14 . In contrast,<br />
pre-suppression fire rates assumed for the Hearst Forest (Hearst<br />
Forest Management Inc. 2007a), based on fire rates from the more<br />
southerly Lake Abitibi Model Forest, are substantially higher than<br />
Ter-Mikaelian et al. (2009) and were not used here. Fire suppression<br />
was applied to forests in the AOU. Suppression is assumed, by<br />
Tembec (2008), to extend the fire cycle to over seven thousand years<br />
for all forest types. As such, fire is assumed to be negligible in the<br />
managed portion of the landscape; i.e., timber harvest was the only<br />
disturbance type affecting merchantable forest within SFLs during<br />
the simulation. Suppression was not incorporated for areas north<br />
of the SFL’s because fire rates north of the allocation limit do not<br />
appear to be affected by suppression (Ter-Mikaelian et al. 2009).<br />
10 Canadian Boreal Initiative | Wildlife Conservation Society <strong>Canada</strong>
Table 3. Softwood (SW) and hardwood (HW) growth and yield curves for each forest type. Softwood includes pine, spruce, and fir<br />
volume. Hardwood includes poplar volume. Growth and yield curves are those associated with the pre-harvest forest 12 .<br />
Age class<br />
(years)<br />
Conifer upland (m 3 /ha) Conifer lowland (m 3 /ha) Mixedwood (m 3 /ha) Intolerant hardwood<br />
(m 3 /ha)<br />
SW HW SW HW SW HW SW HW<br />
0-20 0.0 0.0 0.0 0.0 0.0 0.0 0.0 0.0<br />
21-40 10.0 7.0 0.0 0.0 0.5 20.5 0.5 39.0<br />
41-60 56.0 15.0 3.0 0.0 2.5 53.0 1.5 102.5<br />
61-80 98.8 21.0 33.4 1.0 18.5 74.5 8.5 143.0<br />
81-100 132.0 23.5 75.8 2.0 37.5 82.0 17.5 155.0<br />
101-120 152.4 21.0 106.9 2.0 52.4 73.0 22.0 136.0<br />
121-140 153.5 5.5 116.6 2.0 58.0 19.5 20.0 35.0<br />
141-160 129.8 0.0 102.6 2.0 59.3 19.5 18.5 35.0<br />
161-180 99.6 0.0 89.0 2.0 60.4 19.5 16.5 35.0<br />
>180 74.4 0.0 78.5 2.0 58.7 19.5 13 15.5 35.0 13<br />
Table 4. Fire return intervals, based on average rates across relevant forest units from Tembec (2008).<br />
Cover type<br />
Pre-suppression fire cycle in years (and<br />
associated annual burn rate)<br />
Post-suppression fire cycle in years<br />
(and associated annual burn rate)<br />
Upland conifer 128 (0.0078125) 7,192 (0.000139)<br />
Lowland conifer, coniferous 203 (0.0049261) 7,192 (0.000139)<br />
Mixedwood 134 (0.0074627) 7,192 (0.000139)<br />
Hardwood 115 (0.0086957) 7,192 (0.000139)<br />
Bog, shrub, herbaceous 300 (0.0033333) 7,192 (0.000139)<br />
12<br />
Multiple sets of growth and yield curves (i.e., for a range of silvicultural intensities) were not used to avoid unnecessary complexity.<br />
The 50-year simulation period combined with the large area of pre-harvest forest remaining in the SFLs implies that most if not all of<br />
the simulated harvest will be first-rotation, such that variation in post-harvest growth and yield (i.e., with silvicultural treatment) would<br />
not affect simulation outcomes.<br />
13<br />
The deciduous volume associated with older than 180 year mixedwood and hardwood forest types was increased from 0 to that of the<br />
161-180 age-class to avoid old forest being excluded from harvest.<br />
A Fork in the Road: Future Development in Ontario’s Far North<br />
11
3.3 Land Use<br />
3.3.1 Hydroelectric Sector<br />
The hydroelectric scenario was informed by the Integrated Power<br />
System Plan (IPSP), the Ontario Power Authority’s long-term (2005-<br />
2025 year) electricity plan, as well as Ontario’s Long Term Energy<br />
Plan (Ministry of Energy 2010). The IPSP calls for increasing the<br />
province’s hydroelectric generation capacity by 2,900 MW. The<br />
majority (2,500 MW) of the increase in capacity is planned for<br />
northeastern Ontario, with a smaller (300 MW) increase planned for<br />
the northwest (OPA 2007).<br />
OPA (2007) identifies the location and approximate in-service dates<br />
for new hydroelectric generation sites that could collectively achieve<br />
the goal of increasing generation capacity by 2,900 MW. Included<br />
in the list are ten new hydroelectric projects in the study area with a<br />
total capacity of 1,585 MW (Table 5).<br />
Table 5. Planned hydroelectric sites in the study area for the period of 2010 to 2025.<br />
Source: OPA 2007: tables 27, 28, 31.<br />
River Site Capacity (MW) In-Service<br />
Mattagami River Grand Rapids 174 2016<br />
Opasatika River Opasatika Rapids 3 2017<br />
Opasatika River Breakneck Falls 4 2017<br />
Opasatika River Christopher Rapids 7 2017<br />
Abitibi River Sand Rapids 131 2019<br />
Albany River Hat Island 490 2020<br />
Abitibi River Blacksmith Rapids 140 2021<br />
Abitibi River Allen Rapids 131 2022<br />
Albany River Chard 370 2022<br />
Moose River Renison 135 2025<br />
15<br />
The IPSP projects hydroelectric<br />
developments in northern Ontario<br />
will add 2800 MW of capacity<br />
between 2005 and 2025, resulting<br />
in an average rate of increase<br />
of 140 MW/year.<br />
These planned hydroelectric projects were the basis for the first 15<br />
years (i.e., 2011-2025) of the hydroelectric scenario (Figure 3). The<br />
assumed rate of hydroelectric development in northern Ontario from<br />
2026-2061 approximated the rate projected for the region from<br />
2005-2025 by the IPSP (average rate of increase of 140 MW/year 15 ).<br />
Applied to the period of 2026-2061, this rate creates increased<br />
capacity of 4,900 MW. Of this, 1,250 MW are likely to come from<br />
the developments along the Nelson River in northeastern Manitoba,<br />
and an additional 800 MW may come from developments in northwestern<br />
Ontario (Appendix 2 from OPA 2006). As such, a plausible<br />
projection for the increase in capacity from northeastern Ontario<br />
during the 2026-2061 period is 2850 MW. OPA (2005) identifies<br />
12 Canadian Boreal Initiative | Wildlife Conservation Society <strong>Canada</strong>
seven potential (as opposed to planned) hydroelectric sites within the<br />
study area with a collective capacity of 1762 MW (Table 6), which<br />
is within the 2,850 MW projection described previously. These sites<br />
were used to define the hydroelectric development trajectory during<br />
the 2026-2061 period (Figure 3). Simulated development initially<br />
focused on rivers that were partially developed during the 2010-<br />
2025 period (Albany River, Moose River), followed by a site on the<br />
Attawapiskat River.<br />
Table 6. Potential hydroelectric sites in the study area, to be developed between 2026<br />
and 2061 in the scenario analysis. The constraints refer to policies including First Nation<br />
Agreements (A) (e.g., Northern Rivers Commitment 16 and Moose River Basin Commitment)<br />
and protected areas (P) that would need to be considered prior to development.<br />
Source: OPA 2005, Appendix 1.<br />
River Site Potential<br />
(MW)<br />
Connection<br />
Distance (km)<br />
Constraint<br />
Albany River Buffaloskin 76 >25 A<br />
Albany River Wabimeig Creek 185 >25 A<br />
Albany River Stooping 285 >25 A<br />
Albany River Biglow 480 >25 A<br />
Albany River Blackbear Island 490 >25 A<br />
Moose River Grey Goose 140.4 5-25 P, A<br />
Attawapiskat Streatfield IV 105.76 >25 A<br />
Reservoirs associated with dams having a capacity greater than 25<br />
MW were simulated to be 274 ha, which is the average size of the<br />
three reservoirs that currently exist within the study area (Smoky<br />
Falls, Harmon, and Kipling). Reservoirs less than 25 MW were<br />
assumed to be run-of-river 17 , and therefore associated with small<br />
reservoirs (1 ha). Transmission lines and roads were created to link<br />
all dams to the transmission network. Transmission capacity is the<br />
largest impediment to developing hydroelectric sites in northern<br />
Ontario (OPA 2006). The IPSP (OPA 2006) identifies new transmission<br />
corridors that will be needed to transport electricity from the<br />
proposed hydroelectric sites to market. These corridors were used to<br />
define the rate and location of transmission corridor growth for the<br />
first 15 years of the hydroelectric scenario (Figure 4). Transmission<br />
corridors were 40 m in width (Hearst Forest Management Inc.<br />
2007a, Table 1). A 500 kV line already exists to transmit power<br />
from existing hydroelectric developments in the Moose River Basin<br />
to Sudbury. The planned hydroelectric developments in the basin<br />
will require construction of a second 500 kV line spanning 550 km<br />
between Sudbury and the Moose River Basin. The line is planned<br />
for 2016-2019. It was assumed that the simulated dam along the<br />
Attawapiskat would also tie in to this line. Development of up to<br />
16<br />
This commitment sets out that<br />
there will be no development<br />
greater than 25 MW in the basins<br />
of the Albany, Attawapiskat and<br />
Winisk Rivers; development less<br />
that 25 MW can proceed if it is<br />
proposed by the local indigenous<br />
community or communities and/<br />
or their partner(s). This commitment<br />
was made by a Minister of<br />
the Crown in response to community<br />
concerns about the potential<br />
for extensive flooding associated<br />
with hydroelectric development.<br />
In the interest of treating all the<br />
northern rivers in a consistent<br />
manner, the Severn River was<br />
added to this commitment at the<br />
time the Waterpower Site Release<br />
and Development Review policy<br />
was approved in 2004.<br />
17 Small hydroelectric facilities,<br />
which are typically run-of-river,<br />
are generally classified as having<br />
a maximum capacity of 10 MW<br />
but can refer to projects with<br />
a capacity of between 20 and<br />
25 MW in <strong>Canada</strong> (http://www.<br />
pembina.org/re/sources/hydropower).<br />
A Fork in the Road: Future Development in Ontario’s Far North<br />
13
!<br />
Figure 3. Current, planned, and potential hydroelectric sites used in scenario development.<br />
89°W 88°W 87°W 86°W 85°W 84°W 83°W 82°W 81°W 80°W<br />
!<br />
Wapekeka<br />
First Nation<br />
!<br />
!<br />
Wawakapewin<br />
First Nation<br />
!<br />
Wunnumin Lake<br />
! Webequie<br />
Attawapiskat River<br />
! First Nation<br />
First Nation<br />
!<br />
!<br />
Nibinamik<br />
First Nation<br />
#*<br />
Attawapiskat<br />
First Nation<br />
! Neskantaga<br />
!<br />
First Nation<br />
!<br />
Eabametoong<br />
First Nation<br />
!<br />
Marten Falls<br />
First Nation<br />
Aroland<br />
First Nation<br />
#* #*<br />
! #*<br />
#* #*<br />
#*<br />
!<br />
Constance Lake<br />
First Nation<br />
#*<br />
#* #* #*#*#*<br />
#*<br />
#*<br />
#*<br />
!<br />
Kashechewan<br />
First Nation<br />
Fort Albany<br />
First Nation<br />
#*<br />
#*<br />
#*#*<br />
#*<br />
! ! Moose Cree<br />
First Nation<br />
89°W<br />
88°W<br />
87°W<br />
86°W<br />
85°W<br />
84°W<br />
83°W<br />
82°W<br />
81°W<br />
80°W<br />
79°W<br />
50°N<br />
51°N<br />
52°N<br />
53°N<br />
50°N<br />
51°N<br />
52°N<br />
53°N<br />
Manitoba<br />
ONTARIO<br />
Hudson<br />
Bay<br />
U.S.A.<br />
James Bay<br />
Quebec<br />
Albany River<br />
Moose River<br />
! First Nation Communities<br />
#* Generating Stations<br />
Integrated Power System<br />
Plan (IPSP) Sites<br />
#*<br />
#*<br />
2010 to 2025 - Planned<br />
2026 to 2061 - Potential<br />
Area of Undertaking (AOU)<br />
Study Area<br />
First Nation Reservations<br />
Protected Areas<br />
Waterpower Policy Areas<br />
General Area<br />
Moose River Basin Policy Area<br />
Northern Rivers Policy Area<br />
0 50 100<br />
Kilometers<br />
14 Canadian Boreal Initiative | Wildlife Conservation Society <strong>Canada</strong>
!<br />
!<br />
!<br />
!<br />
!<br />
!<br />
!<br />
!<br />
!<br />
!<br />
!<br />
!<br />
!<br />
!!<br />
!<br />
!<br />
!<br />
!<br />
!<br />
!<br />
!<br />
!<br />
!<br />
!<br />
!<br />
!!<br />
!<br />
!<br />
!<br />
!<br />
!<br />
!<br />
!<br />
!!!<br />
!<br />
!<br />
!<br />
!<br />
!<br />
!<br />
!<br />
!<br />
!<br />
!<br />
!<br />
! !<br />
Figure 4. Future dams and transmission lines used in scenario development.<br />
!<br />
!<br />
!<br />
!<br />
!<br />
!<br />
!<br />
!<br />
!<br />
!<br />
! !<br />
!<br />
!<br />
!<br />
!<br />
! !<br />
!<br />
! !<br />
!<br />
!<br />
!<br />
!<br />
!<br />
!<br />
!<br />
!<br />
!<br />
!<br />
!<br />
!<br />
!<br />
!<br />
!<br />
!<br />
!<br />
!<br />
!<br />
!<br />
!<br />
!<br />
!<br />
!<br />
!<br />
!<br />
!<br />
!<br />
!<br />
!<br />
! !<br />
! !!<br />
!<br />
!<br />
!<br />
!<br />
!<br />
!<br />
!<br />
!<br />
!<br />
!<br />
!<br />
!<br />
!<br />
!<br />
! !<br />
!<br />
!<br />
!<br />
!<br />
!<br />
!<br />
!<br />
!<br />
!<br />
! !<br />
!<br />
! ! !<br />
! !<br />
!<br />
!<br />
!<br />
!<br />
!<br />
!<br />
!<br />
!<br />
!<br />
!<br />
!<br />
!<br />
!<br />
!!<br />
!<br />
!<br />
!<br />
!<br />
!<br />
! !<br />
!<br />
!<br />
! !<br />
!<br />
!<br />
!<br />
!<br />
!<br />
! ! ! ! ! !<br />
! !<br />
!<br />
!<br />
! ! ! !<br />
!<br />
!<br />
!<br />
!!<br />
!<br />
!<br />
! !<br />
!<br />
!<br />
!<br />
!<br />
!<br />
!<br />
!<br />
!<br />
!<br />
!<br />
!<br />
!<br />
!<br />
!<br />
!<br />
!<br />
!<br />
!<br />
!<br />
!<br />
!<br />
!<br />
!<br />
!<br />
!<br />
!<br />
!<br />
!<br />
!<br />
!<br />
!<br />
!<br />
!<br />
!<br />
!<br />
!! !!<br />
!<br />
!<br />
!<br />
!!<br />
!<br />
!<br />
!<br />
!<br />
!<br />
!<br />
!!!<br />
!<br />
!<br />
!<br />
! !<br />
!<br />
! !!<br />
!<br />
!<br />
!<br />
!<br />
!<br />
!<br />
!<br />
!<br />
!<br />
!<br />
!!!!<br />
!<br />
! !<br />
!<br />
!<br />
!<br />
!<br />
!<br />
!!<br />
!<br />
!<br />
!<br />
! ! !<br />
! !<br />
!<br />
!<br />
!<br />
!<br />
!<br />
!<br />
!<br />
!<br />
!<br />
!<br />
!<br />
!<br />
!<br />
!<br />
!<br />
!<br />
!<br />
! !<br />
!<br />
!<br />
! !<br />
!<br />
!<br />
!<br />
!<br />
!<br />
!<br />
89°W<br />
Wapekeka<br />
First Nation<br />
!<br />
Wawakapewin<br />
First Nation<br />
88°W<br />
87°W<br />
86°W<br />
85°W<br />
84°W<br />
83°W<br />
82°W<br />
81°W<br />
80°W<br />
79°W<br />
!<br />
Wunnumin Lake<br />
! Webequie<br />
Attawapiskat River<br />
! First Nation<br />
First Nation<br />
!<br />
!<br />
Nibinamik<br />
First Nation<br />
! Neskantaga<br />
!<br />
First Nation<br />
!<br />
Eabametoong<br />
First Nation<br />
!<br />
Marten Falls<br />
First Nation<br />
Attawapiskat<br />
First Nation<br />
!<br />
Kashechewan<br />
First Nation<br />
Fort Albany<br />
First Nation<br />
!<br />
Aroland<br />
First Nation<br />
!<br />
! ! Moose Cree<br />
First Nation<br />
50°N<br />
51°N<br />
52°N<br />
53°N<br />
50°N<br />
51°N<br />
52°N<br />
53°N<br />
Manitoba<br />
ONTARIO<br />
Hudson<br />
Bay<br />
Quebec<br />
U.S.A.<br />
James Bay<br />
Albany River<br />
Moose River<br />
! First Nation Communities<br />
89°W<br />
Future Dams<br />
Future Transmission Lines<br />
! ! Existing Transmission Lines<br />
Area of Undertaking (AOU)<br />
Study Area<br />
First Nation Reservations<br />
Protected Areas<br />
Waterpower Policy Areas<br />
General Area<br />
Moose River Basin Policy Area<br />
Northern Rivers Policy Area<br />
0 50 100<br />
Kilometers<br />
88°W<br />
87°W<br />
86°W<br />
85°W<br />
Constance Lake<br />
First Nation<br />
84°W<br />
83°W<br />
82°W<br />
81°W<br />
80°W<br />
!<br />
!<br />
!<br />
!<br />
!<br />
!<br />
!<br />
!<br />
!<br />
!<br />
A Fork in the Road: Future Development in Ontario’s Far North<br />
15<br />
!<br />
!
2,000 MW of hydropower potential in the Albany River Basin will<br />
require construction of a High Voltage Direct Current (HVDC) line<br />
either to Sudbury (650 km) or the Greater Toronto Area (1,075 km);<br />
it was assumed to link to Sudbury in the simulation. The line is<br />
planned for post-2020. The simulation included an additional line<br />
in the west to tie in three simulated dams located along the Albany<br />
River that are likely too distant to tie in to the Sudbury line; the<br />
line could continue southwest beyond the study area boundary to<br />
link with existing or proposed transmission lines, such as the NW<br />
transmission line for the proposed Little Jackfish River hydroelectric<br />
development 18 .<br />
18<br />
http://www.hydroone.com/Projects/Northwest/Pages/Default.<br />
aspx<br />
19<br />
http://news.gc.ca/web/articleeng.do?nid=747149<br />
20<br />
http://www.metalexventures.<br />
com/2012-01-20.pdf<br />
21<br />
http://www.metalexventures.<br />
com/html/attawapiskat.html<br />
22<br />
http://www.geologyontario.<br />
mndmf.gov.on.ca/mndmaccess/<br />
mndm_dir.asp?type=pub&id=mdi<br />
23 http://www.mndm.gov.on.ca/<br />
en/mines-and-minerals/applications/claimaps<br />
3.3.2 Mining Sector<br />
Mining activity in the study area includes: an active diamond mine<br />
(Victor Diamond Mine) and its recently announced expansion 19 ;<br />
advanced exploration of kimberlite deposits 20 ; and exploration of<br />
chromite, diamond, copper and nickel deposits in the Ring of Fire<br />
where two proposed mines are undergoing environmental assessment<br />
by the federal and provincial governments (Figure 5). The<br />
Victor Diamond Mine began commercial production in 2008 and<br />
is expected to have an active lifespan of 12 years with an average<br />
production rate of 2.5 million tonnes/year (Government of <strong>Canada</strong><br />
2005). The Victor Diamond Mine is located at one of 16 known<br />
kimberlite pipes in the region that contain diamonds 21 . In addition,<br />
De Beers <strong>Canada</strong> Incorporated is proposing the construction, operation<br />
and decommissioning of a second pit and additional ancillary<br />
components, approximately 6.5 km northwest of the existing Victor<br />
Diamond Mine with an expected production capacity of just over<br />
9,000 tonnes per day and a mine life of roughly seven years. As a<br />
basecase assumption, we assumed that new mines will be brought<br />
online such that there will always be one diamond mine in operation<br />
with a lifespan equivalent to that of Victor (12 years). Ten potential<br />
mine sites were identified for the scenario, five in the Ring of Fire<br />
region and five in the vicinity of the Victor Mine (Dickason 2009).<br />
During the simulation, the ten potential mine sites were sequenced<br />
randomly to “develop” five kimberlite mines in our scenario. The<br />
location of the Ring of Fire mine sites were based on Dickson<br />
(2009), whereas the location of additional mine sites near Victor was<br />
based on commodity claims (according to the Ministry of Northern<br />
Development and Mines’ (MNDM) Mineral Deposit Inventory<br />
(MDI) (2013) 22 and Mining Claims (2012) 23 databases) (Figure 6).<br />
16 Canadian Boreal Initiative | Wildlife Conservation Society <strong>Canada</strong>
!<br />
Figure 5. Active mines, mineral occurrences, and mining claims in the study area.<br />
89°W 88°W 87°W 86°W 85°W 84°W 83°W 82°W 81°W 80°W 79°W<br />
!<br />
Wapekeka<br />
First Nation<br />
!<br />
!<br />
Wawakapewin<br />
First Nation<br />
!<br />
Wunnumin Lake<br />
! Webequie<br />
Attawapiskat River<br />
! First Nation<br />
First Nation<br />
!<br />
!<br />
Nibinamik<br />
First Nation<br />
! Neskantaga<br />
!<br />
First Nation<br />
! Eabametoong<br />
!<br />
First Nation<br />
Marten Falls<br />
First Nation<br />
Attawapiskat<br />
First Nation<br />
!<br />
Kashechewan<br />
First Nation<br />
Fort Albany<br />
First Nation<br />
!<br />
Aroland<br />
First Nation<br />
!<br />
Constance Lake<br />
First Nation<br />
! ! Moose Cree<br />
First Nation<br />
50°N<br />
51°N<br />
52°N<br />
53°N<br />
50°N<br />
51°N<br />
52°N<br />
53°N<br />
Ring of Fire<br />
Manitoba<br />
ONTARIO<br />
Hudson<br />
Bay<br />
Quebec<br />
Victor<br />
Diamond Mine<br />
James Bay<br />
Albany River<br />
! First Nation Communities<br />
U.S.A.<br />
Area of Undertaking (AOU)<br />
Moose River<br />
Study Area<br />
Kimberlite Deposits for<br />
Future Mine Scenario<br />
Chromite Deposits for<br />
Future Mine Scenario<br />
Massive Sulphide Deposits<br />
for Future Mine Scenario<br />
Mining Claims in Study<br />
Area (2,965 claims)<br />
First Nation Reservations<br />
Protected Areas<br />
National Ecozones<br />
Boreal Shield<br />
Hudson Plains<br />
0 50 100<br />
Kilometers<br />
89°W<br />
88°W<br />
87°W<br />
86°W<br />
85°W<br />
84°W<br />
83°W<br />
82°W<br />
81°W<br />
80°W<br />
A Fork in the Road: Future Development in Ontario’s Far North<br />
17
Figure 6. Kimberlite deposits used in the scenario.<br />
87°W<br />
! Webequie<br />
First Nation<br />
87°W<br />
86°W<br />
86°W<br />
85°W<br />
85°W<br />
84°W<br />
84°W<br />
52°N<br />
53°N<br />
53°N<br />
Ring of<br />
Fire<br />
! First Nation Communities<br />
Kimberlite Deposits for Future<br />
Mine Scenario<br />
Mining Claims in Study Area<br />
Study Area<br />
First Nation Reservations<br />
Protected Areas<br />
National Ecozones<br />
Boreal Shield<br />
Hudson Plains<br />
0 25 50<br />
Kilometers<br />
Attawapiskat River<br />
Missisa<br />
Lake<br />
Manitoba<br />
Hudson<br />
Bay<br />
ONTARIO<br />
U.S.A.<br />
Victor<br />
Diamond Mine<br />
Quebec<br />
18 Canadian Boreal Initiative | Wildlife Conservation Society <strong>Canada</strong>
The Ring of Fire is thought to contain one of the largest chromite<br />
deposits in the world, as well as significant deposits of nickel, copper,<br />
and platinum. The two largest chromite deposits discovered to date<br />
are Black Thor (69.5 Mt; Cliffs Natural Resources Inc. 2011) and<br />
Big Daddy (39 Mt; KWG Resources Inc. 2011). Production from<br />
Black Thor is expected to begin in 2015 and last approximately 30<br />
years (Cliffs Natural Resources Inc. 2011). The mine and an onsite<br />
ore processing facility is expected to produce approximately 2 million<br />
tonnes of ore and concentrate per year 24 . We assumed that<br />
production at the Big Daddy mine will commence upon closure of<br />
the Black Thor mine, and that production will continue at 2 million<br />
tonnes per year, resulting in a lifespan of approximately 20 years.<br />
We assumed a third chromite deposit in the Ring of Fire will be<br />
developed upon closure of the Big Daddy mine (Figure 7).<br />
The assumption that mine development will proceed sequentially<br />
and that production will not exceed 2 million tonnes per year may<br />
be conservative, given that a railway line has been proposed to transport<br />
ore from the Ring of Fire to Nakina. However, information on<br />
start-up dates is only available for the Black Thor mine (2015; Cliffs<br />
Natural Resources Inc. 2011), and some think that the Big Daddy<br />
deposit may sit idle for decades if Black Thor is developed first<br />
(Tollinsky 2010). The viability of these projects depends primarily<br />
on providing all-weather access to deposits from processing facilities<br />
and national and international markets. The general consensus<br />
on mineral exploration and mine development in the Ring of Fire<br />
is that the creation of all-weather infrastructure, such as roads and<br />
transmission corridors, will open up previously inaccessible regions<br />
to more development beyond the two mines currently identified in<br />
our scenario. It is highly likely that the development of all-weather<br />
infrastructure will precipitate further mineral exploration and<br />
development in the region, increasing the risk of cumulative effects.<br />
Well-planned and managed infrastructure is considered a critical<br />
component of environmental planning (e.g., land use, environmental<br />
assessment) for the Far North (Far North Science Advisory Panel<br />
2010 25 ).<br />
The scenario also included nickel/copper mining in the Ring of<br />
Fire. Based on discoveries at their Eagle’s Nest deposits, Noront<br />
Resources plans to finish construction of a mine by 2015 (Knight<br />
Piesold 2011). The nickel/copper mining trajectory was based on<br />
the Eagle’s Nest project description, which predicts production of<br />
11 million tonnes over 11 years (Knight Piesold 2011). Numerous<br />
additional massive sulphide discoveries exist within the Ring of<br />
24<br />
Cliffs Natural Resources Inc.<br />
(2011) expects that ore and<br />
concentrate production will be<br />
3,600 to 7,200 tonnes per day.<br />
Using the average production rate<br />
from this range (5,400 tonne per<br />
day) and a 365-day year results<br />
in an annual production rate of<br />
1,971,000 tonnes.<br />
25<br />
The Far North Science Advisory<br />
Panel Report suggested that the<br />
most important issue is the cascading<br />
and incremental effects<br />
of roads. Once a road is built, to<br />
serve a single purpose or development<br />
project, it opens up the<br />
potential for further development,<br />
and creates pressure to build<br />
more road networks and power<br />
transmission lines.<br />
A Fork in the Road: Future Development in Ontario’s Far North<br />
19
Figure 7. Chromite deposits used in the scenario.<br />
87°W<br />
! Webequie<br />
First Nation<br />
87°W<br />
86°W<br />
86°W<br />
85°W<br />
85°W<br />
84°W<br />
84°W<br />
52°N<br />
53°N<br />
53°N<br />
! First Nation Communities<br />
Chromite Deposits for Future<br />
Mine Scenario<br />
Mining Claims in Study Area<br />
Study Area<br />
First Nation Reservations<br />
Protected Areas<br />
National Ecozones<br />
Boreal Shield<br />
Hudson Plains<br />
0 25 50<br />
Kilometers<br />
Ring of<br />
Fire<br />
Cliff's Chromite Project<br />
(Black Thor and<br />
Big Daddy Deposits)<br />
Attawapiskat River<br />
Missisa<br />
Lake<br />
Manitoba<br />
Hudson<br />
Bay<br />
ONTARIO<br />
U.S.A.<br />
Victor<br />
Diamond Mine<br />
Quebec<br />
20 Canadian Boreal Initiative | Wildlife Conservation Society <strong>Canada</strong>
Fire, and it was assumed that one nickel/copper mine equal in size<br />
to Eagle’s Nest was always in production during the simulation<br />
(Figure 8). This assumption may be conservative given the number<br />
of discoveries in the region and the intensity of ongoing exploration.<br />
For example, the CEO of one mining company that is active in the<br />
region expects 50 mines to be found in the region (Tollinsky 2010).<br />
Eight additional potential nickel/copper mines were located based on<br />
massive sulphide discoveries (Dickson 2009) and commodity claims<br />
(referenced with MDI and Mining Claims (2012) databases). The<br />
sequencing of the deposits for development, following Eagle’s Nest,<br />
was random.<br />
The size of a mine’s footprint was based on the claim footprints<br />
and description of mine sites in project descriptions associated<br />
with environmental assessment documentation, cross-referenced<br />
with the MDI and mining claims datasets managed by MNDM.<br />
Transmission lines, roads, and a railway were created to link to<br />
mines, energy sources, and the provincial transportation network.<br />
A single transportation corridor linking the Ring of Fire to southern<br />
infrastructure was based on the proposed north-south transportation<br />
corridor to the Big Daddy mine 26 . The corridor was simulated<br />
as being 100 m wide, as per the environmental assessment, and was<br />
assumed to include both a road and transmission line. A railway<br />
parallel to the transportation corridor was also simulated. Potential<br />
future diamond mines in the eastern portion of the study area were<br />
assumed to be serviced by the existing transmission line and road<br />
linking the Victor Diamond Mine to Attawapiskat and then south<br />
along the winter roads used by First Nation communities along the<br />
James Bay coast. Roads and transmission lines linking potential<br />
future mines to infrastructure were based on shortest distance (i.e.,<br />
straight line), such that the footprint estimate was conservative. The<br />
width of simulated roads, transmission lines, and railways were 24<br />
m, 40 m, and 20 m, respectively, based on assumptions used in previous<br />
ALCES analyses (e.g., ALCES Group 2011).<br />
3.3.3 Forestry Sector<br />
The study area overlaps with portions of five SFLs: Kenogami Forest,<br />
Hearst Forest, Gordon Cosens Forest, Big Pic Forest, and Nagagami<br />
Forest (Figure 9). The simulated timber harvest rate was based on<br />
annual allowable cuts (AACs) of the SFLs. The AAC’s were adjusted<br />
based on the proportion of each SFL’s productive forest area occurring<br />
within the study area (Table 7).<br />
The size of a mine’s<br />
footprint was based<br />
on the claim footprints<br />
and description of<br />
mine sites in project<br />
descriptions associated<br />
with environmental<br />
assessment<br />
documentation, crossreferenced<br />
with the<br />
MDI and mining claims<br />
datasets managed by<br />
MNDM. Transmission<br />
lines, roads, and a railway<br />
were created to link to<br />
mines, energy sources,<br />
and the provincial<br />
transportation network.<br />
26<br />
http://www.cliffsnaturalresources.com/EN/aboutus/GlobalOperations/chromite/Pages/<br />
StakeholderEngagement.aspx<br />
A Fork in the Road: Future Development in Ontario’s Far North<br />
21
Figure 8. Massive sulphide deposits (e.g., nickel/copper) used in the scenario.<br />
87°W<br />
86°W<br />
! Webequie<br />
First Nation<br />
Kilometers<br />
87°W<br />
86°W<br />
85°W<br />
85°W<br />
84°W<br />
84°W<br />
52°N<br />
53°N<br />
53°N<br />
Ring of<br />
Fire<br />
! First Nation Communities<br />
Massive Sulphide Deposits<br />
for Future Mine Scenario<br />
Mining Claims in Study Area<br />
Study Area<br />
Eagle's Nest<br />
Multi-Metal<br />
Mine Project<br />
First Nation Reservations<br />
Protected Areas<br />
National Ecozones<br />
Boreal Shield<br />
Hudson Plains<br />
0 25 50<br />
Attawapiskat River<br />
Missisa<br />
Lake<br />
Manitoba<br />
Hudson<br />
Bay<br />
ONTARIO<br />
U.S.A.<br />
Victor<br />
Diamond Mine<br />
Quebec<br />
22 Canadian Boreal Initiative | Wildlife Conservation Society <strong>Canada</strong>
!<br />
Figure 9. Forestry SFLs overlapping the study area.<br />
90°W<br />
!<br />
!<br />
!<br />
Kingfisher Lake<br />
First Nation<br />
89°W<br />
Wapekeka<br />
First Nation<br />
!<br />
!<br />
Wawakapewin<br />
First Nation<br />
Wunnumin Lake<br />
! Webequie<br />
Attawapiskat River<br />
First Nation<br />
! First Nation<br />
!<br />
!<br />
88°W<br />
Nibinamik<br />
First Nation<br />
87°W<br />
86°W<br />
85°W<br />
84°W<br />
83°W<br />
82°W<br />
Attawapiskat<br />
First Nation<br />
81°W<br />
80°W<br />
79°W<br />
!<br />
Mishkeegogamang<br />
First Nation<br />
! Neskantaga<br />
!<br />
First Nation<br />
! Eabametoong<br />
!<br />
First Nation<br />
!<br />
Aroland<br />
First Nation<br />
Marten Falls<br />
First Nation<br />
!<br />
Kashechewan<br />
First Nation<br />
Fort Albany<br />
First Nation<br />
Moose Factory<br />
First Nation<br />
! !<br />
Moose Cree<br />
First Nation<br />
!<br />
Constance Lake<br />
First Nation<br />
49°N<br />
50°N<br />
51°N<br />
52°N<br />
53°N<br />
49°N<br />
50°N<br />
51°N<br />
52°N<br />
53°N<br />
Manitoba<br />
ONTARIO<br />
U.S.A.<br />
Hudson<br />
Bay<br />
Quebec<br />
James Bay<br />
Albany River<br />
Moose River<br />
! First Nation Communities<br />
Area of Undertaking (AOU)<br />
Study Area<br />
First Nation Reservations<br />
Protected Areas<br />
Sustainable Forest License (SFL)<br />
Big Pic Forest<br />
Gordon Cosens Forest<br />
Hearst Forest<br />
Kenogami Forest<br />
Nagagami Forest<br />
National Ecozones<br />
Boreal Shield<br />
Hudson Plains<br />
0 50 100<br />
Kilometers<br />
89°W 88°W 87°W 86°W 85°W 84°W 83°W 82°W 81°W 80°W<br />
A Fork in the Road: Future Development in Ontario’s Far North<br />
23
Table 7. Simulated harvest levels will be based on the AAC’s of the SFL’s within the study area,<br />
adjusted to account for the proportion of each SFL that is within the study area’s boundary 27 .<br />
27<br />
When calculating the percent<br />
of the softwood and hardwood<br />
forest landbase that occurs<br />
within each SFL, deciduous forest<br />
was assumed to contribute to<br />
hardwood landbase and coniferous<br />
forest was considered to<br />
contribute to softwood landbase.<br />
Mixedwood forest was assumed<br />
to contribute 50% to hardwood<br />
and 50% to softwood landbases.<br />
28<br />
Annual allowable cut is from<br />
Table FMP-13 of the Kenogami<br />
Forest 2011-2012 Contingency<br />
Plan (GreenForest Management<br />
Inc. 2010).<br />
29<br />
Annual allowable cut is from page<br />
239 of the FMP (Hearst Forest<br />
Management Inc. 2007).<br />
30<br />
Annual allowable cut is from page<br />
126 of the Gordon Cosens Forest<br />
2010-2012 Contingency Plan<br />
(Tembec 2010).<br />
31<br />
Annual allowable cut is from<br />
Table FMP-13 from the Big Pic<br />
2007-2017 FMP.<br />
32<br />
Annual allowable cut is from page<br />
150 of the Nagagami 2011-2021<br />
FMP (Jackfish River Management<br />
Ltd. 2011).<br />
33<br />
Ninety-two percent of planned<br />
harvest area for the Hearst<br />
Forest area are clearcuts larger<br />
than 520 ha, which approximates<br />
the size of a cell in the spatial<br />
mapping of the scenario analysis<br />
(500 ha). The size of these<br />
clearcuts range from 520 to ><br />
20,000 ha (i.e., from 2 to > 40<br />
cells). To represent this pattern,<br />
approximately 92% of clearcuts<br />
were greater than one cell in size.<br />
The maximum size of a clearcut<br />
was 40 cells. When attempting<br />
to create large clearcuts, Mapper<br />
was constrained by the existing<br />
spatial distribution of forest age.<br />
Kenogami 28<br />
Hearst 29<br />
Gordon Cosens 30<br />
Big Pic 31<br />
Nagagami 32<br />
Total<br />
AAC (m 3 )<br />
Softwood=1,010,781<br />
Hardwood=259,366<br />
Softwood=588,000<br />
Hardwood=232,000<br />
Softwood=1,230,000<br />
Hardwood=428,332<br />
Softwood=918,098<br />
Hardwood=375,525<br />
Softwood=240,000<br />
Hardwood=192,350<br />
% of SFL within study<br />
area<br />
Softwood=49%<br />
Hardwood=28%<br />
Softwood=62%<br />
Hardwood=42%<br />
Softwood=17%<br />
Hardwood=8%<br />
Softwood=33%<br />
Hardwood=28%<br />
Softwood=10%<br />
Hardwood=2%<br />
Table 8. Timber harvest assumptions, based on the Hearst FMP.<br />
Forestry Parameter<br />
Assumption<br />
Adjusted AAC (m 3 )<br />
Softwood=496,330<br />
Hardwood=72,746<br />
Softwood=361,889<br />
Hardwood=97,610<br />
Softwood=208,125<br />
Hardwood=34,158<br />
Softwood=305,976<br />
Hardwood=105,194<br />
Softwood=24,316<br />
Hardwood=4,246<br />
Softwood=1,396,636<br />
Hardwood=313,953<br />
Minimum harvest age 34 Conifer lowland = 100<br />
Conifer upland = 80<br />
Mixedwood = 80<br />
Hardwood = 80<br />
Harvest sequencing 35<br />
Harvest is distributed across available seral stages<br />
relative to the distribution of volume across available<br />
seral stages.<br />
Merchantable structure retention 36 1% across forest types<br />
Riparian residuals 37 Conifer lowland = 1%<br />
Conifer upland = 2%<br />
Mixedwood = 3%<br />
Hardwood = 3%<br />
Table 9. Road development rates estimated from FMPs for SFLs in the study area.<br />
Road development (km/year) AAC (m 3 /year) Road<br />
Primary Branch Total<br />
development<br />
rate (km/m 3 )<br />
Hearst 38 14.17 36.43 50.6 820,000 6.2e-05<br />
Kenogami 11.14 21.1 32.24 1,270,147 2.0e-05<br />
Gorden Cosens 19.4 60.3 79.7 1,658,332 4.7e-05<br />
Weighted average 4.0 e-05<br />
24 Canadian Boreal Initiative | Wildlife Conservation Society <strong>Canada</strong>
As per Hearst Forest Management Inc. (2007a), the scenario analysis<br />
incorporated the combined spruce, pine, and fir harvest (referred<br />
to here as softwood) and the poplar harvest (referred to here as<br />
hardwood). Species contributing only minor volumes to the AAC,<br />
including cedar, larch, and birch were not assessed; demand for these<br />
species was assumed to be met through incidental harvest.<br />
Simulated timber harvest strategies (Table 8), including the cut block<br />
size distribution 33 , reflected the forest management plan for the<br />
Hearst Forest, the largest SFL in the study area.<br />
A network of primary, branch, and operational roads are needed<br />
to access forest for harvest and transport timber to mills. Primary<br />
and branch roads were simulated at a rate of 0.00004 km per m 3<br />
of timber harvest, based on road construction forecasts from the<br />
Hearst, Kenogami, and Gorden Cosens FMPs) (Table 9). Primary<br />
and branch forestry roads were 24 m wide and permanent over the<br />
term of the simulation. Although branch roads are not considered<br />
permanent in FMPs, they are also not necessarily reclaimed. The<br />
Hearst FMP states that future use management of branch roads<br />
is unplanned to maintain flexibility for future operations or use<br />
by other parties; if no future access is required then a road typically<br />
becomes the responsibility of MNR. FMPs in the region do<br />
not identify plans to decommission branch roads, and a FMP for<br />
the Kenogami Forest (Ministry of Natural Resources and Neenah<br />
Paper Company of <strong>Canada</strong> 2005) states that there are no primary<br />
or secondary roads scheduled for abandonment or decommissioning<br />
during the planning period (2005-2025). Further, Hearst Forest<br />
Management Inc. (2007b; page 35) states that no roads or road<br />
networks have been identified as candidates for abandonment.<br />
Operational roads, such as those constructed within cut blocks, are<br />
more transitory. Operational roads were assumed to reclaim with<br />
cut blocks, which may be optimistic given that Ontario wood supply<br />
analyses commonly assume that 2.5-3% of harvest area is lost<br />
to operational roads and landings that do not reclaim (Arborvitae<br />
Environmental Services Ltd. 2004).<br />
34<br />
Minimum harvest ages for Hearst<br />
SFL are higher than for other<br />
SFL’s in the region because the<br />
majority of wood harvested<br />
from the Hearst SFL is for saw<br />
and veneer mills, which require<br />
larger roundwood materials. To<br />
better represent typical minimum<br />
harvest ages in the region, the<br />
average minimum harvest age<br />
from the Hearst and Gordon<br />
Cosens Forest Management<br />
Plans (FMP) was used, rounded<br />
to the nearest 20-year increment<br />
(minimum harvest age in ALCES<br />
is defined in 20-year increments).<br />
No maximum harvest age (or<br />
minimum volume) limit was set<br />
because it is expected that old<br />
degraded low-volume stands<br />
will be harvested (Hearst Forest<br />
Management Inc. 2007a; page<br />
30).<br />
35<br />
The Hearst FMP (Hearst Forest<br />
Management Inc. 2007b) does<br />
not state that forest in older seral<br />
stages is prioritized for harvest.<br />
Therefore, ALCES was instructed<br />
to distribute harvest across<br />
available seral stages relative to<br />
the distribution of volume across<br />
available seral stages.<br />
36<br />
A proportion of volume is left<br />
unharvested in each harvested<br />
stand to emulate interior structure<br />
left following a fire. The<br />
retention level was set at the<br />
level defined in by Hearst Forest<br />
Management Inc. (2007a; page<br />
31) for the primary species in<br />
each forest type.<br />
37<br />
The percent of each forest type<br />
set aside for riparian residuals<br />
is based on assumption used by<br />
Hearst Forest Management Inc.<br />
(2007a; page 291) in their Strategic<br />
Forest Management Model.<br />
38<br />
The Hearst FMP forecasts that<br />
141.7 km of primary roads and<br />
364.3 km of branch roads will<br />
be constructed over 10 years<br />
(Hearst Forest Management Inc.<br />
2007b; page 473).<br />
A Fork in the Road: Future Development in Ontario’s Far North<br />
25
39<br />
http://www.mnr.gov.on.ca/en/<br />
Business/Species/2Column<br />
SubPage/249504.html<br />
40<br />
http://www.mnr.gov.on.ca/en/<br />
Business/Species/2ColumnSub<br />
Page/STDPROD_092934.html<br />
41<br />
According to page 76 of Gordon<br />
Cosens management plan, the<br />
majority (> 90%) of harvest area<br />
exceeds the size of a cell (5 km 2 ).<br />
Forestry was therefore simulated<br />
to harvest all merchantable forest<br />
within a cell. This approach,<br />
combined with the 500 m buffer<br />
around cutblocks, implies that<br />
cells in the management forest<br />
containing forest younger than<br />
40 years will be interpreted as<br />
100% disturbed.<br />
3.4 Ecological Indicators<br />
In addition to forest age and anthropogenic footprint, four indicators<br />
were incorporated to track impacts on wildlife: caribou, wolverine,<br />
moose, and watershed impact. Although the list of potential<br />
indicators was constrained by information availability, the selected<br />
indicators permitted an assessment of some of the key impacts of<br />
land use to wildlife in the region. Mining, hydroelectric development,<br />
and forestry have the potential to impact wildlife through a<br />
variety of mechanisms, including changes to forest age, increased<br />
anthropogenic footprint and associated human access, and various<br />
impacts to aquatic systems such as fragmentation of aquatic habitat,<br />
altered flow regimes, and contaminants (Browne 2007). Caribou<br />
response was assessed due to the species’ sensitivity to forest disturbance<br />
and government commitments to species recovery and<br />
assessing cumulative effects on ranges 39 . Similarly, wolverine was<br />
included due to the species sensitivity to human access that is associated<br />
with anthropogenic footprints as well as provincial direction<br />
to address cumulative effects in Ontario’s recovery strategy for wolverine<br />
(Ontario Wolverine Recovery Team 2011) 40 . Moose are also<br />
negatively affected by human access but, unlike caribou, the species<br />
is positively associated with recently disturbed forest. The lack of<br />
data for freshwater fish in the pilot study area precluded the development<br />
of species-specific fish habitat models (Jenni McDermid, pers.<br />
comm.). As a preliminary assessment, a watershed impact score<br />
was adopted that was developed as part of an assessment of freshwater<br />
fish in the same region (Browne 2007). In addition to being<br />
related to simulated stressors, it is hoped that the indicators will be<br />
useful for conveying land-use consequences to decision-makers and<br />
stakeholders due to their relevance to legislation (e.g., species at risk,<br />
environmental assessment) and First Nations (e.g., moose, water<br />
resources).<br />
3.4.1 Caribou<br />
Caribou response to the simulated landscape transformations<br />
was assessed by applying risk categories developed for the federal<br />
caribou recovery strategy (Environment <strong>Canada</strong> 2012). The risk<br />
categories are based on a relationship between caribou population<br />
parameters and disturbance estimated from a meta-analysis of boreal<br />
caribou population data from across <strong>Canada</strong> (Environment <strong>Canada</strong><br />
2011). Risk categories are assigned to levels of disturbance, where<br />
disturbance refers to anthropogenic footprint (including cutblocks 41 )<br />
buffered by 500 m and areas burned within the past 40 years. When<br />
applying the relationship to maps of future landscape composition,<br />
percent disturbance was calculated within each cell (5 km 2 ) and<br />
26 Canadian Boreal Initiative | Wildlife Conservation Society <strong>Canada</strong>
averaged over the caribou<br />
range to estimate percent<br />
disturbance at the range<br />
scale 42 . Caribou ranges in<br />
the study area include the<br />
Pagwachuan and a portion<br />
of the Far North range.<br />
Far North caribou ranges<br />
were not publicly available<br />
at the time of this analysis,<br />
so this <strong>report</strong> considers<br />
caribou north of the<br />
Pagwachuan herd as part<br />
of the “Far North Herd”<br />
(OMNR 2009, p. 9).<br />
Table 10. Risk categories (Environment <strong>Canada</strong> 2011; Appendix E) applied to assess caribou<br />
response to simulated landscape composition.<br />
Probability of Sustained<br />
Stable or Positive Growth<br />
Likelihood of<br />
Desired Outcome<br />
Disturbance*<br />
Interval<br />
Level of Risk<br />
≥ 90% Very Likely ≤ 10% Very Low<br />
10 to 35% Low<br />
< 60 to ≥ 40% As Likely as Not > 35 to 45% Moderate<br />
< 40 to ≥ 10% Unlikely > 45 to 75% High<br />
< 10% Very Unlikely > 75% Very High<br />
Caribou response to disturbance<br />
was modelled for both the<br />
Pagwachuan range and the<br />
Far North range.<br />
Justina Ray<br />
*Disturbance refers to fires younger than 40 years and anthropogenic disturbances buffered by 500 m.<br />
3.4.2 Wolverine<br />
Wolverines were present in the study area until the 1950s, at which<br />
point the range of this species retracted to the northwest of the<br />
province (Dawson 2001). Since the 1970s, however, the range has<br />
been recovering (Ontario Wolverine Recovery Team in press), and<br />
OMNR and <strong>WCS</strong> have recorded the presence of this species in the<br />
study area in recent surveys (Ray 2012). The response of wolverine<br />
habitat to changes in landscape composition was assessed using a<br />
habitat suitability index (HSI) model. A HSI is a knowledge-based<br />
(as opposed to empirical) model that can incorporate information<br />
from a variety of sources. The wolverine HSI was based on a<br />
literature review (e.g., Ontario’s Wolverine Recovery Team 2011,<br />
Bowman et al. 2010, Dawson et al. 2010, Jokinen 2004) and expert<br />
opinion (Justina Ray, pers. comm.). The HSI model combined<br />
information related to habitat availability and quality to calculate an<br />
index that ranged from 0 to 1. Steps required to calculate the index<br />
are summarized below.<br />
42<br />
Disturbance buffers were assumed<br />
to be non-overlapping<br />
within the scale of a single cell<br />
(i.e., 5 km 2 ). This may exaggerate<br />
disturbance if footprint distribution<br />
is highly aggregated within<br />
a single cell. However, it may<br />
also under represent disturbance<br />
buffers because footprint buffers<br />
did not extend from one cell to<br />
another.<br />
A Fork in the Road: Future Development in Ontario’s Far North<br />
27
CD Long / The Wolverine Foundation<br />
Wolverine have been recovering<br />
in Ontario and have recently been<br />
sighted in the study area.<br />
3.4.2.1 Habitat availability<br />
For each cover type (including footprints),<br />
habitat availability is assessed as the product<br />
of its proportional abundance and its<br />
habitat value. Habitat value is a parameter<br />
that expresses the utility of a cover type to<br />
the species, where 0 indicates no utility and<br />
1 indicates capacity to support the species’<br />
maximum density. All natural land cover<br />
types were assigned a value of 1, given<br />
that wolverines are habitat generalists in<br />
fire-driven landscapes (Justina Ray, pers.<br />
comm.). Research in northwestern Ontario<br />
found wolverine avoid deciduous forest relative to coniferous forest,<br />
but it is thought that the avoidance was due to another underlying<br />
biotic or abiotic variable (Bowman et al. 2010). Footprints were<br />
assigned a value of 0 because wolverine prefer intact habitat.<br />
To account for avoidance and mortality, the habitat value of land<br />
cover in proximity of anthropogenic footprints was reduced by<br />
applying buffers to footprint and down-weighting the value of<br />
habitat within the buffer by a proportional use coefficient (i.e., the<br />
proportion of habitat within the buffer that is used). Buffer widths<br />
and use were based on an HSI model constructed for wolverine in<br />
Alberta (Jokinen 2004), which includes buffer relationships for four<br />
footprint types.<br />
• All weather roads (applied here to major and minor roads): habitat<br />
suitability was reduced by an average of 65% within 1,000<br />
m of the footprint.<br />
• Good weather roads (applied here to winter roads): habitat suitability<br />
was reduced by an average of 50% within 600 m of the<br />
footprint.<br />
• Vegetated linear disturbances (applied here to transmission lines<br />
and railroad): habitat suitability was reduced by an average of<br />
35% within 400 m of the footprint.<br />
• Polygonal footprints (applied here to all other footprint types,<br />
except reservoirs): habitat suitability was reduced by 70% within<br />
700 m of the footprint.<br />
3.4.2.2 Habitat quality<br />
Habitat quality is a value ranging from 0 to 1 that incorporates<br />
the effect of one or more landscape attributes on habitat such as<br />
road density, forest age, and human population density. For each<br />
28 Canadian Boreal Initiative | Wildlife Conservation Society <strong>Canada</strong>
elevant landscape attribute, a response surface ranging from 0 to<br />
1 dictates the relationship between habitat quality and the status of<br />
the attribute.<br />
Road density is consistently identified in empirical research as being<br />
negatively associated with wolverine habitat, and was included as<br />
a habitat quality attribute in the wolverine HSI. Research in lowland<br />
boreal forests of central <strong>Canada</strong> and northwestern USA found<br />
mortality risk to increase within home ranges where road density<br />
exceeded 0.44 km/km 2 (Justina Ray, pers. comm., Rowland et al.<br />
2003). The relationship between road density and wolverine is<br />
probably not a well-defined threshold, but rather a gradual impact<br />
(i.e., habitat quality declines with higher road density). The influence<br />
of road density on habitat quality was represented by a linear<br />
relationship where habitat quality equals 1 (i.e., 100%) when road<br />
density equals 0, dropping to 0.5 (50%) when road density equals<br />
0.44 km/km 2 , and 0 when road density equals 0.88 km/km 2 . The<br />
relationship is consistent with the finding that wolverine are unlikely<br />
to occupy home ranges with road densities greater than 0.44 km/<br />
km 2 . The relationship also helps to incorporate the finding from the<br />
boreal lowlands study (Dawson et al. 2010) that denning sites are<br />
likely to be 7 km from roads (i.e., there is a negative impact of roads<br />
over and above the 1 km buffer). The availability of denning sites<br />
is therefore negatively related with road density. When assessing<br />
habitat quality, road density was calculated at the tertiary watershed<br />
scale. Rowland et al. (2003) suggest that the watershed scale is<br />
appropriate when planning wolverine conservation.<br />
Road density is<br />
consistently identified<br />
in empirical research<br />
as being negatively<br />
associated with<br />
wolverine habitat.<br />
Other potential habitat quality attributes such as forest age or<br />
human density were not included in the HSI. Forest age does not<br />
seem to be an important determinant of wolverine habitat, given<br />
that cuts and burns were not selected for or against relative to other<br />
cover types in northwestern Ontario (Bowman et al. 2010). Human<br />
density in the study area is unlikely to reach levels that are detrimental<br />
to wolverine (beyond the negative relationship already captured<br />
by the road density relationship). Rowland et al. (2003) propose a<br />
human density threshold of 3.9/km 2 for northwestern USA, which is<br />
substantially higher than the current population density in the study<br />
area (< 0.2 people/km 2 ).<br />
3.4.2.3 Habitat suitability<br />
For each tertiary watershed, habitat suitability was calculated as the<br />
sum of the products of each cover type’s habitat availability and the<br />
watershed’s habitat quality (based on road density).<br />
A Fork in the Road: Future Development in Ontario’s Far North<br />
29
3.4.3 Moose<br />
The response of moose habitat to simulated landscape transformations<br />
was assessed by applying the following bioclimatic regression<br />
model developed from Ontario moose density data (Rempel 2011):<br />
Pden = exp(0.647 + YF(0.105) – YF 2 (0.158) + MC(0.104) –<br />
MC 2 (0.241) – AWT(0.154) – AWT 2 (0.006) – TCP(0.001) +<br />
TCP 2 (0.000002) – AST(0.141) + AST 2 (0.004)) – 1<br />
where Pden is the predicted moose density (per km 2 ), YF is the proportion<br />
of young (< 20-years) forest 43 , MC is proportion mature<br />
(> 60-years) conifer forest 44 , AWT is average winter temperature<br />
(°C) from December-February, TCP is total precipitation (mm) from<br />
October-March, and AST is average summer temperature (°C) from<br />
June-August. The model explained 32% of the variance in moose<br />
density in the 2000-2006 Ontario moose dataset, and performed<br />
fairly well at predicting moose density for the 1990-1999 moose<br />
dataset that was not used during model fitting. Unexplained variance<br />
was thought to be due to variance in hunting pressure and<br />
weather (Rempel 2011).<br />
Current climate variable values were available at a resolution of 450<br />
ha (Rob Rempel, pers. comm.). Climate was simulated to change<br />
over the next 50 years according to outcomes from the Canadian<br />
Coupled Global Circulation Model (CGCM2) for the A2 climate<br />
scenario (as <strong>report</strong>ed by Rempel 2011). Climate changes were: 4<br />
degree increase in AWT; 2.83 degree increase in AST; and 1.12 mm<br />
decrease in TCP. These changes were based on CGCM2 simulated<br />
change between the periods 1971-2000 and 2041-2070 for MNR’s<br />
Cervid Ecological Zone A, the most northern zone assessed by<br />
Rempel (2011) and a zone that overlaps with the southern portion of<br />
the study area (Appendix 3). The changes in climate variables were<br />
assumed to occur linearly across the 50-year simulation period.<br />
43<br />
Includes all forest types; i.e.,<br />
coniferous, deciduous, mixed,<br />
merchantable mixed conifer<br />
upland and lowland, merchantable<br />
intolerant hardwood, and<br />
merchantable mixedwood.<br />
44<br />
Includes all coniferous forest<br />
types; i.e., coniferous forest, merchantable<br />
mixed conifer upland<br />
forest, and merchantable mixed<br />
conifer lowland forest.<br />
To incorporate the effect of hunting, predicted moose density in<br />
proximity to roads was reduced by 58% based on research from<br />
northwestern Ontario (Rempel et al. 1997). Rempel et al. (1997)<br />
found that landscapes disturbed by timber harvest and fire were<br />
similar in their habitat quality (habitat suitability index values of<br />
0.85 for modified clearcut and 0.80 for wildfire burn), but that<br />
the harvest landscape supported 58% lower moose density (5.6 vs.<br />
13.2 moose/25 km 2 ). The difference in density was attributed to<br />
hunting; hunter access was severely restricted in the wildfire burn<br />
landscape due to low road density (0.3 m/ha vs. 8.1 m/ha) and heavy<br />
blow down after the burn. In our simulation, the 58% reduction<br />
30 Canadian Boreal Initiative | Wildlife Conservation Society <strong>Canada</strong>
in population density was applied<br />
to habitat within 1 km of roads<br />
and other linear footprints, such<br />
as transmission lines. The 1 km<br />
buffer is consistent with research<br />
from Alaska that estimated a roadeffect<br />
zone of > 1,000 m for female<br />
moose and 500-1,000 m for male<br />
moose (Shanley and Pyare 2011).<br />
Shanley and Pyare (2011) found<br />
that moose were impacted by even<br />
low levels of human access along<br />
roads (0.25 km of vehicle travel/<br />
km 2 /day). The 1 km buffer is also<br />
supported by research in southeastern<br />
New Brunswick that found 92%<br />
of moose were killed within 1 km of<br />
a road (Boer 1990). However, the 1<br />
km buffer will under-represent the<br />
effect of human access on the moose population if hunting pressure<br />
is sufficiently high to cause mortality sinks. Moose can travel large<br />
distances, such that moose densities within several km of roads and<br />
other linear footprints could be affected by hunting pressure.<br />
3.4.4 Watershed Intactness<br />
As part of an assessment of freshwater fish in Ontario’s boreal<br />
region, Browne (2007) developed a watershed cumulative impact<br />
score. The impact score, applied at the tertiary watershed scale,<br />
incorporates seven stressors to northern fish communities, including<br />
number of acid mine drainage sites, number of dams, human population<br />
density, land transformation, road density, number of pulp and<br />
paper mills, and number of tourism outposts 45 . When applying the<br />
index for this study, human population density was not incorporated<br />
due to the study area’s low population (< 0.2/km 2 ). Pulp and paper<br />
mills were similarly excluded because none are present in the study<br />
area, and tourism outposts were excluded because these features<br />
were not tracked during the simulation. Instead of assessing the<br />
index based on the number of acid mine drainage sites, impact was<br />
assessed based on the number of mines. Although some mines, most<br />
notably diamond, will not be potential acid mine drainage sites, they<br />
may be associated with other aquatic impacts such as the draining<br />
of water from large expanses of peatland and the potential mobilization<br />
of mercury stored in the peat (Far North Science Advisory<br />
Panel 2010).<br />
Hunter access may be a major<br />
determinant for how moose fare.<br />
45<br />
Tourism outposts were not<br />
included when calculating the<br />
impact score for this study because<br />
tourism outposts were not<br />
tracked during the simulation.<br />
© Garth Lenz<br />
A Fork in the Road: Future Development in Ontario’s Far North<br />
31
Table 11. Scoring system when applying impact scores to tertiary watersheds (Browne 2007). Cumulative impact score was calculated<br />
as the sum score across threats.<br />
Mines Hydroelectric sites Road density Recent cut (interpreted<br />
as within 20 years)<br />
Settlement<br />
# Score # Score km/km 2 Score % Score % Score<br />
0 0 0 0 0 0 0-0.9 0 0 0<br />
1 2 1 3 1 1 1-5.9 1 0.1-2 2<br />
2 4 2 5 2 2 6-10.9 2 2.1-5 4<br />
3 6 3 7 ... ... 11-15.9 3 5.1-10 6<br />
4 8 >3 10 9 9 16-19.9 4 10.1-15 8<br />
5 10 Etc. Etc. >20 5 >15 10<br />
32 Canadian Boreal Initiative | Wildlife Conservation Society <strong>Canada</strong>
4. Results<br />
Simulated development resulted in a three-fold increase in anthropogenic<br />
footprint, primarily due to road and transmission corridor<br />
expansion (Figure 10). Footprint expansion was greatest in the<br />
southern portion of the study area where a dispersed road network<br />
was needed to access timber. Footprint growth did occur in the north,<br />
but was more spatially constrained (e.g., corridors to access mines in<br />
the Ring of Fire and dams along major rivers). Impacts to forest age<br />
were also greatest to the south where the average age of the forest<br />
declined in response to timber harvest (Figure 11). Average forest<br />
age increased outside of the SFLs, suggesting that the simulated fire<br />
rate may be less than the natural disturbance regime responsible for<br />
shaping the current age-class composition. Underrepresentation of<br />
the true natural disturbance rate could in part be due to insect outbreaks<br />
and autogenic disturbances (e.g., gap dynamics) not included<br />
in our simulation. Alternatively, the estimate of the current age-class<br />
composition could underrepresent the abundance of older forest in<br />
the region. This possibility is supported by forest inventory data<br />
from 1978 for 5,250 km 2 of the Moose River FMU, which is immediately<br />
north of the AOU in the eastern portion of the study area.<br />
According to the inventory data, almost 70% of the forest was older<br />
than 120 years (Ter-Mikaelian et al. 2009). In comparison, 31% of<br />
non-merchantable forest was assigned an age greater than 120 years<br />
by the forest age data set (i.e., Chen et al. 2003) used in this study.<br />
However, the discrepancy in the abundance of older forest between<br />
the data sets could be a reflection of the stochastic nature of fire in<br />
the region, which creates a variable forest age structure through time<br />
and space.<br />
Simulated development<br />
resulted in a three-fold<br />
increase in anthropogenic<br />
footprint, primarily due<br />
to road and transmission<br />
corridor expansion.<br />
Footprint expansion was<br />
greatest in the southern<br />
portion of the study area<br />
where a dispersed road<br />
network was needed to<br />
access timber.<br />
A Fork in the Road: Future Development in Ontario’s Far North<br />
33
Figure 10. Response of anthropogenic footprint to the simulated land-use scenario.<br />
2012 2062<br />
50000<br />
45000<br />
40000<br />
35000<br />
30000<br />
25000<br />
20000<br />
15000<br />
10000<br />
5000<br />
0<br />
2012 2022 2032 2042 2052 2062<br />
Simulation year<br />
Anthropogenic footprint (ha)<br />
34 Canadian Boreal Initiative | Wildlife Conservation Society <strong>Canada</strong>
Figure 11. Response of forest age to the simulated land-use scenario.<br />
2012 2062<br />
140<br />
120<br />
100<br />
80<br />
60<br />
Age (years)<br />
40<br />
20<br />
0<br />
2012 2022 2032 2042 2052 2062<br />
Simulation year<br />
All land cover<br />
All forest<br />
Merchantable forest<br />
A Fork in the Road: Future Development in Ontario’s Far North<br />
35
Risk to herd viability<br />
approached the high<br />
category and range<br />
disturbance exceeded<br />
the threshold set forth<br />
in the national boreal<br />
caribou recovery<br />
strategy.<br />
The more rapid changes to landscape composition in the southern<br />
portion of the study area translated to larger simulated impacts to<br />
terrestrial wildlife. Increased prevalence of footprint and young<br />
forest caused disturbance within the Pagwachuan caribou range to<br />
double from 22 to 44% (Figure 12). As a result, risk to population<br />
viability approached the high category and range disturbance<br />
exceeded the threshold (35%) set forth in the national boreal caribou<br />
recovery strategy (Environment <strong>Canada</strong> 2012). Elsewhere in<br />
the study area, disturbance to caribou habitat (considered here as<br />
one population) occurred in proximity to the network of corridors<br />
accessing new mines and dams, and in areas that were burned by the<br />
simulated fire regime. Risk to caribou viability increased as a result,<br />
but did not exceed the 35% disturbance threshold where scientific<br />
assessments have indicated an increased risk to caribou populations<br />
(Environment <strong>Canada</strong> 2011). Simulated impacts to wolverine were<br />
also greatest to the south, where expansion of the road network<br />
caused habitat suitability within many watersheds to decline (Figure<br />
13). Elsewhere in the study area, expanding anthropogenic footprint<br />
caused a loss of wolverine habitat suitability in most watersheds, but<br />
the decline seldom exceeded 10%.<br />
36 Canadian Boreal Initiative | Wildlife Conservation Society <strong>Canada</strong>
Figure 12. Simulated response of caribou range disturbance to the simulated land-use scenario. Caribou disturbance is expressed in terms of risk categories defined in<br />
the national boreal caribou recovery strategy.<br />
2012 2062<br />
A Fork in the Road: Future Development in Ontario’s Far North<br />
37
Figure 13. Simulated response of wolverine habitat suitability to the simulated land-use scenario. Habitat suitability was assessed at the tertiary watershed scale; the<br />
graph presents trajectories in habitat suitability for 30 watersheds that overlap with the study area. A habitat suitability index of 1 is representative of natural habitat<br />
(i.e., no land-use impacts).<br />
2012 2062<br />
38 Canadian Boreal Initiative | Wildlife Conservation Society <strong>Canada</strong>
The moose population was insensitive to the simulated expansion<br />
of anthropogenic footprint (Figure 14), but increased dramatically<br />
when climate change was incorporated (Figure 15). The expected<br />
warming of winters caused the moose population to more than<br />
double and expand across the study area. Increased hunting pressure<br />
associated with simulated road expansion was insufficient to<br />
dampen moose population growth, with the exception of portions<br />
of the SFLs where road density was high.<br />
The current distribution of aquatic impacts is similar to that of terrestrial<br />
impacts; northern watersheds are intact whereas southern<br />
watersheds exhibit some degradation of ecological integrity largely<br />
due to the impacts of roads and timber harvest (Figure 16). As the<br />
simulation proceeded, however, the development of mines and dams<br />
increased aquatic impacts for a number of northern watersheds.<br />
Two watersheds, in particular, received high watershed impact scores<br />
by the end of the simulation: the Lower Attawapiskat watershed<br />
received an impact score of 13 due to the presence of 11 mines; and,<br />
the Albany - Mouth watershed received an impact score of 10 due<br />
to the development of four dams.<br />
The expected warming<br />
of winters caused the<br />
moose population to<br />
more than double and<br />
expand across the study<br />
area..... The development<br />
of mines and dams<br />
increased aquatic impacts<br />
for a number of northern<br />
watersheds.<br />
A Fork in the Road: Future Development in Ontario’s Far North<br />
39
Figure 14. Response of moose density to the simulated land-use scenario when climate change impacts are excluded.<br />
2012 2062<br />
40 Canadian Boreal Initiative | Wildlife Conservation Society <strong>Canada</strong>
Figure 15. Response of moose density to the simulated land-use scenario and climate change.<br />
2012 2062<br />
A Fork in the Road: Future Development in Ontario’s Far North<br />
41
Figure 16. Distribution of watershed impact score across tertiary watersheds at the start and end of the 50-year simulation. A higher watershed score indicates<br />
greater risk to aquatic ecosystem integrity.<br />
2012 2062<br />
42 Canadian Boreal Initiative | Wildlife Conservation Society <strong>Canada</strong>
5. Discussion<br />
The primary purpose of the pilot project was to integrate information<br />
required for assessments of cumulative effects of anticipated<br />
industrial land use on wildlife. Our study demonstrated potential<br />
impacts on wildlife species and aquatic ecosystems from the multiple<br />
types of industrial development anticipated for Ontario’s Far North.<br />
The outcomes of the analysis also suggest priorities for expanding<br />
the scope of scenarios and indicators to achieve more comprehensive<br />
assessments of cumulative effects in the region.<br />
5.1 Impacts of land use to wildlife in Ontario’s Far<br />
North<br />
The level of disturbance created by industrial development simulated<br />
in our study was sufficient to increase risk to caribou and wolverine.<br />
Simulated forestry activity caused substantially greater road density<br />
within the SFLs than elsewhere in the study area, as well as an<br />
increase in recently disturbed forest. Disturbance of the Pagwachuan<br />
range surpassed the threshold identified to guide recovery planning,<br />
suggesting that the long-term viability of the population may require<br />
the expansion of protected areas in forest management planning.<br />
Simulation results also included increased risk to wolverine within<br />
watersheds in the SFLs. As a coarse assessment of risk, risk categories<br />
were applied that were informed by the International Union for<br />
the Conservation of Nature (IUCN) classification of species at risk<br />
according to population change 46 . High risk was equated to the<br />
IUCN endangered category (> 50% decline in population), moderate<br />
risk was equated to the IUCN vulnerable category (> 30% decline in<br />
population), and low risk was equated to < 30% decline in population.<br />
According to these criteria, the area of watersheds posing a<br />
moderate or high risk to wolverine viability increased from 1,121<br />
km 2 to 18,698 km 2 during the simulation.<br />
The simulation’s assessment of increased risk to caribou and wolverine<br />
is well supported by studies that have evaluated the historical or<br />
current relationship between land use and these species in northern<br />
Ontario. Woodland caribou range in Ontario has steadily receded<br />
northwards during the last century (Schaefer 2003), tracking the<br />
Our study demonstrated<br />
potential impacts on<br />
wildlife species and<br />
aquatic ecosystems<br />
from the multiple<br />
types of industrial<br />
development anticipated<br />
for Ontario’s Far North.<br />
The outcomes of the<br />
analysis also suggest<br />
priorities for expanding<br />
the scope of scenarios<br />
and indicators to achieve<br />
more comprehensive<br />
assessments of<br />
cumulative effects in<br />
the region.<br />
46<br />
http://www.iucnredlist.org/<br />
static/categories_criteria_3_1<br />
A Fork in the Road: Future Development in Ontario’s Far North<br />
43
expansion of forestry activity (Vors et al. 2007). Land use has caused<br />
differentiation of mammal communities north and south of the province’s<br />
allocation limit, with wolverine and caribou exhibiting greater<br />
abundance north of the limit and moose, deer, and wolves displaying<br />
greater abundance south of the limit (Bowman et al. 2010).<br />
A higher fire rate would<br />
increase the area of<br />
disturbed forest, which in<br />
turn would be detrimental<br />
to caribou. Further,<br />
the anticipated moose<br />
population expansion<br />
in response to warmer<br />
winters could facilitate<br />
an increase in wolf<br />
density, with negative<br />
implications for caribou<br />
due to their susceptibility<br />
to predation.<br />
The assessment of risk to caribou may be conservative. The critical<br />
disturbance threshold of 35% in the recently-released Recovery<br />
Strategy (Environment <strong>Canada</strong> 2012), while based on a meta-analysis<br />
of caribou data from across <strong>Canada</strong>, is a management decision<br />
that still accepts a 40% risk to caribou and does not account for the<br />
variability associated with individual populations (see Environment<br />
<strong>Canada</strong> 2011). For example, herd-specific research conducted in<br />
the James Bay Region of Northern Quebec found that the critical<br />
disturbance threshold varied across herds, with one exhibiting a<br />
lower disturbance threshold of 30.6% before population declines<br />
were evident (Rudolph et al. 2012). Research in northern Ontario,<br />
including caribou ranges that encompass a significant proportion of<br />
non-treed habitat, is required to confirm the suitability of the 35%<br />
critical disturbance threshold.<br />
Land-use impacts on species and watersheds may be exacerbated<br />
by climate change. In general, northern ecosystems are expected to<br />
experience more severe climate change than southern regions, with a<br />
number of consequences including shifts in the distribution of plants<br />
and wildlife as well as changes in natural disturbance rates and other<br />
ecological processes such as hydrology (Far North Science Advisory<br />
Panel Report 2010). The Hudson Plains ecozone is expected to<br />
experience severe impacts of climate change with amplified warming<br />
expected based on feedback effects from loss of sea ice (Abraham et<br />
al. 2011). While climate change has been identified as being important<br />
for addressing caribou (e.g., Fiesta-Blanchet et al. 2011) and<br />
wolverine (e.g., Brodie and Post 2009, Ontario Wolverine Recovery<br />
Team 2011) distribution and viability, we lacked suitable models<br />
for addressing climate change explicitly in our analyses for caribou<br />
and wolverine. We predict that increased fire ignition and spread in<br />
response to reduced fuel moisture under a warming climate scenario<br />
would have important consequences for caribou in Ontario’s Far<br />
North. Climate change consistent with a 3 x CO 2 scenario has been<br />
projected to increase burn rates in the region by a factor of 2.1 by the<br />
end of this century in this region (Flannigan et al. 2005). A higher<br />
fire rate would increase the area of disturbed forest, which in turn<br />
would be detrimental to caribou. Further, the anticipated moose<br />
population expansion in response to warmer winters could facilitate<br />
44 Canadian Boreal Initiative | Wildlife Conservation Society <strong>Canada</strong>
an increase in wolf density, with negative implications for caribou<br />
due to their susceptibility to predation (Bowman et al. 2010). This<br />
should have implications for current cervid management and zoning<br />
in Ontario’s Far North (Appendix 3). While the increased moose<br />
density projected in our study may be moderated by density-dependent<br />
mortality factors, other studies support the finding that moose<br />
populations are likely to expand into the Far North (Varrin et al.<br />
2007, Rempel 2011). Climate change also has important implications<br />
for ungulate health because of the predicted expansion of deer<br />
(Odocoileus spp.) and meningeal worm (Paralaphostrongylus tenius)<br />
into northern ecosystems and changes to moose tick (Dermacentor<br />
albipictus) dynamics. (Varrin et al. 2007). Conserving wide-ranging<br />
species in the face of climate change will be aided by maintenance of<br />
intact landscapes, due to their roles in maintaining resiliency in the<br />
face of climate change and land use as well as facilitating range shifts<br />
(e.g., Hansen et al. 2010). Future scenario analyses could further<br />
explore the consequences of climate change by incorporating dynamics<br />
such as increased natural disturbance rate, altered predator-prey<br />
dynamics caused by shifts in species range (e.g., implications of<br />
moose population expansion to predation of caribou by wolves,<br />
implications of warming summers and disease dynamics on moose),<br />
and reduced habitat suitability for cold water species such as lake<br />
trout (Salvelinus namaycush) and brook trout (Salvelinus fontinalis)<br />
(Gunn and Snucins 2010).<br />
In contrast to their simulated decline in the southern portion of the<br />
study area, wolverine and caribou appeared relatively resilient under<br />
our conservative scenario of expanding land use north of the allocation<br />
limit. Habitat was adversely affected in proximity to anthropogenic<br />
footprints, but the low density of these prevented widespread<br />
risk. The limited spatial extent of simulated wildlife impacts in the<br />
north suggests that economic growth in the region can be compatible<br />
with persistence of sensitive wildlife populations. However, this<br />
result must be interpreted with caution because our analysis may<br />
underestimate the extent and intensity of land use north of the AOU<br />
for two reasons.<br />
• The prevailing pattern globally is that the creation of infrastructure<br />
such as roads and transmission corridors not only facilitates<br />
planned projects but, more generally, serves to open up previously<br />
inaccessible regions and tends to stimulate further development<br />
and roads (Far North Science Advisory Panel 2010, p. xiii).<br />
Specifically, the Far North Science Advisory Panel reviewed the<br />
implications of roads and transmission corridors in Ontario’s Far<br />
A Fork in the Road: Future Development in Ontario’s Far North<br />
45
North and recommended that “transportation and transmission<br />
corridors needed to be planned in a coordinated fashion, recognizing<br />
community needs and protecting significant ecological<br />
features.”<br />
• The anticipated intensity of use for industrial all-weather roads<br />
may be relatively high compared to existing winter roads. The<br />
infrastructure corridor linking the Ring of Fire to the south will<br />
likely receive more than 100 large trucks per day 47 . Experience<br />
elsewhere (Forman and Alexander 1998, National Research<br />
Council 2005, Foreman et al. 2003, Beckmann et al. 2010)<br />
suggests that heavily used roads through otherwise intact landscapes<br />
cause impacts that are disproportionate to their physical<br />
footprint not only by acting as mortality sinks, but also by<br />
fragmenting movement and gene flow within populations. In<br />
the James Bay Region of northern Quebec, roads were found to<br />
be the most important factor affecting caribou occurrence and<br />
caribou aversion to roads was observed at distances exceeding<br />
1 km (Rudolph et al. 2012). The high impact of infrastructure<br />
corridors in the region may be further exacerbated by their location<br />
in upland habitat such as eskers, which have been shown<br />
elsewhere to be disproportionately important for wildlife (e.g.,<br />
Johnson et al. 2005, McLoughlin et al. 2010).<br />
Potential impacts are such that infrastructure corridors demand<br />
careful consideration in terms of their location, level of use, and<br />
potential mitigation strategies, such as access management planning,<br />
and enforcement. Examples of mitigation strategies include prohibiting<br />
lateral road development from the corridor to limit cumulative<br />
effects, and minimizing traffic during periods critical to wildlife such<br />
as spring dispersal and calving (Rudolph et al. 2012). Achieving the<br />
simulated result of northern economic development and continued<br />
ecological integrity will require a proactive and regional planning<br />
approach to manage risks to species sensitive to industrial development.<br />
The Far North Science Advisory Panel reviewed the state of<br />
proposed and current development in the Far North and made three<br />
relevant recommendations. Our work supports these recommendations.<br />
47<br />
Cliffs Chromite Project estimates<br />
traffic frequency of 50-100 trucks<br />
a day for most of the mines<br />
projected 30 year lifespan (Cliffs<br />
2011). Given that multiple mines<br />
are likely to be developed concurrently,<br />
traffic exceeding 100<br />
trucks per day is likely.<br />
• The creation of a coordinated government-wide strategy for the<br />
management of interim and ongoing development.<br />
• Acknowledge the development and infrastructure issues in the<br />
Ring of Fire by designating it as a Priority Management Area<br />
with an interim sub-regional planning process.<br />
46 Canadian Boreal Initiative | Wildlife Conservation Society <strong>Canada</strong>
• Immediately establish the Far North Land Use Strategy as mandated<br />
in Ontario’s Far North Act.<br />
Unfortunately, none of these recommendations have been taken up<br />
by Ontario to date.<br />
The relatively low simulated impact of isolated mining and hydroelectric<br />
developments to terrestrial wildlife belies potential impacts to<br />
the aquatic environment. Negative consequences of mines to aquatic<br />
ecosystems are numerous and include release of effluent, leaching of<br />
contaminant from tailings (e.g., acid mine drainage, selenium), physical<br />
destruction of habitat, and increased access to lakes and rivers<br />
(Browne 2007). Dams are also associated with a suite of potentially<br />
far-reaching impacts (summarized in Browne 2007), including the<br />
release of mercury from decomposing organic matter in reservoirs,<br />
fragmentation of aquatic habitat for species at risk such as lake sturgeon<br />
(Acipenser fulvescens) (McDermid et al. 2011), and alteration<br />
of downstream flow regime. Impacts from even a single mine site or<br />
dam can be widespread, due to the high connectivity of the aquatic<br />
system and because the low productivity of northern aquatic ecosystems<br />
makes them susceptible to stressors such as angling and the<br />
introduction of invasive species. As demonstrated by the simulated<br />
rise in impact scores for many watersheds in the northern portion<br />
of the study area, risks to the integrity of aquatic ecosystems are<br />
likely to increase with the future development of mines and dams.<br />
Aggregation of development during the simulation resulted in some<br />
watersheds experiencing a substantial increase in impact score.<br />
Most of the Ring of Fire deposits as well as the kimberlite deposits<br />
in the vicinity of the Victor mine all occur within a single watershed<br />
(Attawapiskat). As a result, ten of the simulated mines as well as<br />
the existing Victor mine were located in the same watershed, resulting<br />
in a high watershed impact score. Similarly, the distribution of<br />
dams was spatially aggregated, with a single watershed receiving as<br />
many as four dams during the simulation. Although negative effects<br />
can be mitigated to a degree through project design and ongoing<br />
management, impacts cannot be eliminated. The cumulative effect<br />
of numerous mines and/or dams occurring within a single watershed<br />
will increase risks to aquatic ecosystems and the people that rely on<br />
them. It is therefore prudent to establish limits to mine and dam<br />
intensities in order to avoid unacceptable impacts to First Nation<br />
communities and ecosystem services. Detailed consideration of the<br />
cumulative impacts of multiple mines and dams to attributes such as<br />
water quality and fish populations is needed prior to the expansion<br />
of mining and hydroelectric development in Ontario’s Far North.<br />
Impacts from even a<br />
single mine site or dam<br />
can be widespread, due<br />
to the high connectivity<br />
of the aquatic system<br />
and because the low<br />
productivity of northern<br />
aquatic ecosystems makes<br />
them susceptible to<br />
stressors such as angling<br />
and the introduction of<br />
invasive species.<br />
A Fork in the Road: Future Development in Ontario’s Far North<br />
47
Outcomes of the analysis<br />
demonstrate the<br />
benefit of exploring the<br />
consequences of potential<br />
land use scenarios<br />
over large spatial and<br />
temporal scales. For<br />
example, the study<br />
area’s overlap with SFLs<br />
south of the allocation<br />
limit and potential<br />
mineral and hydroelectric<br />
developments in<br />
Ontario’s Far North<br />
provides insight into the<br />
relative consequences<br />
of temporary, but<br />
widespread (e.g., forestry)<br />
versus more permanent,<br />
but isolated (e.g.,<br />
mining, hydroelectric<br />
development) land use.<br />
Ontario’s Far North Science Advisory Panel recognized the importance<br />
of addressing cumulative effects on aquatic ecosystems and<br />
made a number of recommendations about land use planning that<br />
are relevant to our results including:<br />
• Maintain the existing moratorium on large-scale (> 25<br />
MW) hydroelectric development, including interbasin divisions<br />
and watersheds.<br />
• Use watersheds or other natural boundaries as the basis<br />
for establishing protected areas that may be affected by<br />
upstream development.<br />
5.2 Priorities for future scenario analyses<br />
Outcomes of the analysis demonstrate the benefit of exploring the<br />
consequences of potential land use scenarios over large spatial and<br />
temporal scales. For example, the study area’s overlap with SFLs<br />
south of the allocation limit and potential mineral and hydroelectric<br />
developments in Ontario’s Far North provides insight into the<br />
relative consequences of temporary, but widespread (e.g., forestry)<br />
versus more permanent, but isolated (e.g., mining, hydroelectric<br />
development) land use. The spatial extent of disturbance was sufficient<br />
to cause substantial risk to caribou and wolverine in the SFL’s,<br />
but not north of the AOU where land use was limited to mines and<br />
hydroelectric development. In contrast, however, the accumulation<br />
of multiple mines and dams in northern watersheds may create risks<br />
to aquatic ecosystems that are disproportionate to their small spatial<br />
extent due to the intensity and permanence of the disturbance.<br />
These differences emphasize that policies for managing land use must<br />
account for differences in the types of developments expected in the<br />
Far North as opposed to the AOU.<br />
The scenario analysis <strong>report</strong>ed here is a step towards a decisionsupport<br />
system to inform land-use planning in Ontario’s Far North.<br />
A diversity of information was integrated during the study, including<br />
land cover and footprint inventories, potential land-use trajectories,<br />
and relationships between landscape composition and ecological<br />
impacts. Further work is required, however, to expand the scope of<br />
the assessment. Some impacts were not addressed, including climate<br />
change and land uses such as gravel pits (which are likely to impact<br />
relatively rare upland habitat) and the expansion of settlements<br />
and work camps associated with exploration and mines. Future<br />
scenario analyses could incorporate these impacts, and also assess<br />
the potential consequences of scenarios that increase the rate and/<br />
48 Canadian Boreal Initiative | Wildlife Conservation Society <strong>Canada</strong>
or spatial dispersion of development. Natural disturbance regimes<br />
require more detailed consideration, especially given the implications<br />
of climate change. Aspects of natural disturbance that could<br />
be incorporated include spatial variation in fire rate across the study<br />
area (e.g., Shield vs. Lowland), increasing fire rates, and outbreaks of<br />
insects such as the spruce budworm, jack pine budworm, and forest<br />
tent caterpillar (Far North Science Advisory Panel Report 2010, pg.<br />
51, Abraham et al. 2011).<br />
In this pilot project, we focused on species of provincial and First<br />
Nation interest that have suitable habitat models applicable to the<br />
study area. As discussed previously, a more detailed set of aquatic<br />
indicators is required to better understand cumulative effects of<br />
development and climate change on aquatic species (e.g., lake trout<br />
(Salvenlinus namaycush), lake sturgeon). A priority for expanding<br />
the scope of the scenario analysis is to develop a fish community<br />
integrity index that relates land use to fish community impacts,<br />
building upon concepts applied in watersheds in the boreal forest of<br />
Alberta (Sullivan 2006). The assessment of terrestrial impacts could<br />
also be expanded, for example to assess consequences to species<br />
associated with various forest types and ages. Songbirds provide<br />
a suitable focal taxa in this regard. A scenario analysis for boreal<br />
Ontario concluded that conserving songbird species with diverse<br />
habitat characteristics required maintenance of a range of forest patterns,<br />
such as can be achieved through forest management that emulates<br />
natural disturbance (Rempel et al. 2007). Another potential<br />
source of habitat relationships is the Boreal Avian Modelling Project<br />
(BAM), a collaborative effort to create the best possible bird-habitat<br />
models from available data. The BAM dataset, which spans boreal<br />
North America, includes point-count locations within the study area<br />
and similar ecosystems, and predictive models of bird density by<br />
habitat type are available (www.borealbirds.ca).<br />
Another important suite<br />
of indicators to be added<br />
are socio-economic<br />
attributes including<br />
economic performance<br />
associated with resource<br />
development (e.g., jobs,<br />
royalties), but also social<br />
impacts such as impacts<br />
on traditional lifestyles<br />
and health.<br />
Another important suite of indicators to be added are socio-economic<br />
attributes including economic performance associated with<br />
resource development (e.g., jobs, royalties), but also social impacts<br />
such as impacts on traditional lifestyles and health. First Nation<br />
communities may struggle to maintain social cohesion in the face of<br />
rapid expansion of resource development, and the decision-support<br />
system must address this issue to help inform communities and governments<br />
as they seek to conserve values and rights while engaging<br />
in novel industrial developments.<br />
A Fork in the Road: Future Development in Ontario’s Far North<br />
49
6. Conclusion<br />
Many of these outcomes<br />
support recommendations<br />
made by Ontario’s Far<br />
North Science Advisory<br />
Panel and provide<br />
insights for considering<br />
the conservation matrix<br />
model approach to<br />
conservation and planning<br />
in an intact region like<br />
Ontario’s Far North.<br />
The outcomes of this pilot project offers important considerations<br />
when addressing cumulative effects in northern Ontario, including:<br />
the benefit to wildlife of limiting land use to isolated nodes within<br />
an otherwise intact landscape; the need to improve understanding of<br />
the cumulative effects to aquatic ecosystems of multiple large-scale<br />
developments (e.g., mines, dams) within northern watersheds; and<br />
the potential for climate change to increase the sensitivity of wildlife<br />
to land use. Many of these outcomes support recommendations<br />
made by Ontario’s Far North Science Advisory Panel and provide<br />
insights for considering the Conservation Matrix Model approach<br />
to conservation and planning in an intact region like Ontario’s Far<br />
North. We hope that these findings will inform land-use planning<br />
at both the community and regional scale in the region and support<br />
the need for a comprehensive assessment of cumulative effects in<br />
Ontario’s Far North.<br />
50 Canadian Boreal Initiative | Wildlife Conservation Society <strong>Canada</strong>
Acknowledgements<br />
We are grateful to Drs. Rob Rempel (OMNR), Justina Ray (<strong>WCS</strong><br />
<strong>Canada</strong>) and David Browne (Canadian Wildlife Federation) for<br />
sharing their expertise on the wildlife and watershed models used<br />
in this analysis. We thank Karen Manual, Tim Barker, and Mika<br />
Sutherland with the ALCES Group and Meg Southee and Gillian<br />
Woolmer with <strong>WCS</strong> <strong>Canada</strong> for their GIS support. Special thanks to<br />
Meg for her help on Figures 1-9. Our work is generously supported<br />
by The W. Garfield Weston Foundation, The EJLB Foundation, The<br />
Schad Foundation, The K.M. Hunter Foundation, Limited Brands<br />
and The Metcalf Foundation (Cheryl Chetkiewicz, Matt Carlson)<br />
and the Canadian Boreal Initiative (Matt Carlson). Our <strong>report</strong><br />
benefited from reviews by Alan Young, Justina Ray, and Jenni<br />
McDermid. We are grateful to Garth Lenz for the use of his stunning<br />
photographs in our <strong>report</strong>.<br />
A Fork in the Road: Future Development in Ontario’s Far North<br />
51
References<br />
Abraham, K. F., L. M. McKinnon, Z. Jumean, S. M. Tully, L. R. Walton, and<br />
H. M. Stewart. 2011. Hudson Plains Ecozone+ Status and Trends Assessment.<br />
Canadian Councils of Resource Ministers, Ottawa, ON.<br />
ALCES Group. 2011. Cumulative Effects Assessment for Alberta Pacific Forest<br />
Industries. Unpublished <strong>report</strong> prepared for Alberta Pacific Forest Industries.<br />
Anielski, M., and S. Wilson. 2009. Counting <strong>Canada</strong>’s natural capital: assessing<br />
the real value of <strong>Canada</strong>’s boreal ecosystems. Ottawa: Pembina Institute and<br />
Canadian Boreal Initiative.<br />
ArborVitae Environmental Services Ltd. 2004. Estimating Future Carbon<br />
Losses from Deforestation in <strong>Canada</strong>. Unpublished <strong>report</strong> prepared for<br />
Canadian Forest Service, Natural Resources <strong>Canada</strong>.<br />
Athabasca Landscape Team. 2009. Athabasca Caribou Landscape Management<br />
Options Report. Unpublished <strong>report</strong> submitted to the Alberta Caribou<br />
Committee Governance Board. Available online: http://www.albertacariboucommittee.ca/PDF/Athabasca-Caribou.pdf.<br />
Beckmann, J. P., A. P. Clevenger, M. P. Huijser, and J. A. Hilty, editors. 2010.<br />
Safe Passages. Island Press, Washington.<br />
Berkes, F. 2011. Cultural Services. Pages 359-362 in Abraham, K. F., L. M.<br />
McKinnon, Z. Jumean, S. M. Tully, L. R. Walton, and H. M. Stewart. Hudson<br />
Plains Ecozone+ Status and Trends Assessment. Canadian Councils of Resource<br />
Ministers, Ottawa, ON..<br />
Boer, A. H. 1990. Spatial distribution of moose kills in New Brunswick.<br />
Wildlife Society Bulletin 18: 431-434.<br />
Bowman, J., J. C. Ray, A. J. Magoun, D. S. Johnson, and F. N. Dawson. 2010.<br />
Roads, logging, and the large-mammal community of an eastern Canadian<br />
boreal forest. Canadian Journal of Zoology 88:454-467.<br />
Brodie, J.F. and E. Post. 2009. Nonlinear responses of Wolverine populations to<br />
declining winter snowpack. Population Ecology published online 25 December<br />
2009.<br />
Browne, D.R. 2007. Freshwater fish in Ontario’s boreal: Status, conservation<br />
and potential impacts of development. Wildlife Conservation Society <strong>Canada</strong><br />
Conservation Report No. 2. Toronto, Ontario, <strong>Canada</strong>.<br />
Browne, D.R., and M. Carlson. 2012. Planning for the impacts of large scale<br />
industrial development on fish and wildlife in <strong>Canada</strong>’s western boreal forest.<br />
National Fish and Wildlife Conservation Congress, May 27-31 2012, Ottawa,<br />
<strong>Canada</strong>.<br />
Carlson, M., E. Bayne, and B. Stelfox. 2009. Assessing the future wildlife<br />
impacts of conservation and development in the Mackenzie Watershed. In:<br />
T.D. Rich, C. Arizmendi, D.W. Demarest and C. Thompson (Eds.). Proceedings<br />
of the 4th International Partners in Flight Conference. February 13-16 2008,<br />
McAllan, Texas. Partners in Flight.<br />
52 Canadian Boreal Initiative | Wildlife Conservation Society <strong>Canada</strong>
Carlson, M., T. Antoniuk, D. Farr, S. Francis, K. Manuel, J. Nishi, B. Stelfox,<br />
M. Sutherland, C. Yarmoloy, C. Aumann, and D. Pan. 2010. Informing regional<br />
planning in Alberta’s oilsands region with a land-use simulation model. In: D.A.<br />
Swayne, W. Yang, A.A. Voinov, A. Rizzoli and T. Filatova (Eds.). Proceedings<br />
of the 2010 International Congress on Environmental Modelling and Software.<br />
July 2010, Ottawa, Ontario.<br />
Carlson, M., R. Mitchell, and L. Rodriguez. 2011. Scenario analysis to identify<br />
viable conservation strategies in Paraguay’s imperiled Atlantic Forest. Ecology<br />
and Society 16(3). http://www.ecologyandsociety.org/vol16/iss3/art8/.<br />
Chen, J. M., W. Ju, J. Cihlar, D. Price, J. Liu, W. Chen, J. Pan, T. A. Black, and<br />
A. Barr. 2003. Spatial distribution of carbon sources and sinks in <strong>Canada</strong>’s<br />
forests. Tellus B 55(2): 622-642.<br />
Cliffs Natural Resources Inc. 2011. Cliffs Chromite Project: Project Description<br />
Summary. Available online at: http://www.cliffsnaturalresources.com/EN/<br />
aboutus/GlobalOperations/chromite/Pages/StakeholderEngagement.aspx<br />
Dawson, F. N., A. J. Magoun, J. Bowman, and J. C. Ray. 2010. Wolverine,<br />
Gulo gulo, Home Range Size and Denning Habitat in Lowland Boreal Forest in<br />
Ontario. Canadian Field-Naturalist 124:139-144.<br />
DeFries, R.S., J.A. Foley, and G.P. Asner. 2004. Land-use choices: balancing<br />
human needs and ecosystem function. Frontiers in Ecology and the Environment<br />
2(5):249-257.<br />
Dickson, E. 2009. The McFauld’s Lake Ring of Fire. www.resourceworld.com.<br />
July 2009.<br />
Dynesius, M. and C. Nilsson. 1994. Fragmentation and flow regulation of river<br />
systems in the northern third of the world. Science 266:753-762.<br />
Environment <strong>Canada</strong>. 2012. Recovery Strategy for the Woodland Caribou<br />
(Rangifer tarandus caribou), Boreal population, in <strong>Canada</strong>. Species at Risk Act<br />
Recovery Strategy Series. Environment <strong>Canada</strong>, Ottawa. xi + 138pp. Available<br />
online at: http://wildernesscommittee.org/sites/all/files/EC_RecoveryStrategy_<br />
BorealCaribou_2012.pdf<br />
Environment <strong>Canada</strong>. 2011. Scientific Assessment to Inform the Identification<br />
of Critical Habitat for Woodland Caribou (Rangifer tarandus caribou), Boreal<br />
Population, in <strong>Canada</strong>. Environment <strong>Canada</strong>, Ottawa. Available online<br />
at: http://ec.gc.ca/data_donnees/STB-DGST/001/Anthropogeneic_Disturbance_<br />
Mapping_Methods_Appendix_-_ENGLISH.pdf<br />
Far North Science Advisory Panel. 2010. Science For a Changing Far North:<br />
The Report of the Far North Science Panel. Ontario Ministry of Natural<br />
Resources, Queen’s Printer for Ontario. 165 pp. Available online at: http://<br />
www.mnr.gov.on.ca/en/Business/FarNorth/2ColumnSubPage/266512.html<br />
Festa-Bianchet, M., J. C. Ray, S. Boutin, S. Cote, and A. Gunn. 2011.<br />
Conservation of caribou (Rangifer tarandus) in <strong>Canada</strong>: an uncertain future.<br />
Canadian Journal of Zoology-Revue Canadienne De Zoologie 89:419-434.<br />
Flannigan, M.D., K.A. Logan, B.D. Amiro, W.R. Skinner, and B.J. Stocks. 2005.<br />
Future area burned in <strong>Canada</strong>. Climatic Change 72:1-16.<br />
Forman, R. T. T. and L. E. Alexander. 1998. Roads and their major ecological<br />
effects. Annual Review of Ecology and Systematics 29:207-231.<br />
Forman, R.T.T., D. Sperling, J.A. Bissonette, A.P. Clevenger, C.C. Cutshal,<br />
V.H. Dale, L. Fahrig, R. France, C.R. Coldman, K. Heanue, J.A. Jones, W.J.<br />
Swanson, T. Turrentine, and T.C. Winter. 2003. Road Ecology: Science and<br />
Solutions. Washington, DC: Island Press.<br />
A Fork in the Road: Future Development in Ontario’s Far North<br />
53
Golder Associates Ltd. 2011. Recovery Strategy for Lake Sturgeon (Acipenser<br />
fulvescens) – Northwestern Ontario, Great Lakes-Upper St. Lawrence River<br />
and Southern Hudson Bay-James Bay populations in Ontario. Ontario Ministry<br />
of Natural Resources, Peterborough, Ontario. Available online at: http://www.<br />
mnr.gov.on.ca/en/Business/Species/2ColumnSubPage/STDPROD_086043.html<br />
Government of <strong>Canada</strong>. 2005. Victor Diamond Project Comprehensive Study<br />
Report.<br />
GreenForest Management Inc. 2010. Kenogami forest 2011-2012 Contingency<br />
Plan.<br />
Gunn, A., Johnson, C. J., J. S. Nishi, C. J. Daniel, D. E. Russell, M. Carlson,<br />
and J. Z. Adamczewski. 2011. Understanding the cumulative effects of human<br />
activities on barren-ground caribou. In: P. R. Krausman, L. K. Harris (eds.).<br />
Cumulative Effects in Wildlife Management: Impact Mitigation. CRC Press.<br />
Gunn, J.M., and R. Sein. 2000. Effects of forestry roads on reproductive habitat<br />
and exploitation of lake trout (Salvelinus namaycush) in three experimental<br />
lakes. Canadian Journal of Fisheries and Aquatic Sciences 57:97-104.<br />
Gunn, J., and E. Snucins. 2012. Brook charr mortalities during extreme temperature<br />
events in Sutton River, Hudson Bay Lowlands, <strong>Canada</strong>. Hydrobiologia<br />
650(1): 79-84.<br />
Hansen, L., J. Hoffman, C. Drew, and E. Mielbrecht. 2010. Designing climatesmart<br />
conservation: Guidance and case studies. Conservation Biology 24.<br />
Hearst Forest Management Inc. 2007a. Analysis Package for the Hearst Forest<br />
2007 Forest Management Plan.<br />
Hearst Forest Management Inc. 2007b. Forest Management Plan for the Hearst<br />
Forest.<br />
Hegmann, G., C. Cocklin, R. Creasey, S. Dupuis, A. Kennedy, L. Kingsley,<br />
W. Ross, H. Spaling, and D. Stalker. 1999. Cumulative Effects Assessment<br />
Practitioners Guide. Prepared by AXYS Environmental Consulting Ltd. And<br />
the CEA Working Grouop for the Canadian Environmental Assessment Agency,<br />
Hull, Quebec.<br />
Jackfish River Management Ltd. 2011. Forest Management Plan for the<br />
Nagagami S.F.L. 550047. Prepared on behalf of Nagagami Forest Management<br />
Ltd.<br />
Johnson, C. J. 2011. Regulating and Planning for Cumulative Effects - The<br />
Canadian Experience. Pages 29-46 in P. R. Krausman and L. K. Harris, editors.<br />
Cumulative effects in wildlife management : impact mitigation. CRC Press,<br />
Boca Raton, FL.<br />
Johnson, C. J., M. S. Boyce, R. L. Case, H. D. Cluff, R. J. Gau, A. Gunn, and<br />
R. Mulders. 2005. Cumulative Effects of Human Developments on Arctic<br />
Wildlife. Ecological Monographs 160:36.<br />
Jokinen, M. 2004. Habitat suitability index model for the wolverine (Gulo<br />
gulo). Pp. 115-135 in Blouin, F., B.N. Taylor, and R.W. Quinlan (eds). 2004.<br />
The southern headwaters at risk project: A multi-species conservation strategy<br />
for the headwaters of the Oldman River. Volume 2: Species Selection and<br />
Habitat Suitability Models. Alberta Sustainable Resource Development, Fish<br />
and Wildlife Division, Alberta Species at Risk Report No. 90, Edmonton, AB.<br />
Jordann, S.M., D.W. Keith, and B. Stelfox. 2009. Quantifying land use of oil<br />
sands production: a life cycle perspective. Environmental Research Letters 4:1-<br />
15.<br />
54 Canadian Boreal Initiative | Wildlife Conservation Society <strong>Canada</strong>
Knight Piesold Consulting. 2011. Noront Resources Ltd. Eagle’s Nest Project:<br />
Project Description. Ref. No. NB102-390/1-2.<br />
Krawchuk, M, K. Lisgo, S. Leroux, S. Vernier, S.Cumming, and F. Schmiegelow.<br />
2012. Boreal Forest, <strong>Canada</strong>. Chapter 6 in Hilty, J., C.C. Chester, and M.S.<br />
Cross (eds), Climate and Conservation: Landscape and Seascape Science,<br />
Planning, and Action. Island Press, Washington. DC<br />
KWG Resources Inc. 2011. KWG Reports Positive Preliminary Economic<br />
Assessment of Big Daddy. Available online at: http://www.kwgresources.com/<br />
news/index.php?&content_id=277.<br />
Leroux, S.J., Schmiegelow, F.K.A., Cumming, S.G., Lessard, R.B., and Nagy,<br />
J. 2007. Accounting for system dynamics in reserve design. Ecological<br />
Applications 17:1954-1966.<br />
Magurran, A.E. 2009. Threats to freshwater fish. Science. 325: 1215-1216.<br />
Marshall, T. R. and N. E. Jones. 2011. Aquatic Ecosystems in the Far North of<br />
Ontario State of Knowledge. Ontario Ministry of Natural Resources.<br />
McDermid, J. L., K. M. Wozney, S. L. Kjartanson, and C. C. Wilson. 2011.<br />
Quantifying historical, contemporary, and anthropogenic influences on the<br />
genetic structure and diversity of lake sturgeon (Acipenser fulvescens) populations<br />
in northern Ontario. Journal of Applied Ichthyology 27:12-23.<br />
McLoughlin, P. D., R. L. Case, R. J. Gau, H. D. Cluff, R. Mulders, and F.<br />
Messier. 2002. Hierarchical habitat selection by barren-ground grizzly bears in<br />
the central Canadian Arctic. Oecologia 132:102-108.<br />
Ministry of Natural Resources and Neenah Paper Company of <strong>Canada</strong>. 2005.<br />
Forest Management Plan for the Kenogami Forest.<br />
National Research Council. 2005. Assessing and managing the ecological<br />
impacts of paved roads. The National Academies Press, Washington.<br />
Ontario’s Ministry of Energy. 2010. Ontario’s Long Term Energy Plan.<br />
Available online at: http://www.energy.gov.on.ca/en/ltep/<br />
OMNR. 2012. Caribou Conservation Plan – The Ontario Government’s<br />
Response to the provincial Woodland Caribou Recovery Strategy. Available<br />
online at: http://www.mnr.gov.on.ca/stdprodconsume/groups/lr/@mnr/@species/documents/document/stdprod_094909.pdf<br />
OMNR. 2009. Caribou Conservation Plan. Available online at: http://www.<br />
mnr.gov.on.ca/en/Business/Species/2ColumnSubPage/249504.html<br />
Ontario Wolverine Recovery Team. 2011. DRAFT Recovery Strategy for the<br />
Wolverine (Gulo gulo) in Ontario. Ontario Ministry of Natural Resources,<br />
Peterborough, ON.<br />
OPA. 2005. Supply Mix Background Reports. Volume 3. Available online:<br />
http://www.powerauthority.on.ca/Report_Static/1142.htm.<br />
OPA. 2006. Discussion Paper 5: Transmission. Ontario’s Integrated Power<br />
System Plan.<br />
OPA. 2007. Supply – Renewable Resources. EB-2007-0707, Exhibit D, Tab<br />
5, Schedule 1 from the Integrated Power System Plan. Available online: http://<br />
www.powerauthority.on.ca/Page.asp?PageID=122&ContentID=6214&SiteNo<br />
deID=320&BL_ExpandID=.<br />
Peterson, G.D., G.S. Cumming, and S.R. Carpenter. 2003. Scenario planning:<br />
a tool for conservation in an uncertain world. Conservation Biology 17(2):<br />
358-366.<br />
A Fork in the Road: Future Development in Ontario’s Far North<br />
55
Rempel, R.S., P.C. Elkie, A.R. Rodgers, and M.J. Gluck. 1997. Timbermanagement<br />
and natural-disturbance effects on moose habitat: landscape<br />
evaluation. Journal of Wildlife Management 61(2).<br />
Rempel, R.S., J. Baker, P.C. Elkie, M.J. Gluck, J. Jackson, R.S. Kushneriuk, T.<br />
Moore, and A.H. Perera. 2007. Forest Policy Scenario Analysis: Evaluating the<br />
Effectiveness of Coarse-Filter Policy Options on Conserving Forest Songbird<br />
Communities. Technical Report CNFER TR-002. Ontario Ministry of Natural<br />
Resources, Centre for Northern Forest Ecosystem Research, Thunder Bay,<br />
Ontario, <strong>Canada</strong>.<br />
Rempel, R.S. 2011. Effects of climate change on moose populations: exploring<br />
the response horizon through biometric and systems models. Ecological<br />
Modelling 222:3355-3365.<br />
Revenga, C., Brunner, J., Henninger, N., Kassem, K., and Payne, R. 2000.<br />
Pilot analysis of global ecosystems: freshwater ecosystems. World Resources<br />
Institute, Washington D.C.<br />
Rowland, M.M., M.J. Wisdom, D.H. Johnson, B.C. Wales, J.P. Copeland, and<br />
F.B. Edelmann. 2003. Evaluation of landscape models for wolverines in the<br />
interior northwest, United States of America. Journal of Mammalogy 84(1):<br />
92-105.<br />
Rudolph, T.D., P. Drapeau, M-H. St-Laurent, and L. Imbeau. 2012. Status of<br />
Woodland Caribou (Rangifer tarandus caribou) in the James Bay Region of<br />
Northern Quebec. Scientific <strong>report</strong> presented to the Ministère des Ressources<br />
naturelles et de la Faune du Québec and the Grand Council of the Crees (Eeyou<br />
Istchee). Montreal, QC.<br />
Schaefer, J.A. 2003. Long-term range recession and the persistence of caribou<br />
in the taiga. Conservation Biology 17: 1435-1439.<br />
Schmiegelow, F. K. A., S. G. Cumming, S. Harrison, S. Leroux, K. Lisgo,<br />
R. Noss, and B. Olsen. 2006. Conservation Beyond Crisis Management: A<br />
Reverse-Matrix Model – a Discussion Paper for the Canadian BEACONs<br />
Project., University of Alberta, Edmonton, Alberta.<br />
Schneider, R.R., J.B. Stelfox, S. Boutin, and S. Wasel. 2003. Managing the<br />
cumulative impacts of land-uses in the Western Canadian Sedimentary Basin: A<br />
modeling approach. Conservation Ecology 7(1): 8. [online] URL: http://www.<br />
consecol.org/vol7/iss1/art8/<br />
Schneider, R.R., M.C. Latham, B. Stelfox, D. Farr, and S. Boutin. 2010. Effects<br />
of a severe mountain pine beetle epidemic in western Alberta, <strong>Canada</strong> under<br />
two forest management scenarios. International Journal of Forestry Research.<br />
Shanley, C.S., and Pyare, S. 2011. Evaluating the road-effect zone on wildlife<br />
distribution in a rural landscape. Ecosphere 2:art16. [doi:10.1890/ES10-<br />
00093.1]<br />
Statistics <strong>Canada</strong>. 2006. 2006 Census of Population. Available online at http://<br />
www12.statcan.ca/census-recensement/2006/dp-pd/index-eng.cfm.<br />
Sullivan, M.G. 2006. Introduction to the Concept of Index of Native Fish<br />
Integrity. Unpublished <strong>report</strong>.<br />
Tembec. 2010. Contingency Forest Management Plan for the Gordon Cosens<br />
Forest.<br />
Tembec. 2008. Analysis Package for: Gordon Cosens Forest Management Unit<br />
438 2010-2020 Forest Management Plan.<br />
56 Canadian Boreal Initiative | Wildlife Conservation Society <strong>Canada</strong>
Ter-Mikaelian, M. T., S. J. Colombo, and J. Chen. 2009. Estimating natural<br />
forest fire return interval in northeastern Ontario, <strong>Canada</strong>. Forest Ecology and<br />
Management 258: 2037-2045.<br />
Tollinsky, N. 2010. Ontario Ring of Fire chromite mine operator still to be<br />
determined. Sudbury Mining Solutions Journal, March 2010.<br />
Varrin, R., J. Bowman, and P. A. Gray. 2007. The Known and Potential Effects<br />
of Climate Change on Biodiversity in Ontario’s Terrestrial Ecosystems: Case<br />
Studies and Recommendations for Adaptation. Climate Change Research<br />
Report CCRR-09, Queen’s Printer for Ontario.<br />
Vors, L.S., J.A. Schaefer, B.A. Pond, A.R. Rodgers and B.R. Patterson. 2007.<br />
Woodland caribou extirpation and anthropogenic landscape disturbance in<br />
Ontario. Journal of Wildlife Management 71:1249-1256.<br />
Wärnbäck, A., and T. Hilding-Rydevik. 2009. Cumulative effects in Swedish<br />
EIA practice—Difficulties and obstacles. Environmental Impact Assessment<br />
Review 29:107–115.<br />
World Resources Institute. 2010. Map of the state of the world’s forests.<br />
Available online: http://www.wri.org/map/state-worlds-forests<br />
A Fork in the Road: Future Development in Ontario’s Far North<br />
57
Appendix 1.<br />
Overview of ALCES®<br />
The ALCES land-use simulation model and its companion mapping<br />
tool (ALCES Mapper) provide strategic land-use planning guidance<br />
by examining inter-relationships among the <strong>full</strong> range of relevant<br />
land-use sectors and natural disturbances, and exploring their environmental<br />
and socioeconomic consequences at large temporal and<br />
spatial scales. The model was first developed by Dr. Brad Stelfox<br />
in the mid 1990’s in Alberta, and has gradually expanded in scope<br />
to meet the needs of various regional planning initiatives in North<br />
America and beyond. The following description provides an overview<br />
of ALCES structure and function (Figure 17). More details can<br />
be found on the ALCES Group website (www.alces.ca), including<br />
<strong>report</strong>s and publications describing projects where ALCES has been<br />
applied.<br />
To achieve a synoptic view of regional cumulative effects, a widerange<br />
of land uses and ecological processes are incorporated into<br />
the model as drivers. The various land uses and ecological processes<br />
can be turned on or off depending on the needs of the scenario<br />
analysis. For each land use operating in a region, the user defines<br />
development rates, the portion of the landscape available for development,<br />
and management practices such as the intensity and lifespan<br />
of associated footprints. The influence of natural disturbances<br />
(e.g., fire) and plant succession on landscape composition are also<br />
tracked. Hydrological processes can also be addressed with surface<br />
and groundwater modules, and climate change effects can be incorporated<br />
by defining temporal changes in natural disturbances rates,<br />
successional trajectories, land cover, meteorology and hydrology.<br />
The first-order effects tracked by ALCES are landscape composition<br />
and resource production/supply. Using an annual time-step, the<br />
model modifies the area and length of up to 20 land cover and 15<br />
anthropogenic footprint types in response to natural disturbances,<br />
succession, landscape conversion, reclamation of footprints, and<br />
creation of new footprints associated with simulated land-use trajectories.<br />
ALCES also tracks resource production and supply using<br />
approaches that are typical of sector-specific models such as timber<br />
58 Canadian Boreal Initiative | Wildlife Conservation Society <strong>Canada</strong>
supply. Landscape composition and resource production attributes<br />
are translated into indicator variables using coefficients. A wide range<br />
of indicators are typically tracked so that trade-offs between diverse<br />
ecological and socioeconomic objectives can be assessed. Examples<br />
of indicators that can be tracked by ALCES include wildlife habitat<br />
and populations, water quality and quantity, biotic carbon storage,<br />
air emissions, employment, and gross domestic product.<br />
Maps illustrating the plausible future condition of landscapes and<br />
indicators are created using ALCES Mapper, a companion tool to<br />
ALCES that exists as an ArcGIS application. Mapper allows users to<br />
specify the general location (i.e., where specified land-use footprints<br />
can or cannot occur) and pattern (e.g., dispersed versus contagious)<br />
of future development. This feature provides flexibility to map transformations<br />
of landscapes through time according to different spatial<br />
rules, and is useful for visualizing the implications of different zoning<br />
or resource utilization strategies. Maps of future landscape condition<br />
can then be analyzed to evaluate the spatial response of indicators<br />
such as wildlife habitat to potential future landscapes associated<br />
with land-use scenarios.<br />
Figure 17. Overview of the ALCES land use simulation tool.<br />
A Fork in the Road: Future Development in Ontario’s Far North<br />
59
Appendix 2.<br />
The Conservation<br />
Matrix Model<br />
(with Dr. Hilary Cooke, <strong>WCS</strong> <strong>Canada</strong>)<br />
The Conservation Matrix Model is a novel approach to conservation<br />
planning developed for <strong>Canada</strong>’s boreal region by the BEACONs<br />
(Boreal Ecosystem Analysis for Conservation Networks) research<br />
team at University of Alberta (Edmonton, <strong>Canada</strong>) and Université<br />
Laval (Montreal, <strong>Canada</strong>) (Schmiegelow et al. 2006). The model<br />
was developed specifically for the large, relatively intact landscapes<br />
of <strong>Canada</strong>’s boreal region and the natural disturbance regimes that<br />
drive change over space and time (Krawchuck et al. 2012). The<br />
premise of the model is to integrate systematic conservation planning<br />
with opportunities for sustainable resource use and adaptive<br />
resource management and thus facilitate integrated conservation<br />
planning over large regions.<br />
The conservation-matrix concept includes four landscape elements<br />
(Figure 18), which together achieve the goal of adaptive resource<br />
management while ensuring maintenance of ecological flows across<br />
the landscape, such as movements of organisms, water, and nutrients,<br />
under the uncertainty of natural disturbance regimes.<br />
Active Management Areas are islands of relatively intense human<br />
development, e.g. human settlements, forestry, mining, agriculture,<br />
and the associated infrastructure. Active Management Areas are<br />
embedded in a Conservation Matrix ‘sea’. The emphasis is on deciding<br />
limits to development and care<strong>full</strong>y managing for less-intense<br />
human activities within the Conservation Matrix. Thus, activities<br />
within the Matrix, such as recreation or hunting, are to be care<strong>full</strong>y<br />
planned and managed in an integrated fashion so as not to erode<br />
other values, such as ecosystem and landscape connectivity.<br />
60 Canadian Boreal Initiative | Wildlife Conservation Society <strong>Canada</strong>
Figure 18. The Conservation matrix model (credit BEACONs).<br />
Ecological Benchmark Areas (BA) are the foundation of the<br />
Conservation Matrix Model. These are relatively intact areas (i.e.<br />
with little or no human footprint) representative of natural environmental<br />
variation and sufficiently large to support natural ecosystem<br />
dynamics (specifically fire), ecologically functional wildlife<br />
populations, and maintain terrestrial and hydrologic connectivity<br />
(Schmiegelow et al. 2006, Krawchuk et al. 2012). Leroux et al.<br />
(2007) argue that, ‘considering natural disturbance in reserve design<br />
may be especially important for the world’s remaining intact areas,<br />
which still experience active natural disturbance regimes. Thus, BA<br />
design is intended to encompass the <strong>full</strong> natural variability of ecosystem<br />
structure and process, including fire and hydrologic regimes,<br />
and conserve biodiversity at all levels. A single BA will not be able to<br />
encompass all values of a planning region and thus a network of BAs<br />
is identified and which functions as a network of core protected areas<br />
for a region. A key component of the Conservation Matrix Model<br />
is incorporating opportunities for adaptive resource management<br />
into planning for intact landscapes. BAs are also intended to serve as<br />
reference or control sites for understanding the natural dynamics of<br />
ecosystems and their response to human activities, within an adaptive<br />
resource management framework.<br />
The final element identified in the landscape are Additional Reserves.<br />
These site-specific protected areas are identified to capture values<br />
that may not be well represented within benchmark areas, such as<br />
areas of cultural significance, rare species occurrences, ecosystems of<br />
conservation concern, etc.<br />
A Fork in the Road: Future Development in Ontario’s Far North<br />
61
Appendix 3.<br />
OMNR’s Cervid<br />
Management Zones 48<br />
48<br />
http://www.mnr.gov.on.ca/stdprodconsume/groups/lr/@mnr/@fw/documents/document/263997.pdf<br />
62 Canadian Boreal Initiative | Wildlife Conservation Society <strong>Canada</strong>
www.borealcanada.ca www.wcscanada.org
![RaLand / SeaScape [PDF] - Wildlife Conservation Society](https://img.yumpu.com/49974326/1/190x245/raland-seascape-pdf-wildlife-conservation-society.jpg?quality=85)