July - Summer Edition - CI Investments
July - Summer Edition - CI Investments
July - Summer Edition - CI Investments

Create successful ePaper yourself
Turn your PDF publications into a flip-book with our unique Google optimized e-Paper software.
www.ci.com/perspective<br />
<strong>Summer</strong> 2011<br />
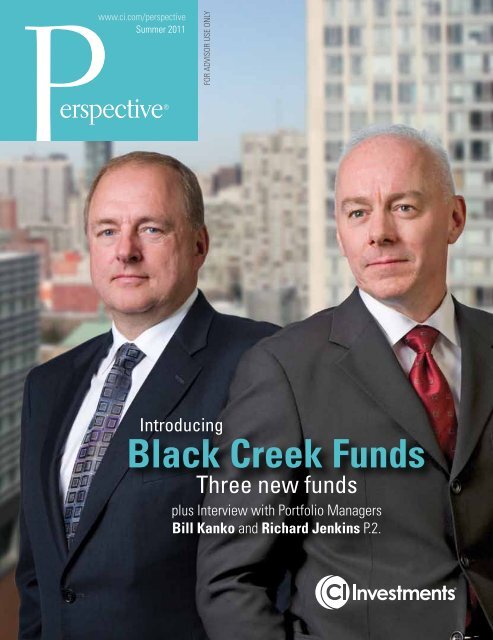
Introducing<br />
Black Creek Funds<br />
Three new funds<br />
plus Interview with Portfolio Managers<br />
Bill Kanko and Richard Jenkins P.2.
Table of contents<br />
Message from Derek J. Green 1<br />
Market Update<br />
Introducing Black Creek Funds 2<br />
Book reviews 7<br />
Portfolio Snapshot – Cambridge Funds 14<br />
Signature Market Roundup 20<br />
Managers’ Commentary 28<br />
<strong>CI</strong> Investment Consulting 28<br />
Black Creek Investment Management 30<br />
Harbour Advisors 32<br />
Cambridge Advisors 34<br />
Tetrem Capital Management Ltd. 35<br />
Scorecard 71<br />
<strong>CI</strong> Corporate Class 72<br />
Signature Funds 73<br />
Harbour Funds ® 73<br />
Synergy Funds 74<br />
<strong>CI</strong> Funds ® 74<br />
Portfolio Series 74<br />
Portfolio Select Series 75<br />
Insight ® Units/Shares 75<br />
Hedge Funds 75<br />
Labour-sponsored Funds 76<br />
<strong>CI</strong> GIFs 77<br />
<strong>CI</strong> Segregated Funds 78<br />
Legacy Segregated Funds ® I & II 78<br />
Clarica MVP Segregated Funds 79<br />
Clarica Portfolio Segregated Funds 80<br />
SunWise ® I 82<br />
SunWise ® II 83<br />
SunWise ® Elite 91<br />
SunWise ® Essential Series 96<br />
<strong>CI</strong> Sales Team 100<br />
Globefund profiles as at June 30, 2011 38<br />
Portfolio Series<br />
Portfolio Series Income Fund 39<br />
Portfolio Series Conservative Fund 40<br />
Portfolio Series Conservative Balanced Fund 41<br />
Portfolio Series Balanced Fund 42<br />
Portfolio Series Balanced Growth Fund 43<br />
Portfolio Series Growth Fund 44<br />
Portfolio Series Maximum Growth Fund 45<br />
Global Equity Funds<br />
Cambridge Global Equity Corporate Class 46<br />
<strong>CI</strong> Global Fund 47<br />
<strong>CI</strong> Global High Dividend Advantage Fund 48<br />
Harbour Foreign Equity Corporate Class 49<br />
Synergy Global Corporate Class 50<br />
<strong>CI</strong> International Value Fund 51<br />
<strong>CI</strong> Emerging Markets Fund 52<br />
American Equity Funds<br />
<strong>CI</strong> American Managers ® Corporate Class 53<br />
<strong>CI</strong> American Value Corporate Class 54<br />
Canadian Equity Funds<br />
Cambridge Canadian Equity Corporate Class 55<br />
<strong>CI</strong> Canadian Investment Fund 56<br />
Harbour Fund 57<br />
Signature Select Canadian Fund 58<br />
Synergy Canadian Corporate Class 59<br />
Balanced Funds<br />
Cambridge Canadian Asset Allocation Corp. Class 60<br />
Harbour Growth & Income Fund 61<br />
Signature Income & Growth Fund 62<br />
Signature Canadian Balanced Fund 63<br />
Industry-specific Funds<br />
Signature Canadian Resource Fund 64<br />
Signature Global Energy Corporate Class 65<br />
Income Funds<br />
Signature Canadian Bond Fund 66<br />
Signature Dividend Fund 67<br />
Signature High Income Fund 68<br />
Signature Diversified Yield Fund 69<br />
Signature Corporate Bond Fund 70<br />
For Advisor Use Only
<strong>Summer</strong> 2011<br />
Dear Advisor,<br />
<strong>CI</strong> <strong>Investments</strong> is pleased<br />
to announce the launch<br />
of the Black Creek<br />
funds, which offer you<br />
the proven investment<br />
expertise of Bill Kanko<br />
and Richard Jenkins of<br />
Black Creek Investment<br />
Management.<br />
The three new funds – Black Creek Global Leaders Corporate<br />
Class, Black Creek International Equity Corporate Class and<br />
Black Creek Global Balanced Corporate Class – provide<br />
you and your clients with compelling new global investment<br />
options at <strong>CI</strong>.<br />
Bill and Richard have consistently produced excellent results<br />
in their long careers as money managers. Since 2006, Black<br />
Creek has managed portfolios for our Castlerock <strong>Investments</strong><br />
affiliate, outperforming their benchmarks and peer group.<br />
The new funds now provide you with access to Black<br />
Creek through the <strong>CI</strong> platform and with the benefits of the<br />
<strong>CI</strong> Corporate Class structure.<br />
The Black Creek managers will use the same successful<br />
approach used with their Castlerock funds. For more<br />
information about the Black Creek team and the new funds,<br />
please see the interview starting on page 2. For current<br />
information on Black Creek’s Castlerock funds, please visit<br />
www.castlerockinvestments.ca.<br />
We believe that this fund launch is especially timely, given that<br />
the Canadian market has performed very well in recent years.<br />
As a result, some client portfolios may be overweight Canada,<br />
requiring an increased allocation to global investments to<br />
enhance diversification and reduce risk.<br />
Consider that during the second quarter, the Canadian stock<br />
market performed significantly worse than the U.S. and broad<br />
global market indexes. The S&P/TSX Composite Index<br />
declined 10% from April to June before rebounding at the<br />
end of June to reduce its quarterly loss to 5.2%. This action<br />
was driven primarily by a pullback in the resource sectors,<br />
which now account for a 50% weighting on the index.<br />
In addition to the Black Creek funds, <strong>CI</strong> offers a rich selection<br />
of global funds, including Signature Select Global Fund,<br />
Harbour Foreign Equity Corporate Class, Cambridge Global<br />
Equity Corporate Class, <strong>CI</strong> Global High Dividend Advantage<br />
Fund and <strong>CI</strong> International Value Fund. Our lineup also<br />
includes globally oriented balanced and income funds, such<br />
as Signature Diversified Yield Fund.<br />
In other news, we have made our first addition to the Harbour<br />
family of funds since 2002 with the launch of Harbour<br />
All Cap Corporate Class. This fund offers the conservative,<br />
value-oriented approach of the Harbour team in a flexible<br />
mandate investing primarily in Canadian companies, with no<br />
restrictions on market capitalization.<br />
Also available now are the Fund Facts documents for <strong>CI</strong>’s<br />
mutual funds. Fund Facts are a regulatory requirement and<br />
provide fund information such as holdings, past performance<br />
and costs of investing. <strong>CI</strong>’s Fund Facts can be accessed<br />
through a link on our home page (under What’s New) or by<br />
going directly to www.fundfacts.com.<br />
The new funds now provide you with<br />
access to Black Creek through the<br />
<strong>CI</strong> platform and with the benefits of<br />
the <strong>CI</strong> Corporate Class structure.<br />
We have other intiatives planned for this fall to help you build<br />
your business. These include a revised investment program<br />
for high net worth clients and extensive information from our<br />
portfolio managers through meetings, roadshows, webcasts<br />
and podcasts.<br />
In the meantime, you can find manager commentary and<br />
other information in this issue of Perspective, as well as on<br />
our website, www.ci.com. And, as always, feel free to contact<br />
your <strong>CI</strong> Sales Team.<br />
Wishing you and your family a safe and enjoyable summer,<br />
Derek J. Green<br />
President<br />
<strong>CI</strong> <strong>Investments</strong><br />
SUMMER 2011 PERSPECTIVE AS AT JUNE 30, 2011 1
Introducing Black Creek<br />
Black Creek Q&A<br />
Introducing Black Creek funds<br />
Black Creek funds – managed by Bill Kanko and<br />
Richard Jenkins – are now available on the <strong>CI</strong><br />
platform. The <strong>CI</strong> Black Creek funds are investing in units<br />
of their equivalent Castlerock funds, so the investment<br />
mandates and underlying portfolios are the same. However,<br />
the <strong>CI</strong> Black Creek funds are part of the <strong>CI</strong> Corporate<br />
Class structure, which provides investors with several tax<br />
advantages. And, by being on the <strong>CI</strong> platform, it is easier for<br />
existing <strong>CI</strong> investors to access the funds.<br />
Black Creek Global Leaders Corporate Class is a<br />
global equity fund with a concentrated portfolio of 20-25<br />
high-quality, globally competitive companies.<br />
Black Creek International Equity Corporate Class<br />
invests in companies domiciled in countries outside of<br />
Canada and the United States, including companies located<br />
in emerging markets. It may also invest in small, medium<br />
and large-cap companies. As with Global Leaders the<br />
portfolio will be concentrated with 20-25 holdings.<br />
The equity portion of Black Creek Global Balanced<br />
Corporate Class invests in a diversified portfolio of<br />
globally competitive companies within growing sectors.<br />
While the debt portion of the fund invests primarily in<br />
government and corporate bonds, it may also include highyield<br />
bonds.<br />
Together, Bill Kanko and Richard Jenkins of<br />
Black Creek Investment Management have<br />
been managing global portfolios for more<br />
than a half a century. Here they discuss their<br />
investment approach that has led to excellent<br />
results in Castlerock Global Leaders Fund,<br />
Castlerock International Equity Fund and<br />
Castlerock Global Balanced Fund<br />
[Q] You stress “unique insights, proprietary ideas” as<br />
part of your investment philosophy. Can you explain?<br />
KANKO: We chose “unique insights, proprietary ideas”<br />
as something that best represents what we do in terms of<br />
investment style and philosophy. There is a lot of information<br />
available in the market – but no informational advantage<br />
to any one investor. The advantage comes with how the<br />
information is used to make decisions. We piece together<br />
bits of information to form a view of a company that other<br />
investors aren’t recognizing. If we have a unique insight about<br />
a company, it might end up as an idea in the portfolio. We<br />
base it on the valuation of the business and our insight – but<br />
it really means having a view of something that the rest of the<br />
market doesn’t. Coming up with our thesis can sometimes<br />
take a relatively short period – a week or two – and sometimes<br />
we study a company for months or years.<br />
JENKINS: We create an insight and follow with an idea, but<br />
that needs to work in order for us to achieve returns higher<br />
than the market. Over time, we judge whether or not the<br />
thesis is working. If it is, we stay with the investment, but if we<br />
judge that something has changed, then we sell and move on.<br />
[Q] You talk about investing in leading companies. How<br />
do you define a leading company?<br />
JENKINS: We focus on companies, but part of analyzing a<br />
business is to look at the industry structure – the nature of the<br />
industry they’re in – whether or not it’s easy to enter or difficult<br />
to exit, the nature of competition, and technological changes.<br />
2 SUMMER 2011 PERSPECTIVE AS AT JUNE 30, 2011
Introducing Black Creek<br />
That gives us a sense of how a company is positioned. To us,<br />
it means that they’re leading in market share and growing<br />
market share faster than the competition. In our judgment,<br />
it’s essentially a company that’s going to outpace its industry.<br />
In general, those companies typically have significantly<br />
higher long-term profits and sustainable positions. Our view<br />
may not be the common view, but over time, we feel that<br />
they’re going to do much better than other companies.<br />
A good example is Adidas. We invested in it over a decade ago<br />
when it was viewed as not being as strong as Nike. At the time,<br />
Adidas was a well-known brand that had suffered for lack of<br />
investment. However, it had new management with a lot of<br />
brand experience and there were tailwinds for the industry,<br />
such as demographics. Over the years, they have done a<br />
really great job of rebuilding the brand, taking market share<br />
and building it up in different parts of the world. It’s now to<br />
the point where they’re growing just as fast as Nike. It’s a good<br />
example of identifying a leading company before everyone else<br />
figured that out. Hence, the idea was unique and proprietary.<br />
KANKO: The flip side is also true. If it’s a widely held view<br />
that a company is a leading in its field and the prospects look<br />
great, and we don’t have any view that’s different than the<br />
market view, then we might choose not to own it. A portfolio<br />
is not just what you own – it’s also what you don’t.<br />
[Q] Are there any themes that run through your portfolios?<br />
KANKO: We are not “thematic” investors, but we are<br />
certainly aware of the big picture and the trends and issues<br />
that might impact our investments. For example, we stay on<br />
top of technology and how it could affect various companies<br />
– either positively or negatively. As investors, we are very<br />
conscious of the threat to manufacturers from low-priced<br />
Chinese and Korean suppliers. Another area we follow are<br />
companies that are dependent on government financing or<br />
subsidies because these might have more difficulty in the<br />
future because of the fiscal position of governments. There<br />
are a host of other factors that we consider which could<br />
present investment opportunities or risks.<br />
[Q] The Black Creek portfolios are concentrated –<br />
generally only 20–25 companies. How do you achieve<br />
diversification with such a concentrated portfolio?<br />
JENKINS: From financial theory perspective, 20 to<br />
25 companies is statistically more than enough to achieve<br />
diversification – so long as the businesses are in different<br />
geographies and industries and exposed to different<br />
economic effects. We make sure our portfolio is diversified,<br />
but in the end there has to be someone making decisions<br />
about a portfolio. In order to understand the businesses at<br />
great length, you need to study them, follow them, build<br />
a thesis, and then track them. It’s impossible to do that as a<br />
decision maker if you have100 or 200 companies. No one can<br />
know that many companies in depth. The Black Creek team<br />
is four people. Inside our firm there are about 35 holdings.<br />
Divided by four people, that’s roughly 8 to 9 each. On average,<br />
each person is looking at 10 to 12 companies, and with our<br />
turnover rate of between 20% and 30%, each person is buying<br />
two or three stocks a year. In addition, the discipline of having<br />
20 to 25 companies forces us to make choices between<br />
something that’s good and something that’s even better – which<br />
is hard to do as an investor. It might mean selling something<br />
that’s still undervalued to buy something more undervalued.<br />
In the long run, it ensures that we’re always upgrading the<br />
portfolio. We are always selling our least preferred idea to buy<br />
our most preferred one.<br />
[Q] What are the benefits of a focused portfolio?<br />
KANKO: The biggest benefit of having a focused portfolio is<br />
that it keeps you from getting overly diversified and becoming<br />
like the market. We think that if our investment approach is<br />
correct and we execute properly, we should focus our efforts<br />
on a select group of companies. The shorter list also helps<br />
us stay on top of the companies better and know them a<br />
little better than our competitors. Lastly, it promotes a sell<br />
discipline. If we find a new idea that we like, we have to make<br />
room in the portfolio for it by selling our least favourite idea.<br />
[Q] How do you make that decision to buy or sell one<br />
company instead of another?<br />
KANKO: The selling goes along with the buy process. It’s<br />
having a unique view that is different from everyone else –<br />
and a picture of the company looking out five or 10 years. We<br />
then determine what we think the company is worth based on<br />
that view. If we think it’s worth substantially more than what<br />
the market says, it becomes an idea. That’s how we build the<br />
portfolio. We find 20 or 25 of those ideas, and then the sell<br />
process just follows. If we find something else that we think<br />
is a good idea, we have to make room for it by selling our<br />
least favourite idea. Anything we look at has to compare with<br />
everything we already own. Ideally, we sell to make room for<br />
a new holding, and that maintains the discipline of a focused,<br />
concentrated portfolio. We also sell if there’s a significant<br />
negative change in the business that we think is ongoing, or if<br />
the price gets too high.<br />
SUMMER 2011 PERSPECTIVE AS AT JUNE 30, 2011 3
Introducing Black Creek<br />
JENKINS: Sometimes an event happens – let’s say a competitor<br />
gets taken over and everything goes up – so we decide, “Okay,<br />
everything positive we can think about that could happen to<br />
this company has happened, so it’s time to move on.”<br />
[Q] Let’s talk about some of your current and previous<br />
holdings and why you bought and sold them.<br />
JENKINS: I’m going to talk about Publicis – a French<br />
company that leads in different advertising markets around<br />
the world. It’s number one in advertising, media planning<br />
and buying, and an industry leader in digital media, such<br />
as Web ads. We bought it in 2008 when cyclically many<br />
of their customers were cutting back on advertising. Since<br />
automobiles are a very large portion of media advertising,<br />
the concern was with General Motors and Chrysler going<br />
bankrupt. At Publicis, auto advertising accounted for<br />
significant revenues and market sentiment was that the<br />
company would have bad accounts receivable from the auto<br />
firms. As we did our work, we discovered that the accounts<br />
receivable to Publicis from these two firms was less than the<br />
upfront deposits they had already made to buy media for the<br />
following year. As we thought about it, we assumed that even<br />
if they went bankrupt, it would be interesting for them to<br />
try to get their money back from Publicis. We came to the<br />
conclusion that the market had overdone it.<br />
The second part of our thesis was that as we came out of this<br />
downturn, the battle for market share was actually going to<br />
be at a higher level than it was before the recession. That’s<br />
because company balance sheets would be very clean. In<br />
addition, we were seeing the emergence of competitors from<br />
emerging markets. Companies like Jaguar and Volvo were<br />
being rejuvenated by India’s Tata Motors and China’s Geely<br />
Automobile Holdings. Our view was that competition in<br />
advertising would snap back faster and be more intense than<br />
it was before the downturn. Recently, we had Publicis’ largest<br />
competitor in our office and they were surprised at how fast<br />
the market snapped back. Our thesis is now playing out.<br />
KANKO: It goes back to our unique insights and how we<br />
generate ideas. Years ago, I owned Canon and for me, it was<br />
always an Internet idea because the Internet was changing<br />
the print model. Instead of printing glossy brochures centrally<br />
and distributing them, companies could easily distribute the<br />
information electronically and then print at any location.<br />
Canon owned the desktop. They had an 80% market<br />
share of laser print engines, plus bubble jet printers,<br />
and camera printers. Since the Internet was driving the local<br />
print business, it benefited Canon and its ability to sell ink.<br />
Then, three or four years ago, we started using Adobe Acrobat<br />
in our office. Almost everything we do is in electronic form.<br />
We started thinking about the prospects for a paperless world<br />
as technology became cheaper. In 2009, Adobe went from<br />
US$50 down to less than US$17. That was the genesis of the<br />
idea. We sold Canon and bought Adobe. Adobe is a follow up<br />
on the Canon idea.<br />
[Q] How do you manage risk?<br />
KANKO: We define risk as permanent impairment of capital<br />
– not volatility of share price. We focus on businesses and<br />
how they act in different environments. Typically, we buy<br />
companies dramatically below what we think it’s worth. We<br />
have 25 holdings and make sure they are not all in the same<br />
geography and industry. Then we go through an exercise,<br />
such as, “What happens if commodity prices are higher than<br />
what we expect? Can our companies increase prices? If they<br />
can’t, who gets hurt? Who gets hurt by low interest rates?<br />
Who gets hurt by different economic factors?”<br />
[Q] As investors, Black Creek measures itself over a<br />
10-year horizon. Why?<br />
JENKINS: The reason we use 10 years is because we want<br />
to understand how that business does throughout an entire<br />
business cycle. If it has two or three years where it does great<br />
and eight that do poorly – it’s a bad investment. As investors,<br />
we want to be in businesses that over a 10-year period are<br />
growing value for their shareholders. For example, if I’m<br />
buying a business that is cyclical, and we’re at year six of an<br />
expansion, and I’m using a 10-year view, then I’m putting a<br />
recession in the next two or three years, which is presumably<br />
going to be reflected in the price. If I’m in the middle of a<br />
recession, and I’m doing a 10-year analysis, it’s likely that the<br />
next recession isn’t for another eight to 10 years – again, it<br />
should be reflected in the price. The point is to make sure<br />
you differentiate between cyclical growth and real growth.<br />
This is the problem right now because we’re coming out of a<br />
big downturn, where lots of things look like they’re growing<br />
quickly. But we are about to shift down. Over the next year or<br />
so, we’re going to find out who is really growing.<br />
KANKO: If you’re focused on the long term, you see things<br />
differently when you speak to companies – you ask different<br />
questions. When we go to meetings with other investment<br />
managers, we’re asking very different questions than everyone else.<br />
4 SUMMER 2011 PERSPECTIVE AS AT JUNE 30, 2011
Introducing Black Creek<br />
[Q] Why have you chosen not to hedge against the effects<br />
of currency?<br />
KANKO: Hedging is supposed to reduce the volatility of your<br />
expected results – but it comes at a cost. It’s an ongoing cost<br />
that we’ve chosen not to incur because it eats up capital and<br />
we don’t think it serves any long-term purpose. Plus, many<br />
companies that we hold are already hedged, either through<br />
where they generate their sales and earnings, or they have<br />
hedges in place.<br />
JENKINS: The other thing is that for Canadian investors,<br />
the dollar is pro-cyclical. If the global economy strengthens,<br />
the Canadian dollar gets strong – particularly if energy<br />
prices strengthen. There’s a natural offset by owning a global<br />
portfolio to slowdowns or weakening of the economy. We<br />
saw that in 2008, when the equity market was down 50% or<br />
more, the Canadian dollar fell from US$1.02 to US$0.74. A<br />
global portfolio did substantially better in a weakened market<br />
than a Canadian portfolio. Our view of currency is based on<br />
purchasing power parity because over the long term that is<br />
the most reliable indicator. Relative to the U.S. dollar, we feel<br />
the Canadian dollar is overvalued by 25%. It’s also overvalued<br />
relative to the pound and euro. We have views on currencies,<br />
but they’re just one of the factors that go into the decisionmaking<br />
process.<br />
[Q] Canadian investors still have a large percentage of<br />
their holdings in domestic companies. What would you<br />
say to Canadian investors about going global?<br />
JENKINS: In just about every country studied, people carried<br />
a home market bias. Some of that is related to currency, some<br />
of it is a form of nationalism – I don’t know how else to put it.<br />
People tend to think that domestic companies are better than<br />
foreign ones. We try to find the very best company we can<br />
whether it’s in Canada, Japan or the U.S. – each environment<br />
has its own positives and negatives. A Canadian company has<br />
a lot of positives and some negatives – so does a Japanese<br />
one. We try to look at each case independently and find the<br />
25 best ideas.<br />
KANKO: Plus, the Canadian market is pretty narrow – it’s<br />
largely resources and financials. If you look at our portfolios,<br />
there are a lot of sectors you cannot access in Canada. There<br />
is a world of opportunities out there that simply does not exist<br />
in Canada.<br />
JENKINS: Another way to say it is, “Okay, if I’m in Canada<br />
and have a portfolio of stocks, why would I go elsewhere?”<br />
Well, I’d go elsewhere to get a better company or to invest<br />
in industries that are not available in Canada. For example,<br />
if I’m going to look at an oil company, why would I buy an<br />
oil company somewhere else? It has to be better than a<br />
Canadian one. Adidas owns Reebok CCM and everyone<br />
knows CCM hockey equipment – they just don’t know it’s<br />
owned by the Germans.<br />
Black Creek Investment Management<br />
Toronto-based Black Creek Investment Management was<br />
founded by Bill Kanko in February 2005. He was later joined<br />
by Richard Jenkins in <strong>July</strong> 2008. They believe that their ability<br />
to develop proprietary investment ideas will grow wealth for<br />
their clients over the long term. Their goal is to provide capital<br />
growth over the long term through investments in common<br />
equities, and to achieve superior returns relative to equity<br />
market averages in general and to competitors.<br />
Black Creek Investment Management strives to offer a worldclass<br />
global equity capability for its clients. Building on the<br />
background, experience and track records of the founding<br />
partners, the managers aim to provide long-term results that<br />
are among the best of their competitor peer group.<br />
SUMMER 2011 PERSPECTIVE AS AT JUNE 30, 2011 5
Introducing Black Creek<br />
The Black Creek Team<br />
Bill Kanko<br />
President & Portfolio Manager<br />
• 30 years’ investment management experience<br />
• From 1999 to 2004, Bill managed global equity portfolios<br />
for AIM Trimark as lead manager of Trimark Fund and<br />
Trimark Select Growth Fund<br />
• Managed more than $13 billion in assets<br />
• Trimark Fund performance was top-decile,1999-2004<br />
• Canadian Investment Award winner, 2002, best global<br />
equity fund<br />
• Castlerock Global Leaders – Silver award winner,<br />
Canadian Investment Awards, 2009; Lipper Fund Award,<br />
Global Equity category, 2011 (3 years)<br />
Richard Jenkins<br />
Managing Director<br />
& Portfolio Manager<br />
• Over 20 years’ investment management experience<br />
• Prior to joining Black Creek, Richard spent over 14 years<br />
with AIM Trimark as the lead manager of the top-performing<br />
Trimark Europlus Fund and the Trimark Global Balanced Fund<br />
• Managed $10 billion in assets<br />
• Five-time Canadian Investment Award winner, 2004-2006,<br />
in the global balanced and European equity categories<br />
• Two Lipper Fund Awards: Castlerock Global Balanced Fund,<br />
2011 (3 years) and Castlerock International Fund, 2010 (1 year)<br />
Matias Galarce<br />
Director of Global Equities<br />
• Joined Black Creek in 2006<br />
• Over nine years of investment experience and<br />
five years in the operational and consulting fields<br />
• Prior to Black Creek, he was part of the investment<br />
management team at Wirth Associates<br />
Evelyn Huang<br />
Director of Global Equities<br />
• Joined Black Creek in 2010<br />
• Prior to Black Creek, spent five years with Invesco<br />
Trimark as an investment analyst and portfolio manager<br />
for global equities<br />
• Co-managed Trimark Select Growth Fund and Trimark<br />
International Companies Fund<br />
6 SUMMER 2011 PERSPECTIVE AS AT JUNE 30, 2011
Book reviews<br />
Book reviews<br />
Settling in for a<br />
long read<br />
<strong>Summer</strong> is a time to kick back,<br />
fi nd a shady spot on the beach and<br />
settle in for a long read. As the season<br />
was starting, we asked our portfolio<br />
managers what they planned to read<br />
this summer – what they had read<br />
recently that they particularly liked.<br />
We hope you fi nd their selections on<br />
the following pages both insightful<br />
and entertaining.
Book reviews<br />
Book reviews<br />
Richard Jenkins<br />
Managing Director<br />
& Portfolio Manager<br />
Black Creek Investment Management<br />
What I plan to read this summer<br />
The Logic of Scientific Discovery by Karl Popper<br />
Routledge, 544 pages<br />
In essence, it applies the same logic we do to “uncovering<br />
ideas” in the realm of scientific discovery.<br />
last century.<br />
First published in English in 1959 (1935<br />
in Germany), Karl Popper’s The Logic<br />
of Scientific Discovery revolutionized<br />
contemporary thinking about science<br />
and knowledge and is one of the most<br />
widely read books about science written<br />
Popper presents the two ideas that did more than anything<br />
else to make him famous: that the only true knowledge<br />
is scientific knowledge and that knowledge grows only<br />
when on testing a theory, it can be shown to be false.<br />
Popper’s now legendary doctrine of ‘falsificationism’<br />
electrified the scientific community, influencing even the<br />
methods of working scientists. It also had a profound<br />
effect on the shape of postwar philosophy. Translated into<br />
many languages, it ranks alongside The Open Society and<br />
Its Enemies as one of Popper’s most enduring and famous.<br />
The best book I’ve read in the past year<br />
FICTION: Fall of Giants by Ken Follett,<br />
Dutton, 985 pages<br />
I really enjoyed Fall of Giants by Ken Follett, a historical<br />
novel set in the World War I era. The book follows the fates<br />
of five interrelated families – American, German, Russian,<br />
English and Welsh.<br />
This is a huge novel that follows five<br />
families through the world-shaking<br />
dramas of the First World War, the<br />
Russian Revolution, and the struggle<br />
for votes for women. It is 1911. The<br />
Coronation Day of King George V. The<br />
Williams, a Welsh coal-mining family,<br />
are linked by romance and enmity to the Fitzherberts,<br />
aristocratic coal-mine owners. Lady Maud Fitzherbert<br />
falls in love with Walter von Ulrich, a spy at the German<br />
Embassy in London. Their destiny is entangled with that<br />
of an ambitious young aide to U.S. President Woodrow<br />
Wilson and to two orphaned Russian brothers, whose<br />
plans to emigrate to America fall foul of war, conscription<br />
and revolution. In a plot of unfolding drama and intriguing<br />
complexity, Fall of Giants moves seamlessly from<br />
Washington to St Petersburg, from the dirt and danger of a<br />
coal mine to the glittering chandeliers of a palace, from the<br />
corridors of power to the bedrooms of the mighty.<br />
– Amazon.com<br />
– Wikipedia<br />
8 SUMMER 2011 PERSPECTIVE AS AT JUNE 30, 2011
Book reviews<br />
NON-FICTION: The Big Short: Inside the Doomsday Machine<br />
by Michael Lewis<br />
Norton, 266 pages<br />
I enjoyed The Big Short: Inside the Doomsday Machine, but<br />
to be honest, it actually sickened me as to how many Wall<br />
Street firms had betrayed their clients.<br />
The global financial crisis of 2008,<br />
which economists estimate could<br />
result in several trillion dollars of<br />
losses and which has already cost<br />
American taxpayers billions of dollars<br />
in government bailouts, was triggered<br />
not by war or recession but by a crazy,<br />
man-made money machine, built on flawed mathematical<br />
models that most financial executives did not really<br />
understand themselves. Greedy and heedless, Wall Street<br />
firms had been turning subprime mortgages – loans made<br />
to people with low creditworthiness or little documentation<br />
– into exotic, toxic financial products that they made a<br />
fortune laundering and reselling, and they were enabled in<br />
doing so by the very ratings agencies that were supposed<br />
to police risk. The insanity of this growing and highly<br />
leveraged trade in mortgage derivatives continued even<br />
as the quality of the underlying loans grew increasingly<br />
dubious, even as it became increasingly likely that the<br />
American housing bubble was going to pop.<br />
– The New York Times<br />
Matthew Strauss<br />
Global Strategist &<br />
Portfolio Manager<br />
Signature Global Advisors<br />
What I plan to read this summer<br />
Lula of Brazil: The Story So Far by Richard Bourne<br />
University of California Press, 304 pages<br />
Luiz Inacio Lula da Silva (two-time Brazilian president) is<br />
often described as a charismatic, rags-to-riches, working-class<br />
president who commanded global respect. Also, his path to the<br />
Presidency and style differed significantly from his predecessor,<br />
Fernando Cardoso. I’m hoping that this book will provide as<br />
much insight into Brazilian politics and economics as Cardoso’s<br />
memoirs, but with an obvious difference – instead of following<br />
the political and intellectual elite, this should provide a vivid<br />
and compelling view from the workers’ perspective.<br />
Luiz Inácio Lula da Silva’s dramatic life<br />
story has captured the imagination of<br />
millions, and his progressive politics have<br />
brought hope and excitement to Brazil –<br />
and the world. This compelling work is the<br />
first major English-language biography of<br />
the metalworker who became president<br />
of Latin America’s largest and most powerful country. In a<br />
clearly written, vividly detailed narrative, Richard Bourne<br />
describes Lula’s childhood hardships in an impoverished<br />
family, his days as a revered trade unionist, and the strike<br />
movement that brought down Brazil’s military dictatorship.<br />
The book chronicles Lula’s campaigns for the presidency,<br />
his first term in office beginning in 2002, a major corruption<br />
scandal, and his re-election in 2006. Throughout, Lula<br />
of Brazil connects this charismatic leader’s life to larger<br />
issues, such as the difficulty of maintaining a progressive<br />
policy in an era of globalization.<br />
– University of California Press<br />
SUMMER 2011 PERSPECTIVE AS AT JUNE 30, 2011 9
Book reviews<br />
The best book I’ve read in the past year<br />
FICTION: The Assassin by Stephen Coonts<br />
St. Martin’s Press, 512 pages<br />
When it comes to reading for relaxation, I end up in the<br />
thriller section with Robert Ludlum and Wilbur Smith<br />
high on my list. I will now add Steven Coonts. I thoroughly<br />
enjoyed the combination of suspense, politics and quasirealism<br />
in The Assassin.<br />
From Stephen Coonts comes a novel of<br />
high octane excitement – The Assassin<br />
– featuring Tommy Carmellini in his most<br />
dangerous mission yet.<br />
In the finale of Coonts’s last novel The<br />
Traitor, the ruthless and brilliant Al Qaeda<br />
leader who nearly succeeded in blowing up a meeting of the<br />
Group of 7 in Paris slipped the noose and escaped. But Abu<br />
Qasim has another trick up his sleeve: he has offered to pay<br />
the Mafia a fortune to help him bring New York to its knees.<br />
The <strong>CI</strong>A learns that something is up and a worried president<br />
sends his best – Jake Grafton and his secret weapon, Tommy<br />
Carmellini. Tommy is soon in grave danger as he tries to piece<br />
the deadly puzzle together. Set amidst ticking bombs and flying<br />
bullets, the stakes have never been higher. Will Tommy put it<br />
all together in time t stop the disaster? Or will the terrorists set<br />
events in motion that will leave America reeling?<br />
– Barnes & Noble<br />
NON-FICTION: The Accidental President of Brazil by<br />
Fernando Henrique Cardoso<br />
Public Affairs, 320 pages<br />
I found The Accidental President a fascinating and easy<br />
read, taking you on an absorbing journey through Brazil’s<br />
recent history. At times, the book read more like a novel<br />
than a memoir, but given Brazil’s extraordinary political<br />
and economic history, this should not come as a surprise.<br />
The country moved from a military regime to a democracy<br />
(1980s), and from hyper-inflation (1990s) and seven<br />
currencies in eight years to a stable and flourishing economy<br />
in the last 10 years.<br />
Fernando Henrique Cardoso received<br />
a phone call in the middle of the night<br />
asking him to be the new Finance<br />
Minister of Brazil. As he put the phone<br />
down and stared into the darkness of his<br />
hotel room, he feared he’d been handed<br />
a political death sentence. The year was<br />
1993, and he would be responsible for an economy that had<br />
had seven different currencies in the previous eight years to<br />
cope with inflation that had run at 3000% a year. Brazil had<br />
a habit of chewing up finance ministers with the ferocity of<br />
an Amazon piranha.<br />
This was just one of the turns in a largely unscripted and<br />
sometimes unwanted political career. In exile during the<br />
harshest period of the junta that ruled Brazil for twenty years,<br />
Cardoso started his political life with a tentative run for the<br />
Federal Senate in 1978. Within fifteen years, and despite<br />
himself, this former sociologist was running the country.<br />
– Public Affairs<br />
10 SUMMER 2011 PERSPECTIVE AS AT JUNE 30, 2011
Book reviews<br />
Brandon Snow<br />
Principal & Portfolio Manager<br />
Cambridge Advisors<br />
What I plan to read this summer<br />
The Little Book of Behavioral Investing: How not to be your<br />
own worst enemy (Little Book, Big Profits) by James Montie<br />
Wiley, 236 pages<br />
In order to better understand how other investors react in the<br />
market, I’m reading The Little Book of Behavioral Investing,<br />
which explores behavioural investing and the pitfalls many<br />
investors make.<br />
Bias, emotion, and overconfidence are<br />
just three of the many behavioral traits<br />
that can lead investors to lose money<br />
or achieve lower returns. Behavioral<br />
finance, which recognizes that there is<br />
a psychological element to all investor<br />
decision-making, can help you overcome this obstacle.<br />
In The Little Book of Behavioral Investing, expert James<br />
Montier takes you through some of the most important<br />
behavioral challenges faced by investors. Montier reveals<br />
the most common psychological barriers, clearly showing<br />
how emotion, overconfidence, and a multitude of other<br />
behavioral traits, can affect investment decision-making.<br />
Written in a straightforward and accessible style, The<br />
Little Book of Behavioral Investing will enable you to<br />
identify and eliminate behavioral traits that can hinder<br />
your investment endeavors and show you how to go about<br />
achieving superior returns in the process.<br />
– Wiley<br />
The best book I’ve read in the past year<br />
Lords of Finance: The Bankers Who Broke the World, by<br />
Liaquat Ahamed<br />
Penguin, 576 pages<br />
Lords of Finance helped me understand how new and<br />
dysfunctional central banks failed to prevent the Great<br />
Depression. While there will be unintended consequences<br />
from all the recent central bank actions, the world is unlikely<br />
to face the same outcome as it did in the 1930s.<br />
In The Lords of Finance, Ahamed, a<br />
professional money manager, sums up<br />
the causes of the Great Depression as a<br />
series of economic policy blunders that<br />
could have been avoided. He cites as<br />
causal factors the inflationary financing<br />
of World War I by printing money, the<br />
insurmountable war debts of Germany and the Allies,<br />
Germany’s plunge into hyperinflation, and the return of most<br />
currencies to the gold standard at excessive and deflationary<br />
prewar rates. For example, he explains that when the U.S.<br />
stock market bubble burst in 1929 and economic activity<br />
collapsed, the central banks were restrained in stimulating<br />
the economy for fear of losing their gold reserves.<br />
In an epilog, Ahamed draws parallels between the crises of<br />
the Great Depression and those in recent times. He keeps<br />
his history interesting by highlighting the personalities<br />
of the heads of the major central banks, and he employs<br />
the economist John Maynard Keynes as a one-man Greek<br />
chorus critiquing the bankers’ actions. This erudite and<br />
exceedingly well-written tale of financial chaos in the<br />
1920s and 1930s is both timely and instructive for today’s<br />
economic climate.<br />
– Library Journal, vol. 138<br />
SUMMER 2011 PERSPECTIVE AS AT JUNE 30, 2011 11
Book reviews<br />
The best book I’ve read in the past year<br />
Losing Mum and Pup by Christopher Buckley<br />
Twelve, 251 pages<br />
Gerry Coleman<br />
Chief Investment Officer<br />
Harbour Advisors<br />
What I plan to read this summer<br />
Unbroken: A World War II Story of Survival, Resilience, and<br />
Redemption by Laura Hillenbrand<br />
Random House, 473 pages<br />
Unbroken is the story of Louis Zamperini. Born in 1917, Louis<br />
was an Olympic distance runner, World War II prisoner of<br />
war and inspirational speaker. The book is billed as a World<br />
War II story of Survival, Resilience, and Redemption. Laura<br />
Hillenbrand is the best selling author of Seabiscuit: An<br />
American Legend.<br />
Laura Hillenbrand reached Louis<br />
Zamperini just in the nick of time – he<br />
was in his mid-80s when she found<br />
him, and 93 now – and it’s an excellent<br />
thing, for his is surely one of the most<br />
extraordinary war stories of all.<br />
In late May 1943, the B-24 carrying the 26-year-old<br />
Zamperini went down over the Pacific. For nearly seven<br />
weeks – longer, Hillenbrand believes, than any other<br />
such instance in recorded history – Zamperini and his<br />
pilot managed to survive on a fragile raft. They traveled<br />
2,000 miles, only to land in a series of Japanese prison<br />
camps, where, for the next two years, Zamperini<br />
underwent a whole new set of tortures. His is one of the<br />
most spectacular odysseys of this or any other war, and<br />
“odyssey” is the right word, for with its tempests and<br />
furies and monsters, many of them human, Zamperini’s<br />
saga is something out of Greek mythology.<br />
– New York Times<br />
A book that I really enjoyed this past year was Losing Mum<br />
and Pup by Christopher Buckley, son of William F. and<br />
Patricia Buckley. Bill Buckley was, of course, the father of the<br />
modern conservative movement. Bill had a terrific intellect<br />
and razor sharp wit, which was on display in the many books<br />
he wrote, as well as TV appearances. The tragicomic true<br />
story traces the year in which both of Chris’s parents died.<br />
The book is a highly entertaining read. Christopher Buckley<br />
is an award-winning author in his own right.<br />
The younger Buckley’s new memoir,<br />
Losing Mum and Pup – about seeing<br />
both his parents die within less than 11<br />
months of each other in 2007 and 2008<br />
– is sure to cause a few moments of<br />
further discomfort in the temple of American conservatism,<br />
where except for Ronald and Nancy Reagan, Bill and Pat<br />
Buckley will always be the First Couple.<br />
The author explains that he’d “pretty much resolved not to<br />
write a book" about his famous parents until he realized<br />
that “when the universe hands you material like this, not<br />
writing about it seems either a waste or a conscious act of<br />
evasion.” Buckley makes clear that the primary “material”<br />
he’s speaking of is the grim business of losing two parents<br />
in such a short span, but he is also well aware that the<br />
elder Buckleys were material, pure and simple.<br />
Well, anything but simple. Each was, it might be said,<br />
a piece of work, in both the Shakespearean sense of<br />
something wondrous to behold and the more current one<br />
of being, shall we say, a handful. The memoir provoked by<br />
their lives and deaths is loving, exasperated and very funny.<br />
In its moments of real ambivalence, Losing Mum and Pup is<br />
surprisingly strong drink.<br />
– New York Times<br />
12 SUMMER 2011 PERSPECTIVE AS AT JUNE 30, 2011
Book reviews<br />
Malcolm White<br />
Vice-President Portfolio Management<br />
and Portfolio Manager<br />
Signature Global Advisors<br />
What I plan to read this summer<br />
And the Money Kept Rolling In (and Out): Wall Street, the<br />
IMF, and the bankrupting of Argentina by Paul Blustein<br />
Public Affairs, 320 pages<br />
I bought this book in 2003 and recently dusted it off again.<br />
Given the Greek situation, this book is especially relevant and<br />
shows why – in my opinion – Greece will default, devalue its<br />
currency and go back to the drachma.<br />
In the 1990s, few countries were more<br />
lionized than Argentina for its efforts<br />
to join the club of wealthy nations.<br />
Argentina’s policies drew enthusiastic<br />
applause from the IMF, the World Bank<br />
and Wall Street. But the club has a<br />
disturbing propensity to turn its back on<br />
arrivistes and cast them out. That was what happened in<br />
2001, when Argentina suffered one of the most spectacular<br />
crashes in modern history. With it came appalling social<br />
and political chaos, a collapse of the peso, and a wrenching<br />
downturn that threw millions into poverty and left nearly<br />
one-quarter of the workforce unemployed.<br />
– Public Affairs<br />
The best book I’ve read in the past year<br />
The Age of Entanglement: When Quantum Physics<br />
Was Reborn by Louisa Gilder<br />
Alfred A. Knopf, 443 pages<br />
Entanglement is the strange property of physics where two<br />
particles can be synced and communicate over vast distances.<br />
Einstein never really believed in the principle – which would<br />
infer faster than light speeds – but entanglement has been<br />
shown to work and is at the heart of new advances in quantum<br />
computing and communications.<br />
This book offers an easy-to-read account of the history and<br />
physics behind the science.<br />
The first quarter of the 20 th century<br />
produced two theories, relativity and<br />
quantum mechanics, that are still<br />
changing our universe.<br />
With special relativity, Albert Einstein<br />
upended the long-understood meaning<br />
of time, space and simultaneity. With general relativity,<br />
he swapped Newton’s law of gravity based on force for<br />
curved space¬time, and cosmology became a science. Just<br />
after World War I, relativity made front-page news when<br />
astronomers saw the Sun bend starlight. Overnight, Einstein<br />
became famous as no physical scientist before or since, his<br />
theory the subject of poetry, painting and architecture.<br />
Then, with the development of quantum mechanics in the<br />
1920s, physics got really interesting. Quantum physics<br />
was a theory so powerful – and so powerfully weird – that<br />
nearly a century later, we’re still arguing about how to<br />
reconcile it with Einsteinian relativity and debating what it<br />
tells us about causality, locality and realism.<br />
– New York Times<br />
SUMMER 2011 PERSPECTIVE AS AT JUNE 30, 2011 13
Portfolio Snapshot<br />
Cambridge Global Equity June 30, 2011<br />
Fund management<br />
Portfolio advisor: Cambridge Advisors<br />
Portfolio manager: (start date)<br />
Alan Radlo (January 2008<br />
Brandon Snow (April 2011)<br />
About Cambridge<br />
• Cambridge Advisors is a Boston and Toronto-based<br />
investment management team which currently manages<br />
over $3 billion in assets.<br />
• It is led by Alan Radlo, Chief investment Officer, who has<br />
over 28 years of investment experience.<br />
• The team has a proven ability to protect investors’ capital<br />
in all markets.<br />
• Cambridge funds provide growth with downside protection.<br />
• The funds have flexible mandates, which are ideal for<br />
pursuing good buying opportunities.<br />
Fund characteristics<br />
Fund inception date:<br />
December 2007<br />
Assets:<br />
$619 million*<br />
*Class A shares at June 30, 2011<br />
Investment objective:<br />
The fund’s objective is to achieve long-term capital growth by<br />
investing primarily in equity securities of companies located<br />
anywhere in the world.<br />
How is the fund managed?<br />
• Although the fund tends to focus on the developed world,<br />
there are no restrictions to its geographic allocation.<br />
• The portfolio is made up of small to large-cap stocks and<br />
encompasses all industry sectors.<br />
• The manager seeks companies which are building economic<br />
value – these typically have strong earnings, solid balance<br />
sheets, excellent management and reasonable values.<br />
Why invest in this fund?<br />
• You want a core foreign equity fund for your portfolio<br />
• you are investing for the medium and/or long term<br />
• you can tolerate medium risk<br />
Holdings analysis<br />
Asset class<br />
International equity 50%<br />
US equity 38%<br />
Cash & equivalents 8%<br />
Canadian equity 4%<br />
Country breakdown<br />
United States 38%<br />
Other 14%<br />
Britain 14%<br />
Germany 12%<br />
France 5%<br />
Canada 4%<br />
Jersey Island 4%<br />
Switzerland 4%<br />
Norway 3%<br />
Denmark 2%<br />
Sector<br />
Industrials 23%<br />
Information technology 19%<br />
Energy 15%<br />
Health care 10%<br />
Cash 8%<br />
Financials 8%<br />
Materials 8%<br />
Consumer discretionary 7%<br />
Utilities 2%<br />
14 SUMMER 2011 PERSPECTIVE AS AT JUNE 30, 2011
Portfolio Snapshot<br />
Performance<br />
YTD 1 Year 2 Years 3 Years Since inception*<br />
Cambridge Global Equity Corporate Class 0.3% 20% 12% 0% 2.4%<br />
*December 31, 2007<br />
Holdings<br />
Top 15 holdings Country Sector Weight<br />
JPMorgan Chase & Co. United States Financials 2.6%<br />
Standard Chartered PLC Britain Financials 2.5%<br />
Roche Holdings Switzerland Health care 2.0%<br />
Novo-Nordisk Denmark Health care 2.0%<br />
Apache Corp. United States Energy 1.9%<br />
Seadrill Ltd. Bermuda Energy 1.9%<br />
Petrofac Ltd. Jersey Island Energy 1.9%<br />
Devon Energy Corp. United States Energy 1.8%<br />
Abbott Labs Inc. United States Health care 1.6%<br />
Volkswagen AG Germany Consumer discretionary 1.6%<br />
Siemens AG Germany Industrials 1.6%<br />
Brookfield Infrastructure Partners L.P. Canada Utilities 1.6%<br />
Astrazeneca Britain Health care 1.6%<br />
Tourmaline Oil Corp. Canada Energy 1.6%<br />
Schroders PLC Britain Financials 1.5%<br />
Fund codes<br />
Class A<br />
ISC DSC LL<br />
Class F PMA<br />
Cambridge Global Equity Corporate Class 2323 3323 1523 4323 5323<br />
US$ 2518 3518 1218 4518 N/A<br />
T5 118T5 218T5 318T5 418T5 518T5<br />
T8 618T8 718T8 818T8 918T8 018T8<br />
SUMMER 2011 PERSPECTIVE AS AT JUNE 30, 2011 15
Portfolio Snapshot<br />
Cambridge Canadian Equity<br />
Corporate Class June 30, 2011<br />
Fund management<br />
Portfolio advisor: Cambridge Advisors<br />
Portfolio managers: (start date)<br />
Alan Radlo (January 2008)<br />
Brandon Snow (April 2011)<br />
About Cambridge<br />
• Cambridge Advisors is a Boston and Toronto-based<br />
investment management team which currently manages<br />
over $3 billion in assets.<br />
• It is led by Alan Radlo, Chief investment Officer, who has<br />
over 28 years of investment experience.<br />
• The team has a proven ability to protect investors’ capital in<br />
all markets.<br />
• Cambridge funds provide growth with downside protection.<br />
• The funds have flexible mandates, which are ideal for<br />
pursuing good buying opportunities.<br />
Fund characteristics<br />
Fund inception date:<br />
December 2007<br />
Assets:<br />
$704 million*<br />
*Class A shares at June 30, 2011<br />
Investment objective:<br />
This fund’s objective is to achieve long-term capital growth<br />
by investing primarily in equity securities of Canadian<br />
companies<br />
How is the fund managed?<br />
• The fund mainly invests in Canadian equities, but has the<br />
ability to invest up to 49% in foreign content.<br />
• The portfolio is made up of small to large-cap companies<br />
encompassing all industry sectors.<br />
• The managers embed risk controls in their stock selection<br />
and continually monitor company earnings and valuations<br />
in order to mitigate risk.<br />
Why invest in this fund?<br />
• You want a core Canadian equity fund for your portfolio<br />
• You are investing for the medium and/or long term<br />
• You are willing to accept medium risk<br />
Holdings analysis<br />
Asset class<br />
Canadian equity 62%<br />
US equity 23%<br />
International equity 10%<br />
Cash & equivalents 5%<br />
Country breakdown<br />
Canada 62%<br />
United States 23%<br />
Other 9%<br />
Britain 3%<br />
Switzerland 1%<br />
Brazil 1%<br />
France 1%<br />
Sector<br />
Energy 20%<br />
Industrials 17%<br />
Information technology 16%<br />
Financials 14%<br />
Consumer staples 9%<br />
Consumer discretionary 8%<br />
Materials 7%<br />
Cash 5%<br />
Utilities 2%<br />
Health care 1%<br />
Other 1%<br />
16 SUMMER 2011 PERSPECTIVE AS AT JUNE 30, 2011
Portfolio Snapshot<br />
Performance<br />
YTD 1 Year 2 Years 3 Years Since inception*<br />
Cambridge Canadian Equity Corporate Class 4.0% 23.4% 15.0% 1.2% 2.9%<br />
*December 31, 2007<br />
Holdings<br />
Top 15 holdings Country Sector Weight<br />
Shoppers Drug Mart Inc. Canada Consumer staples 3.4%<br />
JPMorgan Chase & Co. United States Financials 2.8%<br />
Canadian Natural Resources Ltd. Canada Energy 2.6%<br />
Tourmaline Oil Corp. Canada Energy 2.5%<br />
Toronto-Dominion Bank Canada Financials 2.3%<br />
Alimentation Couche-Tard Canada Consumer staples 2.2%<br />
Keyera Corp. Canada Energy 2.2%<br />
Cenovus Energy Inc. Canada Energy 2.1%<br />
Onex Corp. Canada Industrials 2.1%<br />
Franco-Nevada Corp. Canada Materials 2.0%<br />
Talisman Energy Inc. Canada Energy 2.0%<br />
Canadian National Railway Canada Industrials 1.9%<br />
Jean Coutu Group Inc. Canada Consumer staples 1.8%<br />
Broadridge Financial Solution United States Information technology 1.6%<br />
Transforce Inc. Canada Industrials 1.6%<br />
Fund codes<br />
Class A<br />
ISC DSC LL<br />
Class F PMA<br />
Cambridge Canadian Equity Corporate Class 2321 3321 1521 4321 5321<br />
US$ 2516 3516 1216 4516 N/A<br />
T5 116T5 216T5 316T5 416T5 516T5<br />
T8 616T8 716T8 816T8 916T8 016T8<br />
SUMMER 2011 PERSPECTIVE AS AT JUNE 30, 2011 17
Portfolio Snapshot<br />
Cambridge Canadian Asset Allocation<br />
Corporate Class June 30, 2011<br />
Fund management<br />
Portfolio advisor: Cambridge Advisors<br />
Portfolio managers: (start date)<br />
Alan Radlo (January 2008)<br />
About Cambridge<br />
• Cambridge Advisors is a Boston and Toronto-based investment<br />
management team which currently manages over $3 billion<br />
in assets.<br />
• It is led by Alan Radlo, Chief investment Officer, who has<br />
over 28 years of investment experience.<br />
• The team has a proven ability to protect investors’ capital in<br />
all markets.<br />
• Cambridge funds provide growth with downside protection.<br />
• The funds have flexible mandates, which are ideal for<br />
pursuing good buying opportunities.<br />
Fund characteristics<br />
Fund inception date:<br />
December 2007<br />
Assets:<br />
$485 million*<br />
*Class A shares at June 30, 2011<br />
Investment objective:<br />
This fund’s objective is to achieve a superior total investment<br />
return by investing in a combination of primarily Canadian<br />
equity and fixed-income securities.<br />
How is the fund managed?<br />
• The fixed-income portion is conservatively managed with a<br />
focus on Canadian debt securities.<br />
• The equity portion is mainly Canadian companies, but has<br />
the ability to invest up to 49% in foreign content.<br />
• The managers have a flexible mandate that incorporates<br />
active management across asset classes, geographic and<br />
industry sector allocations.<br />
Why invest in this fund?<br />
• You want combined income and growth<br />
• You want active asset allocation among equity securities, fixed<br />
income securities and cash<br />
• You are investing for the medium term<br />
• You can tolerate low to medium risk<br />
Holdings analysis<br />
Asset class<br />
Canadian equity 60%<br />
Cash & equivalents 20%<br />
US equity 16%<br />
International equity 3%<br />
Canadian bonds 1%<br />
Country breakdown<br />
Canada 61%<br />
Other 21%<br />
United States 16%<br />
Germany 1%<br />
Bermuda 1%<br />
Sector<br />
Energy 26%<br />
Financials 23%<br />
Cash 20%<br />
Industrials 11%<br />
Information technology 10%<br />
Health care 2%<br />
Utilities 2%<br />
Consumer discretionary 2%<br />
Materials 2%<br />
Consumer staples 1%<br />
Bonds 1%<br />
18 SUMMER 2011 PERSPECTIVE AS AT JUNE 30, 2011
Portfolio Snapshot<br />
Performance<br />
YTD 1 Year 2 Years 3 Years Since inception*<br />
Cambridge Canadian Asset Allocation Corporate Class 5.25% 23.45% 15.65% 4.55% 4.85%<br />
*December 31, 2007<br />
Holdings<br />
Top 15 holdings Country Sector Weight<br />
Keyera Corp. Canada Energy 4.5%<br />
Inter Pipeline Fund Canada Energy 4.1%<br />
Provident Energy Ltd. Canada Energy 3.6%<br />
Tourmaline Oil Corp. Canada Energy 2.6%<br />
Pembina Pipeline Corp. Canada Energy 2.6%<br />
Canadian Natural Resources Ltd. Canada Energy 2.5%<br />
JPMorgan Chase & Co. United States Financials 2.0%<br />
Brookfield Infrastructure Partners L.P. Canada Utilities 2.0%<br />
Canadian National Railway Co. Canada Industrials 2.0%<br />
Cenovus Energy Inc. Canada Energy 1.9%<br />
Royal Bank Of Canada Canada Financials 1.7%<br />
Toronto-Dominion Bank Canada Financials 1.7%<br />
Magna International Inc. Canada Consumer discretionary 1.6%<br />
National Bank Of Canada Canada Financials 1.6%<br />
Onex Corp. Canada Industrials 1.5%<br />
Fund codes<br />
Class A<br />
ISC DSC LL<br />
Class F PMA<br />
Cambridge Canadian Asset Allocation Corporate Class 2322 3322 1522 4322 5322<br />
US$ 2517 3517 1217 4517 N/A<br />
T5 117T5 217T5 317T5 417T5 517T5<br />
T8 617T8 717T8 817T8 917T8 017T8<br />
SUMMER 2011 PERSPECTIVE AS AT JUNE 30, 2011 19
Signature Market Roundup<br />
Market Roundup<br />
Global outlook<br />
Global outlook<br />
Eric Bushell<br />
Senior Vice-President,<br />
Portfolio Management<br />
and Chief Investment Officer<br />
The extraordinary low interest rate environment has created<br />
a surge of investments into riskier, higher-yielding, illiquid<br />
assets. This behaviour was further encouraged by the Federal<br />
Reserve’s asset purchase program (QE2), which recently<br />
concluded. The effects have been largely consistent across<br />
different markets. In our view, this enthusiasm is misplaced<br />
when consideration is given to systemic risks we see in Europe<br />
and America. Several years of low growth and consumer<br />
deleveraging lie ahead and as consumer prices advance<br />
against stagnant wages, we expect to see widespread consumer<br />
retrenchment. The political and social consequences of<br />
the crisis are becoming apparent. Financial regulation is<br />
being enacted with some unintended consequences – such<br />
as the reduction in market liquidity, which may magnify<br />
volatility. At Signature, we are defensively positioned for<br />
this environment.<br />
Drummond Brodeur<br />
Vice-President,<br />
Portfolio Management<br />
and Global Stategist<br />
In a financial markets version of the movie Groundhog Day,<br />
global markets are embroiled in concerns regarding European<br />
sovereign debt defaults and the soft patch in the U.S. economy.<br />
We feel that these concerns are overdone. It is unforgivable that<br />
the Europeans have failed to use the past year to better dilute the<br />
contagion risk from Greece – but here we are. A key difference<br />
this year is that the scope of the problem is understood, as are<br />
the potential avenues of contagion. There is also a US$110<br />
billion safety net in place that did not exist last spring. So some<br />
progress has definitely been made. The major risk last year was<br />
a failure to grasp the extent of the problem – today it is a risk<br />
of failure on the part of the European politicians to execute a<br />
successful containment strategy.<br />
As for the U.S. soft patch, there is no doubt that the second<br />
quarter was a lot slower than first anticipated – but much of the<br />
slowdown can be attributed to supply chain disruptions in autos<br />
and technology resulting from the Japanese earthquake and<br />
tsunami. These disruptions were expected, but unquantifiable,<br />
immediately after the earthquake. These will likely be reversed<br />
in the second half of the year. There is little doubt that elevated<br />
oil prices have reached a point where they are a drag on U.S.<br />
consumption. As was the case last summer, markets will remain<br />
fragile as participants await confirmation of the temporary<br />
nature of the slowdown. As in Europe, the risk of incompetence<br />
on the part of American politicians looms large. At the time<br />
of writing, we expected that a compromise would be reached<br />
on the debt ceiling issue; however, it is important to recognize<br />
that this is just the early rounds for the upcoming 2012 U.S.<br />
election and such political brinkmanship and sparring will be<br />
continuous over the coming year and a half.<br />
Having reduced risk in late April, our funds remain conservatively<br />
positioned. We will remain data dependent when looking to<br />
reinvest some of our cash at more attractive levels – in what we<br />
anticipate to remain a volatile market environment.<br />
20 SUMMER 2011 PERSPECTIVE AS AT JUNE 30, 2011
Signature Market Roundup<br />
Interest rates<br />
Emerging markets<br />
James Dutkiewicz<br />
Vice-President,<br />
Portfolio Management<br />
and Portfolio Manager<br />
Recent movements in government bonds have been<br />
driven in part by direct economic indicators and in part by<br />
budgetary uncertainty. Yields had been range bound. This<br />
reflected the market’s appreciation for the hesitant, but<br />
resilient, economic expansion as it dealt with natural disasters<br />
and political wrangling. As the second quarter closed, bonds<br />
rallied relentlessly through the bottom of the previous yield<br />
range in response to signals that growth was below trend in<br />
both Canada and the U.S.<br />
Adding to the lower yields was the discord in Washington over<br />
the Republican Party’s insistence on significant budgetary<br />
cuts in exchange for increasing the debt ceiling. Throw in<br />
more Greek protests over austerity measures, the seemingly<br />
inevitable writedown on Greece’s sovereign debt and the safehaven<br />
nature of U.S. government bonds was re-established.<br />
This is not a trivial matter. Should the budgetary impasse in<br />
Washington lead to doubts about the U.S.’s willingness to pay<br />
its obligations, then the subsequent rise in real yields would<br />
create economic chaos.<br />
With Chinese inflation rising past 6%, look for more efforts<br />
by authorities to reign in growth of the globe’s most powerful<br />
economic engine. This will help foster the notion of a global<br />
economy lacking any meaningful growth drivers. How much<br />
of this is priced in to the below 3% yield on U.S. 10-year<br />
bonds? A fair bit given that the Federal Reserve’s bondbuying<br />
program has ended. We liken current yields to the<br />
notion of keeping a beach ball under the water. If global<br />
policymakers defer the hard decisions in favour of promoting<br />
growth, interest rates could pop higher and settle back into<br />
their earlier range.<br />
Matthew Strauss<br />
Vice-President, Portfolio Management,<br />
Portfolio Manager<br />
and Global Strategist<br />
Inflation fears and economic growth concerns weighed on<br />
emerging market equities in the second quarter, partially<br />
offsetting the gains of 2.1% recorded in the first quarter.<br />
The only region that recorded a positive return was Asia,<br />
led by strong quarterly gains in Indonesia, Malaysia and the<br />
Philippines. Peru was the clear laggard as domestic politics<br />
dominated, following the surprise victory of the left-leaning<br />
presidential candidate. Renewed uncertainty about the Greek<br />
debt situation and the end of quantitative easing (QE2) in the<br />
U.S. added to a sombre investment environment.<br />
European event risk aside, we view the current environment<br />
as a mid-cycle correction in emerging markets and, after last<br />
year’s unsustainably high growth numbers, welcome some<br />
slowing in economic growth. Furthermore, we believe that<br />
many emerging market central banks have done enough or<br />
nearly enough to contain inflation without risking a sharp<br />
slowdown in their respective economies. Consequently, these<br />
central banks are expected to move to the sidelines during<br />
the next two quarters. As inflation peaks in the third quarter<br />
and fears of a hard landing subside, emerging markets are set<br />
to outperform their developed counterparts once again. We<br />
will continue to focus on those sectors with direct exposure to<br />
the domestic markets, paying specific attention to domestic<br />
consumer stocks, financials and health care. From a regional<br />
perspective, we continue to favour Asia given its still strong<br />
underlying growth dynamics and expectations of a pause in<br />
monetary policy tightening.<br />
SUMMER 2011 PERSPECTIVE AS AT JUNE 30, 2011 21
Signature Market Roundup<br />
Preferred Shares<br />
Autos<br />
John Shaw<br />
Vice-President,<br />
Portfolio Management,<br />
Portfolio Manager<br />
Retail investors’ demand for preferred shares remains very<br />
strong as new issuance has been light and redemptions<br />
continue to dampen supply. Supply will remain low due to<br />
the strong capital position of Canadian banks. Almost all of<br />
the $20 billion of bank preferred shares outstanding will be<br />
redeemed over the next six years and only a small amount will<br />
be re-issued. This will strengthen demand given that almost<br />
35% to 40% of the preferred share market may disappear. The<br />
outlook for the preferred market remains positive, especially<br />
following the Office of the Superintendent of Financial<br />
Institutions (OSFI) ruling that the bank preferred shares will<br />
have to be redeemed or exchanged into qualifying securities.<br />
Massimo Bonansinga<br />
Vice-President,<br />
Portfolio Management<br />
and Portfolio Manager<br />
Along with the rest of the automotive sector, auto parts<br />
manufacturers and suppliers suffered from the Japan’s<br />
earthquake and tsunami. Some auto parts companies had<br />
significant assets in the affected area and their share prices<br />
were hit accordingly.<br />
Since the March 11 earthquake, the Japanese automotive<br />
industry has staged a remarkable comeback. Production levels<br />
are scheduled to be back to normal by the end of the summer.<br />
But, because of the lack of product, Japanese Original<br />
Equipment Manafacturers have lost market share globally<br />
and their inventory levels are significantly below normal.<br />
Dealerships need inventory to function properly, especially in<br />
the U.S., where customers prefer to buy vehicles off the lot,<br />
rather than wait and have them built to order.<br />
Over the coming months, Japanese manufacturers will push<br />
production rates hard to catch up with lost sales and rebuild<br />
inventories. Suppliers benefit from higher production<br />
rates because they bill OEMs before the vehicle hits the<br />
dealerships, regardless if it is sold to a customer or it is part of<br />
the dealer inventory. Japanese suppliers have accelerated their<br />
establishment of facilities outside Japan to help manufacturers<br />
increase local content and to diversify their locations.<br />
At Signature, we increased our holdings in Japanese suppliers<br />
and added new ones in March – less than a week after the<br />
earthquake. We believe there will be a fast recovery in<br />
production, so we have invested in companies with clear<br />
technology leadership and a strong push to sell outside<br />
their traditional relationship with the Japanese OEMs. Our<br />
investments in Aisin Seiki, JTEKT (both Toyota affiliated) and<br />
Keihin (Honda affiliated) have already generated 20% upside.<br />
We are confident there is still more to come from multiples<br />
expansion and expanding sales and profitability.<br />
22 SUMMER 2011 PERSPECTIVE AS AT JUNE 30, 2011
Signature Market Roundup<br />
Consumer products<br />
Stephane Champagne<br />
Vice-President,<br />
Portfolio Management<br />
and Portfolio Manager<br />
Consumer activity slowed during the second quarter on a<br />
sequential basis. The negative stories were sharply higher<br />
gasoline prices, higher food costs, slower employment and<br />
bad weather. Overall, the S&P 500 Index underperformed<br />
the consumer discretionary sector by 340 basis points and<br />
consumer staples by 485 bps. Finally, staples outperformed<br />
the consumer discretionary sector by 145 bps during the<br />
period. The staples index has been helped by an increase in<br />
the U.S. unemployment rate to 9.2% at the end of the quarter<br />
from 8.8% the previous quarter.<br />
After good U.S. retail sales in April, poor weather conditions<br />
and negative employment reports in May, there was decent<br />
retail sales growth in June in nearly all segments. Compared<br />
the first quarter, softline retailers have been mixed, mostly<br />
due to unfavourable weather. Hardline sales were gaining<br />
momentum until the decrease in consumer confidence,<br />
higher than expected unemployment rate, slower real estate<br />
activity and lower durable goods consumption. Restaurant<br />
and luxury goods have recovered since the first quarter<br />
and have been one of the best performers among the<br />
discretionary sector. They also did well compared to softline<br />
retailers. Apparel companies started to feel the impact of<br />
tough comparable sales in the second quarter. They should<br />
experience some pressures from labour costs in Asia and<br />
higher cotton costs in the second half of the year. The hotel<br />
sector underperformed the discretionary sector due to high<br />
valuation and cautious expectations on pricing and volume<br />
growth from a major company.<br />
In the staples sector, tobacco and beverage stocks<br />
outperformed household and personal care stocks, which<br />
outperformed food producers and staples retailers.<br />
Overall, discussion over the next few quarters will be centered<br />
on higher interest rates in Europe and China, austerity<br />
measures in Europe and how the U.S. economy will respond<br />
to the end of the Federal Reserve’s QE2 stimulus program<br />
which ended in June. Investors should expect continued<br />
volatility in equity markets.<br />
We remain confident in our choices due to their cheap<br />
valuations compared to historical valuations, high free-cashflow<br />
generation, high-quality balance sheets, and a high<br />
return to shareholders (dividends, buybacks, mergers and<br />
acquisitions). We are taking a conservative approach to our<br />
consumer portfolio, which should help temper portfolio<br />
volatility and allow us to take advantage of the opportunities<br />
when there is an equity market pullback. For the longer<br />
term, we still remain positive toward emerging market<br />
consumer stocks.<br />
SUMMER 2011 PERSPECTIVE AS AT JUNE 30, 2011 23
Signature Market Roundup<br />
Health care<br />
Rui Cardoso<br />
Vice-President,<br />
Portfolio Management<br />
and Portfolio Manager<br />
Following solid first quarter results, health care was the bestperforming<br />
sector in the S&P 500 Index with a return of 7.3%<br />
compared to the index return of -0.4% in the quarter. We<br />
attribute most of this to a more defensive repositioning of<br />
portfolios by the broader market, coupled with a rebound in<br />
health care insurers from depressed valuation levels. Beyond<br />
a defensive tilt in the market, the sustainability of the rally in<br />
health care will depend on a shift in sentiment towards the<br />
future outlook for the sector from a top-down basis (that is,<br />
the impact of reforms in markets like the U.S. and Germany<br />
and the impact of austerity measures across most of Europe),<br />
and a bottom-up basis (related to a steep decline in R&D<br />
productivity in pharma and medical device segments at<br />
a time when a significant percentage of their revenues are<br />
at risk of losing patent exclusivity or are facing more severe<br />
pricing pressure).<br />
From the bottom-up perspective, looking at current<br />
valuations and dividend yields for the group, we believe<br />
the “patent cliffs” are more than factored in to current<br />
expectations. Our favoured sector remains big pharma stocks.<br />
Their drug pipelines remain full. The U.S. Federal Drug<br />
Administration’s focus on risk versus benefit when examining<br />
new drugs has swung back to a more rational state, leading to<br />
higher approval rates of new drugs since late 2010. Given the<br />
high dividend yields offered by the group, we are being paid<br />
to wait. Our overall view of the sector remains positive.<br />
With regards to a shift in sentiment on the top-down issues,<br />
our view is that the headline risks remain. Pan-EU measures<br />
on cost controls in health care will intensify and the budget<br />
ceiling issue in the U.S. will place more of a spotlight on<br />
entitlements – especially Medicaid and Medicare programs.<br />
That said, the issues with pricing in Europe are well<br />
understood and largely factored into estimates (we expect<br />
price declines in the region in the 5% range over the next<br />
few years). Also, emerging markets such as China and Brazil<br />
are vastly under-penetrated in health care utilization and<br />
spending levels relative to the developed world. In addition,<br />
the wealth effect is leading to rapid increases in hospital<br />
procedures and drug and device spending.<br />
24 SUMMER 2011 PERSPECTIVE AS AT JUNE 30, 2011
Signature Market Roundup<br />
Global industrial products<br />
Technology & telecommunications<br />
Joe D’Angelo<br />
Vice-President,<br />
Portfolio Management<br />
and Portfolio Manager<br />
Recently, profit trends for industrial products companies<br />
have become more predictable. Areas of strength continue to<br />
be in mining and energy equipment, industrial automation<br />
and electrical equipment. This is a result of growing resource<br />
demand due to emerging markets, automation demand<br />
driven by labour and/or raw material inflation, and energy<br />
efficiency trends. Companies more exposed to weaker<br />
geographies and end markets, like construction, are more<br />
likely to experience earnings disappointments.<br />
Although industrial companies continue to feel confident<br />
about near-term growth prospects, they have been noticing<br />
pockets of disappointing growth in Western Europe and the<br />
Chinese construction segment. While Chinese construction<br />
spending appears to be turning up, the weakness in Western<br />
Europe is likely to persist.<br />
Malcolm White<br />
Vice-President,<br />
Portfolio Management<br />
and Portfolio Manager<br />
On the technology side, we are conservatively positioned<br />
as we enter the earnings season. We are seeing signs of a<br />
subdued consumer, especially in areas such large-ticket<br />
television sales. However, we are more positive on business<br />
spending and see good opportunities in software, storage and<br />
services that cater to this segment.<br />
In telecommunications, we continue to believe that we are in<br />
a multi-year cycle of increased spending and want exposure<br />
to companies that will benefit from this trend.<br />
While dividend yields look attractive in the<br />
telecommunication sectors, we believe that increased<br />
spending and problems in Europe will weigh on the sector.<br />
Raw material inflation concerns have eased somewhat when<br />
compared to the first quarter of this year, which should<br />
provide some relief from the growing European macro<br />
concerns. Valuations are at normalized levels for the vast<br />
majority of industrial companies, but growing sovereign risks<br />
around the world could start to challenge investors’ appetite<br />
for cyclical stocks in the near term.<br />
SUMMER 2011 PERSPECTIVE AS AT JUNE 30, 2011 25
Signature Market Roundup<br />
Foreign exchange<br />
Investment-grade bonds<br />
James Dutkiewicz<br />
Vice-President,<br />
Portfolio Management<br />
and Portfolio Manager<br />
Similar to the market’s portrayal of U.S. Treasuries being a<br />
safe harbour, the U.S. dollar benefits during periods of stress.<br />
Because the warts of the U.S. dollar are well documented,<br />
positioning by investors tends to get lopsided on the bearish<br />
side of the ledger. And when the euro, which is currently the<br />
only real reserve currency alternative to the U.S. dollar, is the<br />
centre of the market stresses, the dollar can rally appreciably.<br />
Although not nearly as extreme as 2008, the market pricing<br />
of forwards are suggestive of a shortage of U.S. dollars as some<br />
investors hoard them.<br />
However, the fact is that countries whose currencies have<br />
been dubbed “risk on” due to their positive correlation with<br />
global growth have not lost much ground against the U.S.<br />
dollar. This is indicative of the market beginning to take the<br />
reserve currency stature of the U.S. dollar with a grain of<br />
salt. The more uncertainty regarding the U.S. economy, the<br />
more protracted the ultra-low policy of the Federal Reserve.<br />
In conjunction with looming fiscal constraint this underpins<br />
a soft medium-term outlook for the U.S. dollar against<br />
Australia, Norway, Canada and Brazil.<br />
Europe needs to formulate a plan to more closely unify<br />
the differing fiscal regions. If instituted, then the crisis<br />
in the peripheral economies will have spawned a more<br />
worthy global currency. The market, by pricing in a loss of<br />
confidence in Italy or Spain, is the likely catalyst for joint<br />
fiscal and monetary alignment.<br />
John Shaw<br />
Vice-President,<br />
Portfolio Management<br />
and Portfolio Manager<br />
Investment-grade corporate bonds posted positive returns<br />
during the second quarter of 2011 mainly due to falling<br />
government yields that outweighed the slight rise in spreads.<br />
Corporate bonds outperformed government bonds during<br />
the quarter, but as each month passed corporate bond<br />
performance slipped. On a fundamental basis, corporate<br />
credit remains solid; however it is the political and macroeconomic<br />
concerns that are causing the market’s volatility to<br />
rise and returns fall.<br />
There are a number of issues facing the credit markets at<br />
the beginning of the third quarter that should be resolved<br />
soon – with positive effects on the corporate credit markets.<br />
The supply chain disruptions from Japan should be resolved<br />
in the second half of the year, thus improving industrial<br />
production. The U.S. debt ceiling should be raised once the<br />
political grandstanding is over. And even though inflation has<br />
ticked up, the fact that U.S. economic growth has been subpar<br />
means the Federal Reserve’s monetary policy will remain<br />
very accommodative. Together, these factors are supportive<br />
of stronger economic growth in the second half of the year<br />
and should improve corporate credit strength. However, the<br />
biggest concern for us and the market is how the European<br />
debt crisis will be resolved. All the positives above could be<br />
meaningless unless the Greek crisis is dealt with appropriately<br />
to minimize the effects when Greece eventually re-organizes<br />
or defaults on its unsustainable level of debt.<br />
The outlook for investment-grade corporate bonds is neutral<br />
at this juncture. There are many very good fundamental and<br />
demand reasons to remain positive, but the European debt<br />
crisis tempers those positives.<br />
26 SUMMER 2011 PERSPECTIVE AS AT JUNE 30, 2011
Signature Market Roundup<br />
High-yield bonds<br />
Geof Marshall<br />
Vice-President,<br />
Portfolio Management<br />
and Portfolio Manager<br />
Historically, the high-yield bond market has been strongly<br />
correlated with both industrial production and equity<br />
market volatility (i.e. the VIX). Therefore when the ISM<br />
manufacturing data came in weaker than expected in May,<br />
it is not surprising that high yield sold off alongside stocks.<br />
On the whole, it seems the market underestimated the<br />
global impact to production from supply chain disruptions in<br />
Japan and the impact of rapidly rising commodity prices on<br />
end market demand across a number of industries. Further<br />
macroeconomic uncertainty relating to European sovereign<br />
debt, a Chinese economic growth scare and the end of U.S.<br />
quantitative easing made the second quarter of 2011 feel a<br />
lot like 2010. During the second quarter, the high-yield bond<br />
market pushed higher in April, treaded water in May despite<br />
record year-to-date supply and retreated in June in the face of<br />
large outflows from U.S. mutual funds.<br />
The high-yield bond market returned 0.99% in the second<br />
quarter (Bank of America Merrill Lynch High Yield Master<br />
II Index US$). From the middle of May to the end of the<br />
quarter, the average price of a high-yield bond slipped<br />
approximately 2.25 points to 102.3, while the yield on the<br />
five-year U.S. Treasury bond came in seven basis points lower<br />
to 1.76%. The net result saw the yield on the average highyield<br />
bond widen 65 basis points to Treasuries to end the<br />
quarter at 542 basis points.<br />
Credit experience was mixed in the second quarter as the<br />
portfolio benefited when a number of bonds were tendered<br />
at prices above par. On the other hand, a couple of issuers in<br />
the transportation and food sectors were adversely impacted<br />
by lacklustre demand or rising commodity prices and saw<br />
their bonds slip in value. Netting this against our defensive<br />
positioning resulted in index-like performance for the second<br />
quarter. New names added during the quarter include the<br />
U.S. dollar denominated bonds of Brazilian oil and gas<br />
company OGX Petróleo e Gás Participações, Canadian<br />
copper producer Quadra FNX Mining and the term loan of<br />
Canadian energy midstream operator Gibson Energy.<br />
The high-yield market bounced when the Greek parliament<br />
passed its austerity package. Looking into the second half of<br />
the year, the supply chain disruptions from Japan should be<br />
resolved, the U.S. debt ceiling should be raised by September,<br />
corporate deleveraging should continue, and Fed monetary<br />
policy is likely to remain accommodative. Together, these<br />
factors are supportive of stronger economic growth in the<br />
second half of the year and improving corporate credit<br />
strength and lower volatility. As a result, we believe the recent<br />
spread widening will prove the exception, outflows will<br />
abate, and relative and total return investors will return to the<br />
market with conviction.<br />
The market returned 4.93% in the six months ended<br />
June 30. The 542 basis points spread on the average bond<br />
was essentially unchanged from the beginning of the year.<br />
SUMMER 2011 PERSPECTIVE AS AT JUNE 30, 2011 27
Commentary<br />
<strong>CI</strong> Investment Consulting<br />
Alfred Lam<br />
Vice-President<br />
<strong>CI</strong> Investment Consulting<br />
Portfolio Series and Portfolio Select Series<br />
Lacklustre global stock market performance in June and<br />
much of the second quarter was driven largely by economic<br />
news as opposed to corporate fundamentals. Concerns about<br />
a potential Greek debt default and high crude oil prices made<br />
many investors uneasy and added to market volatility. While<br />
the debt situation in Greece will likely take longer to sort<br />
out, declining oil prices have offered some recent relief for<br />
the global economy. The price of oil fell from a recent peak<br />
of US$114 a barrel in April to the mid-US$90s range by<br />
mid-<strong>July</strong>. Higher oil prices lead to increased costs for<br />
businesses and cause households to cut other discretionary<br />
spending. As a consequence, economic growth stalls – and<br />
eventually oil prices fall. We have just witnessed this cycle.<br />
This year, Canadian stocks, as represented by the S&P/TSX<br />
Composite Index, have underperformed foreign markets, as<br />
reflected by the MS<strong>CI</strong> World Index. There are two main<br />
reasons why Canadian stocks have lagged in 2011. First,<br />
domestic stocks were pricier than foreign stocks on valuation<br />
metrics such as price/earnings ratios. Second, the Canadian<br />
market has significantly greater exposure to the resource<br />
sector, which has declined more than the broad markets.<br />
Portfolio performance<br />
Despite the general decline in investor enthusiasm for stocks<br />
lately, foreign markets have done reasonably well this year.<br />
Investors have become more selective and generally favour<br />
stable companies that trade at lower valuations. We like this<br />
environment since it is well suited to our portfolio managers<br />
investment approach – which is to focus on quality stocks at<br />
reasonable valuations, both in Canada and abroad.<br />
In our view, higher oil prices are not sustainable and we have<br />
adopted a more cautious positioning with our portfolios since<br />
the beginning of this year by reducing our resource sector<br />
concentration and putting more emphasis on multi-national<br />
companies that will benefit from growth in the emerging<br />
markets. This disciplined approach has produced attractive<br />
results. We also feel more comfortable relying on good<br />
businesses to generate returns and not by investing solely on<br />
the prospect of ever higher commodity prices – the direction<br />
of which can change every day.<br />
Returns in % 1 year 3 years 5 years 10 years<br />
Since<br />
inception<br />
Portfolio Series Income Fund 10.9 5.6 4.7 5.4 5.1 (Dec. 97)<br />
Portfolio Series Balanced Fund 14.0 2.1 2.4 4.3 6.9 (Nov. 88)<br />
Portfolio Series Growth Fund 16.1 0.5 1.4 n/a 2.9 (Dec. 01)<br />
Select 70i30e Managed Portfolio 8.6 3.1 n/a n/a 2.2 (Nov. 06)<br />
Select 50i50e Managed Portfolio 11.6 2.1 n/a n/a 1.2 (Nov. 06)<br />
Select 30i70e Managed Portfolio 14.5 1.1 n/a n/a 0.2 (Nov. 06)<br />
S&P/TSX Composite Index 20.9 0.2 5.7 8.1 n/a<br />
S&P 500 Index (C$) 18.4 1.5 0.0 -1.8 n/a<br />
MS<strong>CI</strong> World Index (C$) 18.9 -0.8 -0.1 -0.1 n/a<br />
DEX Universe Bond Index 4.7 6.2 6.0 6.5 n/a<br />
Source: <strong>CI</strong>, Bloomberg, PC Bond; All fund returns are for Class A units/shares.<br />
28 SUMMER 2011 PERSPECTIVE AS AT JUNE 30, 2011
Commentary<br />
In addition to the above portfolios, a few comments are<br />
warranted on Select Income Advantage Managed Corporate<br />
Class, which saw improved performance during the quarter as<br />
investors acknowledged the reality of a slower-than-expected<br />
global growth and, as a result, lowered their interest rate<br />
outlook. We do not believe interest rate risk is an immediate<br />
threat for government bond investors as rate moves will<br />
likely be gradual. However, inflation risk is high as real yields<br />
available to government bond investors (net of income tax<br />
and inflation) is now negative. The benefit of Select Income<br />
Advantage fund is its flexible asset allocation, which most bond<br />
funds and benchmark bond indexes do not have.<br />
S&P 500 P/E Multiple<br />
Based on 12 Month Forward Operating Earnings<br />
25<br />
20<br />
15<br />
10<br />
Median: 14.2<br />
Average: 14.3<br />
12.6<br />
Portfolio positioning<br />
We believe stocks are attractive investments today due<br />
primarily to their below-average valuations (see Chart 1).<br />
Economic events and natural disasters tend to bring volatility<br />
to the markets over the short term, but leave no significant<br />
impact on long-term market performance. Volatility is part of<br />
the investment process as market participants well know. To<br />
best manage their investments, investors should know what<br />
they own in their portfolio – factors such as the quality of<br />
the companies, the portfolio’s overall concentration by sector,<br />
country and currency, and most importantly, the price they<br />
pay for their investment.<br />
5<br />
82 84 86 88 90 92 94 96 98 00 02 04 06 08 10 12<br />
Source: TD Newcrest<br />
Chart 1: With the forward P/E ratio for the S&P 500 currently at 12.6, which<br />
is well below the average of 14.3, we feel that stocks are undervalued and<br />
present opportunities for investors.<br />
We have used market weakness to increase our exposure to<br />
emerging markets and global bonds. On the other hand, we<br />
have significantly trimmed our exposure to U.S. small cap<br />
companies as valuations get richer.<br />
Analysts: Yoonjai Shin, Neelam Mistry, Lewis Harkes,<br />
Tony Mallozzi<br />
SUMMER 2011 PERSPECTIVE AS AT JUNE 30, 2011 29
Commentary<br />
Black Creek Investment Management<br />
Bill Kanko<br />
President & Portfolio Manager<br />
Blackcreek Investment Management<br />
The first half of 2011 was an eventful, but unproductive six<br />
months in the international investment world. Macroeconomic<br />
and political concerns again took the spotlight away from<br />
a recovering global economy which is growing now at an<br />
average pace. Of course, this made for interesting headlines<br />
as we read about booming emerging market countries, strong<br />
resource markets, sovereign debt problems, deficit battles and<br />
high inflation in emerging countries.<br />
We continue to believe that the global economy will show<br />
lower-than-normal growth over the next four or five years as<br />
the process of deleveraging continues and as government<br />
spending (almost) everywhere contracts. With oil prices still<br />
well above the levels of 2010, the effect is an additional tax on<br />
the global economy. We must continue to look for companies<br />
that we think can grow at an above-average rate over the next<br />
five to 10 years and where this view is not commonly held by<br />
other investors (is the growth expectation already in the stock<br />
price?). At the same time, we must be aware of the potential<br />
risks to companies in our portfolios from a variety of factors.<br />
These include (but are not limited to):<br />
• which are susceptible to low-cost Chinese or Korean imports?<br />
• which have pricing power (or lack thereof) in an inflationary<br />
environment?<br />
• where is there significant technology or political risk?<br />
• which of our ideas are dependent on cyclical recovery?<br />
• which companies have leverage (positive and negative) to<br />
energy prices?<br />
• which companies are dependent on government funding<br />
or subsidies?<br />
• which companies are dependent on growing employment<br />
levels and consumer spending?<br />
Richard Jenkins<br />
Managing Director<br />
& Portfolio Manager<br />
Blackcreek Investment Management<br />
Aside from these risks and the worrying headlines, we also<br />
believe that the companies we own will be much larger and<br />
more profitable a decade from now, and that the current<br />
prices reflect compelling potential returns over that time.<br />
Castlerock Global Leaders Fund<br />
If the market was a person we could describe it as milquetoast<br />
for both the second quarter and the year-to-date. The<br />
performance of the fund was below that of the market for the<br />
quarter but was largely in line with the markets for the sixmonth<br />
period. Our longer-term performance remains good,<br />
at least in a relative sense, but we are still striving for more<br />
impressive absolute returns. Again, it’s fair to say that markets<br />
over the next 10 years are likely to be more favourable than<br />
they have been over the last 10 years. We believe that the<br />
currency headwind that we have faced since inception of the<br />
fund will shift and become more of a tailwind.<br />
During the quarter, the fund had good relative performance<br />
from Adidas Group, Devry, Galp Energia, Hamamatsu<br />
Photonics and Northrop Grumman. Detractors from<br />
performance included Adobe Systems, Archer Daniels<br />
Midland, Estacio, Murata Manufacturing, Wienerberger<br />
and Wincor Nixdorf. The strength of the Canadian dollar<br />
also reduced returns.<br />
During the second quarter, we sold the positions in Banco<br />
Bradesco, Sealed Air and Wincor Nixdorf, and we continued<br />
to build our new positions in Aramex and Titan Cement<br />
from the end of the first quarter. We also bought an initial<br />
and small position in Biomerieux, a French company that is<br />
a leader in in-vitro diagnostics. We added to a number of the<br />
other holdings, including Adobe, Archer Daniels, Carnival,<br />
30 SUMMER 2011 PERSPECTIVE AS AT JUNE 30, 2011
Commentary<br />
eBay and Wienerberger. Cash at the end of the quarter was<br />
about 4% of the fund, compared to just over 2% at the end of<br />
March and 5% at the beginning of the year.<br />
Castlerock International Equity Fund<br />
We have been selectively adding to our more cyclical holdings<br />
as we had cut them back one year ago. We are finding new<br />
investments in emerging markets and in technology. Our<br />
holdings in companies like Adidas, Glanbia and Galp<br />
Energia have done very well and our Japanese investments<br />
snapped back in value once investors determined that the<br />
tsunami would have little effect on their performance.<br />
What is truly ironic is that the best-performing areas of the<br />
world have been U.S. and European equities this year, proving<br />
that investors overlook and overreact regularly to bad news.<br />
One such area is Chinese equities. We have been looking<br />
at Chinese companies for a very long time (since 1994), yet<br />
we have just started to make commitments now. We seek out<br />
market share-leading companies with sustainable competitive<br />
advantages at reasonable prices that have established<br />
management teams who work for the shareholders. To get<br />
all of these characteristics in a Chinese company is tough.<br />
We have long been very skeptical of the internal allocation of<br />
capital within Chinese companies and also the accounting<br />
for their activities. With recent high-profile compliance<br />
problems, it is our judgment that the cleanup will be<br />
effective. We never doubt the internal drive of the Chinese<br />
business community to be world class in everything they do.<br />
It is their driving force. So we have invested in a Chinese<br />
clinical research company run by former executives from<br />
GSK-Wuxi Pharmatech.<br />
Castlerock Global Balanced Fund<br />
Castlerock Global Balanced Fund performed in line with the<br />
benchmark index for the six-month period. We experienced<br />
a notable loss in one holding – Irish Life – in the quarter as<br />
a desperate new government sought to distance itself from<br />
the previous government and rewrite the regulatory rules<br />
for banks and insurance holding companies. Although legal<br />
actions are underway, the losses have been taken.<br />
It is easy to feel despondent, but then we look at what is<br />
happening with the businesses we own in our focused<br />
international portfolio. Most are doing well, some exceedingly<br />
so. At a valuation level below the long-term global average,<br />
this should yield reasonably good equity results. But when,<br />
we just do not know. The reverse seems to be true in the<br />
fixed-income world. Investors seem to view risk in a binary<br />
fashion. That is, they love the government debt of a country<br />
and then they dump it in a lemming-like behaviour when<br />
they no longer agree that country is credit worthy. To this<br />
point, we have systematically lowered our fixed-income<br />
exposure to government securities as they have risen in price<br />
to the point where we see little long-term value. While it is<br />
costly in total rates of return, we have shortened our exposure<br />
to short-term government securities in wait for opportunities<br />
to buy quality corporate exposures at higher yields.<br />
It seems certain now that the pace of earnings growth will<br />
slow down from recovery levels to normal 4% to 6% levels.<br />
This slowdown has caught some investors off guard, most<br />
notably in the cyclical investment areas like emerging<br />
markets, commodities and cyclical stocks. We have felt<br />
a limited pullback in our portfolio, notably in our smaller<br />
Brazilian holdings and in our construction-oriented<br />
companies and semiconductor holdings.<br />
We have been selectively adding to our more cyclical holdings<br />
as we had cut them back one year ago. We are finding new<br />
investments in emerging markets and in technology. Our<br />
holdings in companies like Adidas, GlaxoSmithKline,<br />
Northrup Grumman, Glanbia, Affymetrix and Galp Energia<br />
have done very well. Our Japanese investments have also<br />
snapped back in value once investors determined that the<br />
tsunami had little effect on these companies.<br />
Director of Equities: Matias Galarce, Evelyn Huang<br />
SUMMER 2011 PERSPECTIVE AS AT JUNE 30, 2011 31
Commentary<br />
Harbour Advisors<br />
Gerry Coleman<br />
Senior Vice-President, <strong>Investments</strong><br />
and Chief Investment Officer<br />
Harbour Fund and<br />
Harbour Growth & Income Fund<br />
The performance variance between Canada and the U.S.<br />
in the second quarter was unusual and therefore notable.<br />
The U.S. market, as measured by the S&P 500 Index,<br />
actually eked out a tiny 0.1% gain. In contrast, the S&P/TSX<br />
Composite Index declined by 5%. While both portfolios had<br />
better relative returns than the index the during the last three<br />
months, they nonetheless experienced declines in net asset<br />
value of approximately 3%.<br />
At quarter-end, Harbour Fund was 92.7% invested in<br />
common stocks (Canadian 52.2%; foreign 40.5%), while the<br />
fund’s cash and equivalent position stood at 7.3%. Harbour<br />
Growth & Income Fund, in contrast, was 76.8% invested in<br />
common stocks (Canadian 50.3%; foreign 26.5%), carried a<br />
bond position of 4.9% and held a cash reserve of 18.3%.<br />
Activity was exceedingly light in both portfolios during the<br />
past quarter. In Harbour Growth & Income Fund, we sold<br />
shares of TMX Group and completed the liquidation of our<br />
entire holding in the early part of <strong>July</strong>. We had started to<br />
liquidate our holding of TMX before the recent merger and<br />
takeover speculation even began, believing that the shares<br />
were fully valued in the mid-$40’s price range. Our share<br />
holding in TMX was purchased at a price of a little more than<br />
$30 per share and we recorded a handsome low-risk profit<br />
on this investment. On the purchase side of the ledger, in<br />
both portfolios we have established a new holding in Abbott<br />
Laboratories, with commentary to follow. We are also in the<br />
midst of building a new share position in a prominent and<br />
well-known, foreign-based, high-quality consumer products<br />
company, which we will have more to say about in our next<br />
report.<br />
Abbott Labs, based in Chicago, is a broad-based, highquality,<br />
health care company. Abbott discovers, develops,<br />
manufactures and markets products and services. The<br />
company has a presence across all stages of health care, from<br />
prevention and diagnosis to treatment and cure. Abbott’s<br />
principal businesses are global pharmaceuticals, nutritional<br />
products, medical products, including diagnostics and<br />
cardiovascular devices. The company has attractive growth<br />
prospects, a strong management team with a proven track<br />
record in mergers and acquisitions, a strong financial position,<br />
and it generates significant free cash flow. The company<br />
also has a strong and growing position in emerging markets.<br />
Abbott has increased its dividend for 37 consecutive years.<br />
Our overall outlook for the stock market remains very<br />
positive and, in our view, stocks are clearly the financial asset<br />
class of choice. As mentioned in our last commentary, the<br />
background factors for stocks remain positive as economic<br />
growth worldwide remains on a positive path, corporate<br />
profits continue to outperform investor expectations,<br />
monetary conditions remain exceedingly positive and last,<br />
but certainly not least, equity market valuations are quite<br />
attractive. Market sentiment in recent weeks has swung from<br />
a position of extreme optimism in early April to a current<br />
level approaching maximum pessimism. The healthy and<br />
needed correction in share prices that we have experienced<br />
since early April, coupled with the sea change in investor<br />
sentiment, now seems largely complete, and we look forward<br />
to a renewal of the secular market advance in coming months.<br />
32 SUMMER 2011 PERSPECTIVE AS AT JUNE 30, 2011
Commentary<br />
Stephen Jenkins<br />
Senior Vice-President, <strong>Investments</strong><br />
Harbour Foreign Equity Corporate Class<br />
and Harbour Foreign Growth & Income<br />
Corporate Class<br />
Results for Harbour’s two global fund portfolios for the three<br />
months ended June 30 were essentially flat during the quarter.<br />
Harbour Foreign Equity produced a slight increase of 0.5%<br />
during the quarter, while Harbour Foreign Growth & Income<br />
saw a slight decrease of 0.7%. The MS<strong>CI</strong> World Index (C$)<br />
experienced a modest decline of 0.3% over the period.<br />
Harbour Foreign Equity ended the quarter with 91% of the<br />
assets invested in global stocks; cash was 9%. We began the<br />
quarter with ownership in 39 companies. During the three<br />
months, we initiated two new positions and sold two – keeping<br />
our tally unchanged. Of the 39 companies currently in the<br />
portfolio, 18 are domiciled in North America, 14 in Europe,<br />
and seven within the Asia-Pacific region.<br />
MasterCard, our single largest holding, was the top contributor<br />
during the quarter. The long-awaited final ruling with regard<br />
to interchange fees (the Durbin Amendment) within the credit<br />
card industry was released toward quarter-end. In a nutshell, the<br />
ruling proved less onerous to industry players and a lingering<br />
cloud of uncertainty was lifted. Most importantly, the close<br />
of this regulatory chapter will allow the market to once again<br />
focus on the fundamentals of the underlying business – which<br />
in MasterCard’s case are exceptionally strong.<br />
Other notable contributors to performance include Diageo,<br />
Discover Financial, Foster’s Group, and GlaxoSmithKline.<br />
Predominant detractors were Hess Corp, Nintendo, Suncor<br />
Energy, and Ultra Petroleum.<br />
Buying during the quarter included the addition of two new<br />
positions – one a small U.K.-based food services company, the<br />
other a mid-sized U.S.-based consumer products packaging<br />
company. We are still in the process of building these positions<br />
and as a result they both remain undisclosed at this time.<br />
On the other side, we sold our positions in Schneider Electric<br />
and Grafton Group – booking gains in each case. Challenging<br />
operating environments, coupled with relatively high<br />
valuations, were the main reasons for selling. In addition, we<br />
reduced our holdings in food manufacturer Nestlé and energy<br />
service company Patterson UTI during the quarter.<br />
The asset mix of the Harbour Foreign Growth & Income at<br />
quarter-end was little changed during the quarter: 75% stocks,<br />
8% bonds, 17% cash and equivalents. On an absolute basis,<br />
and relative to stocks, bonds remain highly unattractive in<br />
our mind as a long-term investment choice. With real yields<br />
near zero for leading sovereign credits, investors are not being<br />
properly compensated for the risks associated with owning<br />
these low-yielding securities over the coming years. We have<br />
been finding some wonderful alternative income streams in the<br />
form of good old dividend-paying stocks. We will continue to<br />
seek out opportunities to raise the contribution within Harbour<br />
Foreign Growth & Income from high-quality, robust dividendpaying<br />
companies. In fact, since quarter-end, our cash balance<br />
has dropped due to further additions to the portfolio.<br />
As we enter the second half of 2011, investors are worried about<br />
a number of global economic issues: Greece’s debt problems,<br />
the end of quantitative easing (QE2), inflationary pressures<br />
in the emerging economies, high levels of unemployment,<br />
and the ineffectual negotiations surrounding the looming<br />
deadline to raise the U.S. debt ceiling. We, on the other<br />
hand, are focused on the attractive underlying fundamentals<br />
of today’s markets, which include strong corporate balance<br />
sheets, growing corporate earnings, share repurchases, higher<br />
dividend payouts, a nascent mergers and acquisition cycle,<br />
accommodative monetary policy and inexpensive stock<br />
valuations. These important fundamentals and underpinnings<br />
are likely to prove significant drivers of stock returns over the<br />
coming periods, outweighing the many press-worthy economic<br />
issues that are besieging the investing public.<br />
We feel very good about the way our portfolios are currently<br />
structured. Growth prospects for our invested companies<br />
remain attractive, their balance sheets are strong and their<br />
valuations are modest – all reasons for us to remain optimistic.<br />
Analysts: Douglas Cooper, Phil D’Iorio, Jared Spice,<br />
Aleksy Wojcik<br />
Additionally, we took advantage of weakness within the<br />
financial sector to boost our positions in both JPMorgan Chase<br />
and BNY Mellon.<br />
SUMMER 2011 PERSPECTIVE AS AT JUNE 30, 2011 33
Commentary<br />
Cambridge Advisors<br />
Alan Radlo<br />
Senior Vice-President,<br />
Portfolio Management and<br />
Chief Investment Officer<br />
Investors’ growth expectations were excessive following a strong<br />
second half of 2010. However, the economy began to slow<br />
during the first part of 2011, due to sharply higher oil prices and<br />
the ripple effect of the Japan earthquake. The latter created an<br />
inventory scare, prompting many manufacturers and suppliers<br />
to increase their parts inventories to guard against possible<br />
shortages. Meanwhile, China and Brazil were attempting to<br />
slow down their over-heating markets, which removed the<br />
momentum behind emerging markets’ economic growth.<br />
Those events caused commodity prices – and values of stocks<br />
related to commodities – to adjust to the economic reality as<br />
the period progressed. This translated into a rough quarter for<br />
equity markets worldwide. The bloom came off the Canadian<br />
market, which fell 5.2% during the quarter, while markets<br />
elsewhere struggled to earn flat returns.<br />
We believe the economy is in mid-cycle slowdown, not<br />
approaching recession. Equity market liquidity is ample and<br />
corporate balance sheets are in good shape, translating into<br />
solid market fundamentals.<br />
Cambridge Canadian Equity Corporate Class suffered a<br />
small loss during the quarter, although it outperformed its<br />
benchmark. Performance was largely driven by overweight<br />
positions in industrials and consumer staples, and offset by an<br />
overweight position in information technology. The portfolio<br />
was underweight the declining energy and financials sectors,<br />
although the portfolio holds large positions in both. The<br />
fund’s largest position was in energy, where we reduced<br />
holdings in integrated oil and gas producers in favour of oil<br />
services stocks, which are less sensitive to energy prices. In<br />
financials, we continue to favour non-bank firms, adding<br />
real estate companies with financial elements, as well as<br />
insurance providers. We added to consumer staples through<br />
Shoppers Drug Mart, which became the fund’s largest<br />
individual holding. Tourmaline, Keyera and Onex made the<br />
biggest contributions to performance, while Interprovincial<br />
Pipelines was the biggest detractor.<br />
Cambridge Canadian Asset Allocation Corporate Class<br />
matched its benchmark during the quarter. Many of the<br />
fund’s equity holdings are similar to that of Cambridge<br />
Canadian Equity. We continued to avoid bonds and other<br />
fixed-income securities in favour of equity securities with<br />
excellent yields and growth potential. We increased the real<br />
estate investment trust holdings toward the end of the period.<br />
We believe that these, along with energy-related trusts, should<br />
out-distance corporate and government bonds over the next<br />
few years. Keyera, Tourmaline and Pembina made the<br />
biggest contributions to performance, while Interprovincial<br />
Pipelines was the biggest detractor.<br />
Cambridge American Equity Fund underperformed its<br />
benchmark for the three months. Cambridge Advisors was<br />
appointed portfolio manager of this fund on June 6 and we<br />
have significantly changed its holding to reflect our<br />
approach. Its focus has been shifted to industrials, information<br />
technology and health care, away from consumer<br />
discretionary, financials and consumer staples. The fund is<br />
underweight energy and financials. Baxter, HanesBrands and<br />
Sprint Nextel made the biggest contributions to performance,<br />
while JPMorgan Chase was the biggest detractor.<br />
<strong>CI</strong> Cambridge Global Equity Corporate Class<br />
outperformed its benchmark, due in part to the strength<br />
of overweight positions in health care and an underweight<br />
position in financials. Our focus was on major global<br />
technology and industrial-related companies, particularly<br />
in the laser, automotive and aerospace-related industries.<br />
Tourmaline, Volkswagen and Leoni made the biggest<br />
contributions to performance, while OGX – which we sold<br />
during the period – detracted from performance.<br />
Analysts: Greg Dean, Stephen Groff, Emi Winterer<br />
34 SUMMER 2011 PERSPECTIVE AS AT JUNE 30, 2011
Tetrem Capital Management Ltd.<br />
Commentary<br />
Daniel Bubis<br />
President and Chief Investment Officer<br />
Since last quarter, financial markets have taken a decidedly<br />
“risk off” perspective as the S&P/TSX Composite Index and<br />
the S&P 500 Index both witnessed corrections in the second<br />
quarter. At the end of the first quarter, our view was and<br />
remains that we are in a bull market. Trying to predict nearterm<br />
fluctuations in share prices is a reactive fool’s game,<br />
which only serves to whipsaw investors. We saw this in the<br />
days leading up to, and coming out of, the <strong>July</strong> long weekend.<br />
Portfolio managers who extended their long weekend by<br />
heading out early missed a market surge, with the S&P/TSX<br />
climbing 5.0% from recent lows and the S&P 500 coming<br />
to within 0.8% of its post-financial crisis highs. Given the<br />
experience over the past few years, the resolve to remain<br />
invested is continually tested.<br />
Investors were psychologically wounded by the 2008 financial<br />
crisis and its aftermath, and the healing process will take<br />
some time. Excessive use of debt in earlier decades has left us<br />
with a legacy of ongoing deleveraging. If the 2008 financial<br />
crisis was the earthquake, debt crises since then have been<br />
its aftershocks. Thus far we have avoided another “big one”<br />
– even though each new aftershock makes investors run for<br />
cover, as they have been conditioned to do so.<br />
Late in 2009, the first aftershock came from Dubai. Dubai<br />
presaged the European sovereign debt crisis, whose tremors<br />
were initially felt in the first half of 2010 when “PIIGS”<br />
(Portugal, Ireland, Italy, Greece and Spain) entered the<br />
investment vernacular. European sovereign woes represent<br />
the most serious aftershocks since the traumatic failure of<br />
Lehman Brothers in 2008. Their epicentre has been Greece<br />
– somewhat ironically the cradle of Western civilization. The<br />
first shock occurred in the first half of 2010 and triggered<br />
corrections in the S&P/TSX and the S&P 500 into <strong>July</strong> 2010.<br />
What was particularly frightening was the risk of financial<br />
contagion spreading to the rest of Europe and the threat to<br />
the global economy of a double-dip recession. Last year’s<br />
Greek crisis eventually stabilized as the economically<br />
stronger northern parts of Europe provided Greece with<br />
stopgap financial backing. Unfortunately, the fault lines run<br />
deep, so here we are one year later with a relapse and a new<br />
round of financial aftershocks.<br />
Euro vs. U.S. dollar<br />
1,7<br />
1,6<br />
1,5<br />
1,4<br />
1,3<br />
1,2<br />
1,1<br />
Dec.<br />
2008<br />
Jun.<br />
2009<br />
Dec.<br />
2009<br />
Source: Bloomberg. As of June 30, 2011.<br />
Crisis I<br />
Jun.<br />
2010<br />
Dec.<br />
2010<br />
Crisis II<br />
Jun.<br />
2011<br />
Chart 1: Despite the current crisis in Greece, this time around the euro has<br />
remained relatively stable against the U.S. dollar. Currently, it is trading around<br />
US$1.40 – a far cry from the US$1.20 it hit during the first Greek crisis.<br />
Interestingly, in this current bout of risk off, the euro has<br />
remained relatively stable, as can be seen in Chart 1. If<br />
the current crisis is so threatening to the European Union,<br />
wouldn’t it be reasonable to expect euro weakness, similar<br />
to last year’s crisis? Exchange rate mechanisms are extremely<br />
complex and are affected by many variables – that is why<br />
predicting a future currency level is nearly impossible. For<br />
instance, the relative stability of the euro now may be more<br />
about investor apathy towards the U.S. dollar than comfort<br />
with the euro. More likely, it has something to do with<br />
the European Central Bank’s hawkish stance on inflation<br />
– a position it may not be able to afford for much longer.<br />
SUMMER 2011 PERSPECTIVE AS AT JUNE 30, 2011 35
Commentary<br />
However, if investors were truly concerned with financial<br />
collapse in Europe, the euro would not be holding up as<br />
well as it has. The euro could yet collapse or it may rally<br />
to new highs – making a prediction is not the objective of<br />
this analysis. The point is that, rightly or wrongly, the euro<br />
exchange has yet to flash a crisis signal.<br />
In a similar vein, European sovereign debt concerns have<br />
not yet triggered a material decline in the U.S. Financial<br />
Conditions Index as they did one year ago (Chart 2). This is a<br />
bit surprising, particularly given recently heightened concerns<br />
of a slowdown in China over inflationary risks. Additionally,<br />
the world’s third-largest economy, Japan, is acting as an<br />
economic drag in the wake of the Fukushima disaster. And<br />
yet, financial conditions remain positive within the U.S.,<br />
whereas one year ago they had turned negative. Note that the<br />
chart illustrates the immense size of the financial earthquake<br />
in the fourth quarter of 2008 and the ensuing aftershocks,<br />
thus providing some perspective. Importantly, the aftershocks<br />
are getting smaller.<br />
Perhaps the forces of healing have taken hold as we move<br />
towards the three-year anniversary of the collapse of Lehman?<br />
Corporate balance sheets of North American companies are<br />
in phenomenal condition, providing the economy with a<br />
basis of financial stability that simply did not exist three years<br />
ago. While economic growth has been sluggish and U.S.<br />
employment lags, S&P 500 earnings per share are estimated<br />
to reach a record level of US$99.27 this year, surpassing the<br />
previous record of US$84.67 set in 2007. Equities are cheap.<br />
During the lows of late June, the S&P 500 was trading at its<br />
second-lowest price-to-earnings ratio (on 2011 estimates)<br />
since 1985. The only time, since 1985, the U.S. market was<br />
cheaper was during the panic sell-off that occurred in the six<br />
months after Lehman’s collapse. Even the much-maligned<br />
U.S. consumer is in better shape. According to Equifax,<br />
average credit scores in June reached their highest level in<br />
over four years. So, while U.S. federal deficits continue to<br />
expand, corporations and consumers are improving their<br />
financial conditions. Eventually, the U.S. government will<br />
need to get in on the act, and we will see what happens with<br />
the debt ceiling negotiations this summer.<br />
Deleveraging is a continuous process and investors should<br />
expect more aftershocks. However, they should not forget that<br />
bull markets are characterized by two steps forward followed<br />
by one step back. Overall, positive fundamentals – continued<br />
liquidity, good valuation support and restrained sentiment –<br />
outweigh the negative macro risks and the market is prepared<br />
for a step forward.<br />
Bloomberg U.S. Financial Conditions Index<br />
2<br />
0<br />
-2<br />
-4<br />
-6<br />
-8<br />
-10<br />
-12<br />
-14<br />
Dec.<br />
2006<br />
Jun.<br />
2007<br />
Dec.<br />
2007<br />
Jun.<br />
2008<br />
Dec.<br />
2008<br />
Source: Bloomberg. As of June 30, 2011.<br />
Jun.<br />
2009<br />
Chart 2: The current Greek crisis and concerns over European sovereign debt<br />
has not triggered a material decline in the U.S. Financial Conditions Index<br />
– as it did a year ago.<br />
Managers: Aaron Clark, Alec MacIsaac<br />
Analysts: Ben Boult, Steve Maksymyk<br />
Dec.<br />
2009<br />
Crisis I<br />
Jun.<br />
2010<br />
Dec.<br />
2010<br />
Crisis II<br />
Jun.<br />
2011<br />
36 SUMMER 2011 PERSPECTIVE AS AT JUNE 30, 2011
In choosing the Fund Manager of the Decade, the analysts at<br />
Morningstar Canada surveyed the records of hundreds of money managers.<br />
As they went through this process, one person stood out:<br />
Eric Bushell, Chief Investment Officer of Signature Global Advisors.<br />
SUMMER 2011 PERSPECTIVE AS AT JUNE 30, 2011 37
June 2011<br />
Portfolio Series<br />
Portfolio Series Income Fund 39<br />
Portfolio Series Conservative Fund 40<br />
Portfolio Series Conservative Balanced Fund 41<br />
Portfolio Series Balanced Fund 42<br />
Portfolio Series Balanced Growth Fund 43<br />
Portfolio Series Growth Fund 44<br />
Portfolio Series Maximum Growth Fund 45<br />
Global Equity Funds<br />
Cambridge Global Equity Corporate Class 46<br />
<strong>CI</strong> Global Fund 47<br />
<strong>CI</strong> Global High Dividend Advantage Fund 48<br />
Harbour Foreign Equity Corporate Class 49<br />
Synergy Global Corporate Class 50<br />
<strong>CI</strong> International Value Fund 51<br />
<strong>CI</strong> Emerging Markets Fund 52<br />
American Equity Funds<br />
<strong>CI</strong> American Managers ® Corporate Class 53<br />
<strong>CI</strong> American Value Corporate Class 54<br />
Canadian Equity Funds<br />
Cambridge Canadian Equity Corporate Class 55<br />
<strong>CI</strong> Canadian Investment Fund 56<br />
Harbour Fund 57<br />
Signature Select Canadian Fund 58<br />
Synergy Canadian Corporate Class 59<br />
Balanced Funds<br />
Cambridge Canadian Asset Allocation Corp. Class 60<br />
Harbour Growth & Income Fund 61<br />
Signature Income & Growth Fund 62<br />
Signature Canadian Balanced Fund 63<br />
Industry-specific Funds<br />
Signature Canadian Resource Fund 64<br />
Signature Global Energy Corporate Class 65<br />
Income Funds<br />
Signature Canadian Bond Fund 66<br />
Signature Dividend Fund 67<br />
Signature High Income Fund 68<br />
Signature Diversified Yield Fund 69<br />
Signature Corporate Bond Fund 70<br />
*Assets under management are at the end of the most recent quarter ending March 31, June 30, September 30 or December 31.<br />
Globefund<br />
The information on these pages/profiles is for informational purposes only. CTVglobemedia Publishing Inc., its affiliates and content<br />
licensors assume no liability for any inaccurate, delayed or incomplete information, nor for any actions taken in reliance thereon. The<br />
information contained about each individual and firm has been supplied by such individual or firm without verification by us. Past<br />
performance is not necessarily indicative of future performance. Prior to making any investment decision, it is recommended that you<br />
consult directly with the individual or firm and seek advice from a qualified investment advisor.<br />
<strong>CI</strong> <strong>Investments</strong> Inc. disclaimer<br />
Commissions, trailing commissions, management fees and expenses all may be associated with mutual fund investments. Please read the prospectus<br />
before investing. Unless otherwise indicated and except for returns for periods less than one year, the indicated rates of return are the historical<br />
annual compounded total returns including changes in security value. All performance data assume reinvestment of all distributions or dividends<br />
and do not take into account sales, redemption, distribution or optional charges or income taxes payable by any securityholder that would have<br />
reduced returns. Mutual funds are not guaranteed, their values change frequently and past performance may not be repeated. All commentaries are<br />
published by <strong>CI</strong> <strong>Investments</strong> Inc. They are provided as a general source of information and should not be considered personal investment advice or an<br />
offer or solicitation to buy or sell securities. Every effort has been made to ensure that the material contained in the commentary is accurate at the<br />
time of publication. However, <strong>CI</strong> <strong>Investments</strong> Inc. cannot guarantee the accuracy of the commentary or of the information provided by Globefund. <strong>CI</strong><br />
<strong>Investments</strong> Inc. accepts no responsibility for any loss arising from any use of or reliance on the information contained herein.<br />
38 SUMMER 2011 PERSPECTIVE AS AT JUNE 30, 2011
Fund Facts<br />
as at June 30, 2011<br />
Fund Codes<br />
ISC<br />
DSC<br />
LSC<br />
Class A<br />
<strong>CI</strong>G7740<br />
<strong>CI</strong>G7745<br />
<strong>CI</strong>G1745<br />
Portfolio Series Income Fund (Class A)<br />
Also available: Class F & I<br />
Managed Solutions<br />
(Class A)<br />
Managed By: <strong>CI</strong> <strong>Investments</strong> Inc.<br />
Advisors: <strong>CI</strong> Investment Consulting<br />
Assets Under Management*: $473.8 million<br />
Portfolio Manager: Multi−manager<br />
Asset Class: Asset Allocation<br />
Inception Date: November 1997<br />
NAV: $11.11<br />
Min. Initial Investment: $500<br />
Subsequent Purchase(s): $50<br />
Min. PAC Investment: $50<br />
Management Expense Ratio: 2.00%<br />
ÿ<br />
Top Holdingsas at June 30, 2011<br />
<strong>CI</strong> Global Bond 19.49%<br />
<strong>CI</strong> Signature Canadian Bond Class I 18.92%<br />
<strong>CI</strong> Signature High Income 16.88%<br />
<strong>CI</strong> Signature Corporate Bond 12.97%<br />
<strong>CI</strong> Signature Income & Growth 10.45%<br />
<strong>CI</strong> Glb High Dividend Adv. Corp Cl 9.34%<br />
<strong>CI</strong> Signature Div Yield Corp Class 6.14%<br />
<strong>CI</strong> Signature Div Corporate Class 5.20%<br />
Total 99.39%<br />
OBJECTIVE<br />
This portfolio’s objective is to emphasize income by investing primarily in income−oriented mutual funds. The portfolio may also invest in<br />
equity mutual funds to achieve modest capital appreciation. Any change to the investment objective must be approved by a majority of<br />
votes cast at a meeting of unitholders held for that reason.<br />
Compound Returns and Quartile Rankings (as at June 30, 2011)<br />
This table shows the historical annual compound total return of the fund compared with the Globefund Group Average and Globefund’s<br />
benchmark Blend: 40% MS<strong>CI</strong> World, 60% Barclays Cap. The returns listed below are percentages. Performance of the fund versus its<br />
official benchmark can be found in the Management Report of Fund Performance (MRFP). See the related document section on this web<br />
page.<br />
Since<br />
YTD 1Mo 3Mo 1Yr 3Yr 5Yr 10Yr Inception*<br />
Qrtl 1 2 1 1 1 1 1 {N/A}<br />
Return 2.92 −1.06 1.17 10.94 5.63 4.68 5.44 5.05<br />
Grp Avg 1.86 −1.11 0.37 9.78 3.98 3.37 3.23 {N/A}<br />
Ind Ret 0.69 −1.36 0.9 3.92 2.83 2.39 0.95 {N/A}<br />
*November 17, 1997<br />
Performance Data<br />
This chart shows you the fund´s annual performance and how an investment would have changed over time.<br />
20%<br />
0%<br />
−20%<br />
5.1<br />
3.6<br />
8.5<br />
<strong>CI</strong> Portfolio Series Income<br />
7.7<br />
6.2<br />
−1.1<br />
−7.5<br />
2001 2002 2003 2004 2005 2006 2007 2008 2009 2010<br />
7.1<br />
14.6<br />
8.8<br />
Volatility Meter<br />
Low<br />
High<br />
Based on 3−year standard deviation relative to other funds<br />
in its category, from Globe HySales.<br />
Equity Style and Capitalization Overview<br />
Blend Growth Value<br />
Large<br />
Mid<br />
Small<br />
Asset Class<br />
Income 70.0%<br />
International Equities 5.0%<br />
Canadian Equities 20.0%<br />
American Equities 5.0%<br />
Current Value of a $10,000 Investment<br />
<strong>CI</strong> Portfolio Series Income<br />
$18,000<br />
$16,000<br />
$14,000<br />
$12,000<br />
$10,000<br />
$8,000<br />
$6,000<br />
$16,793<br />
$4,000<br />
$2,000<br />
$0<br />
Dec02 Dec04 Dec06 Dec08 Dec10<br />
Source: <strong>CI</strong> <strong>Investments</strong> and CTVglobemedia Publishing Inc.<br />
SUMMER 2011 PERSPECTIVE AS AT JUNE 30, 2011 39
Fund Facts<br />
as at June 30, 2011<br />
Fund Codes<br />
ISC<br />
DSC<br />
LSC<br />
Class A<br />
<strong>CI</strong>G7770<br />
<strong>CI</strong>G7775<br />
<strong>CI</strong>G1775<br />
Managed Solutions<br />
(Class A)<br />
Portfolio Series Conservative Fund (Class A)<br />
Also available: Class F & I<br />
Managed By: <strong>CI</strong> <strong>Investments</strong> Inc.<br />
Advisors: <strong>CI</strong> Investment Consulting<br />
Assets Under Management*: $446.1 million<br />
Portfolio Manager: Multi−manager<br />
Asset Class: Asset Allocation<br />
Inception Date: November 1997<br />
NAV: $13.45<br />
Min. Initial Investment: $500<br />
Subsequent Purchase(s): $50<br />
Min. PAC Investment: $50<br />
Management Expense Ratio: 2.29%<br />
ÿ<br />
Top Holdingsas at June 30, 2011<br />
<strong>CI</strong> Signature Canadian Bond Class I 22.75%<br />
<strong>CI</strong> Signature High Income 11.02%<br />
<strong>CI</strong> Global Bond 10.65%<br />
<strong>CI</strong> Signature Corporate Bond 9.97%<br />
<strong>CI</strong> Canadian Investment Corp Class 6.23%<br />
<strong>CI</strong> Synergy Canadian Corporate Class 6.22%<br />
<strong>CI</strong> Signature Select Cdn Corp Cl 6.17%<br />
<strong>CI</strong> International Value Corp Class 4.74%<br />
<strong>CI</strong> American Value Corporate Class 4.71%<br />
<strong>CI</strong> Signature Div Yield Corp Class 4.05%<br />
OBJECTIVE<br />
This portfolio’s objective is to provide a balance between income and capital growth at lower than average levels of volatility by<br />
investing in income and equity mutual funds. Any change to the investment objective must be approved by a majority of votes cast at a<br />
meeting of unitholders held for that reason.<br />
Compound Returns and Quartile Rankings (as at June 30, 2011)<br />
This table shows the historical annual compound total return of the fund compared with the Globefund Group Average and Globefund’s<br />
benchmark Blend: 60% MS<strong>CI</strong> World, 40% Barclays Cap. The returns listed below are percentages. Performance of the fund versus its<br />
official benchmark can be found in the Management Report of Fund Performance (MRFP). See the related document section on this web<br />
page.<br />
Since<br />
YTD 1Mo 3Mo 1Yr 3Yr 5Yr 10Yr Inception*<br />
Qrtl 1 1 1 2 2 2 2 {N/A}<br />
Return 1.97 −1.32 0.07 12.22 3.38 3.29 4.9 4.9<br />
Grp Avg 1.31 −1.65 −0.85 12.84 2.76 2.84 3.52 {N/A}<br />
Ind Ret 1.27 −1.57 0.58 8.93 1.82 1.7 0.72 {N/A}<br />
*November 17, 1997<br />
Performance Data<br />
This chart shows you the fund´s annual performance and how an investment would have changed over time.<br />
20%<br />
0%<br />
−20%<br />
2.8<br />
−1.0<br />
11.2<br />
<strong>CI</strong> Portfolio Series Conservative<br />
9.1<br />
8.7<br />
−1.5<br />
−13.9<br />
2001 2002 2003 2004 2005 2006 2007 2008 2009 2010<br />
9.8<br />
15.1<br />
8.9<br />
Total 86.51%<br />
Volatility Meter<br />
Asset Class<br />
Current Value of a $10,000 Investment<br />
<strong>CI</strong> Portfolio Series Conservative<br />
Low<br />
High<br />
Based on 3−year standard deviation relative to other funds<br />
in its category, from Globe HySales.<br />
Income 55.0%<br />
International Equities 9.0%<br />
Canadian Equities 20.0%<br />
$18,000<br />
$16,000<br />
$14,000<br />
$16,044<br />
Equity Style and Capitalization Overview<br />
Blend Growth Value<br />
Large<br />
Mid<br />
Small<br />
American Equities 16.0%<br />
$12,000<br />
$10,000<br />
$8,000<br />
$6,000<br />
$4,000<br />
$2,000<br />
$0<br />
Dec02 Dec04 Dec06 Dec08 Dec10<br />
Source: <strong>CI</strong> <strong>Investments</strong> and CTVglobemedia Publishing Inc.<br />
40 SUMMER 2011 PERSPECTIVE AS AT JUNE 30, 2011
Fund Facts<br />
as at June 30, 2011<br />
Fund Codes<br />
ISC<br />
DSC<br />
LSC<br />
Class A<br />
<strong>CI</strong>G2600<br />
<strong>CI</strong>G3600<br />
<strong>CI</strong>G1600<br />
Managed Solutions<br />
(Class A)<br />
Portfolio Series Conservative Balanced Fund (Class A)<br />
Also available: Class F & I<br />
Managed By: <strong>CI</strong> <strong>Investments</strong> Inc.<br />
Advisors: <strong>CI</strong> Investment Consulting<br />
Assets Under Management*: $437.1 million<br />
Portfolio Manager: Multi−manager<br />
Asset Class: Asset Allocation<br />
Inception Date: December 2001<br />
NAV: $12.70<br />
Min. Initial Investment: $500<br />
Subsequent Purchase(s): $50<br />
Min. PAC Investment: $50<br />
Management Expense Ratio: 2.43%<br />
ÿ<br />
Top Holdingsas at June 30, 2011<br />
<strong>CI</strong> Signature Canadian Bond Class I 19.35%<br />
<strong>CI</strong> Signature High Income 9.80%<br />
<strong>CI</strong> Global Bond 9.71%<br />
<strong>CI</strong> Signature Corporate Bond 7.94%<br />
<strong>CI</strong> Canadian Investment Corp Class 7.12%<br />
<strong>CI</strong> Signature Select Cdn Corp Cl 5.81%<br />
<strong>CI</strong> International Value Corp Class 5.23%<br />
<strong>CI</strong> International Corporate Class 4.37%<br />
<strong>CI</strong> American Value Corporate Class 3.99%<br />
<strong>CI</strong> Synergy Canadian Corporate Class 3.98%<br />
OBJECTIVE<br />
This portfolio’s objective is to provide a conservative total return with lower than average volatility by investing directly in other mutual<br />
funds managed by <strong>CI</strong>. Any change to the investment objective must be approved by a majority of votes cast at a meeting of unitholders<br />
held for that reason.<br />
Compound Returns and Quartile Rankings (as at June 30, 2011)<br />
This table shows the historical annual compound total return of the fund compared with the Globefund Group Average and Globefund’s<br />
benchmark Blend: 60% MS<strong>CI</strong> World, 40% Barclays Cap. The returns listed below are percentages. Performance of the fund versus its<br />
official benchmark can be found in the Management Report of Fund Performance (MRFP). See the related document section on this web<br />
page.<br />
Since<br />
YTD 1Mo 3Mo 1Yr 3Yr 5Yr 10Yr Inception*<br />
Qrtl 1 2 2 2 2 2 {N/A} {N/A}<br />
Return 1.68 −1.55 −0.24 12.72 2.71 2.75 {N/A} 4.19<br />
Grp Avg 1.31 −1.65 −0.85 12.84 2.76 2.84 3.52 {N/A}<br />
Ind Ret 1.27 −1.57 0.58 8.93 1.82 1.7 0.72 {N/A}<br />
*December 17, 2001<br />
Performance Data<br />
This chart shows you the fund´s annual performance and how an investment would have changed over time.<br />
20%<br />
0%<br />
−20%<br />
−3.7<br />
10.8<br />
<strong>CI</strong> Portfolio Series Conserv Bal<br />
8.6<br />
8.6<br />
−2.3<br />
−16.0<br />
2001 2002 2003 2004 2005 2006 2007 2008 2009 2010<br />
10.6<br />
15.7<br />
8.6<br />
Total 77.30%<br />
Volatility Meter<br />
Asset Class<br />
Current Value of a $10,000 Investment<br />
<strong>CI</strong> Portfolio Series Conserv Bal<br />
Low<br />
High<br />
Based on 3−year standard deviation relative to other funds<br />
in its category, from Globe HySales.<br />
International Equities 13.0%<br />
Canadian Equities 22.0%<br />
Income 45.0%<br />
$16,000<br />
$14,000<br />
$12,000<br />
$14,570<br />
Equity Style and Capitalization Overview<br />
American Equities 20.0%<br />
$10,000<br />
Blend Growth Value<br />
$8,000<br />
Large<br />
$6,000<br />
Mid<br />
Small<br />
$4,000<br />
$2,000<br />
$0<br />
Dec02 Dec04 Dec06 Dec08 Dec10<br />
Source: <strong>CI</strong> <strong>Investments</strong> and CTVglobemedia Publishing Inc.<br />
SUMMER 2011 PERSPECTIVE AS AT JUNE 30, 2011 41
Fund Facts<br />
as at June 30, 2011<br />
Fund Codes<br />
ISC<br />
DSC<br />
LSC<br />
Class A<br />
<strong>CI</strong>G7710<br />
<strong>CI</strong>G7715<br />
<strong>CI</strong>G1715<br />
Portfolio Series Balanced Fund (Class A)<br />
Also available: Class F, I & T<br />
Managed Solutions<br />
(Class A)<br />
Managed By: <strong>CI</strong> <strong>Investments</strong> Inc.<br />
Advisors: <strong>CI</strong> Investment Consulting<br />
Assets Under Management*: $1,520.5 million<br />
Portfolio Manager: Multi−manager<br />
Asset Class: Asset Allocation<br />
Inception Date: November 1988<br />
NAV: $23.11<br />
Min. Initial Investment: $500<br />
Subsequent Purchase(s): $50<br />
Min. PAC Investment: $50<br />
Management Expense Ratio: 2.43%<br />
ÿ<br />
Top Holdingsas at June 30, 2011<br />
<strong>CI</strong> Signature Canadian Bond Class I 14.91%<br />
<strong>CI</strong> Canadian Investment Corp Class 9.10%<br />
<strong>CI</strong> Signature High Income 8.85%<br />
<strong>CI</strong> Signature Select Cdn Corp Cl 7.85%<br />
<strong>CI</strong> Global Bond 6.95%<br />
<strong>CI</strong> Signature Corporate Bond 6.48%<br />
<strong>CI</strong> International Value Corp Class 5.92%<br />
<strong>CI</strong> International Corporate Class 5.24%<br />
<strong>CI</strong> Synergy Canadian Corporate Class 5.08%<br />
<strong>CI</strong> American Value Corporate Class 4.47%<br />
OBJECTIVE<br />
This portfolio’s objective is to provide a balance between income and long−term capital growth while diversifying risk by investing in<br />
income and equity mutual funds. Any change to the investment objective must be approved by a majority of votes cast at a meeting of<br />
unitholders held for that reason.<br />
Compound Returns and Quartile Rankings (as at June 30, 2011)<br />
This table shows the historical annual compound total return of the fund compared with the Globefund Group Average and Globefund’s<br />
benchmark Blend: 60% MS<strong>CI</strong> World, 40% Barclays Cap. The returns listed below are percentages. Performance of the fund versus its<br />
official benchmark can be found in the Management Report of Fund Performance (MRFP). See the related document section on this web<br />
page.<br />
Since<br />
YTD 1Mo 3Mo 1Yr 3Yr 5Yr 10Yr Inception*<br />
Qrtl 1 1 2 2 1 1 1 {N/A}<br />
Return 1.49 −1.66 −0.6 13.97 2.06 2.37 4.27 6.94<br />
Grp Avg 0.67 −2.0 −1.36 14.12 1.0 1.2 2.32 {N/A}<br />
Ind Ret 1.27 −1.57 0.58 8.93 1.82 1.7 0.72 {N/A}<br />
*November 9, 1988<br />
Performance Data<br />
This chart shows you the fund´s annual performance and how an investment would have changed over time.<br />
20%<br />
0%<br />
−20%<br />
−0.2<br />
−6.8<br />
13.2<br />
<strong>CI</strong> Portfolio Series Balanced<br />
9.9<br />
11.2<br />
−2.5<br />
−18.4<br />
2001 2002 2003 2004 2005 2006 2007 2008 2009 2010<br />
12.5<br />
16.2<br />
8.7<br />
Total 74.85%<br />
Volatility Meter<br />
Asset Class<br />
Current Value of a $10,000 Investment<br />
<strong>CI</strong> Portfolio Series Balanced<br />
Low<br />
High<br />
Based on 3−year standard deviation relative to other funds<br />
in its category, from Globe HySales.<br />
International Equities 15.0%<br />
Canadian Equities 26.0%<br />
Income 35.0%<br />
$16,000<br />
$14,000<br />
$12,000<br />
$15,196<br />
Equity Style and Capitalization Overview<br />
American Equities 24.0%<br />
$10,000<br />
Blend Growth Value<br />
$8,000<br />
Large<br />
$6,000<br />
Mid<br />
Small<br />
$4,000<br />
$2,000<br />
$0<br />
Dec02 Dec04 Dec06 Dec08 Dec10<br />
Source: <strong>CI</strong> <strong>Investments</strong> and CTVglobemedia Publishing Inc.<br />
42 SUMMER 2011 PERSPECTIVE AS AT JUNE 30, 2011
Fund Facts<br />
as at June 30, 2011<br />
Fund Codes<br />
ISC<br />
DSC<br />
LSC<br />
Class A<br />
<strong>CI</strong>G2601<br />
<strong>CI</strong>G3601<br />
<strong>CI</strong>G1601<br />
Managed Solutions<br />
(Class A)<br />
Portfolio Series Balanced Growth Fund (Class A)<br />
Also available: Class F, I & T<br />
Managed By: <strong>CI</strong> <strong>Investments</strong> Inc.<br />
Advisors: <strong>CI</strong> Investment Consulting<br />
Assets Under Management*: $830.5 million<br />
Portfolio Manager: Multi−manager<br />
Asset Class: Asset Allocation<br />
Inception Date: December 2001<br />
NAV: $12.56<br />
Min. Initial Investment: $500<br />
Subsequent Purchase(s): $50<br />
Min. PAC Investment: $50<br />
Management Expense Ratio: 2.44%<br />
ÿ<br />
Top Holdingsas at June 30, 2011<br />
<strong>CI</strong> Signature Canadian Bond Class I 13.99%<br />
<strong>CI</strong> Canadian Investment Corp Class 9.90%<br />
<strong>CI</strong> Signature Select Cdn Corp Cl 9.67%<br />
<strong>CI</strong> International Value Corp Class 7.20%<br />
<strong>CI</strong> Signature High Income 7.11%<br />
<strong>CI</strong> International Corporate Class 6.07%<br />
<strong>CI</strong> Harbour Corporate Class 4.69%<br />
<strong>CI</strong> Signature Corporate Bond 4.50%<br />
<strong>CI</strong> American Managers Corp Class 4.33%<br />
<strong>CI</strong> American Value Corporate Class 4.25%<br />
OBJECTIVE<br />
This portfolio’s objective is to provide long−term capital growth with a moderate level of risk and volatility by investing directly in other<br />
mutual funds managed by <strong>CI</strong>. Any change to the investment objective must be approved by a majority of votes cast at a meeting of<br />
unitholders held for that reason.<br />
Compound Returns and Quartile Rankings (as at June 30, 2011)<br />
This table shows the historical annual compound total return of the fund compared with the Globefund Group Average and Globefund’s<br />
benchmark Blend: 60% MS<strong>CI</strong> World, 40% Barclays Cap. The returns listed below are percentages. Performance of the fund versus its<br />
official benchmark can be found in the Management Report of Fund Performance (MRFP). See the related document section on this web<br />
page.<br />
Since<br />
YTD 1Mo 3Mo 1Yr 3Yr 5Yr 10Yr Inception*<br />
Qrtl 2 2 2 2 2 1 {N/A} {N/A}<br />
Return 1.13 −1.8 −0.95 15.07 1.6 2.03 {N/A} 3.53<br />
Grp Avg 0.67 −2.0 −1.36 14.12 1.0 1.2 2.32 {N/A}<br />
Ind Ret 1.27 −1.57 0.58 8.93 1.82 1.7 0.72 {N/A}<br />
*December 17, 2001<br />
Performance Data<br />
This chart shows you the fund´s annual performance and how an investment would have changed over time.<br />
50%<br />
0%<br />
−50%<br />
−7.2<br />
11.7<br />
<strong>CI</strong> Portfolio Series Balanced Growth<br />
8.4<br />
8.6<br />
−2.5<br />
−21.6<br />
2001 2002 2003 2004 2005 2006 2007 2008 2009 2010<br />
12.3<br />
18.1<br />
9.3<br />
Total 71.71%<br />
Volatility Meter<br />
Asset Class<br />
Current Value of a $10,000 Investment<br />
<strong>CI</strong> Portfolio Series Balanced Growth<br />
Low<br />
High<br />
Based on 3−year standard deviation relative to other funds<br />
in its category, from Globe HySales.<br />
International Equities 18.0%<br />
American Equities 26.0%<br />
Canadian Equities 31.0%<br />
$16,000<br />
$14,000<br />
$12,000<br />
$13,685<br />
Equity Style and Capitalization Overview<br />
Income 25.0%<br />
$10,000<br />
Blend Growth Value<br />
$8,000<br />
Large<br />
$6,000<br />
Mid<br />
Small<br />
$4,000<br />
$2,000<br />
$0<br />
Dec02 Dec04 Dec06 Dec08 Dec10<br />
Source: <strong>CI</strong> <strong>Investments</strong> and CTVglobemedia Publishing Inc.<br />
SUMMER 2011 PERSPECTIVE AS AT JUNE 30, 2011 43
Fund Facts<br />
as at June 30, 2011<br />
Fund Codes<br />
ISC<br />
DSC<br />
LSC<br />
Class A<br />
<strong>CI</strong>G2602<br />
<strong>CI</strong>G3602<br />
<strong>CI</strong>G1602<br />
Portfolio Series Growth Fund (Class A)<br />
Also available: Class F, I & T<br />
Managed Solutions<br />
(Class A)<br />
Managed By: <strong>CI</strong> <strong>Investments</strong> Inc.<br />
Advisors: <strong>CI</strong> Investment Consulting<br />
Assets Under Management*: $345.2 million<br />
Portfolio Manager: Multi−manager<br />
Asset Class: Asset Allocation<br />
Inception Date: December 2001<br />
NAV: $12.05<br />
Min. Initial Investment: $500<br />
Subsequent Purchase(s): $50<br />
Min. PAC Investment: $50<br />
Management Expense Ratio: 2.45%<br />
ÿ<br />
Top Holdingsas at June 30, 2011<br />
<strong>CI</strong> Signature Canadian Bond Class I 11.21%<br />
<strong>CI</strong> Canadian Investment Corp Class 10.66%<br />
<strong>CI</strong> Signature Select Cdn Corp Cl 9.16%<br />
<strong>CI</strong> International Value Corp Class 7.71%<br />
<strong>CI</strong> International Corporate Class 6.99%<br />
<strong>CI</strong> Cambridge Global Eqt CC 5.69%<br />
<strong>CI</strong> Harbour Corporate Class 5.58%<br />
<strong>CI</strong> Signature High Income 4.97%<br />
<strong>CI</strong> American Value Corporate Class 4.96%<br />
<strong>CI</strong> Synergy Canadian Corporate Class 4.87%<br />
OBJECTIVE<br />
This portfolio’s objective is to provide long−term capital growth by investing directly in other mutual funds managed by <strong>CI</strong>. Any change to<br />
the investment objective must be approved by a majority of votes cast at a meeting of unitholders held for that reason.<br />
Compound Returns and Quartile Rankings (as at June 30, 2011)<br />
This table shows the historical annual compound total return of the fund compared with the Globefund Group Average and Globefund’s<br />
benchmark Blend: 60% MS<strong>CI</strong> World, 40% Barclays Cap. The returns listed below are percentages. Performance of the fund versus its<br />
official benchmark can be found in the Management Report of Fund Performance (MRFP). See the related document section on this web<br />
page.<br />
Since<br />
YTD 1Mo 3Mo 1Yr 3Yr 5Yr 10Yr Inception*<br />
Qrtl 2 2 2 1 3 2 {N/A} {N/A}<br />
Return 0.92 −2.03 −1.39 16.05 0.5 1.39 {N/A} 2.86<br />
Grp Avg 0.67 −2.0 −1.36 14.12 1.0 1.2 2.32 {N/A}<br />
Ind Ret 1.27 −1.57 0.58 8.93 1.82 1.7 0.72 {N/A}<br />
*December 17, 2001<br />
Performance Data<br />
This chart shows you the fund´s annual performance and how an investment would have changed over time.<br />
50%<br />
0%<br />
−50%<br />
−11.6<br />
12.8<br />
<strong>CI</strong> Portfolio Series Growth<br />
8.7<br />
8.8<br />
−3.0<br />
−24.1<br />
2001 2002 2003 2004 2005 2006 2007 2008 2009 2010<br />
13.4<br />
17.9<br />
9.5<br />
Total 71.80%<br />
Volatility Meter<br />
Asset Class<br />
Current Value of a $10,000 Investment<br />
<strong>CI</strong> Portfolio Series Growth<br />
Low<br />
High<br />
Based on 3−year standard deviation relative to other funds<br />
in its category, from Globe HySales.<br />
Equity Style and Capitalization Overview<br />
Income 20.0%<br />
American Equities 28.0%<br />
Canadian Equities 31.0%<br />
International Equities 21.0%<br />
$14,000<br />
$12,000<br />
$10,000<br />
$8,000<br />
$12,836<br />
Large<br />
Blend Growth Value<br />
$6,000<br />
Mid<br />
$4,000<br />
Small<br />
$2,000<br />
$0<br />
Dec02 Dec04 Dec06 Dec08 Dec10<br />
Source: <strong>CI</strong> <strong>Investments</strong> and CTVglobemedia Publishing Inc.<br />
44 SUMMER 2011 PERSPECTIVE AS AT JUNE 30, 2011
Fund Facts<br />
as at June 30, 2011<br />
Fund Codes<br />
ISC<br />
DSC<br />
LSC<br />
Class A<br />
<strong>CI</strong>G2603<br />
<strong>CI</strong>G3603<br />
<strong>CI</strong>G1603<br />
Managed Solutions<br />
(Class A)<br />
Portfolio Series Maximum Growth Fund (Class A)<br />
Also available: Class F, I & T<br />
Managed By: <strong>CI</strong> <strong>Investments</strong> Inc.<br />
Advisors: <strong>CI</strong> Investment Consulting<br />
Assets Under Management*: $149.1 million<br />
Portfolio Manager: Multi−manager<br />
Asset Class: Asset Allocation<br />
Inception Date: December 2001<br />
NAV: $11.53<br />
Min. Initial Investment: $500<br />
Subsequent Purchase(s): $50<br />
Min. PAC Investment: $50<br />
Management Expense Ratio: 2.46%<br />
ÿ<br />
Top Holdingsas at June 30, 2011<br />
<strong>CI</strong> Canadian Investment Corp Class 14.47%<br />
<strong>CI</strong> Signature Select Cdn Corp Cl 13.34%<br />
<strong>CI</strong> International Corporate Class 8.78%<br />
<strong>CI</strong> International Value Corp Class 7.22%<br />
<strong>CI</strong> Synergy Canadian Corporate Class 6.77%<br />
<strong>CI</strong> Harbour Corporate Class 6.66%<br />
<strong>CI</strong> American Value Corporate Class 6.28%<br />
<strong>CI</strong> Cambridge Global Eqt CC 5.63%<br />
<strong>CI</strong> Canadian Small/Mid Cap 5.55%<br />
<strong>CI</strong> Cambridge American Equity 5.16%<br />
OBJECTIVE<br />
This portfolio’s objective is to provide above−average long−term capital growth by investing directly in other mutual funds managed by<br />
<strong>CI</strong>. The portfolio may have a medium to higher level of risk and volatility. Any change to the investment objective must be approved by a<br />
majority of votes cast at a meeting of unitholders held for that reason.<br />
Compound Returns and Quartile Rankings (as at June 30, 2011)<br />
This table shows the historical annual compound total return of the fund compared with the Globefund Group Average and Globefund’s<br />
benchmark MS<strong>CI</strong> World ($ Cdn). The returns listed below are percentages. Performance of the fund versus its official benchmark can be<br />
found in the Management Report of Fund Performance (MRFP). See the related document section on this web page.<br />
Since<br />
YTD 1Mo 3Mo 1Yr 3Yr 5Yr 10Yr Inception*<br />
Qrtl 3 3 4 2 2 2 {N/A} {N/A}<br />
Return 0.52 −2.29 −2.04 18.44 −0.92 0.58 {N/A} 2.07<br />
Grp Avg 1.15 −2.19 −0.66 17.73 −1.09 −0.73 −0.01 {N/A}<br />
Ind Ret 2.4 −2.0 −0.1 19.28 −0.78 −0.1 −0.12 {N/A}<br />
*December 17, 2001<br />
Performance Data<br />
This chart shows you the fund´s annual performance and how an investment would have changed over time.<br />
50%<br />
0%<br />
−50%<br />
−17.8<br />
14.9<br />
<strong>CI</strong> Portfolio Series Maximum Growth<br />
9.6<br />
9.2<br />
2001 2002 2003 2004 2005 2006 2007 2008 2009 2010<br />
15.7<br />
−3.3<br />
−28.8<br />
19.6<br />
9.9<br />
Total 79.86%<br />
Volatility Meter<br />
Asset Class<br />
Current Value of a $10,000 Investment<br />
<strong>CI</strong> Portfolio Series Maximum Growth<br />
Low<br />
High<br />
Based on 3−year standard deviation relative to other funds<br />
in its category, from Globe HySales.<br />
Equity Style and Capitalization Overview<br />
American Equities 35.0%<br />
Canadian Equities 40.0%<br />
International Equities 25.0%<br />
$14,000<br />
$12,000<br />
$10,000<br />
$8,000<br />
$11,896<br />
Large<br />
Blend Growth Value<br />
$6,000<br />
Mid<br />
$4,000<br />
Small<br />
$2,000<br />
$0<br />
Dec02 Dec04 Dec06 Dec08 Dec10<br />
Source: <strong>CI</strong> <strong>Investments</strong> and CTVglobemedia Publishing Inc.<br />
SUMMER 2011 PERSPECTIVE AS AT JUNE 30, 2011 45
Fund Facts<br />
as at June 30, 2011<br />
Fund Codes<br />
ISC<br />
DSC<br />
LSC<br />
Class A<br />
<strong>CI</strong>G2323<br />
<strong>CI</strong>G3323<br />
<strong>CI</strong>G1523<br />
Managed By: <strong>CI</strong> <strong>Investments</strong> Inc.<br />
Advisors: Cambridge Advisors<br />
Assets Under Management*: $529.4 million<br />
Portfolio Manager: Alan Radlo, MBA, BA<br />
Asset Class: Global Equity<br />
Inception Date: December 2007<br />
NAV: $10.81<br />
Min. Initial Investment: $500<br />
Subsequent Purchase(s): $50<br />
Min. PAC Investment: $50<br />
Management Expense Ratio: 2.46%<br />
Mutual Funds<br />
(Class A)<br />
Cambridge Global Equity Corporate Class (Class A)<br />
Also available: Class F, W, I & T<br />
OBJECTIVE<br />
This fund’s objective is to achieve long−term capital growth by investing, directly or indirectly, primarily in equity securities of companies<br />
located anywhere in the world. Indirect investments may include convertible securities, derivatives, equity−related securities and<br />
securities of other mutual funds. Any change to the investment objective must be approved by a majority of the votes cast by<br />
shareholders at a meeting called to consider the change<br />
Compound Returns and Quartile Rankings (as at June 30, 2011)<br />
This table shows the historical annual compound total return of the fund compared with the Globefund Group Average and Globefund’s<br />
benchmark MS<strong>CI</strong> World ($ Cdn). The returns listed below are percentages. Performance of the fund versus its official benchmark can be<br />
found in the Management Report of Fund Performance (MRFP). See the related document section on this web page.<br />
Since<br />
YTD 1Mo 3Mo 1Yr 3Yr 5Yr 10Yr Inception*<br />
Qrtl 3 1 2 1 2 {N/A} {N/A} {N/A}<br />
Return 0.28 −1.1 −0.09 20.03 0.0 {N/A} {N/A} 2.36<br />
Grp Avg 1.15 −2.19 −0.66 17.73 −1.09 −0.73 −0.01 {N/A}<br />
Ind Ret 2.4 −2.0 −0.1 19.28 −0.78 −0.1 −0.12 {N/A}<br />
*December 31, 2007<br />
Top Holdingsas at June 30, 2011<br />
JP Morgan Chase & Co. 2.55%<br />
Standard Chartered PLC 2.46%<br />
Roche Holdings 1.96%<br />
Novo−Nordisk 1.96%<br />
Apache Corp. 1.92%<br />
Seadrill Ltd. 1.92%<br />
Petrofac Ltd 1.89%<br />
Devon Energy 1.84%<br />
Abbott Labs 1.64%<br />
Volkswagen A G 1.61%<br />
Total 19.75%<br />
Volatility Meter<br />
Low<br />
High<br />
Based on 3−year standard deviation relative to other funds<br />
in its category, from Globe HySales.<br />
Equity Style and Capitalization Overview<br />
Blend Growth Value<br />
Large<br />
Mid<br />
Small<br />
Performance Data<br />
This chart shows you the fund´s annual performance and how an investment would have changed over time.<br />
50%<br />
0%<br />
−50%<br />
Asset Class<br />
Equity Sectors<br />
<strong>CI</strong> Cambridge Global Eqt CC<br />
−17.8<br />
2001 2002 2003 2004 2005 2006 2007 2008 2009 2010<br />
Canadian Equity 4.4%<br />
United States Equity 38.0%<br />
International Equity 49.4%<br />
Cash 8.3%<br />
Consumer Discretionary 8.1%<br />
Health Care 9.3%<br />
Other 9.5%<br />
Information Technology 19.0%<br />
Industrials 22.9%<br />
Energy 14.5%<br />
Materials 8.3%<br />
Cash 8.3%<br />
Current Value of a $10,000 Investment<br />
$12,000<br />
$10,000<br />
$8,000<br />
$6,000<br />
$4,000<br />
$2,000<br />
20.7<br />
<strong>CI</strong> Cambridge Global Eqt CC<br />
$0<br />
Dec07 Dec08 Dec09 Dec10<br />
9.1<br />
$10,850<br />
Geographic Composition<br />
Source: <strong>CI</strong> <strong>Investments</strong> and CTVglobemedia Publishing Inc.<br />
Germany 12.0%<br />
Norway 2.6%<br />
France 4.6%<br />
Other 17.8%<br />
United States 38.0%<br />
United Kingdom 17.1%<br />
Canada 4.4%<br />
Switzerland 3.6%<br />
46 SUMMER 2011 PERSPECTIVE AS AT JUNE 30, 2011
Fund Facts<br />
as at June 30, 2011<br />
Fund Codes Class A Corporate Class<br />
ISC <strong>CI</strong>G654 <strong>CI</strong>G660<br />
DSC <strong>CI</strong>G644 <strong>CI</strong>G667<br />
LSC <strong>CI</strong>G1644 <strong>CI</strong>G1667<br />
<strong>CI</strong> Global Fund (Class A)<br />
Also available: Class F & I<br />
Mutual Funds<br />
(Class A)<br />
Managed By: <strong>CI</strong> <strong>Investments</strong> Inc.<br />
Advisors: Signature Global Advisors<br />
Assets Under Management*: $314.7 million<br />
Portfolio Manager: Scott Vali and Eric Bushell<br />
Asset Class: Global Equity<br />
Inception Date: February 1986<br />
NAV: $10.49<br />
Min. Initial Investment: $500<br />
Subsequent Purchase(s): $50<br />
Min. PAC Investment: $50<br />
Management Expense Ratio: 2.45%<br />
OBJECTIVE<br />
This fund’s objective is to obtain long−term capital growth. It invests primarily in equity and equity−related securities of established<br />
companies throughout the world that the portfolio advisor believes have good growth potential. The fund may make large investments in<br />
any country, including emerging markets or emerging industries of any market. Any change to the investment objective must be approved<br />
by a majority of votes cast at a meeting of unitholders held for that reason.<br />
Compound Returns and Quartile Rankings (as at June 30, 2011)<br />
This table shows the historical annual compound total return of the fund compared with the Globefund Group Average and Globefund’s<br />
benchmark MS<strong>CI</strong> World ($ Cdn). The returns listed below are percentages. Performance of the fund versus its official benchmark can be<br />
found in the Management Report of Fund Performance (MRFP). See the related document section on this web page.<br />
Since<br />
YTD 1Mo 3Mo 1Yr 3Yr 5Yr 10Yr Inception*<br />
Qrtl 4 2 3 2 4 4 4 {N/A}<br />
Return −0.85 −2.24 −1.22 17.08 −4.04 −3.75 −2.11 4.92<br />
Grp Avg 1.15 −2.19 −0.66 17.73 −1.09 −0.73 −0.01 {N/A}<br />
Ind Ret 2.4 −2.0 −0.1 19.28 −0.78 −0.1 −0.12 {N/A}<br />
*June 3, 1986<br />
Top Holdingsas at June 30, 2011<br />
Eli Lilly & Co. 1.80%<br />
Bank of America 1.77%<br />
Wells Fargo & Co. 1.60%<br />
JP Morgan Chase & Co. 1.50%<br />
HSBC Holdings PLC 1.48%<br />
Novartis AG 1.30%<br />
Apache Corp. 1.26%<br />
BARCLAYS 1.22%<br />
Credit Suisse Group 1.18%<br />
W. W. Grainger Inc. 1.08%<br />
Total 14.19%<br />
Volatility Meter<br />
Low<br />
High<br />
Based on 3−year standard deviation relative to other funds<br />
in its category, from Globe HySales.<br />
Equity Style and Capitalization Overview<br />
Blend Growth Value<br />
Large<br />
Mid<br />
Small<br />
Performance Data<br />
This chart shows you the fund´s annual performance and how an investment would have changed over time.<br />
50%<br />
0%<br />
−50%<br />
Asset Class<br />
Equity Sectors<br />
−26.6<br />
−19.5<br />
20.4<br />
5.2<br />
<strong>CI</strong> Global<br />
7.3<br />
−12.6<br />
−34.5<br />
2001 2002 2003 2004 2005 2006 2007 2008 2009 2010<br />
International Equity 53.3%<br />
Canadian Equity 0.8%<br />
United States Equity 37.3%<br />
Cash 8.6%<br />
Consumer Discretionary 7.7%<br />
Materials 8.8%<br />
Energy 9.9%<br />
Financials 21.2%<br />
Other 21.8%<br />
Industrials 13.3%<br />
Health Care 8.6%<br />
Cash 8.6%<br />
16.5<br />
Current Value of a $10,000 Investment<br />
$14,000<br />
$12,000<br />
$10,000<br />
$8,000<br />
$6,000<br />
$4,000<br />
$2,000<br />
$0<br />
<strong>CI</strong> Global<br />
16.6<br />
6.9<br />
Dec02 Dec04 Dec06 Dec08 Dec10<br />
$8,418<br />
Geographic Composition<br />
Source: <strong>CI</strong> <strong>Investments</strong> and CTVglobemedia Publishing Inc.<br />
Brazil 2.8%<br />
Germany 7.0%<br />
Switzerland 6.2%<br />
Other 26.1%<br />
United States 37.3%<br />
United Kingdom 13.9%<br />
Australia 3.5%<br />
France 3.2%<br />
SUMMER 2011 PERSPECTIVE AS AT JUNE 30, 2011 47
Fund Facts<br />
as at June 30, 2011<br />
Fund Codes Class A Corporate Class<br />
ISC <strong>CI</strong>G2810 <strong>CI</strong>G2311<br />
DSC <strong>CI</strong>G3810 <strong>CI</strong>G3311<br />
LSC <strong>CI</strong>G1610 <strong>CI</strong>G1311<br />
Managed By: <strong>CI</strong> <strong>Investments</strong> Inc.<br />
Advisors: Epoch Investment Partners, Inc.<br />
Assets Under Management*: $240.9 million<br />
Portfolio Manager: William Priest<br />
Asset Class: Global Equity<br />
Inception Date: January 2006<br />
NAV: $6.66<br />
Min. Initial Investment: $5,000<br />
Subsequent Purchase(s): $50<br />
Min. PAC Investment: $50<br />
Management Expense Ratio: 2.48%<br />
Mutual Funds<br />
(Class A)<br />
<strong>CI</strong> Global High Dividend Advantage Fund (Class A)<br />
Also available: Class F & I<br />
OBJECTIVE<br />
This fund’s objective is to achieve tax−efficient returns through exposure primarily to dividend−paying common and preferred shares,<br />
debentures, income trusts, equity−related securities and convertible securities of issuers anywhere in the world that are expected to<br />
generate a consistently high level of dividends and interest income. The fund may achieve such exposure through the use of derivatives<br />
and investments in other mutual funds. Any change to the investment objective must be approved by a majority of the votes cast by<br />
shareholders at a meeting called to consider the change.<br />
Compound Returns and Quartile Rankings (as at June 30, 2011)<br />
This table shows the historical annual compound total return of the fund compared with the Globefund Group Average and Globefund’s<br />
benchmark MS<strong>CI</strong> World ($ Cdn). The returns listed below are percentages. Performance of the fund versus its official benchmark can be<br />
found in the Management Report of Fund Performance (MRFP). See the related document section on this web page.<br />
Since<br />
YTD 1Mo 3Mo 1Yr 3Yr 5Yr 10Yr Inception*<br />
Qrtl 1 2 1 1 1 2 {N/A} {N/A}<br />
Return 5.75 −1.82 2.65 21.04 1.11 0.99 {N/A} −0.06<br />
Grp Avg 1.15 −2.19 −0.66 17.73 −1.09 −0.73 −0.01 {N/A}<br />
Ind Ret 2.4 −2.0 −0.1 19.28 −0.78 −0.1 −0.12 {N/A}<br />
*February 28, 2006<br />
Top Holdingsas at June 30, 2011<br />
BCE Inc. 2.04%<br />
Swisscom Ag Adr 1.94%<br />
Vodafone Group PLC 1.78%<br />
Pearson PLC 1.75%<br />
Imperial Tobacco Group PLC 1.71%<br />
BASF AG 1.71%<br />
Total SA 1.65%<br />
Nestle S.A. 1.65%<br />
CenturyLink, Inc. 1.64%<br />
Vivendi SA 1.63%<br />
Total 17.50%<br />
Volatility Meter<br />
Low<br />
High<br />
Based on 3−year standard deviation relative to other funds<br />
in its category, from Globe HySales.<br />
Equity Style and Capitalization Overview<br />
Blend Growth Value<br />
Large<br />
Mid<br />
Small<br />
Performance Data<br />
This chart shows you the fund´s annual performance and how an investment would have changed over time.<br />
50%<br />
0%<br />
−50%<br />
Asset Class<br />
Equity Sectors<br />
<strong>CI</strong> Global High Dividend Advantage<br />
−4.0<br />
−24.1<br />
2001 2002 2003 2004 2005 2006 2007 2008 2009 2010<br />
Cash 3.2%<br />
United States Equity 44.2%<br />
International Equity 49.0%<br />
Canadian Equity 3.7%<br />
Cash 3.2%<br />
Consumer Discretionary 11.1%<br />
Utilities 14.0%<br />
Consumer Staples 17.4%<br />
Other 20.1%<br />
Telecommunication Services 15.3%<br />
Industrials 9.7%<br />
Energy 9.2%<br />
Current Value of a $10,000 Investment<br />
$12,000<br />
$10,000<br />
$8,000<br />
$6,000<br />
$4,000<br />
$2,000<br />
8.3<br />
<strong>CI</strong> Global High Dividend Advantage<br />
6.1<br />
$0<br />
Feb06 Dec06 Dec07 Dec08 Dec09 Dec10<br />
$9,965<br />
Geographic Composition<br />
Source: <strong>CI</strong> <strong>Investments</strong> and CTVglobemedia Publishing Inc.<br />
France 7.6%<br />
Belgium 2.2%<br />
Switzerland 5.1%<br />
United Kingdom 18.5%<br />
United States 44.2%<br />
Other 15.2%<br />
Germany 3.6%<br />
Canada 3.7%<br />
48 SUMMER 2011 PERSPECTIVE AS AT JUNE 30, 2011
Fund Facts<br />
as at June 30, 2011<br />
Fund Codes<br />
ISC<br />
DSC<br />
LSC<br />
Class A<br />
<strong>CI</strong>G2300<br />
<strong>CI</strong>G3300<br />
<strong>CI</strong>G1300<br />
Managed By: <strong>CI</strong> <strong>Investments</strong> Inc.<br />
Advisors: Harbour Advisors<br />
Assets Under Management*: $523.5 million<br />
Portfolio Manager: Stephen Jenkins and Gerald<br />
Coleman<br />
Asset Class: Global Equity<br />
Inception Date: December 2001<br />
NAV: $11.18<br />
Min. Initial Investment: $500<br />
Subsequent Purchase(s): $50<br />
Min. PAC Investment: $50<br />
Management Expense Ratio: 2.46%<br />
Top Holdingsas at June 30, 2011<br />
Mastercard 5.63%<br />
Diageo PLC 4.51%<br />
Ultra Petroleum 4.28%<br />
Aryzta AG 4.19%<br />
Air Liquide(L) 3.77%<br />
GlaxoSmithKline PLC 3.42%<br />
CVS Caremark 3.35%<br />
Holcim LTD. 3.20%<br />
Discover Financial Services 3.18%<br />
Taiwan Semiconductor 3.05%<br />
Total 38.58%<br />
Mutual Funds<br />
(Class A)<br />
Harbour Foreign Equity Corporate Class (Class A)<br />
Also available: Class F, I & T<br />
OBJECTIVE<br />
This fund’s objective is to obtain long−term capital growth consistent with the preservation of capital. It invests primarily in equity and<br />
equity−related securities of large and mid−capitalization companies around the world that the portfolio advisor believes have good<br />
potential for future growth and are attractively priced. The fund will make investments chiefly in leading industrialized nations and may<br />
from time to time invest in emerging markets. Any change to the investment objective must be approved by a majority of votes cast at a<br />
meeting of unitholders held for that reason.<br />
Compound Returns and Quartile Rankings (as at June 30, 2011)<br />
This table shows the historical annual compound total return of the fund compared with the Globefund Group Average and Globefund’s<br />
benchmark MS<strong>CI</strong> World ($ Cdn). The returns listed below are percentages. Performance of the fund versus its official benchmark can be<br />
found in the Management Report of Fund Performance (MRFP). See the related document section on this web page.<br />
Since<br />
YTD 1Mo 3Mo 1Yr 3Yr 5Yr 10Yr Inception*<br />
Qrtl 2 1 2 2 3 2 {N/A} {N/A}<br />
Return 2.19 −1.67 0.54 18.86 −1.41 0.04 {N/A} 1.23<br />
Grp Avg 1.15 −2.19 −0.66 17.73 −1.09 −0.73 −0.01 {N/A}<br />
Ind Ret 2.4 −2.0 −0.1 19.28 −0.78 −0.1 −0.12 {N/A}<br />
*December 31, 2001<br />
Performance Data<br />
This chart shows you the fund´s annual performance and how an investment would have changed over time.<br />
50%<br />
0%<br />
−50%<br />
Asset Class<br />
−4.4<br />
4.2<br />
<strong>CI</strong> Harbour Foreign Eq Corp Class<br />
4.9<br />
3.5<br />
−1.8<br />
−40.8<br />
2001 2002 2003 2004 2005 2006 2007 2008 2009 2010<br />
16.6<br />
Current Value of a $10,000 Investment<br />
37.9<br />
8.7<br />
Volatility Meter<br />
Canadian Equity 6.5%<br />
$14,000<br />
<strong>CI</strong> Harbour Foreign Eq Corp Class<br />
Low<br />
High<br />
Based on 3−year standard deviation relative to other funds<br />
in its category, from Globe HySales.<br />
United States Equity 38.0%<br />
International Equity 46.5%<br />
Cash 9.0%<br />
$12,000<br />
$10,000<br />
$8,000<br />
$11,232<br />
Equity Style and Capitalization Overview<br />
Blend Growth Value<br />
Large<br />
Mid<br />
Small<br />
Equity Sectors<br />
Industrials 7.3%<br />
Energy 12.7%<br />
Materials 12.6%<br />
Information Technology 19.7%<br />
Consumer Staples 17.1%<br />
Cash 9.0%<br />
Financials 12.7%<br />
Other 8.9%<br />
$6,000<br />
$4,000<br />
$2,000<br />
$0<br />
Dec02 Dec04 Dec06 Dec08 Dec10<br />
Geographic Composition<br />
Source: <strong>CI</strong> <strong>Investments</strong> and CTVglobemedia Publishing Inc.<br />
Switzerland 9.5%<br />
Germany 3.1%<br />
Australia 6.6%<br />
Other 19.3%<br />
United States 38.0%<br />
United Kingdom 13.2%<br />
France 3.8%<br />
Canada 6.5%<br />
SUMMER 2011 PERSPECTIVE AS AT JUNE 30, 2011 49
Fund Facts<br />
as at June 30, 2011<br />
Fund Codes<br />
ISC<br />
DSC<br />
LSC<br />
Class A<br />
<strong>CI</strong>G6109<br />
<strong>CI</strong>G6159<br />
<strong>CI</strong>G1159<br />
Synergy Global Corporate Class (Class A)<br />
Also available: Class F, I & T<br />
Mutual Funds<br />
(Class A)<br />
Managed By: <strong>CI</strong> <strong>Investments</strong> Inc.<br />
Advisors: Picton Mahoney Asset Management<br />
Assets Under Management*: $134.2 million<br />
Portfolio Manager: Michael Mahoney<br />
Asset Class: Global Equity<br />
Inception Date: March 1999<br />
NAV: $4.37<br />
Min. Initial Investment: $500<br />
Subsequent Purchase(s): $50<br />
Min. PAC Investment: $50<br />
Management Expense Ratio: 2.45%<br />
OBJECTIVE<br />
The fund seeks long−term capital growth by investing primarily in equity and equity−related securities of global momentum companies<br />
situated in the developed markets represented in the MS<strong>CI</strong> World Index − C$ which currently includes 22 of the world’s developed<br />
markets. The fundamental investment objective of the fund cannot be changed without obtaining securityholder approval.<br />
Compound Returns and Quartile Rankings (as at June 30, 2011)<br />
This table shows the historical annual compound total return of the fund compared with the Globefund Group Average and Globefund’s<br />
benchmark MS<strong>CI</strong> World ($ Cdn). The returns listed below are percentages. Performance of the fund versus its official benchmark can be<br />
found in the Management Report of Fund Performance (MRFP). See the related document section on this web page.<br />
Since<br />
YTD 1Mo 3Mo 1Yr 3Yr 5Yr 10Yr Inception*<br />
Qrtl 2 2 3 1 4 3 2 {N/A}<br />
Return 2.1 −2.02 −0.91 20.31 −3.61 −1.9 0.91 −1.08<br />
Grp Avg 1.15 −2.19 −0.66 17.73 −1.09 −0.73 −0.01 {N/A}<br />
Ind Ret 2.4 −2.0 −0.1 19.28 −0.78 −0.1 −0.12 {N/A}<br />
*March 30, 1999<br />
Top Holdingsas at June 30, 2011<br />
Sanofi 1.43%<br />
BT Group PLC 1.35%<br />
KDDI Corp. 1.29%<br />
Novartis AG 1.17%<br />
National Australia Bank 1.16%<br />
Apple 1.16%<br />
JP Morgan Chase & Co. 1.15%<br />
Enel Societa Per Azioni 1.14%<br />
Qualcomm 1.03%<br />
Union Pacific 1.01%<br />
Total 11.89%<br />
Volatility Meter<br />
Low<br />
High<br />
Based on 3−year standard deviation relative to other funds<br />
in its category, from Globe HySales.<br />
Equity Style and Capitalization Overview<br />
Blend Growth Value<br />
Large<br />
Mid<br />
Small<br />
Performance Data<br />
This chart shows you the fund´s annual performance and how an investment would have changed over time.<br />
50%<br />
0%<br />
−50%<br />
Asset Class<br />
Equity Sectors<br />
−21.7<br />
−17.5<br />
16.8<br />
<strong>CI</strong> Synergy Global Corporate Class<br />
12.2<br />
12.1<br />
−4.6<br />
−29.0<br />
2001 2002 2003 2004 2005 2006 2007 2008 2009 2010<br />
Canadian Equity 1.8%<br />
United States Equity 45.6%<br />
International Equity 50.0%<br />
Cash 2.6%<br />
Cash 2.6%<br />
Information Technology 13.0%<br />
Industrials 11.8%<br />
Financials 17.1%<br />
Other 23.7%<br />
Energy 13.1%<br />
Health Care 9.4%<br />
Consumer Discretionary 9.2%<br />
17.7<br />
Current Value of a $10,000 Investment<br />
$16,000<br />
$14,000<br />
$12,000<br />
$10,000<br />
$8,000<br />
$6,000<br />
$4,000<br />
$2,000<br />
$0<br />
7.3<br />
<strong>CI</strong> Synergy Global Corporate Class<br />
8.0<br />
Dec02 Dec04 Dec06 Dec08 Dec10<br />
$11,228<br />
Geographic Composition<br />
Source: <strong>CI</strong> <strong>Investments</strong> and CTVglobemedia Publishing Inc.<br />
United Kingdom 7.8%<br />
Switzerland 2.8%<br />
France 5.3%<br />
Other 20.3%<br />
United States 45.6%<br />
Japan 10.4%<br />
Germany 3.3%<br />
South Korea 4.4%<br />
50 SUMMER 2011 PERSPECTIVE AS AT JUNE 30, 2011
Fund Facts<br />
as at June 30, 2011<br />
Fund Codes Class A Corporate Class<br />
ISC <strong>CI</strong>G681 <strong>CI</strong>G205<br />
DSC <strong>CI</strong>G881 <strong>CI</strong>G705<br />
LSC <strong>CI</strong>G1881 <strong>CI</strong>G1705<br />
<strong>CI</strong> International Value Fund (Class A)<br />
Also available: Class F & I<br />
Mutual Funds<br />
(Class A)<br />
Managed By: <strong>CI</strong> <strong>Investments</strong> Inc.<br />
Advisors: Altrinsic Global Advisors, LLC<br />
Assets Under Management*: $89.0 million<br />
Portfolio Manager: John Hock<br />
Asset Class: International Equity<br />
Inception Date: June 1996<br />
NAV: $10.37<br />
Min. Initial Investment: $500<br />
Subsequent Purchase(s): $50<br />
Min. PAC Investment: $50<br />
Management Expense Ratio: 2.44%<br />
OBJECTIVE<br />
This fund’s objective is to obtain maximum long−term capital growth. It invests primarily in equity and equity−related securities of<br />
companies whose primary operations are outside of North America. The fund may make significant investments in any country including<br />
emerging markets and emerging industries of any market. Any change to the investment objective must be approved by a majority of<br />
votes cast at a meeting of unitholders held for that reason.<br />
Compound Returns and Quartile Rankings (as at June 30, 2011)<br />
This table shows the historical annual compound total return of the fund compared with the Globefund Group Average and Globefund’s<br />
benchmark MS<strong>CI</strong> EAFE ($ Cdn). The returns listed below are percentages. Performance of the fund versus its official benchmark can be<br />
found in the Management Report of Fund Performance (MRFP). See the related document section on this web page.<br />
Since<br />
YTD 1Mo 3Mo 1Yr 3Yr 5Yr 10Yr Inception*<br />
Qrtl 3 1 2 3 1 2 2 {N/A}<br />
Return 0.97 −1.61 0.29 16.2 0.57 −1.82 0.88 0.87<br />
Grp Avg 0.91 −2.08 0.11 17.58 −3.88 −2.52 −0.16 {N/A}<br />
Ind Ret 2.14 −1.69 1.05 19.04 −3.08 −0.96 1.41 {N/A}<br />
*June 7, 1996<br />
Top Holdingsas at June 30, 2011<br />
GlaxoSmithKline PLC 2.91%<br />
Roche Holdings 2.86%<br />
Nestle S.A. 2.58%<br />
Covidien 2.45%<br />
Heineken NV 2.42%<br />
Suzuki Motor Corp 2.31%<br />
Willis Group Holdings Plc 2.16%<br />
Koninklijke KPN NV 2.15%<br />
Allianz SE 2.15%<br />
Total SA 2.13%<br />
Total 24.12%<br />
Volatility Meter<br />
Low<br />
High<br />
Based on 3−year standard deviation relative to other funds<br />
in its category, from Globe HySales.<br />
Equity Style and Capitalization Overview<br />
Blend Growth Value<br />
Large<br />
Mid<br />
Small<br />
Performance Data<br />
This chart shows you the fund´s annual performance and how an investment would have changed over time.<br />
50%<br />
0%<br />
−50%<br />
Asset Class<br />
Equity Sectors<br />
−11.8<br />
−10.2<br />
14.4<br />
10.8<br />
<strong>CI</strong> International Value<br />
4.8<br />
−11.7<br />
−21.5<br />
2001 2002 2003 2004 2005 2006 2007 2008 2009 2010<br />
International Equity 93.6%<br />
United States Equity 1.3%<br />
Canadian Equity 3.2%<br />
Cash 1.9%<br />
Cash 1.9%<br />
Energy 10.6%<br />
Industrials 10.6%<br />
Financials 18.0%<br />
Other 23.0%<br />
Consumer Staples 17.2%<br />
Health Care 9.9%<br />
Information Technology 8.8%<br />
19.5<br />
Current Value of a $10,000 Investment<br />
$16,000<br />
$14,000<br />
$12,000<br />
$10,000<br />
$8,000<br />
$6,000<br />
$4,000<br />
$2,000<br />
$0<br />
<strong>CI</strong> International Value<br />
9.5<br />
4.1<br />
Dec02 Dec04 Dec06 Dec08 Dec10<br />
$11,142<br />
Geographic Composition<br />
Source: <strong>CI</strong> <strong>Investments</strong> and CTVglobemedia Publishing Inc.<br />
Ireland 4.2%<br />
Switzerland 10.0%<br />
Germany 10.6%<br />
Other 23.4%<br />
Japan 24.7%<br />
France 6.8%<br />
United Kingdom 15.3%<br />
Netherlands 5.0%<br />
SUMMER 2011 PERSPECTIVE AS AT JUNE 30, 2011 51
Fund Facts<br />
as at June 30, 2011<br />
Fund Codes Class A Corporate Class<br />
ISC <strong>CI</strong>G662 <strong>CI</strong>G277<br />
DSC <strong>CI</strong>G646 <strong>CI</strong>G276<br />
LSC <strong>CI</strong>G1646 <strong>CI</strong>G1276<br />
<strong>CI</strong> Emerging Markets Fund (Class A)<br />
Also available: Class F & I<br />
Mutual Funds<br />
(Class A)<br />
Managed By: <strong>CI</strong> <strong>Investments</strong> Inc.<br />
Advisors: Signature Global Advisors<br />
Assets Under Management*: $171.1 million<br />
Portfolio Manager: Matthew Strauss and Eric<br />
Bushell<br />
Asset Class: Emerging Markets Equity<br />
Inception Date: September 1991<br />
NAV: $15.95<br />
Min. Initial Investment: $500<br />
Subsequent Purchase(s): $50<br />
Min. PAC Investment: $50<br />
Management Expense Ratio: 2.72%<br />
Top Holdingsas at June 30, 2011<br />
Samsung Electronics Co. 1.99%<br />
Vale S.A. 1.88%<br />
Sberbank 1.85%<br />
China Shenhua Energy Co Ltd. 1.80%<br />
Industrial and Commercial Bank 1.55%<br />
Petroleo Bras Sa Petro 1.53%<br />
Komercni Banka AS 1.52%<br />
CNOOC Limited 1.48%<br />
Taiwan Semiconductor 1.41%<br />
Turkiye Garanti Bankasi AS 1.28%<br />
Total 16.29%<br />
OBJECTIVE<br />
This fund’s objective is to obtain maximum long−term capital growth.It invests primarily in equity and equity−related securities of<br />
companies that the portfolio advisor believes have good growth potential. These companies are located in emerging markets and<br />
emerging industries of any market. Any change to the investment objective must beapproved by a majority of votes cast at a meeting of<br />
unitholders held for that reason.<br />
Compound Returns and Quartile Rankings (as at June 30, 2011)<br />
This table shows the historical annual compound total return of the fund compared with the Globefund Group Average and Globefund’s<br />
benchmark MS<strong>CI</strong> Emerging Markets Free ($ Cdn). The returns listed below are percentages. Performance of the fund versus its official<br />
benchmark can be found in the Management Report of Fund Performance (MRFP). See the related document section on this web page.<br />
Since<br />
YTD 1Mo 3Mo 1Yr 3Yr 5Yr 10Yr Inception*<br />
Qrtl 4 3 3 3 3 3 4 {N/A}<br />
Return −7.43 −2.57 −2.8 12.17 −2.88 5.07 6.47 7.13<br />
Grp Avg −4.2 −2.15 −2.24 15.96 0.02 6.71 9.04 {N/A}<br />
Ind Ret −1.87 −1.88 −1.82 16.4 2.81 8.63 11.4 {N/A}<br />
*September 10, 1991<br />
Performance Data<br />
This chart shows you the fund´s annual performance and how an investment would have changed over time.<br />
100%<br />
0%<br />
−100%<br />
Asset Class<br />
−2.6<br />
−14.6<br />
22.8<br />
4.7<br />
<strong>CI</strong> Emerging Markets<br />
26.7<br />
−45.6<br />
2001 2002 2003 2004 2005 2006 2007 2008 2009 2010<br />
34.1<br />
16.5<br />
Current Value of a $10,000 Investment<br />
51.3<br />
11.5<br />
Volatility Meter<br />
International Equity 84.9%<br />
$25,000<br />
<strong>CI</strong> Emerging Markets<br />
Low<br />
High<br />
Based on 3−year standard deviation relative to other funds<br />
in its category, from Globe HySales.<br />
Canadian Equity 0.5%<br />
Cash 11.4%<br />
United States Equity 3.2%<br />
$20,000<br />
$15,000<br />
$19,254<br />
Equity Style and Capitalization Overview<br />
Blend Growth Value<br />
Large<br />
Mid<br />
Small<br />
Equity Sectors<br />
Information Technology 7.8%<br />
Materials 11.4%<br />
Cash 11.4%<br />
Other 16.7%<br />
Financials 21.7%<br />
Consumer Discretionary 11.6%<br />
Energy 10.6%<br />
Consumer Staples 8.7%<br />
$10,000<br />
$5,000<br />
$0<br />
Dec02 Dec04 Dec06 Dec08 Dec10<br />
Geographic Composition<br />
Source: <strong>CI</strong> <strong>Investments</strong> and CTVglobemedia Publishing Inc.<br />
China 9.6%<br />
Taiwan 4.1%<br />
Hong Kong 6.8%<br />
Other 46.9%<br />
Brazil 13.7%<br />
South Korea 9.8%<br />
Thailand 4.4%<br />
South Africa 4.9%<br />
52 SUMMER 2011 PERSPECTIVE AS AT JUNE 30, 2011
Fund Facts<br />
as at June 30, 2011<br />
Fund Codes<br />
ISC<br />
DSC<br />
LSC<br />
Class A<br />
<strong>CI</strong>G209<br />
<strong>CI</strong>G709<br />
<strong>CI</strong>G1709<br />
Managed By: <strong>CI</strong> Investment Consulting<br />
Advisors: <strong>CI</strong> Investment Consulting<br />
Assets Under Management*: $234.4 million<br />
Portfolio Manager: Multi−manager<br />
Asset Class: American Equity<br />
Inception Date: <strong>July</strong> 2000<br />
NAV: $10.64<br />
Min. Initial Investment: $500<br />
Subsequent Purchase(s): $50<br />
Min. PAC Investment: $50<br />
Management Expense Ratio: 2.43%<br />
ÿ<br />
Top Holdingsas at June 30, 2011<br />
Apple 2.14%<br />
Merck & Company 1.79%<br />
Prudential Financial Inc. 1.76%<br />
Microsoft 1.75%<br />
Oracle Corp. 1.72%<br />
Comcast Corp. 1.45%<br />
Thermo Fisher Scientific 1.38%<br />
TJX Companies 1.29%<br />
Praxair 1.29%<br />
National Oilwell Varco 1.28%<br />
Total 15.85%<br />
Volatility Meter<br />
Low<br />
High<br />
Based on 3−year standard deviation relative to other funds<br />
in its category, from Globe HySales.<br />
Equity Style and Capitalization Overview<br />
Blend Growth Value<br />
Large<br />
Mid<br />
Small<br />
Mutual Funds<br />
(Class A)<br />
<strong>CI</strong> American Managers® Corporate Class (Class A)<br />
Also available: Class F & I<br />
OBJECTIVE<br />
This fund’s objective is to obtain maximum long−term capital growth. It invests primarily in equity and equity−related securities of<br />
companies that the portfolio advisors believe have good growth potential. These companies are located in countries that have signed<br />
the North American Free Trade Agreement (NAFTA) (or its successor). These countries currently include the United States, Canada and<br />
Mexico, but may also include countries that become members of NAFTA in the future. The fund uses a "multi−manager" approach, which<br />
means that it’s managed by more that one portfolio advisor. Any change to the investment objective must be approved by a majority of<br />
votes cast at a meeting of unitholders held for that reason.<br />
Compound Returns and Quartile Rankings (as at June 30, 2011)<br />
This table shows the historical annual compound total return of the fund compared with the Globefund Group Average and Globefund’s<br />
benchmark S&P 500 Composite Total Return Idx($Cdn). The returns listed below are percentages. Performance of the fund versus its<br />
official benchmark can be found in the Management Report of Fund Performance (MRFP). See the related document section on this web<br />
page.<br />
Since<br />
YTD 1Mo 3Mo 1Yr 3Yr 5Yr 10Yr Inception*<br />
Qrtl 2 3 1 3 2 2 1 {N/A}<br />
Return 1.92 −2.39 −0.47 17.16 0.33 −0.96 0.05 0.6<br />
Grp Avg 2.2 −2.16 −1.25 20.14 −0.63 −1.9 −2.16 {N/A}<br />
Ind Ret 2.8 −2.12 −0.67 18.83 1.47 0.0 −1.84 {N/A}<br />
*<strong>July</strong> 17, 2000<br />
Performance Data<br />
This chart shows you the fund´s annual performance and how an investment would have changed over time.<br />
50%<br />
0%<br />
−50%<br />
Asset Class<br />
Equity Sectors<br />
3.0<br />
−22.6<br />
19.2<br />
<strong>CI</strong> American Managers Corp Class<br />
9.8<br />
0.8<br />
−10.9<br />
−26.6<br />
2001 2002 2003 2004 2005 2006 2007 2008 2009 2010<br />
United States Equity 83.9%<br />
Canadian Equity 0.5%<br />
Cash 11.3%<br />
International Equity 4.4%<br />
Energy 7.0%<br />
Cash 11.3%<br />
Financials 11.2%<br />
Health Care 15.0%<br />
Information Technology 24.8%<br />
Industrials 12.8%<br />
Other 9.4%<br />
Consumer Discretionary 8.6%<br />
13.0<br />
Current Value of a $10,000 Investment<br />
$14,000<br />
$12,000<br />
$10,000<br />
$8,000<br />
$6,000<br />
$4,000<br />
$2,000<br />
$0<br />
18.3<br />
<strong>CI</strong> American Managers Corp Class<br />
6.3<br />
Dec02 Dec04 Dec06 Dec08 Dec10<br />
$10,088<br />
Geographic Composition<br />
Source: <strong>CI</strong> <strong>Investments</strong> and CTVglobemedia Publishing Inc.<br />
United States 83.9%<br />
Bermuda 1.2%<br />
Switzerland 0.3%<br />
Israel 0.8%<br />
Other 11.2%<br />
Ireland 1.7%<br />
Netherlands 0.4%<br />
Canada 0.5%<br />
SUMMER 2011 PERSPECTIVE AS AT JUNE 30, 2011 53
Fund Facts<br />
as at June 30, 2011<br />
Fund Codes Class A Corporate Class<br />
ISC <strong>CI</strong>G7500 <strong>CI</strong>G510<br />
DSC <strong>CI</strong>G7505 <strong>CI</strong>G511<br />
LSC <strong>CI</strong>G1510 <strong>CI</strong>G1511<br />
<strong>CI</strong> American Value Corporate Class (Class A)<br />
Mutual Funds<br />
(Class A)<br />
Managed By: <strong>CI</strong> <strong>Investments</strong> Inc.<br />
Advisors: Epoch Investment Partners, Inc.<br />
Assets Under Management*: $324.5 million<br />
Portfolio Manager: William Priest and David Pearl<br />
Asset Class: American Equity<br />
Inception Date: <strong>July</strong> 2001<br />
NAV: $10.38<br />
Min. Initial Investment: $500<br />
Subsequent Purchase(s): $50<br />
Min. PAC Investment: $50<br />
Management Expense Ratio: 2.43%<br />
OBJECTIVE<br />
This fund’s objective is to provide superior returns with a limited level of risk by investing in a diversified portfolio of high quality<br />
undervalued companies. It invests primarily in equity and equity−related securities of companies in the United States. Any change to the<br />
investment objective must be approved by a majority of votes cast at a meeting of unitholders held for that reason.<br />
Compound Returns and Quartile Rankings (as at June 30, 2011)<br />
This table shows the historical annual compound total return of the fund compared with the Globefund Group Average and Globefund’s<br />
benchmark S&P 500 Composite Total Return Idx($Cdn). The returns listed below are percentages. Performance of the fund versus its<br />
official benchmark can be found in the Management Report of Fund Performance (MRFP). See the related document section on this web<br />
page.<br />
YTD 1Mo 3Mo 1Yr 3Yr 5Yr 10Yr<br />
Since<br />
Inception*<br />
Qrtl 2 2 1 2 2 1 {N/A} {N/A}<br />
Return 3.28 −2.26 −0.38 17.55 −1.1 0.49 {N/A} 0.38<br />
Grp Avg 2.2 −2.16 −1.25 20.14 −0.63 −1.9 −2.16 {N/A}<br />
Ind Ret 2.8 −2.12 −0.67 18.83 1.47 0.0 −1.84 {N/A}<br />
Top Holdings as at June 30, 2011<br />
Exxon Mobil 2.80%<br />
Microsoft 2.79%<br />
Oracle Corp. 2.57%<br />
Praxair 2.56%<br />
Comcast Corp. 2.54%<br />
DaVita 2.46%<br />
Franklin Resources 2.42%<br />
Thermo Fisher Scientific 2.30%<br />
Boeing Co. 2.18%<br />
Ameriprise Financial 2.03%<br />
Total 24.65%<br />
Volatility Meter<br />
Low<br />
High<br />
Based on 3−year standard deviation relative to other funds<br />
in its category, from Globe HySales.<br />
Performance Data<br />
This chart shows you the fund´s annual performance and how an investment would have changed over time.<br />
<br />
<br />
<br />
Asset Class<br />
<br />
<br />
<br />
<br />
<br />
<br />
<br />
<br />
<br />
United States Equity 83.7%<br />
Cash 14.6%<br />
International Equity 1.7%<br />
Current Value of a $10,000 Investment<br />
$15,000<br />
$10,000<br />
<br />
<br />
$10,380<br />
Equity Style and Capitalization Overview<br />
Large<br />
Mid<br />
Small<br />
Blend Growth Value<br />
Equity Sectors<br />
Industrials 8.9%<br />
Health Care 11.8%<br />
Other 10.0%<br />
Information Technology 16.4%<br />
Financials 19.2%<br />
Cash 14.6%<br />
Consumer Discretionary 9.6%<br />
Energy 9.5%<br />
$5,000<br />
$0<br />
Dec01 Dec02 Dec03 Dec04 Dec05 Dec06 Dec07 Dec08 Dec09 Dec10 Jun10<br />
Geographic Composition<br />
United States 83.7%<br />
Other 14.6%<br />
Ireland 1.7%<br />
Source: <strong>CI</strong> <strong>Investments</strong> and CTVglobemedia Publishing Inc.<br />
54 SUMMER 2011 PERSPECTIVE AS AT JUNE 30, 2011
Fund Facts<br />
as at June 30, 2011<br />
Fund Codes<br />
ISC<br />
DSC<br />
LSC<br />
Class A<br />
<strong>CI</strong>G2321<br />
<strong>CI</strong>G3321<br />
<strong>CI</strong>G1521<br />
Managed By: <strong>CI</strong> <strong>Investments</strong> Inc.<br />
Advisors: Cambridge Advisors<br />
Assets Under Management*: $363.4 million<br />
Portfolio Manager: Alan Radlo, MBA, BA<br />
Asset Class: Canadian Equity<br />
Inception Date: December 2007<br />
NAV: $10.96<br />
Min. Initial Investment: $500<br />
Subsequent Purchase(s): $50<br />
Min. PAC Investment: $50<br />
Management Expense Ratio: 2.43%<br />
Mutual Funds<br />
(Class A)<br />
Cambridge Canadian Equity Corporate Class (Class A)<br />
Also available: Class F, W, I & T<br />
OBJECTIVE<br />
This fund’s objective is to achieve long−term capital growth by investing, directly or indirectly, primarily in equity securities of Canadian<br />
companies. Indirect investments may include convertible securities, derivatives, equity−related securities and securities of other mutual<br />
funds. Any change to the investment objective must be approved by a majority of the votes cast by shareholders at a meeting called to<br />
consider the change.<br />
Compound Returns and Quartile Rankings (as at June 30, 2011)<br />
This table shows the historical annual compound total return of the fund compared with the Globefund Group Average and Globefund’s<br />
benchmark S&P/TSX Total Return. The returns listed below are percentages. Performance of the fund versus its official benchmark can<br />
be found in the Management Report of Fund Performance (MRFP). See the related document section on this web page.<br />
Since<br />
YTD 1Mo 3Mo 1Yr 3Yr 5Yr 10Yr Inception*<br />
Qrtl 1 1 1 1 1 {N/A} {N/A} {N/A}<br />
Return 3.98 −1.44 −2.92 23.41 1.21 {N/A} {N/A} 2.92<br />
Grp Avg 0.09 −2.62 −4.1 17.52 −0.79 1.97 4.74 {N/A}<br />
Ind Ret 0.16 −3.33 −5.15 20.87 0.19 5.67 8.05 {N/A}<br />
*December 31, 2007<br />
Top Holdings as at June 30, 2011<br />
Shoppers Drug Mart 3.38%<br />
JP Morgan Chase & Co. 2.80%<br />
Canadian Natural Resources 2.58%<br />
Tourmaline Oil 2.50%<br />
TD Bank 2.32%<br />
Alimentation Couche−Tard 2.20%<br />
Keyera Corp. 2.17%<br />
Cenovus Energy 2.13%<br />
Onex Corporation 2.12%<br />
Franco−Nevada Corp. 2.05%<br />
Total 24.25%<br />
Volatility Meter<br />
Low<br />
High<br />
Based on 3−year standard deviation relative to other funds<br />
in its category, from Globe HySales.<br />
Equity Style and Capitalization Overview<br />
Large<br />
Mid<br />
Small<br />
Blend Growth Value<br />
Performance Data<br />
This chart shows you the fund´s annual performance and how an investment would have changed over time.<br />
50%<br />
0%<br />
−50%<br />
Asset Class<br />
Equity Sectors<br />
<strong>CI</strong> Cambridge Canadian Eqt Corp Cl<br />
−23.6<br />
2001 2002 2003 2004 2005 2006 2007 2008 2009 2010<br />
Canadian Equity 62.3%<br />
Cash 5.3%<br />
United States Equity 22.7%<br />
International Equity 9.6%<br />
Cash 5.3%<br />
Other 10.8%<br />
Financials 12.4%<br />
Energy 18.6%<br />
Industrials 19.9%<br />
Information Technology 15.5%<br />
Consumer Staples 8.9%<br />
Consumer Discretionary 8.4%<br />
Current Value of a $10,000 Investment<br />
$12,000<br />
$10,000<br />
$8,000<br />
$6,000<br />
$4,000<br />
$2,000<br />
23.8<br />
<strong>CI</strong> Cambridge Canadian Eqt Corp Cl<br />
$0<br />
Dec07 Dec08 Dec09 Dec10<br />
12.5<br />
$11,060<br />
Geographic Composition<br />
Source: <strong>CI</strong> <strong>Investments</strong> and CTVglobemedia Publishing Inc.<br />
Canada 62.3%<br />
United Kingdom 3.1%<br />
France 0.8%<br />
Switzerland 1.2%<br />
United States 22.7%<br />
Other 8.2%<br />
Denmark 0.9%<br />
Brazil 0.9%<br />
SUMMER 2011 PERSPECTIVE AS AT JUNE 30, 2011 55
Fund Facts<br />
as at June 30, 2011<br />
Fund Codes Class A Corporate Class<br />
ISC <strong>CI</strong>G7420 <strong>CI</strong>G2307<br />
DSC <strong>CI</strong>G7425 <strong>CI</strong>G3307<br />
LSC <strong>CI</strong>G1425 <strong>CI</strong>G1307<br />
<strong>CI</strong> Canadian Investment Fund (Class A)<br />
Also available: Class F & I<br />
Mutual Funds<br />
(Class A)<br />
Managed By: <strong>CI</strong> <strong>Investments</strong> Inc.<br />
Advisors: Tetrem Capital Management Ltd.<br />
Assets Under Management*: $3,234.4 million<br />
Portfolio Manager: Daniel Bubis<br />
Asset Class: Canadian Equity<br />
Inception Date: November 1932<br />
NAV: $25.58<br />
Min. Initial Investment: $500<br />
Subsequent Purchase(s): $50<br />
Min. PAC Investment: $50<br />
Management Expense Ratio: 2.37%<br />
OBJECTIVE<br />
This fund’s objective is to achieve long−term capital growth by investing primarily in shares of major Canadian corporations. Any change<br />
to the investment objective must be approved by a majority of votes cast at a meeting of unitholders held for that reason.<br />
Compound Returns and Quartile Rankings (as at June 30, 2011)<br />
This table shows the historical annual compound total return of the fund compared with the Globefund Group Average and Globefund’s<br />
benchmark S&P/TSX Total Return. The returns listed below are percentages. Performance of the fund versus its official benchmark can<br />
be found in the Management Report of Fund Performance (MRFP). See the related document section on this web page.<br />
Since<br />
YTD 1Mo 3Mo 1Yr 3Yr 5Yr 10Yr Inception*<br />
Qrtl 2 2 2 1 1 1 1 {N/A}<br />
Return 1.15 −2.25 −3.69 20.56 1.34 3.49 7.95 9.9<br />
Grp Avg 0.09 −2.62 −4.1 17.52 −0.79 1.97 4.74 {N/A}<br />
Ind Ret 0.16 −3.33 −5.15 20.87 0.19 5.67 8.05 {N/A}<br />
*January 29, 1977<br />
Performance Data<br />
This chart shows you the fund´s annual performance and how an investment would have changed over time.<br />
Top Holdings as at June 30, 2011<br />
TD Bank 6.19%<br />
Barrick Gold Corp. 4.86%<br />
Suncor Energy 4.25%<br />
Potash Corp. of Saskatchewan 3.79%<br />
Royal Bank of Canada 2.87%<br />
EnCana Corp. 2.66%<br />
Manulife Financial 2.50%<br />
Power Corp of Canada 2.39%<br />
Magna International 2.19%<br />
Canadian Natural Resources 2.11%<br />
50%<br />
0%<br />
−50%<br />
8.9<br />
<strong>CI</strong> Canadian Investment<br />
19.6 15.2 22.0<br />
27.6<br />
14.3<br />
0.0<br />
1.5 −27.4<br />
13.2<br />
2001 2002 2003 2004 2005 2006 2007 2008 2009 2010<br />
Total 33.81%<br />
Volatility Meter<br />
Asset Class<br />
Current Value of a $10,000 Investment<br />
<strong>CI</strong> Canadian Investment<br />
Canadian Equity 72.8%<br />
$25,000<br />
Low<br />
High<br />
Based on 3−year standard deviation relative to other funds<br />
in its category, from Globe HySales.<br />
Equity Style and Capitalization Overview<br />
Large<br />
Mid<br />
Small<br />
Blend Growth Value<br />
Equity Sectors<br />
Cash 2.0%<br />
Bond 0.4%<br />
United States Equity 12.6%<br />
International Equity 12.2%<br />
Cash 2.0%<br />
Other 8.0%<br />
Industrials 10.0%<br />
Energy 24.3%<br />
Financials 24.4%<br />
Materials 18.7%<br />
Consumer Discretionary 8.0%<br />
Information Technology 4.4%<br />
$20,000<br />
$15,000<br />
$10,000<br />
$5,000<br />
$0<br />
Dec02 Dec04 Dec06 Dec08 Dec10<br />
$21,193<br />
Geographic Composition<br />
Source: <strong>CI</strong> <strong>Investments</strong> and CTVglobemedia Publishing Inc.<br />
Canada 73.2%<br />
Japan 2.8%<br />
Netherlands 1.1%<br />
United Kingdom 1.7%<br />
United States 12.6%<br />
Other 5.9%<br />
Germany 1.2%<br />
Switzerland 1.5%<br />
56 SUMMER 2011 PERSPECTIVE AS AT JUNE 30, 2011
Fund Facts<br />
as at June 30, 2011<br />
Fund Codes Class A Corporate Class<br />
ISC <strong>CI</strong>G690 <strong>CI</strong>G290<br />
DSC <strong>CI</strong>G890 <strong>CI</strong>G790<br />
LSC <strong>CI</strong>G1890 <strong>CI</strong>G1790<br />
Harbour Fund (Class A)<br />
Also available: Class F & I<br />
Mutual Funds<br />
(Class A)<br />
Managed By: <strong>CI</strong> <strong>Investments</strong> Inc.<br />
Advisors: Harbour Advisors<br />
Assets Under Management*: $4,382.1 million<br />
Portfolio Manager: Gerald Coleman and Stephen<br />
Jenkins<br />
Asset Class: Canadian Equity<br />
Inception Date: June 1997<br />
NAV: $21.54<br />
Min. Initial Investment: $500<br />
Subsequent Purchase(s): $50<br />
Min. PAC Investment: $50<br />
Management Expense Ratio: 2.43%<br />
OBJECTIVE<br />
This fund’s objective is to obtain maximum long−term capital growth. It invests primarily in equity and equity−related securities of high<br />
quality, large and mid−capitalization Canadian companies that the portfolio adviser believes have good potential for future growth. Any<br />
change to the investment objective must be approved by a majority of votes cast at a meeting of unitholders held for that reason.<br />
Compound Returns and Quartile Rankings (as at June 30, 2011)<br />
This table shows the historical annual compound total return of the fund compared with the Globefund Group Average and Globefund’s<br />
benchmark S&P/TSX Total Return. The returns listed below are percentages. Performance of the fund versus its official benchmark can<br />
be found in the Management Report of Fund Performance (MRFP). See the related document section on this web page.<br />
Since<br />
YTD 1Mo 3Mo 1Yr 3Yr 5Yr 10Yr Inception*<br />
Qrtl 2 1 2 2 2 1 1 {N/A}<br />
Return 0.75 −1.73 −3.06 17.83 0.87 4.09 7.74 7.92<br />
Grp Avg 0.09 −2.62 −4.1 17.52 −0.79 1.97 4.74 {N/A}<br />
Ind Ret 0.16 −3.33 −5.15 20.87 0.19 5.67 8.05 {N/A}<br />
*June 27, 1997<br />
Performance Data<br />
This chart shows you the fund´s annual performance and how an investment would have changed over time.<br />
Top Holdings as at June 30, 2011<br />
Suncor Energy<br />
−<br />
BHP Billiton Limited<br />
−<br />
Canadian National Railway<br />
−<br />
Potash Corp. of Saskatchewan<br />
−<br />
Tim Hortons<br />
−<br />
<strong>CI</strong>BC<br />
−<br />
Bank of Nova Scotia<br />
−<br />
Talisman Energy<br />
−<br />
Goldcorp Inc.<br />
−<br />
Cisco Systems<br />
−<br />
Total 41.05%<br />
50%<br />
0%<br />
−50%<br />
Asset Class<br />
7.3<br />
<strong>CI</strong> Harbour<br />
15.8 23.5 15.2<br />
26.9<br />
−0.9<br />
10.6<br />
6.2 −24.5<br />
9.5<br />
2001 2002 2003 2004 2005 2006 2007 2008 2009 2010<br />
Current Value of a $10,000 Investment<br />
Volatility Meter<br />
Canadian Equity 52.2%<br />
$25,000<br />
<strong>CI</strong> Harbour<br />
Low<br />
High<br />
Based on 3−year standard deviation relative to other funds<br />
in its category, from Globe HySales.<br />
Cash 7.3%<br />
United States Equity 26.0%<br />
International Equity 14.5%<br />
$20,000<br />
$15,000<br />
$20,968<br />
Equity Style and Capitalization Overview<br />
Blend Growth Value<br />
Large<br />
Mid<br />
Small<br />
Equity Sectors<br />
Consumer Discretionary 6.6%<br />
Industrials 8.2%<br />
Information Technology 9.1%<br />
Financials 19.8%<br />
Energy 21.7%<br />
Materials 19.5%<br />
Other 7.6%<br />
Cash 7.3%<br />
$10,000<br />
$5,000<br />
$0<br />
Dec02 Dec04 Dec06 Dec08 Dec10<br />
Geographic Composition<br />
Source: <strong>CI</strong> <strong>Investments</strong> and CTVglobemedia Publishing Inc.<br />
Canada 52.2%<br />
Australia 7.0%<br />
China 0.4%<br />
United Kingdom 4.4%<br />
United States 26.0%<br />
Other 7.3%<br />
Belgium 0.4%<br />
Taiwan 2.4%<br />
SUMMER 2011 PERSPECTIVE AS AT JUNE 30, 2011 57
Fund Facts<br />
as at June 30, 2011<br />
Fund Codes Class A Corporate Class<br />
ISC <strong>CI</strong>G677 <strong>CI</strong>G150<br />
DSC <strong>CI</strong>G777 <strong>CI</strong>G151<br />
LSC <strong>CI</strong>G1777 <strong>CI</strong>G1151<br />
Signature Select Canadian Fund (Class A)<br />
Also available: Class F & I<br />
Mutual Funds<br />
(Class A)<br />
Managed By: <strong>CI</strong> <strong>Investments</strong> Inc.<br />
Advisors: Signature Global Advisors<br />
Assets Under Management*: $2,819.1 million<br />
Portfolio Manager: Eric Bushell<br />
Asset Class: Canadian Equity<br />
Inception Date: May 1998<br />
NAV: $19.14<br />
Min. Initial Investment: $500<br />
Subsequent Purchase(s): $50<br />
Min. PAC Investment: $50<br />
Management Expense Ratio: 2.43%<br />
OBJECTIVE<br />
This fund’s objective is to seek capital appreciation over the long−term coupled with dividend income. It invests primarily in common<br />
shares and convertible securities of Canadian companies and preferred shares that pay regular income. The fund’s investments are<br />
diversified across industry sectors. Any change to the investment objective must be approved by a majority of votes cast at a meeting of<br />
unitholders held for that reason.<br />
Compound Returns and Quartile Rankings (as at June 30, 2011)<br />
This table shows the historical annual compound total return of the fund compared with the Globefund Group Average and Globefund’s<br />
benchmark S&P/TSX Total Return. The returns listed below are percentages. Performance of the fund versus its official benchmark can<br />
be found in the Management Report of Fund Performance (MRFP). See the related document section on this web page.<br />
Since<br />
YTD 1Mo 3Mo 1Yr 3Yr 5Yr 10Yr Inception*<br />
Qrtl 2 2 1 2 1 1 1 {N/A}<br />
Return 0.9 −2.25 −2.89 18.88 1.86 4.61 7.82 10.44<br />
Grp Avg 0.09 −2.62 −4.1 17.52 −0.79 1.97 4.74 {N/A}<br />
Ind Ret 0.16 −3.33 −5.15 20.87 0.19 5.67 8.05 {N/A}<br />
*May 13, 1998<br />
Top Holdings as at June 30, 2011<br />
TD Bank 5.74%<br />
<strong>CI</strong>BC 3.49%<br />
Suncor Energy 2.91%<br />
Canadian Natural Resources 2.79%<br />
Talisman Energy 2.42%<br />
Barrick Gold Corp. 1.91%<br />
Brookfield Asset Management 1.70%<br />
Eli Lilly & Co. 1.61%<br />
Cenovus Energy 1.59%<br />
Freeport McMoran 1.57%<br />
Total 25.73%<br />
Volatility Meter<br />
Low<br />
High<br />
Based on 3−year standard deviation relative to other funds<br />
in its category, from Globe HySales.<br />
Equity Style and Capitalization Overview<br />
Large<br />
Mid<br />
Small<br />
Blend Growth Value<br />
Performance Data<br />
This chart shows you the fund´s annual performance and how an investment would have changed over time.<br />
50%<br />
0%<br />
−50%<br />
Asset Class<br />
Equity Sectors<br />
9.7<br />
−5.8<br />
20.2<br />
<strong>CI</strong> Signature Select Canadian<br />
12.9<br />
22.9<br />
−26.0<br />
2001 2002 2003 2004 2005 2006 2007 2008 2009 2010<br />
Cash 9.0%<br />
United States Equity 24.8%<br />
Canadian Equity 44.4%<br />
International Equity 21.9%<br />
Information Technology 6.4%<br />
Materials 12.1%<br />
Industrials 9.2%<br />
Energy 18.7%<br />
Financials 21.6%<br />
Other 16.4%<br />
Cash 9.0%<br />
Consumer Staples 6.5%<br />
21.0<br />
3.0<br />
Current Value of a $10,000 Investment<br />
$25,000<br />
$20,000<br />
$15,000<br />
$10,000<br />
$5,000<br />
$0<br />
28.0<br />
<strong>CI</strong> Signature Select Canadian<br />
10.3<br />
Dec02 Dec04 Dec06 Dec08 Dec10<br />
$21,334<br />
Geographic Composition<br />
Source: <strong>CI</strong> <strong>Investments</strong> and CTVglobemedia Publishing Inc.<br />
United Kingdom 5.9%<br />
France 1.2%<br />
Switzerland 4.4%<br />
United States 24.8%<br />
Canada 44.4%<br />
Other 15.9%<br />
Netherlands 1.7%<br />
Germany 1.7%<br />
58 SUMMER 2011 PERSPECTIVE AS AT JUNE 30, 2011
Fund Facts<br />
as at June 30, 2011<br />
Fund Codes<br />
ISC<br />
DSC<br />
LSC<br />
Class A<br />
<strong>CI</strong>G6103<br />
<strong>CI</strong>G6153<br />
<strong>CI</strong>G1153<br />
Synergy Canadian Corporate Class (Class A)<br />
Also available: Class F & I<br />
Mutual Funds<br />
(Class A)<br />
Managed By: <strong>CI</strong> <strong>Investments</strong> Inc.<br />
Advisors: Picton Mahoney Asset Management<br />
Assets Under Management*: $948.9 million<br />
Portfolio Manager: David K Picton<br />
Asset Class: Canadian Equity<br />
Inception Date: December 1997<br />
NAV: $14.60<br />
Min. Initial Investment: $500<br />
Subsequent Purchase(s): $50<br />
Min. PAC Investment: $50<br />
Management Expense Ratio: 2.43%<br />
OBJECTIVE<br />
The fund seeks long−term capital growth by investing primarily in equity and equity−related securities of Canadian companies that<br />
represent the growth style. The fund may also invest in foreign securities. The fundamental investment objective of the fund cannot be<br />
changed without obtaining securityholder approval.<br />
Compound Returns and Quartile Rankings (as at June 30, 2011)<br />
This table shows the historical annual compound total return of the fund compared with the Globefund Group Average and Globefund’s<br />
benchmark S&P/TSX Total Return. The returns listed below are percentages. Performance of the fund versus its official benchmark can<br />
be found in the Management Report of Fund Performance (MRFP). See the related document section on this web page.<br />
Since<br />
YTD 1Mo 3Mo 1Yr 3Yr 5Yr 10Yr Inception*<br />
Qrtl 2 2 2 1 3 2 1 {N/A}<br />
Return 0.62 −2.28 −3.38 20.2 −1.4 2.58 6.79 9.28<br />
Grp Avg 0.09 −2.62 −4.1 17.52 −0.79 1.97 4.74 {N/A}<br />
Ind Ret 0.16 −3.33 −5.15 20.87 0.19 5.67 8.05 {N/A}<br />
*December 29, 1997<br />
Top Holdings as at June 30, 2011<br />
TD Bank 4.33%<br />
Suncor Energy 3.12%<br />
Royal Bank of Canada 2.51%<br />
Bank of Nova Scotia 2.27%<br />
Potash Corp. of Saskatchewan 2.23%<br />
Goldcorp Inc. 1.93%<br />
Canadian Natural Resources 1.87%<br />
Canadian National Railway 1.63%<br />
Bank of Montreal 1.56%<br />
Magna International 1.52%<br />
Total 22.97%<br />
Volatility Meter<br />
Low<br />
High<br />
Based on 3−year standard deviation relative to other funds<br />
in its category, from Globe HySales.<br />
Equity Style and Capitalization Overview<br />
Large<br />
Mid<br />
Small<br />
Blend Growth Value<br />
Performance Data<br />
This chart shows you the fund´s annual performance and how an investment would have changed over time.<br />
50%<br />
0%<br />
−50%<br />
Asset Class<br />
Equity Sectors<br />
−11.1<br />
−12.8<br />
32.0<br />
<strong>CI</strong> Synergy Canadian Corporate Class<br />
17.9<br />
19.2<br />
−33.8<br />
2001 2002 2003 2004 2005 2006 2007 2008 2009 2010<br />
Canadian Equity 69.2%<br />
Cash 2.6%<br />
International Equity 14.3%<br />
United States Equity 13.9%<br />
Cash 2.6%<br />
Other 10.1%<br />
Industrials 10.8%<br />
Energy 22.9%<br />
Financials 23.2%<br />
Materials 15.5%<br />
Consumer Discretionary 8.0%<br />
Information Technology 7.0%<br />
17.9<br />
5.8<br />
Current Value of a $10,000 Investment<br />
$25,000<br />
$20,000<br />
$15,000<br />
$10,000<br />
$5,000<br />
$0<br />
26.0<br />
<strong>CI</strong> Synergy Canadian Corporate Class<br />
13.5<br />
Dec02 Dec04 Dec06 Dec08 Dec10<br />
$19,870<br />
Geographic Composition<br />
Source: <strong>CI</strong> <strong>Investments</strong> and CTVglobemedia Publishing Inc.<br />
Canada 69.2%<br />
Japan 3.0%<br />
Germany 0.9%<br />
United Kingdom 2.2%<br />
United States 13.9%<br />
Other 7.9%<br />
South Korea 1.2%<br />
France 1.6%<br />
SUMMER 2011 PERSPECTIVE AS AT JUNE 30, 2011 59
Fund Facts<br />
as at June 30, 2011<br />
Fund Codes<br />
ISC<br />
DSC<br />
LSC<br />
Class A<br />
<strong>CI</strong>G2322<br />
<strong>CI</strong>G3322<br />
<strong>CI</strong>G1522<br />
Managed By: <strong>CI</strong> <strong>Investments</strong> Inc.<br />
Advisors: Cambridge Advisors<br />
Assets Under Management*: $452.3 million<br />
Portfolio Manager: Alan Radlo, MBA, BA<br />
Asset Class: Asset Allocation<br />
Inception Date: December 2007<br />
NAV: $11.68<br />
Min. Initial Investment: $500<br />
Subsequent Purchase(s): $50<br />
Min. PAC Investment: $50<br />
Management Expense Ratio: 2.43%<br />
Mutual Funds<br />
(Class A)<br />
Cambridge Canadian Asset Allocation Corporate Class<br />
(Class A)<br />
OBJECTIVE<br />
This fund’s objective is to achieve a superior total investment return by investing, directly or indirectly, in a combination of primarily<br />
equity and fixed income securities of Canadian companies. Indirect investments may include convertible securities, derivatives, equity−<br />
related securities and securities of other mutual funds. Any change to the investment objective must be approved by a majority of the<br />
votes cast by shareholders at a meeting called to consider the change.<br />
Compound Returns and Quartile Rankings (as at June 30, 2011)<br />
This table shows the historical annual compound total return of the fund compared with the Globefund Group Average and Globefund’s<br />
benchmark Globe Tactical Balanced Peer Index. The returns listed below are percentages. Performance of the fund versus its official<br />
benchmark can be found in the Management Report of Fund Performance (MRFP). See the related document section on this web page.<br />
Since<br />
YTD 1Mo 3Mo 1Yr 3Yr 5Yr 10Yr Inception*<br />
Qrtl 1 1 3 1 1 {N/A} {N/A} {N/A}<br />
Return 5.23 −0.26 −2.83 23.43 4.46 {N/A} {N/A} 4.81<br />
Grp Avg 0.33 −1.73 −2.29 13.0 0.59 2.73 4.58 {N/A}<br />
Ind Ret 0.41 −1.73 −2.38 11.45 2.0 2.89 3.96 {N/A}<br />
*December 31, 2007<br />
Top Holdings as at June 30, 2011<br />
Keyera Corp. 4.50%<br />
Inter Pipeline Fund 4.09%<br />
Provident Energy Ltd. 3.55%<br />
Tourmaline Oil 2.64%<br />
Pembina Pipeline Corp. 2.62%<br />
Canadian Natural Resources 2.50%<br />
JP Morgan Chase & Co. 2.04%<br />
Brookfield Infrastructure LP 1.99%<br />
Canadian National Railway 1.99%<br />
Cenovus Energy 1.88%<br />
Total 27.80%<br />
Volatility Meter<br />
Low<br />
High<br />
Based on 3−year standard deviation relative to other funds<br />
in its category, from Globe HySales.<br />
Equity Style and Capitalization Overview<br />
Blend Growth Value<br />
Large<br />
Mid<br />
Small<br />
Performance Data<br />
This chart shows you the fund´s annual performance and how an investment would have changed over time.<br />
50%<br />
0%<br />
−50%<br />
Asset Class<br />
Equity Sectors<br />
<strong>CI</strong> Cambridge Cdn Asset All. CC<br />
−20.0<br />
2001 2002 2003 2004 2005 2006 2007 2008 2009 2010<br />
Canadian Equity 59.7%<br />
International Equity 2.9%<br />
Bond 1.1%<br />
Cash 20.0%<br />
United States Equity 16.4%<br />
Health Care 2.4%<br />
Industrials 11.6%<br />
Information Technology 9.9%<br />
Financials 21.3%<br />
Energy 26.7%<br />
Other 5.9%<br />
Cash 20.0%<br />
Consumer Discretionary 2.4%<br />
Current Value of a $10,000 Investment<br />
$14,000<br />
$12,000<br />
$10,000<br />
$8,000<br />
$6,000<br />
$4,000<br />
$2,000<br />
23.9<br />
<strong>CI</strong> Cambridge Cdn Asset All. CC<br />
$0<br />
Dec07 Dec08 Dec09 Dec10<br />
13.0<br />
$11,785<br />
Geographic Composition<br />
Source: <strong>CI</strong> <strong>Investments</strong> and CTVglobemedia Publishing Inc.<br />
Canada 60.8%<br />
Germany 1.1%<br />
Bermuda 0.7%<br />
Other 20.0%<br />
United States 16.4%<br />
Switzerland 0.5%<br />
United Kingdom 0.6%<br />
60 SUMMER 2011 PERSPECTIVE AS AT JUNE 30, 2011
Fund Facts<br />
as at June 30, 2011<br />
Fund Codes Class A Corporate Class<br />
ISC <strong>CI</strong>G691 <strong>CI</strong>G2310<br />
DSC <strong>CI</strong>G891 <strong>CI</strong>G3310<br />
LSC <strong>CI</strong>G1891 <strong>CI</strong>G1310<br />
Harbour Growth & Income Fund (Class A)<br />
Also available: Class F & I<br />
Mutual Funds<br />
(Class A)<br />
Managed By: <strong>CI</strong> <strong>Investments</strong> Inc.<br />
Advisors: Harbour Advisors<br />
Assets Under Management*: $3,944.3 million<br />
Portfolio Manager: Gerald Coleman and Stephen<br />
Jenkins<br />
Asset Class: Canadian Balanced<br />
Inception Date: June 1997<br />
NAV: $18.68<br />
Min. Initial Investment: $500<br />
Subsequent Purchase(s): $50<br />
Min. PAC Investment: $50<br />
Management Expense Ratio: 2.43%<br />
Top Holdings as at June 30, 2011<br />
Suncor Energy<br />
−<br />
Tim Hortons<br />
−<br />
BHP Billiton Limited<br />
−<br />
Canadian National Railway<br />
−<br />
Intact Financial<br />
−<br />
Manulife Financial<br />
−<br />
TD Bank<br />
−<br />
Potash Corp. of Saskatchewan<br />
−<br />
Bank of Nova Scotia<br />
−<br />
Talisman Energy<br />
−<br />
Total 35.60%<br />
OBJECTIVE<br />
This fund’s objective is to obtain long−term total return through a prudent balance of income and capital appreciation. It invests primarily<br />
in equity and equity−related securities of mid− to large−capitalization Canadian companies and fixed income securities issued by<br />
Canadian governments and companies. The proportion of the fund’s assets invested in equity and fixed income securities may vary<br />
according to market conditions. Any change to the investment objective must be approved by a majority of votes cast at a meeting of<br />
unitholders held for that reason.<br />
Compound Returns and Quartile Rankings (as at June 30, 2011)<br />
This table shows the historical annual compound total return of the fund compared with the Globefund Group Average and Globefund’s<br />
benchmark Blend: 50% S&P/TSX, 50% DEX Universe. The returns listed below are percentages. Performance of the fund versus its<br />
official benchmark can be found in the Management Report of Fund Performance (MRFP). See the related document section on this web<br />
page.<br />
Since<br />
YTD 1Mo 3Mo 1Yr 3Yr 5Yr 10Yr Inception*<br />
Qrtl 3 2 3 2 2 1 1 {N/A}<br />
Return −0.16 −1.37 −2.81 13.9 0.69 3.0 6.2 5.85<br />
Grp Avg 0.33 −1.73 −2.29 13.0 0.59 2.73 4.58 {N/A}<br />
Ind Ret 1.23 −1.63 −1.38 12.61 3.66 6.24 7.56 {N/A}<br />
*June 27, 1997<br />
Performance Data<br />
This chart shows you the fund´s annual performance and how an investment would have changed over time.<br />
50%<br />
0%<br />
−50%<br />
Asset Class<br />
8.9<br />
1.3<br />
8.1<br />
<strong>CI</strong> Harbour Growth & Income<br />
12.3<br />
17.3<br />
−19.7<br />
2001 2002 2003 2004 2005 2006 2007 2008 2009 2010<br />
11.2<br />
3.8<br />
Current Value of a $10,000 Investment<br />
21.2<br />
8.0<br />
Volatility Meter<br />
Low<br />
High<br />
Based on 3−year standard deviation relative to other funds<br />
in its category, from Globe HySales.<br />
International Equity 10.2%<br />
Bond 4.8%<br />
Cash 18.1%<br />
Canadian Equity 50.2%<br />
United States Equity 16.4%<br />
Other 0.2%<br />
$20,000<br />
$18,000<br />
$16,000<br />
$14,000<br />
$12,000<br />
<strong>CI</strong> Harbour Growth & Income<br />
$18,139<br />
Equity Style and Capitalization Overview<br />
Blend Growth Value<br />
Large<br />
Mid<br />
Small<br />
Equity Sectors<br />
Consumer Staples 4.6%<br />
Materials 15.1%<br />
Other 11.3%<br />
Cash 18.1%<br />
Financials 20.8%<br />
Information Technology 7.3%<br />
Energy 16.0%<br />
Industrials 6.8%<br />
$10,000<br />
$8,000<br />
$6,000<br />
$4,000<br />
$2,000<br />
$0<br />
Dec02 Dec04 Dec06 Dec08 Dec10<br />
Geographic Composition<br />
Source: <strong>CI</strong> <strong>Investments</strong> and CTVglobemedia Publishing Inc.<br />
Canada 55.1%<br />
United Kingdom 3.9%<br />
China 0.2%<br />
Australia 3.6%<br />
Other 18.3%<br />
United States 16.4%<br />
Belgium 0.5%<br />
Taiwan 1.9%<br />
SUMMER 2011 PERSPECTIVE AS AT JUNE 30, 2011 61
Fund Facts<br />
as at June 30, 2011<br />
Fund Codes Class A Corporate Class<br />
ISC <strong>CI</strong>G6116 <strong>CI</strong>G2309<br />
DSC <strong>CI</strong>G6166 <strong>CI</strong>G3309<br />
LSC <strong>CI</strong>G1166 <strong>CI</strong>G1309<br />
Signature Income & Growth Fund (Class A)<br />
Also available: Class F & I<br />
Mutual Funds<br />
(Class A)<br />
Managed By: <strong>CI</strong> <strong>Investments</strong> Inc.<br />
Advisors: Signature Global Advisors<br />
Assets Under Management*: $2,440.3 million<br />
Portfolio Manager: Eric Bushell and James<br />
Dutkiewicz<br />
Asset Class: Canadian Balanced<br />
Inception Date: November 2000<br />
NAV: $4.78<br />
Min. Initial Investment: $500<br />
Subsequent Purchase(s): $50<br />
Min. PAC Investment: $50<br />
Management Expense Ratio: 2.43%<br />
ÿ<br />
Top Holdings as at June 30, 2011<br />
TD Bank 3.63%<br />
<strong>CI</strong>BC 2.22%<br />
Suncor Energy 1.43%<br />
Canadian Natural Resources 1.38%<br />
Talisman Energy 1.19%<br />
Barrick Gold Corp. 0.94%<br />
Bank of Montreal 0.92%<br />
Telstra Corporation Ltd 0.89%<br />
Eli Lilly & Co. 0.83%<br />
Schlumberger Ltd. 0.80%<br />
Total 14.23%<br />
OBJECTIVE<br />
The fund seeks to provide a steady flow of current income while preserving capital by investing in a diversified portfolio of securities<br />
composed mainly of equity, equity−related and fixed income securities of Canadian issuers. The fund may also invest in foreign<br />
securities. The fundamental investment objective of the fund cannot be changed without obtaining securityholder approval.<br />
Compound Returns and Quartile Rankings (as at June 30, 2011)<br />
This table shows the historical annual compound total return of the fund compared with the Globefund Group Average and Globefund’s<br />
benchmark Blend: 60% MS<strong>CI</strong> World, 40% Barclays Cap. The returns listed below are percentages. Performance of the fund versus its<br />
official benchmark can be found in the Management Report of Fund Performance (MRFP). See the related document section on this web<br />
page.<br />
Since<br />
YTD 1Mo 3Mo 1Yr 3Yr 5Yr 10Yr Inception*<br />
Qrtl 2 3 4 1 2 1 1 {N/A}<br />
Return 1.63 −1.73 −1.73 15.43 3.81 4.57 7.22 7.11<br />
Grp Avg 1.31 −1.65 −0.85 12.84 2.76 2.84 3.52 {N/A}<br />
Ind Ret 1.27 −1.57 0.58 8.93 1.82 1.7 0.72 {N/A}<br />
*November 13, 2000<br />
Performance Data<br />
This chart shows you the fund´s annual performance and how an investment would have changed over time.<br />
50%<br />
0%<br />
−50%<br />
Asset Class<br />
9.1<br />
−2.4<br />
15.6<br />
<strong>CI</strong> Signature Income & Growth<br />
13.3<br />
14.7<br />
−21.2<br />
2001 2002 2003 2004 2005 2006 2007 2008 2009 2010<br />
12.7<br />
1.8<br />
Current Value of a $10,000 Investment<br />
27.6<br />
10.3<br />
Volatility Meter<br />
Low<br />
High<br />
Based on 3−year standard deviation relative to other funds<br />
in its category, from Globe HySales.<br />
Equity Style and Capitalization Overview<br />
Blend Growth Value<br />
Large<br />
Mid<br />
Small<br />
Equity Sectors<br />
Income and Royalty Trusts 0.6%<br />
Cash and Equivalents 13.5%<br />
Canadian Bonds 12.3%<br />
Foreign Equity 27.5%<br />
Canadian Equity 27.0%<br />
Other 2.0%<br />
REITs 1.0%<br />
Foreign Bonds 16.1%<br />
Energy 11.0%<br />
Consumer Staples 3.8%<br />
Materials 6.2%<br />
Financials 15.2%<br />
Other 40.7%<br />
Cash 13.5%<br />
Consumer Discretionary 4.0%<br />
Industrials 5.6%<br />
$25,000<br />
$20,000<br />
$15,000<br />
$10,000<br />
$5,000<br />
$0<br />
<strong>CI</strong> Signature Income & Growth<br />
Dec02 Dec04 Dec06 Dec08 Dec10<br />
$20,084<br />
Geographic Composition<br />
Source: <strong>CI</strong> <strong>Investments</strong> and CTVglobemedia Publishing Inc.<br />
Bermuda 1.0%<br />
Switzerland 2.8%<br />
United Kingdom 3.6%<br />
United States 26.8%<br />
Canada 41.4%<br />
Other 21.0%<br />
Australia 2.2%<br />
France 1.1%<br />
62 SUMMER 2011 PERSPECTIVE AS AT JUNE 30, 2011
Fund Facts<br />
as at June 30, 2011<br />
Fund Codes<br />
ISC<br />
DSC<br />
LSC<br />
Class A<br />
<strong>CI</strong>G685<br />
<strong>CI</strong>G785<br />
<strong>CI</strong>G1785<br />
Signature Canadian Balanced Fund (Class A)<br />
Also available: Class F & I<br />
Mutual Funds<br />
(Class A)<br />
Managed By: <strong>CI</strong> <strong>Investments</strong> Inc.<br />
Advisors: Signature Global Advisors<br />
Assets Under Management*: $1,284.3 million<br />
Portfolio Manager: Eric Bushell and James<br />
Dutkiewicz<br />
Asset Class: Canadian Balanced<br />
Inception Date: June 1997<br />
NAV: $15.66<br />
Min. Initial Investment: $500<br />
Subsequent Purchase(s): $50<br />
Min. PAC Investment: $50<br />
Management Expense Ratio: 2.42%<br />
Top Holdings as at June 30, 2011<br />
TD Bank 4.04%<br />
<strong>CI</strong>BC 2.47%<br />
Suncor Energy 2.04%<br />
Canadian Natural Resources 1.96%<br />
Talisman Energy 1.70%<br />
Barrick Gold Corp. 1.34%<br />
Brookfield Asset Management 1.13%<br />
Cenovus Energy 1.12%<br />
Freeport McMoran 1.12%<br />
Eli Lilly & Co. 1.11%<br />
Total 18.03%<br />
OBJECTIVE<br />
This fund’s objective is to achieve an attractive total return, consisting of income and capital gains. It invests primarily in a mix of<br />
Canadian equity and equity−related securities and fixed income securities. The fund is not limited to how much it invests or keeps<br />
invested in each asset class. The mix may vary according to market conditions. Any change to the investment objective must be<br />
approved by a majority of votes cast at a meeting of unitholders held for that reason.<br />
Compound Returns and Quartile Rankings (as at June 30, 2011)<br />
This table shows the historical annual compound total return of the fund compared with the Globefund Group Average and Globefund’s<br />
benchmark Blend: 50% S&P/TSX, 50% DEX Universe. The returns listed below are percentages. Performance of the fund versus its<br />
official benchmark can be found in the Management Report of Fund Performance (MRFP). See the related document section on this web<br />
page.<br />
Since<br />
YTD 1Mo 3Mo 1Yr 3Yr 5Yr 10Yr Inception*<br />
Qrtl 2 3 3 1 1 1 1 {N/A}<br />
Return 1.1 −1.57 −1.69 14.33 4.13 5.34 6.22 8.04<br />
Grp Avg 1.01 −1.6 −1.27 10.97 2.1 3.23 4.47 {N/A}<br />
Ind Ret 1.23 −1.63 −1.38 12.61 3.66 6.24 7.56 {N/A}<br />
*June 25, 1997<br />
Performance Data<br />
This chart shows you the fund´s annual performance and how an investment would have changed over time.<br />
50%<br />
0%<br />
−50%<br />
Asset Class<br />
−3.3<br />
−7.3<br />
14.9<br />
<strong>CI</strong> Signature Canadian Balanced<br />
10.4<br />
17.1<br />
−15.5<br />
2001 2002 2003 2004 2005 2006 2007 2008 2009 2010<br />
14.4<br />
2.5<br />
Current Value of a $10,000 Investment<br />
21.3<br />
9.4<br />
Volatility Meter<br />
Low<br />
High<br />
Based on 3−year standard deviation relative to other funds<br />
in its category, from Globe HySales.<br />
International Equity 15.7%<br />
Cash 14.3%<br />
Canadian Equity 30.6%<br />
Bond 21.4%<br />
United States Equity 17.9%<br />
$20,000<br />
$18,000<br />
$16,000<br />
$14,000<br />
$12,000<br />
<strong>CI</strong> Signature Canadian Balanced<br />
$18,256<br />
Equity Style and Capitalization Overview<br />
Blend Growth Value<br />
Large<br />
Mid<br />
Small<br />
Equity Sectors<br />
Energy 13.8%<br />
Information Technology 4.6%<br />
Materials 8.2%<br />
Other 32.6%<br />
Financials 16.3%<br />
Cash 14.3%<br />
Industrials 5.4%<br />
Consumer Discretionary 4.7%<br />
$10,000<br />
$8,000<br />
$6,000<br />
$4,000<br />
$2,000<br />
$0<br />
Dec02 Dec04 Dec06 Dec08 Dec10<br />
Geographic Composition<br />
Source: <strong>CI</strong> <strong>Investments</strong> and CTVglobemedia Publishing Inc.<br />
United Kingdom 4.7%<br />
France 1.0%<br />
Switzerland 3.3%<br />
United States 19.9%<br />
Canada 48.9%<br />
Other 19.8%<br />
Germany 1.2%<br />
Netherlands 1.3%<br />
SUMMER 2011 PERSPECTIVE AS AT JUNE 30, 2011 63
Fund Facts<br />
as at June 30, 2011<br />
Fund Codes Class A Corporate Class<br />
ISC <strong>CI</strong>G611 <strong>CI</strong>G013<br />
DSC <strong>CI</strong>G811 <strong>CI</strong>G344<br />
LSC <strong>CI</strong>G1811 <strong>CI</strong>G1344<br />
Signature Canadian Resource Fund (Class A)<br />
Also available: Class F<br />
Mutual Funds<br />
(Class A)<br />
Managed By: <strong>CI</strong> <strong>Investments</strong> Inc.<br />
Advisors: Signature Global Advisors<br />
Assets Under Management*: $756.2 million<br />
Portfolio Manager: Scott Vali<br />
Asset Class: Industry−Specific<br />
Inception Date: April 1997<br />
NAV: $22.61<br />
Min. Initial Investment: $500<br />
Subsequent Purchase(s): $50<br />
Min. PAC Investment: $50<br />
Management Expense Ratio: 2.34%<br />
OBJECTIVE<br />
This fund’s objective is to obtain maximum long−term capital growth. It invests primarily in equity and equity−related securities of<br />
Canadian companies engaged in or related to the energy, commodity and natural resource industries. Any change to the investment<br />
objective must be approved by a majority of votes cast at a meeting of unitholders held for that reason.<br />
Compound Returns and Quartile Rankings (as at June 30, 2011)<br />
This table shows the historical annual compound total return of the fund compared with the Globefund Group Average and Globefund’s<br />
benchmark Globe Natural Resources Peer Index. The returns listed below are percentages. Performance of the fund versus its official<br />
benchmark can be found in the Management Report of Fund Performance (MRFP). See the related document section on this web page.<br />
Since<br />
YTD 1Mo 3Mo 1Yr 3Yr 5Yr 10Yr Inception*<br />
Qrtl 2 1 1 3 2 1 1 {N/A}<br />
Return −2.04 −2.88 −5.87 25.82 −2.72 8.79 16.45 11.69<br />
Grp Avg −5.08 −5.6 −9.19 31.3 −3.87 5.32 13.76 {N/A}<br />
Ind Ret −5.18 −5.6 −9.24 31.7 −2.63 5.5 13.61 {N/A}<br />
*April 11, 1997<br />
Top Holdings as at June 30, 2011<br />
Freeport McMoran 3.23%<br />
Xstrata PLC 3.13%<br />
Suncor Energy 3.11%<br />
BHP Billiton PLC 3.02%<br />
Goldcorp Inc. 2.95%<br />
Barrick Gold Corp. 2.89%<br />
Canadian Natural Resources 2.87%<br />
Talisman Energy 2.28%<br />
Potash Corp. of Saskatchewan 2.10%<br />
Cliffs Natural Resources 2.10%<br />
Total 27.68%<br />
Volatility Meter<br />
Low<br />
High<br />
Based on 3−year standard deviation relative to other funds<br />
in its category, from Globe HySales.<br />
Equity Style and Capitalization Overview<br />
Large<br />
Mid<br />
Small<br />
Blend Growth Value<br />
Performance Data<br />
This chart shows you the fund´s annual performance and how an investment would have changed over time.<br />
50%<br />
0%<br />
−50%<br />
Asset Class<br />
Equity Sectors<br />
12.5<br />
11.0<br />
34.8<br />
<strong>CI</strong> Signature Canadian Resource<br />
19.3<br />
49.8<br />
−29.6<br />
2001 2002 2003 2004 2005 2006 2007 2008 2009 2010<br />
Canadian Equity 54.7%<br />
Cash 8.8%<br />
United States Equity 23.2%<br />
International Equity 13.3%<br />
Other 45.5%<br />
28.2<br />
18.9<br />
Current Value of a $10,000 Investment<br />
$60,000<br />
$50,000<br />
$40,000<br />
$30,000<br />
$20,000<br />
$10,000<br />
41.8<br />
<strong>CI</strong> Signature Canadian Resource<br />
15.4<br />
$47,425<br />
Materials 45.6%<br />
Cash 8.8%<br />
$0<br />
Dec02 Dec04 Dec06 Dec08 Dec10<br />
Geographic Composition<br />
Source: <strong>CI</strong> <strong>Investments</strong> and CTVglobemedia Publishing Inc.<br />
Canada 54.7%<br />
United Kingdom 7.3%<br />
Switzerland 3.1%<br />
United States 23.2%<br />
Other 8.8%<br />
Australia 1.1%<br />
Netherlands 1.8%<br />
64 SUMMER 2011 PERSPECTIVE AS AT JUNE 30, 2011
Fund Facts<br />
as at June 30, 2011<br />
Fund Codes<br />
ISC<br />
DSC<br />
LSC<br />
Class A<br />
<strong>CI</strong>G281<br />
<strong>CI</strong>G781<br />
<strong>CI</strong>G1781<br />
Managed By: <strong>CI</strong> <strong>Investments</strong> Inc.<br />
Advisors: Signature Global Advisors<br />
Assets Under Management*: $165.3 million<br />
Portfolio Manager: Scott Vali<br />
Asset Class: Industry−Specific<br />
Inception Date: June 1998<br />
NAV: $49.55<br />
Min. Initial Investment: $500<br />
Subsequent Purchase(s): $50<br />
Min. PAC Investment: $50<br />
Management Expense Ratio: 2.45%<br />
Mutual Funds<br />
(Class A)<br />
Signature Global Energy Corporate Class (Class A)<br />
Also available: Class F<br />
OBJECTIVE<br />
This fund’s objective is to obtain maximum long−term capital growth. It invests primarily in equity and equity−related securities of<br />
companies around the world that are engaged in the exploration, development, production and distribution of oil, gas, coal and related<br />
energy products, including geothermal, solar and other energy sources. The fund may also invest in companies that supply goods and<br />
services to these companies. Any change to the investment objective must be approved by a majority of votes cast at a meeting of<br />
unitholders held for that reason.<br />
Compound Returns and Quartile Rankings (as at June 30, 2011)<br />
This table shows the historical annual compound total return of the fund compared with the Globefund Group Average and Globefund’s<br />
benchmark Globe Natural Resources Peer Index. The returns listed below are percentages. Performance of the fund versus its official<br />
benchmark can be found in the Management Report of Fund Performance (MRFP). See the related document section on this web page.<br />
Since<br />
YTD 1Mo 3Mo 1Yr 3Yr 5Yr 10Yr Inception*<br />
Qrtl 2 1 2 3 2 3 3 {N/A}<br />
Return −0.08 −3.84 −7.68 24.86 −4.33 4.43 12.42 13.4<br />
Grp Avg −5.08 −5.6 −9.19 31.3 −3.87 5.32 13.76 {N/A}<br />
Ind Ret −5.18 −5.6 −9.24 31.7 −2.63 5.5 13.61 {N/A}<br />
*June 11, 1998<br />
Top Holdings as at June 30, 2011<br />
Suncor Energy 3.79%<br />
Apache Corp. 3.52%<br />
Canadian Natural Resources 3.52%<br />
Occidental Petroleum 3.28%<br />
Cenovus Energy 2.84%<br />
Continental Resources 2.76%<br />
Exxon Mobil 2.61%<br />
Chevron Corp. 2.59%<br />
Talisman Energy 2.32%<br />
Whiting Petroleum 2.26%<br />
Total 29.49%<br />
Volatility Meter<br />
Low<br />
High<br />
Based on 3−year standard deviation relative to other funds<br />
in its category, from Globe HySales.<br />
Equity Style and Capitalization Overview<br />
Large<br />
Mid<br />
Small<br />
Blend Growth Value<br />
Performance Data<br />
This chart shows you the fund´s annual performance and how an investment would have changed over time.<br />
100%<br />
0%<br />
−100%<br />
Asset Class<br />
Equity Sectors<br />
0.3<br />
−4.4<br />
23.8<br />
<strong>CI</strong> Signature Global Energy Corp Cl<br />
39.1<br />
61.6<br />
−30.1<br />
2001 2002 2003 2004 2005 2006 2007 2008 2009 2010<br />
Canadian Equity 52.3%<br />
International Equity 4.6%<br />
United States Equity 33.3%<br />
Cash 9.8%<br />
Energy 86.2%<br />
Utilities 1.3%<br />
Cash 9.8%<br />
Materials 2.7%<br />
6.1<br />
12.4<br />
Current Value of a $10,000 Investment<br />
$40,000<br />
$30,000<br />
$20,000<br />
$10,000<br />
$0<br />
35.8<br />
<strong>CI</strong> Signature Global Energy Corp Cl<br />
11.8<br />
Dec02 Dec04 Dec06 Dec08 Dec10<br />
$32,931<br />
Geographic Composition<br />
Source: <strong>CI</strong> <strong>Investments</strong> and CTVglobemedia Publishing Inc.<br />
Canada 52.3%<br />
Netherlands 3.6%<br />
United Kingdom 0.5%<br />
United States 33.3%<br />
Other 9.8%<br />
Norway 0.5%<br />
SUMMER 2011 PERSPECTIVE AS AT JUNE 30, 2011 65
Fund Facts<br />
as at June 30, 2011<br />
Fund Codes Class A Corporate Class<br />
ISC <strong>CI</strong>G837 <strong>CI</strong>G2303<br />
DSC <strong>CI</strong>G847 <strong>CI</strong>G3303<br />
LSC <strong>CI</strong>G1847 <strong>CI</strong>G1303<br />
Signature Canadian Bond Fund (Class A)<br />
Also available: Class F & I<br />
Mutual Funds<br />
(Class A)<br />
Managed By: <strong>CI</strong> <strong>Investments</strong> Inc.<br />
Advisors: Signature Global Advisors<br />
Assets Under Management*: $719.8 million<br />
Portfolio Manager: James Dutkiewicz<br />
Asset Class: Canadian Fixed Income<br />
Inception Date: January 1993<br />
NAV: $5.67<br />
Min. Initial Investment: $500<br />
Subsequent Purchase(s): $50<br />
Min. PAC Investment: $50<br />
Management Expense Ratio: 1.67%<br />
ÿ<br />
Top Holdings as at June 30, 2011<br />
Gov’t of Canada, 1.75%, March 1,<br />
2013<br />
Gov’t of Canada, 2.00%, December 1,<br />
2014<br />
Gov’t of Canada, 2.00%, September 1,<br />
2012<br />
Volatility Meter<br />
Low<br />
High<br />
Based on 3−year standard deviation relative to other funds<br />
in its category, from Globe HySales.<br />
Fixed Income and Capitalization Overview<br />
Spread Rate Blend<br />
Long<br />
Blend<br />
Short<br />
7.10%<br />
4.25%<br />
3.36%<br />
Gov’t of Canada, 3.25%, June 1, 2021 2.60%<br />
Province of Ontario, 4.20%, June 2,<br />
2020<br />
2.35%<br />
Ontario School Boards Fin., 5.90%, 2.13%<br />
June 2, 2033<br />
Gov’t of Canada, 5.00%, June 1, 2037 2.12%<br />
Gov’t of Canada, 3.00%, December 1, 1.72%<br />
2015<br />
Gov’t of Canada, 4.00%, June 1, 2041 1.69%<br />
Gov’t of Canada, 3.50%, June 1, 2020 1.67%<br />
Total 28.99%<br />
OBJECTIVE<br />
This fund’s objective is to obtain long−term total return. It invests primarily in fixed income securities of Canadian governments and<br />
companies that the portfolio advisor believes offers an attractive yield and the opportunity for capital gains. Any change to the<br />
investment objective must be approved by a majority of votes cast at a meeting of shareholders held for that reason.<br />
Compound Returns and Quartile Rankings (as at June 30, 2011)<br />
This table shows the historical annual compound total return of the fund compared with the Globefund Group Average and Globefund’s<br />
benchmark DEX Universe Bond Total Return Index. The returns listed below are percentages. Performance of the fund versus its official<br />
benchmark can be found in the Management Report of Fund Performance (MRFP). See the related document section on this web page.<br />
Since<br />
YTD 1Mo 3Mo 1Yr 3Yr 5Yr 10Yr Inception*<br />
Qrtl 2 3 3 2 3 2 2 {N/A}<br />
Return 1.66 −0.2 1.84 3.25 4.68 4.46 4.69 1.99<br />
Grp Avg 1.61 −0.13 1.91 3.34 4.94 4.53 4.88 {N/A}<br />
Ind Ret 2.2 0.07 2.48 4.67 6.18 6.02 6.45 {N/A}<br />
*January 20, 1993<br />
Performance Data<br />
This chart shows you the fund´s annual performance and how an investment would have changed over time.<br />
Bond Type<br />
10.0%<br />
Bond Term<br />
5.0%<br />
0.0%<br />
6.3<br />
Geographic Composition<br />
6.9<br />
3.7<br />
<strong>CI</strong> Signature Canadian Bond<br />
4.7<br />
4.9<br />
2001 2002 2003 2004 2005 2006 2007 2008 2009 2010<br />
Other 7.6%<br />
Municipal Bonds 4.0%<br />
Corporate Debentures 47.0%<br />
Federal Bonds 31.8%<br />
Provincial Bonds 9.6%<br />
10−20 years maturity 5.6%<br />
Other 7.6%<br />
More than 20 years maturity 26.9%<br />
1−5 years maturity 35.6%<br />
5−10 years maturity 24.3%<br />
2.7<br />
2.1<br />
3.2<br />
Current Value of a $10,000 Investment<br />
$16,000<br />
$14,000<br />
$12,000<br />
$10,000<br />
$8,000<br />
$6,000<br />
$4,000<br />
$2,000<br />
$0<br />
<strong>CI</strong> Signature Canadian Bond<br />
4.5<br />
6.1<br />
Dec02 Dec04 Dec06 Dec08 Dec10<br />
$15,518<br />
Source: <strong>CI</strong> <strong>Investments</strong> and CTVglobemedia Publishing Inc.<br />
Canada 85.4%<br />
United Kingdom 1.9%<br />
France 0.3%<br />
Austria 0.9%<br />
Other 7.6%<br />
United States 2.5%<br />
Tunisia 0.6%<br />
Spain 0.8%<br />
66 SUMMER 2011 PERSPECTIVE AS AT JUNE 30, 2011
Fund Facts<br />
as at June 30, 2011<br />
Fund Codes Class A Corporate Class<br />
ISC <strong>CI</strong>G610 <strong>CI</strong>G2305<br />
DSC <strong>CI</strong>G810 <strong>CI</strong>G3305<br />
LSC <strong>CI</strong>G1810 <strong>CI</strong>G1305<br />
Signature Dividend Fund (Class A)<br />
Also available: Class F & I<br />
Mutual Funds<br />
(Class A)<br />
Managed By: <strong>CI</strong> <strong>Investments</strong> Inc.<br />
Advisors: Signature Global Advisors<br />
Assets Under Management*: $897.2 million<br />
Portfolio Manager: Eric Bushell<br />
Asset Class: Canadian Dividend<br />
Inception Date: October 1996<br />
NAV: $12.48<br />
Min. Initial Investment: $500<br />
Subsequent Purchase(s): $50<br />
Min. PAC Investment: $50<br />
Management Expense Ratio: 1.97%<br />
OBJECTIVE<br />
This fund’s objective is to generate a high level of dividend income and to preserve capital. It invests primarily in preferred shares and<br />
dividend paying common shares of Canadian companies. It may also invest in other common shares, fixed income securities and income<br />
trusts. The fund may also invest in foreign securities. Any change to the investment objective must be approved by a majority of votes<br />
cast at a meeting of unitholders held for that reason.<br />
Compound Returns and Quartile Rankings (as at June 30, 2011)<br />
This table shows the historical annual compound total return of the fund compared with the Globefund Group Average and Globefund’s<br />
benchmark S&P/TSX Total Return. The returns listed below are percentages. Performance of the fund versus its official benchmark can<br />
be found in the Management Report of Fund Performance (MRFP). See the related document section on this web page.<br />
Since<br />
YTD 1Mo 3Mo 1Yr 3Yr 5Yr 10Yr Inception*<br />
Qrtl 2 2 1 3 1 2 3 {N/A}<br />
Return 3.67 −1.8 −0.4 15.8 6.46 3.52 5.37 6.6<br />
Grp Avg 2.82 −2.08 −2.21 17.0 2.78 3.42 6.09 {N/A}<br />
Ind Ret 0.16 −3.33 −5.15 20.87 0.19 5.67 8.05 {N/A}<br />
*October 29, 1996<br />
Top Holdings as at June 30, 2011<br />
TD Bank 5.74%<br />
<strong>CI</strong>BC 2.54%<br />
Eli Lilly & Co. 1.74%<br />
Bank of America 1.62%<br />
Manitoba Telecom Services 1.59%<br />
BCE Inc. 1.55%<br />
BCE Inc. 1.48%<br />
Novartis AG 1.41%<br />
BCE Inc. 1.38%<br />
BCE Inc. 1.35%<br />
Total 20.40%<br />
Volatility Meter<br />
Low<br />
High<br />
Based on 3−year standard deviation relative to other funds<br />
in its category, from Globe HySales.<br />
Equity Style and Capitalization Overview<br />
Large<br />
Mid<br />
Small<br />
Blend Growth Value<br />
Performance Data<br />
This chart shows you the fund´s annual performance and how an investment would have changed over time.<br />
50%<br />
0%<br />
−50%<br />
Asset Class<br />
Equity Sectors<br />
5.7<br />
−2.3<br />
12.9<br />
9.6<br />
<strong>CI</strong> Signature Dividend<br />
11.7<br />
−5.1<br />
−23.0<br />
2001 2002 2003 2004 2005 2006 2007 2008 2009 2010<br />
Canadian Equity 61.8%<br />
Bond 1.1%<br />
Cash 0.8%<br />
International Equity 20.1%<br />
United States Equity 16.3%<br />
Energy 8.8%<br />
Cash 0.8%<br />
Consumer Staples 6.9%<br />
Other 12.4%<br />
Financials 48.5%<br />
Telecommunication Services 11.9%<br />
Health Care 5.0%<br />
Industrials 5.8%<br />
10.8<br />
Current Value of a $10,000 Investment<br />
$18,000<br />
$16,000<br />
$14,000<br />
$12,000<br />
$10,000<br />
$8,000<br />
$6,000<br />
$4,000<br />
$2,000<br />
$0<br />
<strong>CI</strong> Signature Dividend<br />
32.2<br />
9.4<br />
Dec02 Dec04 Dec06 Dec08 Dec10<br />
$16,836<br />
Geographic Composition<br />
Source: <strong>CI</strong> <strong>Investments</strong> and CTVglobemedia Publishing Inc.<br />
Canada 62.3%<br />
Other 5.0%<br />
Brazil 1.8%<br />
Germany 3.8%<br />
United States 16.6%<br />
United Kingdom 5.4%<br />
France 1.8%<br />
Switzerland 3.3%<br />
SUMMER 2011 PERSPECTIVE AS AT JUNE 30, 2011 67
Fund Facts<br />
as at June 30, 2011<br />
Fund Codes Class A Corporate Class<br />
ISC <strong>CI</strong>G686 <strong>CI</strong>G2304<br />
DSC <strong>CI</strong>G786 <strong>CI</strong>G3304<br />
LSC <strong>CI</strong>G1786 <strong>CI</strong>G1304<br />
Signature High Income Fund (Class A)<br />
Also available: Class F & I<br />
Mutual Funds<br />
(Class A)<br />
Managed By: <strong>CI</strong> <strong>Investments</strong> Inc.<br />
Advisors: Signature Global Advisors<br />
Assets Under Management*: $2,974.2 million<br />
Portfolio Manager: Eric Bushell<br />
Asset Class: Canadian Balanced Income<br />
Inception Date: December 1996<br />
NAV: $13.89<br />
Min. Initial Investment: $500<br />
Subsequent Purchase(s): $50<br />
Min. PAC Investment: $50<br />
Management Expense Ratio: 1.60%<br />
ÿ<br />
Top Holdings as at June 30, 2011<br />
Brookfield Asset Management 3.00%<br />
Inter Pipeline Fund 2.08%<br />
Cominar REIT 1.85%<br />
Cdn. Real Estate Investment 1.74%<br />
Vermilion Energy Inc. 1.69%<br />
Allied Properties REIT 1.54%<br />
BCE Inc. 1.53%<br />
Transurban Group 1.44%<br />
ARC Resources Ltd. 1.36%<br />
H&R Real Estate Invest. Trust 1.34%<br />
Total 17.57%<br />
Volatility Meter<br />
Low<br />
High<br />
Based on 3−year standard deviation relative to other funds<br />
in its category, from Globe HySales.<br />
Equity Style and Capitalization Overview<br />
Large<br />
Mid<br />
Small<br />
Blend Growth Value<br />
OBJECTIVE<br />
This fund’s objective is to generate a high level of income and long−term capital growth. It invests primarily in high−yielding equity<br />
securities and Canadian corporate bonds. Any change to the investment objective must be approved by a majority of votes cast at a<br />
meeting of unitholders held for that reason.<br />
Compound Returns and Quartile Rankings (as at June 30, 2011)<br />
This table shows the historical annual compound total return of the fund compared with the Globefund Group Average and Globefund’s<br />
benchmark Blend: 60% MS<strong>CI</strong> World, 40% Barclays Cap. The returns listed below are percentages. Performance of the fund versus its<br />
official benchmark can be found in the Management Report of Fund Performance (MRFP). See the related document section on this web<br />
page.<br />
Since<br />
YTD 1Mo 3Mo 1Yr 3Yr 5Yr 10Yr Inception*<br />
Qrtl 1 2 1 1 1 1 1 {N/A}<br />
Return 4.4 −1.41 0.14 18.24 6.14 5.01 10.06 9.96<br />
Grp Avg 1.31 −1.65 −0.85 12.84 2.76 2.84 3.52 {N/A}<br />
Ind Ret 1.27 −1.57 0.58 8.93 1.82 1.7 0.72 {N/A}<br />
*December 18, 1996<br />
Performance Data<br />
This chart shows you the fund´s annual performance and how an investment would have changed over time.<br />
50%<br />
0%<br />
−50%<br />
Asset Class<br />
Equity Sectors<br />
15.0<br />
8.3<br />
22.7<br />
19.9<br />
<strong>CI</strong> Signature High Income<br />
16.6<br />
−21.5<br />
2001 2002 2003 2004 2005 2006 2007 2008 2009 2010<br />
Cash and Equivalents 11.6%<br />
Canadian Bonds 9.1%<br />
Canadian Equity 26.0%<br />
Foreign Bonds 30.2%<br />
Foreign Equity 12.4%<br />
REITs 6.9%<br />
Incomeand Royalty Trusts 3.8%<br />
Cash 11.6%<br />
Consumer Discretionary 1.5%<br />
Telecommunication Services 7.1%<br />
Financials 16.8%<br />
Other 40.0%<br />
Energy 12.5%<br />
Utilities 4.5%<br />
Industrials 6.0%<br />
6.7<br />
0.1<br />
Current Value of a $10,000 Investment<br />
$30,000<br />
$20,000<br />
$10,000<br />
$0<br />
<strong>CI</strong> Signature High Income<br />
30.6<br />
15.3<br />
Dec02 Dec04 Dec06 Dec08 Dec10<br />
$25,717<br />
Geographic Composition<br />
Source: <strong>CI</strong> <strong>Investments</strong> and CTVglobemedia Publishing Inc.<br />
Australia 5.3%<br />
United Kingdom 1.2%<br />
France 1.9%<br />
United States 25.9%<br />
Canada 46.2%<br />
Other 16.6%<br />
Italy 1.4%<br />
Spain 1.6%<br />
68 SUMMER 2011 PERSPECTIVE AS AT JUNE 30, 2011
Fund Facts<br />
as at June 30, 2011<br />
Fund Codes Class A Corporate Class<br />
ISC <strong>CI</strong>G619 <strong>CI</strong>G2319<br />
DSC <strong>CI</strong>G819 <strong>CI</strong>G3319<br />
LSC <strong>CI</strong>G1619 <strong>CI</strong>G1319<br />
Signature Diversified Yield Fund (Class A)<br />
Also available: Class F & I<br />
Mutual Funds<br />
(Class A)<br />
Managed By: <strong>CI</strong> <strong>Investments</strong> Inc.<br />
Advisors: Signature Global Advisors<br />
Assets Under Management*: $773.9 million<br />
Portfolio Manager: Eric Bushell<br />
Asset Class: Diversified Income<br />
Inception Date: November 2009<br />
NAV: $10.34<br />
Min. Initial Investment: $500<br />
Subsequent Purchase(s): $50<br />
Min. PAC Investment: $50<br />
Management Expense Ratio: 2.34%<br />
ÿ<br />
Top Holdings as at June 30, 2011<br />
Brookfield Asset Management 3.63%<br />
Eli Lilly & Co. 2.59%<br />
Koninklijke Vopak NV 1.92%<br />
Westfield Group 1.83%<br />
Unibail−Rodamco 1.74%<br />
Capitacommercial Trust 1.66%<br />
Ascendas REIT 1.48%<br />
Macquarie Airports 1.47%<br />
BENI STABILI SPA 1.44%<br />
Lasalle Hotels Properties 1.41%<br />
Total 19.17%<br />
Volatility Meter<br />
Low<br />
High<br />
Based on 3−year standard deviation relative to other funds<br />
in its category, from Globe HySales.<br />
Equity Style and Capitalization Overview<br />
Large<br />
Mid<br />
Small<br />
Blend Growth Value<br />
OBJECTIVE<br />
This fund’s objective is to achieve tax−efficient returns through exposure to a portfolio of fixed income and high−yielding equity<br />
securities throughout the world. The fund will obtain this exposure primarily by entering into derivatives, but may hold fixed income and<br />
equity securities directly from time to time.<br />
Compound Returns and Quartile Rankings (as at June 30, 2011)<br />
This table shows the historical annual compound total return of the fund compared with the Globefund Group Average and Globefund’s<br />
benchmark S&P/TSX Total Return. The returns listed below are percentages. Performance of the fund versus its official benchmark can<br />
be found in the Management Report of Fund Performance (MRFP). See the related document section on this web page.<br />
Since<br />
YTD 1Mo 3Mo 1Yr 3Yr 5Yr 10Yr Inception*<br />
Qrtl 1 3 2 1 {N/A} {N/A} {N/A} {N/A}<br />
Return 2.51 −1.33 0.47 13.65 {N/A} {N/A} {N/A} 8.04<br />
Grp Avg 0.92 −0.82 −0.28 7.77 0.28 1.3 2.53 {N/A}<br />
Ind Ret 0.16 −3.33 −5.15 20.87 0.19 5.67 8.05 {N/A}<br />
*November 10, 2009<br />
Performance Data<br />
This chart shows you the fund´s annual performance and how an investment would have changed over time.<br />
20%<br />
10%<br />
0%<br />
Asset Class<br />
Equity Sectors<br />
<strong>CI</strong> Signature Diversified Yield<br />
2001 2002 2003 2004 2005 2006 2007 2008 2009 2010<br />
Canadian Equity 5.5%<br />
Canadian Bonds 7.2%<br />
Foreign Equity 33.0%<br />
Foreign Bonds 35.1%<br />
Cash and Equivalents 12.8%<br />
REITs 4.4%<br />
Other 2.0%<br />
Industrials 11.5%<br />
Energy 0.9%<br />
Telecommunication Services 5.3%<br />
Financials 20.9%<br />
Other 44.1%<br />
Cash 12.8%<br />
Utilities 2.0%<br />
Health Care 2.6%<br />
Current Value of a $10,000 Investment<br />
$12,000<br />
$10,000<br />
$8,000<br />
$6,000<br />
$4,000<br />
$2,000<br />
<strong>CI</strong> Signature Diversified Yield<br />
10.1<br />
$0<br />
Dec09 Mar10 Jun10 Sep10 Dec10 Mar11 Jun11<br />
$11,351<br />
Geographic Composition<br />
Source: <strong>CI</strong> <strong>Investments</strong> and CTVglobemedia Publishing Inc.<br />
Italy 2.9%<br />
Australia 9.1%<br />
France 4.5%<br />
Other 26.6%<br />
United States 34.6%<br />
Canada 15.2%<br />
Singapore 4.1%<br />
United Kingdom 3.0%<br />
SUMMER 2011 PERSPECTIVE AS AT JUNE 30, 2011 69
Fund Facts<br />
as at June 30, 2011<br />
Fund Codes Class A Corporate Class<br />
ISC <strong>CI</strong>G9010 <strong>CI</strong>G2308<br />
DSC <strong>CI</strong>G9060 <strong>CI</strong>G3308<br />
LSC <strong>CI</strong>G1150 <strong>CI</strong>G1308<br />
Signature Corporate Bond Fund (Class A)<br />
Also available: Class F & I<br />
Mutual Funds<br />
(Class A)<br />
Managed By: <strong>CI</strong> <strong>Investments</strong> Inc.<br />
Advisors: Signature Global Advisors<br />
Assets Under Management*: $239.7 million<br />
Portfolio Manager: Geof Marshall, John Shaw and<br />
James Dutkiewicz<br />
Asset Class: Canadian Fixed Income<br />
Inception Date: December 2001<br />
NAV: $9.84<br />
Min. Initial Investment: $500<br />
Subsequent Purchase(s): $50<br />
Min. PAC Investment: $50<br />
Management Expense Ratio: 2.10%<br />
ÿ<br />
Top Holdings as at June 30, 2011<br />
International Lease Finance, 8.75%, 1.01%<br />
March 15, 2017<br />
Harvest Operations Corp., 6.88%, 0.98%<br />
October 1, 2017<br />
Lincoln National Corp., 7.00%, May 0.92%<br />
17, 2066<br />
National Money Mart Company,<br />
0.80%<br />
10.38%, December 15, 2016<br />
Bank of America, 8.00%, January 30, 0.80%<br />
2049<br />
CB Richard Ellis Group, 11.63%, June 0.77%<br />
15, 2017<br />
Calpine Corp., 7.50%, February 15, 0.73%<br />
2021<br />
SunGard Data Systems, 10.25%, 0.73%<br />
August 15, 2015<br />
Digicel, 12.00%, April 1, 2014 0.71%<br />
Multiplan Inc, 9.88%, September 1, 0.69%<br />
2018<br />
Total 8.14%<br />
OBJECTIVE<br />
The fund’s investment objective is to achieve a yield advantage by using fundamental value analysis to evaluate investments. The fund<br />
will invest mainly in fixed−income securities that are investment grade and below investment grade. The fundamental investment<br />
objective of the fund can only be changed with the approval of a majority of the votes cast by unitholders at a meeting called specifically<br />
to vote on the change to the investment objectives.<br />
Compound Returns and Quartile Rankings (as at June 30, 2011)<br />
This table shows the historical annual compound total return of the fund compared with the Globefund Group Average and Globefund’s<br />
benchmark Globe High Yield Fixed Income Peer Index. The returns listed below are percentages. Performance of the fund versus its<br />
official benchmark can be found in the Management Report of Fund Performance (MRFP). See the related document section on this web<br />
page.<br />
Since<br />
YTD 1Mo 3Mo 1Yr 3Yr 5Yr 10Yr Inception*<br />
Qrtl 4 3 3 4 3 3 {N/A} {N/A}<br />
Return 2.49 −1.07 0.39 7.97 7.24 5.25 {N/A} 4.38<br />
Grp Avg 3.28 −0.88 0.74 10.48 8.1 6.09 5.46 {N/A}<br />
Ind Ret 3.05 −0.88 0.74 9.0 6.9 5.01 5.24 {N/A}<br />
*December 17, 2001<br />
Performance Data<br />
This chart shows you the fund´s annual performance and how an investment would have changed over time.<br />
20%<br />
0%<br />
−20%<br />
Bond Type<br />
Bond Term<br />
1.9<br />
4.6<br />
<strong>CI</strong> Signature Corporate Bond<br />
5.1<br />
3.7<br />
−0.8<br />
−7.4<br />
2001 2002 2003 2004 2005 2006 2007 2008 2009 2010<br />
Corporate Debentures 89.7%<br />
Municipal Bonds 0.3%<br />
Other 9.3%<br />
Federal Bonds 0.7%<br />
4.9<br />
Current Value of a $10,000 Investment<br />
$16,000<br />
$14,000<br />
$12,000<br />
$10,000<br />
$8,000<br />
$6,000<br />
19.9<br />
<strong>CI</strong> Signature Corporate Bond<br />
9.3<br />
$15,052<br />
Volatility Meter<br />
Low<br />
High<br />
Based on 3−year standard deviation relative to other funds<br />
in its category, from Globe HySales.<br />
5−10 years maturity 53.4%<br />
Other 9.3%<br />
10−20 years maturity 2.7%<br />
1−5 years maturity 23.1%<br />
More than 20 years maturity 11.4%<br />
$4,000<br />
$2,000<br />
$0<br />
Dec02 Dec04 Dec06 Dec08 Dec10<br />
Fixed Income and Capitalization Overview<br />
Spread Rate Blend<br />
Long<br />
Blend<br />
Short<br />
Source: <strong>CI</strong> <strong>Investments</strong> and CTVglobemedia Publishing Inc.<br />
Geographic Composition<br />
Luxembourg 1.6%<br />
Marshall Islands 1.2%<br />
United Kingdom 1.7%<br />
Canada 38.9%<br />
United States 40.8%<br />
Other 13.3%<br />
Bermuda 1.4%<br />
Cayman Islands 1.2%<br />
70 SUMMER 2011 PERSPECTIVE AS AT JUNE 30, 2011
Summary of capped funds<br />
MUTUAL/HEDGE FUNDS<br />
<strong>CI</strong> Short–Term Corporate Class is closed to new investors; existing investors may continue to<br />
make deposits.<br />
<strong>CI</strong> Global Opportunities Fund is closed to new investors and to new deposits.<br />
SEGREGATED FUNDS<br />
Legacy<br />
The Legacy Segregated Funds are closed to new investors and new deposits, with the<br />
exception of PACs established on or before September 30, 2010. Additional restrictions may<br />
apply.<br />
<strong>CI</strong> Segregated Funds<br />
The <strong>CI</strong> Segregated Funds are closed to new investors and new deposits.<br />
<strong>CI</strong> GIF<br />
The <strong>CI</strong> Guaranteed Investment Funds are closed to new investors and new deposits, with the<br />
exception of PACs established on or before September 30, 2010. Additional restrictions may<br />
apply.<br />
Clarica MVP<br />
The Clarica MVP Segregated Funds are closed to new investors; existing policyholders may<br />
continue to make deposits.<br />
Clarica Portfolio<br />
The Clarica Portfolio Segregated Funds are closed to new investors and new deposits, with<br />
the exception of PACs established on or before <strong>July</strong> 31, 2009. Additional restrictions may<br />
apply.<br />
FOR DEALER USE ONLY<br />
SunWise I<br />
The SunWise I Segregated Funds are closed to new investors and new deposits, with the<br />
exception of PACs established on or before August 28, 2009. Additional restrictions may<br />
apply.<br />
SunWise II<br />
The SunWise II Segregated Funds are closed to new investors. Existing investors with<br />
contracts issued up to February 26, 2003 may continue to make deposits; investors with<br />
contracts issued after February 26, 2003 may not make new deposits, with the exception of<br />
PACs established on or before <strong>July</strong> 31, 2009. Additional restrictions may apply.<br />
SunWise Elite<br />
The SunWise Elite Segregated Funds, including SunWise Elite Plus, are closed to new<br />
investors. No new deposits can be made into Class A and Class A (GWB) units, with the<br />
exception of PACs established on or before <strong>July</strong> 31, 2009. Existing investors in Class B,<br />
Class B (GWB), Class C and Class C (GWB) units may continue to make deposits subject to<br />
a $25,000 annual limit (effective November 1, 2010), with the exception of PACs established<br />
prior to November 1, 2010. Additional restrictions may apply.<br />
MONTHLY PERFORMANCE SCORECARD AS AT JUNE 30, 2011 71
<strong>CI</strong> Corporate Class<br />
LEAD MANAGER<br />
CDN $<br />
FUND CODE: <strong>CI</strong>G<br />
ISC / DSC / LSC<br />
US $<br />
FUND CODE: <strong>CI</strong>G<br />
ISC / DSC / LSC<br />
NAV<br />
(CDN)<br />
FUND<br />
ASSETS<br />
($MM)<br />
Y–T–D<br />
(%)<br />
1<br />
MTH<br />
(%)*<br />
6<br />
MTH<br />
(%)*<br />
1 YR<br />
(%)<br />
3 YR<br />
(%)<br />
5 YR<br />
(%)<br />
10 YR<br />
(%)<br />
SINCE<br />
INCEPTION<br />
(%)<br />
CAMBRIDGE AMERICAN EQUITY CORPORATE CLASS 1 A. RADLO / B. SNOW 294 / 794 / 1794 394 / 194 / 1194 $4.48 $229.6 -0.7 -2.8 -0.7 19.9 -1.1 -2.6 -2.8 -6.8 (FEB.’00)<br />
CAMBRIDGE CANADIAN ASSET ALLOCATION CORPORATE CLASS ALAN RADLO 2322 / 3322 / 1522 2517 / 3517 / 1217 $11.68 $485.0 5.2 -0.3 5.2 23.4 4.5 N/A N/A 4.8 (DEC.’07)<br />
CAMBRIDGE CANADIAN EQUITY CORPORATE CLASS ALAN RADLO 2321 / 3321 / 1521 2516 / 3516 / 1216 $10.96 $703.9 4.0 -1.4 4.0 23.4 1.2 N/A N/A 2.9 (DEC.’07)<br />
CAMBRIDGE GLOBAL EQUITY CORPORATE CLASS ALAN RADLO 2323 / 3323 / 1523 2518 / 3518 / 1218 $10.81 $618.6 0.3 -1.1 0.3 20.0 0.0 N/A N/A 2.4 (DEC.’07)<br />
<strong>CI</strong> AMERICAN MANAGERS CORPORATE CLASS MULTI-MANAGER †† 209 / 709 / 1709 309 / 409 / 1409 $10.64 $236.6 1.9 -2.4 1.9 17.2 0.3 -1.0 0.1 0.6 (JULY.’00)<br />
<strong>CI</strong> AMERICAN SMALL COMPANIES CORPORATE CLASS W. PRIEST / D. PEARL 297 / 797 / 1797 397 / 497 / 1497 $6.57 $238.6 2.2 -3.0 2.2 22.3 2.8 0.9 -1.5 -3.6 (FEB.’00)<br />
<strong>CI</strong> AMERICAN VALUE CORPORATE CLASS W. PRIEST / D. PEARL 510 / 511 / 1511 512 / 513 / 1513 $10.38 $366.9 3.3 -2.3 3.3 17.8 -1.0 0.5 N/A 0.4 (AUG.’01)<br />
<strong>CI</strong> CANADIAN INVESTMENT CORPORATE CLASS DANIEL BUBIS 2307 / 3307 / 1307 2507 / 3507 / 1507 $18.88 $833.3 1.2 -2.2 1.2 20.4 1.6 3.5 N/A 8.5 (JULY.’03)<br />
<strong>CI</strong> CAN-AM SMALL CAP CORPORATE CLASS L. PULLEN / J. JUGOVIC 6104 / 6154 / 1154 2512 / 3512 / 1517 $15.14 $116.4 2.6 -2.4 2.6 18.1 6.6 4.1 10.4 9.1 (DEC.’97)<br />
<strong>CI</strong> EMERGING MARKETS CORPORATE CLASS E. BUSHELL / M. STRAUSS 277 / 276 / 1276 377 / 476 / 1476 $14.99 $147.7 -7.3 -2.4 -7.3 12.5 -2.7 5.1 6.6 6.4 (SEPT.’92)<br />
<strong>CI</strong> EUROPEAN CORPORATE CLASS BUSHELL / D’ANGELO / BRODEUR 275 / 274 / 1274 375 / 474 / 1474 $7.69 $8.5 1.6 -4.6 1.6 17.8 -9.5 -4.1 -0.1 2.6 (SEPT.’92)<br />
<strong>CI</strong> GLOBAL BOND CORPORATE CLASS J. DUTKIEWICZ / J. SHAW 2302 / 3302 / 1302 2502 / 3502 / 1512 $10.77 $19.7 1.6 -0.3 1.6 1.5 5.0 4.7 N/A 0.8 (AUG.’02)<br />
<strong>CI</strong> GLOBAL CORPORATE CLASS E. BUSHELL / S. VALI 660 / 667 / 1667 360 / 467 / 1467 $12.72 $47.2 -1.3 -2.8 -1.3 16.7 -4.1 -3.9 -2.1 4.7 (JULY.’87)<br />
<strong>CI</strong> GLOBAL HEALTH S<strong>CI</strong>ENCES CORPORATE CLASS ANDREW WAIGHT 201 / 701 / 1701 301 / 401 / 1401 $23.02 $115.4 5.4 -4.0 5.4 19.8 6.7 1.2 2.3 6.4 (JULY.’96)<br />
<strong>CI</strong> GLOBAL HIGH DIVIDEND ADVANTAGE CORPORATE CLASS PRIEST / SAPPENFIELD / WELHOELTER 2311 / 3311 / 1311 2514 / 3514 / 1519 $8.80 $128.3 5.3 -1.8 5.3 19.5 1.5 N/A N/A -2.7 (FEB.’07)<br />
<strong>CI</strong> GLOBAL MANAGERS CORPORATE CLASS MULTI-MANAGER ††† 293 / 793 / 1793 393 / 493 / 1493 $9.05 $68.3 1.0 -2.4 1.0 15.0 2.8 1.4 -0.1 -0.8 (FEB.’00)<br />
<strong>CI</strong> GLOBAL S<strong>CI</strong>ENCE & TECHNOLOGY CORPORATE CLASS M. WHITE / J. YEUNG 203 / 703 / 1703 303 / 403 / 1403 $13.65 $ 93.3 2.4 -3.1 2.4 24.1 12.9 5.9 -1.6 3.3 (JULY.’96)<br />
<strong>CI</strong> GLOBAL SMALL COMPANIES CORPORATE CLASS W. PRIEST / D. PEARL / E. BAKER 298 / 798 / 1798 398 / 198 / 1198 $8.44 $ 12.3 -0.4 -3.4 -0.4 25.2 3.2 2.7 1.4 -1.4 (FEB.’00)<br />
<strong>CI</strong> GLOBAL VALUE CORPORATE CLASS JOHN HOCK 206 / 706 / 1706 306 / 406 / 1406 $11.54 $ 41.7 0.4 -2.5 0.4 14.8 0.8 -2.2 -0.2 1.0 (JULY.’96)<br />
<strong>CI</strong> INTERNATIONAL BALANCED CORPORATE CLASS E. BUSHELL / J. DUTKIEWICZ 093 / 94 / 1195 095 / 96 / 1196 $9.57 $ 113.3 0.6 -1.7 0.6 13.2 0.7 0.3 N/A -0.4 (AUG.’01)<br />
<strong>CI</strong> INTERNATIONAL CORPORATE CLASS BUSHELL / D’ANGELO / BRODEUR 144 / 145 / 1145 146 / 147 / 1147 $8.53 $ 323.7 -1.2 -3.1 -1.2 15.2 -6.8 -4.9 N/A -1.6 (AUG.’01)<br />
<strong>CI</strong> INTERNATIONAL VALUE CORPORATE CLASS JOHN HOCK 205 / 705 / 1705 305 / 405 / 1405 $11.25 $ 386.3 0.8 -1.7 0.8 15.8 0.8 -1.8 0.8 0.8 (JULY.’96)<br />
<strong>CI</strong> JAPANESE CORPORATE CLASS W. PRIEST / E. BAKER 250 / 750 / 1750 350 / 450 / 1450 $7.74 $ 7.2 -9.2 1.0 -9.2 -0.1 -6.8 -7.6 -4.3 -1.8 (DEC.’98)<br />
<strong>CI</strong> PA<strong>CI</strong>FIC CORPORATE CLASS W. PRIEST / E. BAKER 657 / 664 / 1664 357 / 464 / 1464 $7.73 $ 8.8 -4.7 -0.1 -4.7 10.6 -2.8 -0.9 -0.3 2.1 (JULY.’87)<br />
<strong>CI</strong> SHORT-TERM ADVANTAGE CORPORATE CLASS PAUL SIMON 2313 / 3313 / 1313 – $10.16 $ 139.8 0.2 0.0 0.2 0.3 0.5 N/A N/A 0.5 (MAY.’08)<br />
<strong>CI</strong> SHORT-TERM CORPORATE CLASS PAUL SIMON 661 / 668 / 1668 361 / 468 /– $10.37 $ 124.2 0.4 0.0 0.4 0.7 0.9 1.7 1.8 3.1 (JULY.’87)<br />
<strong>CI</strong> SHORT-TERM US$ CORPORATE CLASS PAUL SIMON – 101 / 501 / 1509 $11.34 $ 13.6 0.1 0.0 0.1 -0.1 0.1 1.4 N/A 1.3 (AUG.’01)<br />
<strong>CI</strong> VALUE TRUST CORPORATE CLASS A. RADLO / B. SNOW 2301 / 3301 / 1301 2501 / 3501 / 1501 $6.32 $ 171.9 -1.9 -2.2 -1.9 10.4 -4.7 -10.5 N/A -4.7 (DEC.’01)<br />
HARBOUR CORPORATE CLASS G. COLEMAN / S. JENKINS 290 / 790 / 1790 390 / 490 / 1490 $25.83 $ 1118.9 0.9 -1.6 0.9 17.6 0.9 4.0 7.5 7.3 (JUNE.’97)<br />
HARBOUR FOREIGN EQUITY CORPORATE CLASS S. JENKINS / G. COLEMAN 2300 / 3300 / 1300 2500 / 3500 / 1500 $11.18 $ 567.9 2.2 -1.7 2.2 18.9 -1.4 0.0 N/A 1.2 (DEC.’01)<br />
HARBOUR FOREIGN GROWTH & INCOME CORPORATE CLASS S. JENKINS / G. COLEMAN 2306 / 3306 / 1306 2506 / 3506 / 1506 $12.50 $ 179.6 0.4 -2.1 0.4 13.5 0.3 0.9 N/A 2.7 (DEC.’02)<br />
HARBOUR GROWTH & INCOME CORPORATE CLASS G. COLEMAN / S. JENKINS 2310 / 3310 / 1310 2513 / 3513 / 1518 $11.34 $ 554.4 -0.1 -1.3 -0.1 13.9 0.8 N/A N/A 2.9 (AUG.’06)<br />
SIGNATURE CANADIAN BOND CORPORATE CLASS JAMES DUTKIEWICZ 2303 / 3303 / 1303 2503 / 3503 / 1503 $13.98 $ 427.0 1.8 -0.1 1.8 3.2 4.8 4.5 N/A 3.9 (AUG.’02)<br />
SIGNATURE CANADIAN RESOURCE CORPORATE CLASS SCOTT VALI 013 / 344 / 1344 345 / 348 / 1348 $44.60 $ 186.0 -2.0 -2.9 -2.0 26.0 -2.5 9.1 N/A 16.4 (AUG.’01)<br />
SIGNATURE CORPORATE BOND CORPORATE CLASS DUTKIEWICZ / SHAW / MARSHALL 2308 / 3308 / 1308 2508 / 3508 / 1508 $14.10 $ 410.1 2.6 -1.1 2.6 7.9 6.5 4.7 N/A 4.5 (JULY.’03)<br />
SIGNATURE DIVERSIFIED YIELD CORPORATE CLASS ERIC BUSHELL 2319 / 3319 / 1319 2519 / 3519 / 1419 $11.38 $ 538.8 2.7 -1.4 2.7 13.9 N/A N/A N/A 8.6 (NOV.’09)<br />
SIGNATURE DIVIDEND CORPORATE CLASS ERIC BUSHELL 2305 / 3305 / 1305 2505 / 3505 / 1505 $15.92 $ 291.3 3.6 -1.8 3.6 15.4 6.5 3.6 N/A 5.9 (AUG.’02)<br />
SIGNATURE GLOBAL ENERGY CORPORATE CLASS SCOTT VALI 281 / 781 / 1781 381 / 481 / 1481 $49.55 $ 182.0 -0.1 -3.8 -0.1 24.9 -4.3 4.4 12.4 13.4 (JUNE.’98)<br />
SIGNATURE GLOBAL INCOME & GROWTH CORPORATE CLASS ERIC BUSHELL 2312 / 3312 / 1312 2515 / 3515 / 1520 $9.56 $ 89.8 -0.8 -2.6 -0.8 12.4 2.9 N/A N/A -0.9 (FEB.’07)<br />
*simple rates of return<br />
1<br />
formerly <strong>CI</strong> American Equity Corporate Class<br />
††<br />
A. Lam, J. Hock, W. Priest, D. Pearl, D. Picton, A. Radlo and B. Snow<br />
†††<br />
A. Lam, E. Bushell, S. Vali, J. Hock, N. Narayanan and W. Priest<br />
FOR DEALER USE ONLY<br />
MONTHLY PERFORMANCE SCORECARD AS AT JUNE 30, 2011 72
<strong>CI</strong> Corporate Class cont’d<br />
LEAD MANAGER<br />
CDN $<br />
FUND CODE: <strong>CI</strong>G<br />
ISC / DSC / LSC<br />
US $<br />
FUND CODE: <strong>CI</strong>G<br />
ISC / DSC / LSC<br />
NAV<br />
(CDN)<br />
FUND<br />
ASSETS<br />
($MM)<br />
Y–T–D<br />
(%)<br />
1<br />
MTH<br />
(%)*<br />
6<br />
MTH<br />
(%)*<br />
1 YR<br />
(%)<br />
3 YR<br />
(%)<br />
5 YR<br />
(%)<br />
10 YR<br />
(%)<br />
SINCE<br />
INCEPTION<br />
(%)<br />
SIGNATURE GOLD CORPORATE CLASS SCOTT VALI 2378 / 3378 / 1378 2379 / 3379 / 1379 $9.74 $ 17.7 -2.4 -3.2 -2.4 N/A N/A N/A N/A -2.6 (DEC.’10)<br />
SIGNATURE HIGH INCOME CORPORATE CLASS ERIC BUSHELL 2304 / 3304 / 1304 2504 / 3504 / 1504 $21.66 $ 973.8 4.1 -1.4 4.1 17.9 5.8 4.8 N/A 9.2 (AUG.’02)<br />
SIGNATURE INCOME & GROWTH CORPORATE CLASS E. BUSHELL / J. DUTKIEWICZ 2309 / 3309 / 1309 2509 / 3509 / 1514 $14.43 $ 641.0 1.5 -1.8 1.5 15.3 4.0 4.5 N/A 6.2 (MAR.’05)<br />
SIGNATURE SELECT CANADIAN CORPORATE CLASS ERIC BUSHELL 150 / 151 / 1151 164 / 17 / 1117 $20.81 $ 935.4 0.9 -2.2 0.9 18.7 2.2 4.8 N/A 7.8 (AUG.’01)<br />
SIGNATURE SELECT GLOBAL CORPORATE CLASS ERIC BUSHELL 2388 / 3388 / 1388 2389 / 3389 / 1389 $10.70 $ 20.6 -1.4 -2.7 -1.4 N/A N/A N/A N/A 7.0 (JULY.’10)<br />
SYNERGY AMERICAN CORPORATE CLASS DAVID PICTON 279 / 278 / 1278 379 / 478 / 1478 $10.04 $ 227.8 2.7 -2.4 2.7 19.2 -3.3 -1.9 -2.1 4.8 (SEPT.’92)<br />
SYNERGY CANADIAN CORPORATE CLASS DAVID PICTON 6103 / 6153 / 1153 2510 / 3510 / 1515 $14.60 $ 1342.8 0.6 -2.3 0.6 20.2 -1.4 2.6 6.8 9.3 (DEC.’97)<br />
SYNERGY GLOBAL CORPORATE CLASS MICHAEL MAHONEY 6109 / 6159 / 1159 6209 / 6259 / 1259 $4.37 $ 237.7 2.1 -2.0 2.1 20.3 -3.6 -1.9 0.9 -1.1 (MAR.’99)<br />
Signature Funds <br />
SIGNATURE CANADIAN BALANCED ERIC BUSHELL 685 / 785 / 1785 – $15.66 $2003.4 1.1 -1.6 1.1 14.3 4.1 5.3 6.2 8.0 (JUNE.’97)<br />
SIGNATURE CANADIAN BOND JAMES DUTKIEWICZ 837 / 847 / 1847 – $5.67 $2094.8 1.7 -0.2 1.7 3.3 4.7 4.5 4.7 5.9 (JAN.’93)<br />
SIGNATURE CANADIAN RESOURCE SCOTT VALI 611 / 811 / 1811 – $22.61 $764.5 -2.0 -2.9 -2.0 25.8 -2.7 8.8 16.5 11.7 (APR.’97)<br />
SIGNATURE CORPORATE BOND DUTKIEWICZ / SHAW / MARSHALL 9010 / 9060 / 1150 – $9.84 $1041.6 2.5 -1.1 2.5 8.0 7.2 5.3 N/A 4.4 (JAN.’02)<br />
SIGNATURE DIVERSIFIED YIELD ERIC BUSHELL 619 / 819 / 1619 620 / 820 / 1620 $10.34 $990.6 2.5 -1.3 2.5 13.7 N/A N/A N/A 8.1 (NOV.’09)<br />
SIGNATURE DIVIDEND ERIC BUSHELL 610 / 810 / 1810 – $12.48 $1550.9 3.7 -1.8 3.7 15.8 6.5 3.5 5.4 6.6 (OCT.’96)<br />
SIGNATURE GLOBAL INCOME & GROWTH ERIC BUSHELL 2111 / 3111 / 1111 2402 / 3402 / 1402 $7.42 $200.0 -0.7 -2.6 -0.7 12.5 3.1 N/A N/A -0.7 (FEB.’07)<br />
SIGNATURE HIGH INCOME ERIC BUSHELL 686 / 786 / 1786 – $13.89 $4713.8 4.4 -1.4 4.4 18.2 6.1 5.0 10.1 10.0 (DEC.’96)<br />
SIGNATURE INCOME & GROWTH E. BUSHELL / J. DUTKIEWICZ 6116 / 6166 / 1166 – $4.78 $3897.7 1.6 -1.7 1.6 15.4 3.8 4.6 7.2 7.1 (NOV.’00)<br />
SIGNATURE MORTGAGE JAMES DUTKIEWICZ 9002 / 9352 / 1342 – $10.34 $48.0 1.1 0.3 1.1 1.5 2.7 2.8 2.8 4.0 (JUNE.’93)<br />
SIGNATURE SELECT CANADIAN ERIC BUSHELL 677 / 777 / 1777 – $19.14 $3474.3 0.9 -2.2 0.9 18.9 1.9 4.6 7.8 10.4 (MAY.’98)<br />
SIGNATURE SELECT GLOBAL ERIC BUSHELL 588 / 888 / 1688 589 / 889 / 1689 $10.97 $42.3 -1.3 -2.7 -1.3 N/A N/A N/A N/A 9.7 (JULY.’10)<br />
SIGNATURE SHORT-TERM BOND J. DUTKIEWICZ / P. SIMON 7220 / 7225 / 1225 – $5.35 $124.5 1.1 -0.1 1.1 1.3 2.4 2.9 3.1 7.0 (MAY.’76)<br />
Harbour Funds®<br />
HARBOUR G. COLEMAN / S. JENKINS 690 / 890 / 1890 – $21.54 $6215.8 0.7 -1.7 0.7 17.8 0.9 4.1 7.7 7.9 (JUNE.’97)<br />
HARBOUR GROWTH & INCOME G. COLEMAN / S. JENKINS 691 / 891 / 1891 – $18.68 $8855.1 -0.2 -1.4 -0.2 13.9 0.7 3.0 6.2 5.8 (JUNE.’97)<br />
*simple rates of return<br />
FOR DEALER USE ONLY<br />
MONTHLY PERFORMANCE SCORECARD AS AT JUNE 30, 2011 73
Synergy Funds<br />
CDN $<br />
FUND CODE: <strong>CI</strong>G<br />
ISC / DSC / LSC<br />
US $<br />
FUND CODE: <strong>CI</strong>G<br />
ISC / DSC / LSC<br />
LEAD MANAGER<br />
SYNERGY AMERICAN DAVID PICTON 622 / 621 / 1621 545 / 548 / 1548 $11.23 $99.7 2.6 -2.4 2.6 19.3 -3.2 -1.8 -2.1 5.9 (SEPT.’92)<br />
SYNERGY TACTICAL ASSET ALLOCATION DAVID PICTON 6115 / 6165 / 1165 – $7.87 $158.1 0.8 -2.0 0.8 14.3 2.1 3.0 5.3 6.0 (SEPT.’98)<br />
NAV<br />
(CDN)<br />
FUND<br />
ASSETS<br />
($MM)<br />
Y–T–D<br />
(%)<br />
1<br />
MTH<br />
(%)*<br />
6<br />
MTH<br />
(%)*<br />
1 YR<br />
(%)<br />
3 YR<br />
(%)<br />
5 YR<br />
(%)<br />
10 YR<br />
(%)<br />
SINCE<br />
INCEPTION<br />
(%)<br />
<strong>CI</strong> Funds®<br />
CAMBRIDGE AMERICAN EQUITY 1 A. RADLO / B. SNOW 212 / 812 / 1812 312 / 612 / 1612 $6.62 $64.8 -0.9 -2.9 -0.9 19.9 -1.8 -3.0 -3.0 6.0 (MAY.’89)<br />
<strong>CI</strong> ALPINE GROWTH EQUITY TED WHITEHEAD 9022 / 9372 / 1372 – $23.71 $70.1 -6.0 -5.1 -6.0 20.2 2.9 4.9 8.3 6.2 (JUNE.’97)<br />
<strong>CI</strong> AMERICAN SMALL COMPANIES W. PRIEST / D. PEARL 213 / 813 / 1813 313 / 613 / 1613 $26.90 $111.0 2.2 -3.1 2.2 22.4 2.7 0.7 -1.4 7.9 (APR.’91)<br />
<strong>CI</strong> AMERICAN VALUE W. PRIEST / D. PEARL 7500 / 7505 / 1510 – $15.95 $434.5 3.0 -2.4 3.0 17.5 -1.3 0.4 -0.9 8.2 (MAY.’57)<br />
<strong>CI</strong> CANADIAN INVESTMENT DANIEL BUBIS 7420 / 7425 / 1425 – $25.58 $3998.8 1.1 -2.3 1.1 20.6 1.3 3.5 7.9 8.6 (NOV.’32)<br />
<strong>CI</strong> CANADIAN SMALL/MID CAP J. LAWSON / D. PICTON 9023 / 9373 / 1850 – $25.70 $546.6 -1.6 -3.3 -1.6 24.7 3.2 3.3 6.6 7.4 (NOV.’92)<br />
<strong>CI</strong> EMERGING MARKETS E. BUSHELL / M. STRAUSS 662 / 646 / 1646 546 / 549 / 1549 $15.95 $177.9 -7.4 -2.6 -7.4 12.2 -2.9 5.1 6.5 7.1 (SEPT.’91)<br />
<strong>CI</strong> EUROPEAN BUSHELL / D’ANGELO / BRODEUR 669 / 647 / 1647 114 / 840 / 1840 $6.61 $50.4 1.7 -4.6 1.7 17.9 -9.6 -3.9 0.0 2.7 (SEPT.’91)<br />
<strong>CI</strong> GLOBAL E. BUSHELL / S. VALI 654 / 644 / 1644 113 / 543 / 1543 $10.49 $346.1 -0.9 -2.2 -0.9 17.1 -4.0 -3.8 -2.1 4.9 (FEB.’86)<br />
<strong>CI</strong> GLOBAL BOND J. DUTKIEWICZ / J. SHAW 624 / 623 / 1623 110 / 540 / 1540 $3.69 $625.0 1.7 -0.4 1.7 1.4 5.5 5.2 2.4 3.9 (SEPT.’92)<br />
<strong>CI</strong> GLOBAL HIGH DIVIDEND ADVANTAGE PRIEST / SAPPENFIELD / WELHOELTER 2810 / 3810 / 1610 2811 / 3811 / 1611 $6.66 $277.8 5.8 -1.8 5.8 21.0 1.1 1.1 N/A 0.1 (JAN.’06)<br />
<strong>CI</strong> GLOBAL SMALL COMPANIES W. PRIEST / E. BAKER / D. PEARL 215 / 815 / 1815 315 / 615 / 1615 $24.30 $215.9 -0.5 -3.6 -0.5 24.9 2.6 2.4 1.8 8.4 (APR.’93)<br />
<strong>CI</strong> GLOBAL VALUE JOHN HOCK 680 / 880 / 1880 180 / 580 / 1580 $10.76 $76.3 0.5 -2.4 0.5 14.8 0.9 -2.2 -0.4 1.0 (JUNE.’96)<br />
<strong>CI</strong> INCOME ADVANTAGE FUND <strong>CI</strong> INVESTMENT CONSULTING 2339 / 3339 / 1339 – $9.74 $1103.0 1.8 -0.8 1.8 N/A N/A N/A N/A 0.2 (OCT.’10)<br />
<strong>CI</strong> INTERNATIONAL BUSHELL / D’ANGELO / BRODEUR 864 / 874 / 1874 564 / 174 / 1174 $13.31 $50.5 -0.7 -2.6 -0.7 15.7 -6.8 -4.8 -1.5 4.1 (AUG.’99)<br />
<strong>CI</strong> INTERNATIONAL BALANCED E. BUSHELL / J. DUTKIEWICZ 630 / 830 / 1830 130 / 530 / 1530 $16.20 $108.7 -0.6 -1.5 -0.6 11.9 0.2 0.3 -0.2 3.9 (SEPT.’94)<br />
<strong>CI</strong> INTERNATIONAL VALUE JOHN HOCK 681 / 881 / 1881 181 / 581 / 1581 $10.37 $113.6 1.0 -1.6 1.0 16.2 0.6 -1.8 0.9 0.9 (JUNE.’96)<br />
<strong>CI</strong> MONEY MARKET PAUL SIMON 649 / 648 / 1648 – $10.00 $1029.1 0.4 0.1 0.4 0.7 0.6 1.7 1.7 3.6 (OCT.’90)<br />
<strong>CI</strong> PA<strong>CI</strong>FIC W. PRIEST / E. BAKER 651 / 641 / 1641 544 / 547 / 1547 $12.64 $56.4 -4.4 0.2 -4.4 11.1 -2.5 -0.5 -0.2 6.3 (OCT.’81)<br />
<strong>CI</strong> US MONEY MARKET (a) PAUL SIMON – 125 / 525 / 1525 $10.00 $40.8 0.0 0.0 0.0 0.0 0.2 1.6 1.4 2.8 (FEB.’95)<br />
Portfolio Series <br />
PORTFOLIO SERIES BALANCED <strong>CI</strong> INVESTMENT CONSULTING 7710 / 7715 / 1715 – $23.11 $1520.5 1.5 -1.7 1.5 14.0 2.1 2.4 4.3 6.9 (NOV.’88)<br />
PORTFOLIO SERIES BALANCED GROWTH <strong>CI</strong> INVESTMENT CONSULTING 2601 / 3601 / 1601 2701 / 3701 / 1708 $12.56 $830.5 1.1 -1.8 1.1 15.1 1.6 2.0 N/A 3.5 (DEC.’01)<br />
PORTFOLIO SERIES CONSERVATIVE <strong>CI</strong> INVESTMENT CONSULTING 7770 / 7775 / 1775 – $13.45 $446.1 2.0 -1.3 2.0 12.2 3.4 3.3 4.9 4.9 (DEC.’97)<br />
PORTFOLIO SERIES CONSERVATIVE BALANCED <strong>CI</strong> INVESTMENT CONSULTING 2600 / 3600 / 1600 2700 / 3700 / 1707 $12.70 $437.1 1.7 -1.6 1.7 12.7 2.7 2.8 N/A 4.2 (DEC.’01)<br />
PORTFOLIO SERIES GROWTH <strong>CI</strong> INVESTMENT CONSULTING 2602 / 3602 / 1602 2702 / 3702 / 1702 $12.05 $345.2 0.9 -2.0 0.9 16.1 0.5 1.4 N/A 2.9 (DEC.’01)<br />
PORTFOLIO SERIES INCOME <strong>CI</strong> INVESTMENT CONSULTING 7740 / 7745 / 1745 – $11.11 $473.8 2.9 -1.1 2.9 10.9 5.6 4.7 5.4 5.1 (DEC.’97)<br />
PORTFOLIO SERIES MAXIMUM GROWTH <strong>CI</strong> INVESTMENT CONSULTING 2603 / 3603 / 1603 2703 / 3703 / 1704 $11.53 $149.1 0.5 -2.3 0.5 18.4 -0.9 0.6 N/A 2.1 (DEC.’01)<br />
1<br />
*simple rates of return formerly <strong>CI</strong> American Equity<br />
(a)may not be held in a <strong>CI</strong> Registered Plan<br />
FOR DEALER USE ONLY<br />
MONTHLY PERFORMANCE SCORECARD AS AT JUNE 30, 2011 74
Portfolio Select Series <br />
LEAD MANAGER<br />
CDN $<br />
FUND CODE: <strong>CI</strong>G<br />
ISC / DSC / LSC<br />
US $<br />
FUND CODE: <strong>CI</strong>G<br />
ISC / DSC / LSC<br />
NAV<br />
(CDN)<br />
FUND<br />
ASSETS<br />
($MM)<br />
Y–T–D<br />
(%)<br />
1<br />
MTH<br />
(%)*<br />
6<br />
MTH<br />
(%)*<br />
1 YR<br />
(%)<br />
3 YR<br />
(%)<br />
5 YR<br />
(%)<br />
10 YR<br />
(%)<br />
SINCE<br />
INCEPTION<br />
(%)<br />
SELECT INCOME ADVANTAGE MANAGED CORPORATE CLASS SIGNATURE 2265 / 3265 / 1465 – $10.17 $416.8 1.6 -0.8 1.6 N/A N/A N/A N/A 1.7 (SEPT.’10)<br />
SELECT CANADIAN EQUITY MANAGED CORPORATE CLASS MULTI-MANAGER † 2216 / 3216 / 1416 – $12.40 $217.9 1.7 -2.1 1.7 19.8 0.4 3.5 N/A 4.4 (JAN.’06)<br />
SELECT US. EQUITY MANAGED CORPORATE CLASS MULTI-MANAGER †† 2217 / 3217 / 1417 – $9.23 $183.9 1.8 -2.4 1.8 21.2 -2.8 -1.6 N/A -1.4 (JAN.’06)<br />
SELECT INTERNATIONAL EQUITY MANAGED CORPORATE CLASS MULTI-MANAGER ††† 2218 / 3218 / 1418 – $9.41 $160.6 0.9 -1.5 0.9 17.7 -1.9 -1.7 N/A -1.0 (JAN.’06)<br />
SELECT STAGING FUND <strong>CI</strong> INVESTMENTS 2230 / 3230 / 1430 – $10.00 $0.1 0.0 0.0 0.0 0.0 0.0 0.0 N/A 0.0 (JAN.’06)<br />
SELECT 100E MANAGED PORTFOLIO CORPORATE CLASS <strong>CI</strong> INVESTMENT CONSULTING 2248 / 3248 / 1328 – $9.28 $11.4 1.5 -2.0 1.5 18.8 -0.7 N/A N/A -1.4 (NOV.’06)<br />
SELECT 20I80E MANAGED PORTFOLIO CORPORATE CLASS <strong>CI</strong> INVESTMENT CONSULTING 2247 / 3247 / 1327 – $9.81 $30.4 1.6 -1.7 1.6 16.0 0.6 N/A N/A -0.3 (NOV.’06)<br />
SELECT 30I70E MANAGED PORTFOLIO CORPORATE CLASS <strong>CI</strong> INVESTMENT CONSULTING 2246 / 3246 / 1326 – $10.01 $74.1 1.5 -1.6 1.5 14.5 1.1 N/A N/A 0.2 (NOV.’06)<br />
SELECT 40I60E MANAGED PORTFOLIO CORPORATE CLASS <strong>CI</strong> INVESTMENT CONSULTING 2245 / 3245 / 1325 – $10.26 $124.9 1.6 -1.5 1.6 13.0 1.6 N/A N/A 0.7 (NOV.’06)<br />
SELECT 50I50E MANAGED PORTFOLIO CORPORATE CLASS <strong>CI</strong> INVESTMENT CONSULTING 2244 / 3244 / 1324 – $10.50 $79.3 1.5 -1.4 1.5 11.6 2.1 N/A N/A 1.2 (NOV.’06)<br />
SELECT 60I40E MANAGED PORTFOLIO CORPORATE CLASS <strong>CI</strong> INVESTMENT CONSULTING 2243 / 3243 / 1323 – $10.72 $44.6 1.5 -1.4 1.5 10.0 2.6 N/A N/A 1.6 (NOV.’06)<br />
SELECT 70I30E MANAGED PORTFOLIO CORPORATE CLASS <strong>CI</strong> INVESTMENT CONSULTING 2242 / 3242 / 1322 – $10.99 $52.3 1.7 -1.2 1.7 8.8 3.1 N/A N/A 2.2 (NOV.’06)<br />
SELECT 80I20E MANAGED PORTFOLIO CORPORATE CLASS <strong>CI</strong> INVESTMENT CONSULTING 2241 / 3241 / 1321 – $11.22 $65.2 1.5 -1.1 1.5 7.2 3.5 N/A N/A 2.6 (NOV.’06)<br />
Insight® Units/Shares<br />
<strong>CI</strong> AMERICAN VALUE INSIGHT UNITS W. PRIEST / D. PEARL 5904 /– /– – $12.63 $2.7 3.4 -2.3 3.4 18.6 -0.3 1.3 N/A 3.5 (JULY.’03)<br />
<strong>CI</strong> CANADIAN INVESTMENT INSIGHT UNITS DANIEL BUBIS 5900 /– /– – $16.83 $3.8 1.7 -2.2 1.7 21.9 2.4 4.6 N/A 9.6 (JULY.’03)<br />
<strong>CI</strong> GLOBAL BOND INSIGHT UNITS J. DUTKIEWICZ / J. SHAW 5913 /– /– – $8.14 $2.2 2.1 -0.1 2.1 2.4 6.3 5.9 N/A 2.4 (JULY.’03)<br />
<strong>CI</strong> GLOBAL INSIGHT UNITS E. BUSHELL / S. VALI 5908 /– /– – $11.05 $2.1 -0.5 -2.2 -0.5 18.2 -3.2 -2.9 N/A 1.3 (JULY.’03)<br />
<strong>CI</strong> GLOBAL SMALL COMPANIES INSIGHT UNITS W. PRIEST / D. PEARL / E. BAKER 5910 /– /– – $16.34 $1.4 0.1 -3.5 0.1 26.2 3.7 3.5 N/A 6.4 (JULY.’03)<br />
<strong>CI</strong> INTERNATIONAL INSIGHT UNITS BUSHELL / D’ANGELO / BRODEUR 5907 /– /– – $10.19 $1.1 -0.3 -2.6 -0.3 16.8 -6.0 -3.9 N/A 1.9 (JULY.’03)<br />
<strong>CI</strong> INTERNATIONAL VALUE INSIGHT UNITS JOHN HOCK 5906 /– /– – $11.59 $1.1 1.4 -1.5 1.4 17.2 1.5 -0.9 N/A 3.7 (JULY.’03)<br />
<strong>CI</strong> MONEY MARKET INSIGHT UNITS PAUL SIMON 5914 /– /– – $10.00 $1.3 0.4 0.0 0.4 0.6 0.6 1.7 N/A 1.8 (JULY.’03)<br />
<strong>CI</strong> VALUE TRUST CORP. CLASS INSIGHT SHARES A. RADLO / B. SNOW 5915 /– /– – $5.82 $2.0 -1.2 -2.0 -1.2 12.0 -3.5 -9.4 N/A -7.3 (JULY.’03)<br />
SIGNATURE CANADIAN BOND INSIGHT UNITS JAMES DUTKIEWICZ 5912 /– /– – $10.33 $5.5 2.0 -0.2 2.0 3.8 5.3 5.0 N/A 4.6 (JULY.’03)<br />
SIGNATURE CORPORATE BOND INSIGHT UNITS DUTKIEWICZ / SHAW / MARSHALL 5911 /– /– – $10.33 $4.0 3.0 -1.0 3.0 9.0 8.3 6.3 N/A 6.1 (JULY.’03)<br />
SIGNATURE SELECT CANADIAN INSIGHT UNITS ERIC BUSHELL 5902 /– /– – $13.84 $2.2 1.5 -2.1 1.5 20.2 3.0 5.8 N/A 10.6 (JULY.’03)<br />
SYNERGY CANADIAN CORP. CLASS INSIGHT SHARES DAVID PICTON 5916 /– /– – $16.63 $3.6 1.2 -2.2 1.2 21.6 -0.3 3.7 N/A 8.6 (JULY.’03)<br />
Hedge Funds<br />
<strong>CI</strong> GLOBAL OPPORTUNITIES NANDU NARAYANAN 218 / 818 /– 318 / 618 /– $22.47 $16.5 -2.9 -0.7 -2.9 -6.5 3.2 19.8 9.0 17.9 (MAR.’95)<br />
TRIDENT GLOBAL OPPORTUNITIES NANDU NARAYANAN 261 / 761 /– 177 / 577 /– $226.16 $115.9 -3.1 -0.7 -3.1 -6.9 1.4 18.1 10.3 10.6 (FEB.’01)<br />
††<br />
*simple rates of return<br />
†<br />
Cambridge Advisors, Harbour Advisors, Tetrem Capital Partners, and QV Investors Inc.<br />
Epoch Investment Partners, Picton Mahoney Asset Management, Tetrem Capital Management<br />
†††<br />
Altrinsic Global Advisors, Picton Mahoney Asset Management and Signature Global Advisors<br />
FOR DEALER USE ONLY<br />
MONTHLY PERFORMANCE SCORECARD AS AT JUNE 30, 2011 75
Labour–sponsored Funds<br />
LEAD MANAGER<br />
CDN $<br />
FUND CODE: <strong>CI</strong>G<br />
ISC / DSC / LSC<br />
NAV<br />
(CDN)<br />
FUND<br />
ASSETS<br />
($MM)<br />
Y–T–D<br />
(%)<br />
1<br />
MTH<br />
(%)*<br />
6<br />
MTH<br />
(%)*<br />
1 YR<br />
(%)<br />
3 YR<br />
(%)<br />
5 YR<br />
(%)<br />
10 YR<br />
(%)<br />
SINCE<br />
INCEPTION<br />
(%)<br />
COVINGTON FUND II INC. COVINGTON CAPITAL -- / 912 /– $8.39 $44.4 -5.3 -2.0 -5.3 -9.2 5.1 0.7 -1.8 -1.5 (DEC.’99)<br />
COVINGTON STRATEGIC CAPITAL SERIES I COVINGTON CAPITAL -- / 916 /– $11.40 $10.4 -7.3 -1.4 -7.3 -11.8 -14.2 -1.2 N/A -0.7 (JAN.’04)<br />
COVINGTON STRATEGIC CAPITAL SERIES II COVINGTON CAPITAL -- / 917 /– $11.66 $4.4 -6.9 -1.3 -6.9 -11.1 -13.7 -0.9 N/A -0.4 (JAN.’04)<br />
COVINGTON VENTURE FUND SERIES I COVINGTON CAPITAL -- / 987 /– $9.84 $30.5 -9.6 -0.9 -9.6 10.2 -3.0 N/A N/A 0.9 (DEC.’05)<br />
COVINGTON VENTURE FUND SERIES II COVINGTON CAPITAL -- / 988 /– $9.21 $0.6 -10.6 -1.2 -10.6 7.7 -5.2 N/A N/A -0.6 (DEC.’05)<br />
COVINGTON VENTURE FUND SERIES III COVINGTON CAPITAL -- / 989 /– $9.56 $1.5 -10.2 -1.1 -10.2 8.5 -4.6 N/A N/A 0.1 (DEC.’05)<br />
COVINGTON VENTURE FUND SERIES IV COVINGTON CAPITAL -- / 459 /– $17.97 $6.3 -24.2 -1.5 -24.2 4.5 4.4 N/A N/A 13.2 (JAN.’00)<br />
COVINGTON VENTURE FUND SERIES V COVINGTON CAPITAL -- / 460 /– $6.48 $7.1 -1.8 -0.5 -1.8 7.8 -5.9 N/A N/A -7.0 (JAN.’00)<br />
COVINGTON VENTURE FUNDERIES VI COVINGTON CAPITAL -- / 461 /– $8.87 $12.2 0.2 -0.3 0.2 0.6 0.8 N/A N/A -1.3 (DEC.’02)<br />
COVINGTON VENTURE FUND SERIES VII COVINGTON CAPITAL -- / 462 /– $8.59 $11.0 0.0 -0.5 0.0 -0.1 0.6 N/A N/A -0.2 (JAN.’04)<br />
COVINGTON VENTURE FUND SERIES VIII COVINGTON CAPITAL -- / 465 /– $10.31 $4.4 0.1 -0.4 0.1 0.2 1.7 N/A N/A 1.0 (DEC.’07)<br />
COVINGTON VENTURE FUND SERIES IX COVINGTON CAPITAL -- / 466 /– $10.24 $14.3 0.0 -0.4 0.0 -0.2 1.5 N/A N/A 0.7 (DEC.’07)<br />
NEW GENERATION BIOTECH EQUITY FUND SERIES I COVINGTON CAPITAL -- / 900 /– $3.00 $9.9 -12.8 -5.1 -12.8 -29.1 -20.3 N/A N/A -15.5 (DEC.’00)<br />
NEW GENERATION BIOTECH EQUITY FUND SERIES II COVINGTON CAPITAL -- / 901 /– $2.59 $4.2 -15.4 -5.5 -15.4 -32.7 -22.8 N/A N/A -17.5 (JAN.’04)<br />
NEW GENERATION BIOTECH EQUITY FUND SERIES III COVINGTON CAPITAL -- / 902 /– $2.78 $4.0 -13.9 -5.1 -13.9 -31.2 -21.7 N/A N/A -16.5 (JAN.’04)<br />
GROWTHWORKS CANADIAN FUND I / ENSIS GROWTHWORKS 1616 /– /– $6.34 $34.2 -5.7 0.2 -5.7 -14.4 -5.8 -5.6 -4.0 -3.3 (JAN.’98)<br />
GROWTHWORKS CANADIAN FUND II / ENSIS GROWTHWORKS 1617 /– /– $6.34 $34.2 -5.7 0.2 -5.7 -14.4 -5.8 -5.6 -4.0 -3.3 (JAN.’98)<br />
VENTURELINK INNOVATION FUND INC. SERIES I -WHITAKER -- / 6909 /– $9.57 $32.6 -3.1 -1.8 -3.1 -3.4 -5.1 -3.4 N/A -0.3 (SEPT.’10)<br />
VENTURELINK INNOVATION FUND INC. SERIES II -WHITAKER -- / 6919 /– $9.52 $16.9 -3.5 -1.9 -3.5 -3.3 -5.0 -3.4 N/A -0.4 (SEPT.’10)<br />
VENTURELINK INNOVATION FUND INC. SERIES III -WHITAKER -- / 6929 /– $9.43 $85.0 -4.6 -2.0 -4.6 1.6 -3.6 -2.7 N/A -0.8 (SEPT.’10)<br />
VENTURELINK INNOVATION FUND INC. SERIES IV -WHITAKER -- / 6939 /– $9.42 $36.9 -4.8 -2.1 -4.8 1.4 -3.7 -2.8 N/A -0.8 (SEPT.’10)<br />
VENTURELINK INNOVATION FUND INC. SERIES VI -WHITAKER -- / 6949 /– $9.45 $1.3 -4.4 -2.0 -4.4 10.1 -0.8 N/A N/A -1.6 (SEPT.’10)<br />
*simple rates of return<br />
FOR DEALER USE ONLY<br />
MONTHLY PERFORMANCE SCORECARD AS AT JUNE 30, 2011 76
<strong>CI</strong> GIFs (Class A units) 1<br />
Issued by Transamerica Life Canada<br />
LEAD MANAGER<br />
CDN $<br />
FUND CODE: <strong>CI</strong>G<br />
ISC / DSC / LSC<br />
NAV<br />
(CDN)<br />
FUND<br />
ASSETS<br />
($MM)<br />
Y–T–D<br />
(%)<br />
1<br />
MTH<br />
(%)*<br />
6<br />
MTH<br />
(%)*<br />
1 YR<br />
(%)<br />
3 YR<br />
(%)<br />
5 YR<br />
(%)<br />
10 YR<br />
(%)<br />
SINCE<br />
INCEPTION<br />
(%)<br />
CAMBRIDGE AMERICAN EQUITY GIF 3 A. RADLO / B. SNOW 047 / 947 /– $4.03 $2.0 -2.2 -3.1 -2.2 16.8 -4.2 -5.3 -5.3 -7.6 (JAN.’00)<br />
<strong>CI</strong> GLOBAL GIF E. BUSHELL / S. VALI 034 / 934 /– $6.95 $5.8 -2.1 -2.5 -2.1 14.1 -6.2 -5.9 -4.3 -2.9 (FEB.’99)<br />
<strong>CI</strong> GLOBAL VALUE GIF JOHN HOCK 046 / 946 /– $8.93 $0.7 -1.0 -2.6 -1.0 11.5 -1.9 -5.0 -3.2 -0.9 (FEB.’99)<br />
<strong>CI</strong> HARBOUR GIF G. COLEMAN / S. JENKINS 030 / 930 /– $23.15 $34.3 -0.5 -1.9 -0.5 14.8 -1.6 1.5 5.1 7.0 (FEB.’99)<br />
<strong>CI</strong> HARBOUR GROWTH & INCOME GIF G. COLEMAN / S. JENKINS 031 / 931 /– $18.92 $29.1 -1.2 -1.6 -1.2 11.6 -1.3 1.0 4.2 5.3 (FEB.’99)<br />
<strong>CI</strong> INTERNATIONAL GIF BUSHELL / D’ANGELO / BRODEUR 051 / 951 /– $4.33 $0.4 -2.0 -2.9 -2.0 12.8 -9.0 -7.0 -5.1 -7.0 (JAN.’00)<br />
<strong>CI</strong> INTERNATIONAL BALANCED GIF E. BUSHELL / J. DUTKIEWICZ 038 / 938 /– $8.54 $3.6 -1.5 -1.6 -1.5 9.8 -1.6 -1.5 -2.0 -1.3 (FEB.’99)<br />
<strong>CI</strong> INTERNATIONAL BALANCED CORPORATE CLASS GIF E. BUSHELL / J. DUTKIEWICZ 036 / 936 /– $7.81 $6.7 -0.6 -1.9 -0.6 10.3 -2.4 -2.9 -4.0 -2.0 (FEB.’99)<br />
<strong>CI</strong> SIGNATURE CANADIAN BALANCED GIF ERIC BUSHELL 040 / 940 /– $19.64 $11.5 0.1 -1.8 0.1 12.1 2.2 3.4 4.3 5.6 (FEB.’99)<br />
<strong>CI</strong> SIGNATURE CANADIAN BOND GIF JAMES DUTKIEWICZ 044 / 944 /– $14.76 $5.6 1.0 -0.3 1.0 1.9 3.4 3.2 3.4 3.2 (FEB.’99)<br />
<strong>CI</strong> SIGNATURE DIVIDEND GIF ERIC BUSHELL 042 / 942 /– $16.50 $12.3 2.4 -2.0 2.4 12.9 3.9 1.1 2.9 4.1 (FEB.’99)<br />
<strong>CI</strong> SIGNATURE HIGH INCOME GIF ERIC BUSHELL 052 / 952 /– $29.26 $22.3 3.6 -1.5 3.6 16.3 4.5 3.4 8.4 9.8 (JAN.’00)<br />
<strong>CI</strong> SIGNATURE SELECT CANADIAN GIF ERIC BUSHELL 041 / 941 /– $20.11 $11.6 -0.4 -2.5 -0.4 15.8 -0.6 2.1 3.6 5.8 (FEB.’99)<br />
<strong>CI</strong> SYNERGY AMERICAN GIF DAVID PICTON 032 / 932 /– $6.15 $1.7 1.3 -2.7 1.3 16.3 -5.5 -4.1 -4.4 -3.9 (FEB.’99)<br />
<strong>CI</strong> MONEY MARKET GIF PAUL SIMON 045 / 945 /– $11.97 $15.2 0.0 0.0 0.0 -0.1 -0.3 0.8 0.9 1.5 (FEB.’99)<br />
<strong>CI</strong> CONSERVATIVE PORTFOLIO GIF <strong>CI</strong> INVESTMENT CONSULTING 053 / 953 /– $14.67 $13.3 1.5 -1.4 1.5 10.9 2.5 2.4 N/A 4.0 (SEPT.’01)<br />
<strong>CI</strong> MODERATE PORTFOLIO GIF <strong>CI</strong> INVESTMENT CONSULTING 054 / 954 /– $13.62 $27.3 0.9 -1.8 0.9 12.8 0.9 1.3 N/A 3.2 (SEPT.’01)<br />
<strong>CI</strong> GROWTH PORTFOLIO GIF <strong>CI</strong> INVESTMENT CONSULTING 055 / 955 /– $12.05 $12.8 0.6 -2.0 0.6 13.9 0.4 0.8 N/A 1.9 (SEPT.’01)<br />
<strong>CI</strong> AGGRESSIVE GROWTH PORTFOLIO GIF <strong>CI</strong> INVESTMENT CONSULTING 056 / 956 /– $10.45 $2.1 -0.3 -2.4 -0.3 16.5 -2.6 -1.2 N/A 0.5 (SEPT.’01)<br />
<strong>CI</strong> GIFs (Class B units) 2 Issued by Transamerica Life Canada<br />
CAMBRIDGE AMERICAN EQUITY GIF 3 A. RADLO / B. SNOW 079 / 771 /– $6.93 $0.1 -1.7 -3.1 -1.7 18.1 -3.2 -4.3 N/A -3.7 (SEPT.’01)<br />
<strong>CI</strong> GLOBAL GIF E. BUSHELL / S. VALI 066 / 756 /– $8.50 $0.8 -1.4 -2.3 -1.4 15.5 -5.3 -5.0 N/A -1.7 (SEPT.’01)<br />
<strong>CI</strong> GLOBAL VALUE GIF JOHN HOCK 078 / 770 /– $8.62 $0.3 -0.5 -2.5 -0.5 12.8 -0.7 -3.8 N/A -1.5 (SEPT.’01)<br />
<strong>CI</strong> HARBOUR GIF G. COLEMAN / S. JENKINS 062 / 752 /– $18.66 $13.7 0.1 -1.8 0.1 16.2 -0.5 2.7 N/A 6.6 (SEPT.’01)<br />
<strong>CI</strong> HARBOUR GROWTH & INCOME GIF G. COLEMAN / S. JENKINS 063 / 753 /– $16.82 $17.9 -0.6 -1.4 -0.6 12.9 -0.1 2.2 N/A 5.5 (SEPT.’01)<br />
<strong>CI</strong> INTERNATIONAL GIF BUSHELL / D’ANGELO / BRODEUR 083 / 775 /– $7.09 $0.1 -1.5 -2.7 -1.5 14.0 -8.1 -6.0 N/A -3.5 (SEPT.’01)<br />
<strong>CI</strong> INTERNATIONAL BALANCED GIF E. BUSHELL / J. DUTKIEWICZ 070 / 760 /– $9.90 $1.0 -0.9 -1.5 -0.9 11.1 -0.5 -0.4 N/A -0.1 (SEPT.’01)<br />
<strong>CI</strong> INTERNATIONAL BALANCED CORPORATE CLASS GIF E. BUSHELL / J. DUTKIEWICZ 068 / 758 /– $8.67 $0.3 -0.1 -1.9 -0.1 11.6 -1.2 -1.7 N/A -1.5 (SEPT.’01)<br />
<strong>CI</strong> SIGNATURE CANADIAN BALANCED GIF ERIC BUSHELL 072 / 762 /– $17.59 $3.7 0.7 -1.6 0.7 13.4 3.3 4.5 N/A 6.0 (SEPT.’01)<br />
<strong>CI</strong> SIGNATURE CANADIAN BOND GIF JAMES DUTKIEWICZ 076 / 768 /– $13.84 $0.9 1.3 -0.3 1.3 2.6 4.0 3.8 N/A 3.4 (SEPT.’01)<br />
<strong>CI</strong> SIGNATURE DIVIDEND GIF ERIC BUSHELL 074 / 764 /– $14.77 $5.7 3.0 -1.9 3.0 14.2 5.1 2.2 N/A 4.1 (SEPT.’01)<br />
<strong>CI</strong> SIGNATURE HIGH INCOME GIF ERIC BUSHELL 084 / 782 /– $23.67 $6.8 4.0 -1.5 4.0 17.2 5.3 4.2 N/A 9.3 (SEPT.’01)<br />
<strong>CI</strong> SIGNATURE SELECT CANADIAN GIF ERIC BUSHELL 073 / 763 /– $17.92 $4.1 0.2 -2.3 0.2 17.2 0.6 3.3 N/A 6.2 (SEPT.’01)<br />
<strong>CI</strong> SYNERGY AMERICAN GIF DAVID PICTON 064 / 754 /– $7.53 $0.2 1.9 -2.6 1.9 17.7 -4.4 -3.0 N/A -2.9 (SEPT.’01)<br />
<strong>CI</strong> MONEY MARKET GIF PAUL SIMON 077 / 769 /– $11.34 $4.1 0.2 0.0 0.2 0.4 0.2 1.3 N/A 1.3 (SEPT.’01)<br />
<strong>CI</strong> CONSERVATIVE PORTFOLIO GIF <strong>CI</strong> INVESTMENT CONSULTING 085 / 783 /– $15.04 $10.4 1.7 -1.4 1.7 11.2 2.9 2.8 N/A 4.3 (SEPT.’01)<br />
<strong>CI</strong> MODERATE PORTFOLIO GIF <strong>CI</strong> INVESTMENT CONSULTING 086 / 788 /– $14.05 $14.0 1.2 -1.7 1.2 13.4 1.4 1.8 N/A 3.6 (SEPT.’01)<br />
<strong>CI</strong> GROWTH PORTFOLIO GIF <strong>CI</strong> INVESTMENT CONSULTING 087 / 789 /– $12.69 $4.7 0.9 -1.9 0.9 14.6 0.9 1.3 N/A 2.5 (SEPT.’01)<br />
<strong>CI</strong> AGGRESSIVE GROWTH PORTFOLIO GIF <strong>CI</strong> INVESTMENT CONSULTING 088 / 799 /– $10.63 $0.7 -0.1 -2.5 -0.1 16.9 -2.1 -0.7 N/A 0.6 (SEPT.’01)<br />
3<br />
*simple rates of return formerly <strong>CI</strong> American Equity GIF (Class A and B Units)<br />
1Class A units: 100% Maturity Guarantee and 100% Death Benefit Guarantee<br />
2Class B units: 75% Maturity Guarantee and 100% Death Benefit Guarantee<br />
FOR DEALER USE ONLY<br />
MONTHLY PERFORMANCE SCORECARD AS AT JUNE 30, 2011 77
<strong>CI</strong> Segregated Funds<br />
Issued by Unity Life of Canada<br />
LEAD MANAGER<br />
CDN $<br />
FUND CODE: <strong>CI</strong>G<br />
ISC / DSC / LSC<br />
NAV<br />
(CDN)<br />
FUND<br />
ASSETS<br />
($MM)<br />
Y–T–D<br />
(%)<br />
1<br />
MTH<br />
(%)*<br />
6<br />
MTH<br />
(%)*<br />
1 YR<br />
(%)<br />
3 YR<br />
(%)<br />
5 YR<br />
(%)<br />
10 YR<br />
(%)<br />
SINCE<br />
INCEPTION<br />
(%)<br />
<strong>CI</strong> GLOBAL E. BUSHELL / S. VALI 025 / 925 /– $9.80 $1.4 -1.4 -2.4 -1.4 15.7 -5.0 -4.7 -3.1 -0.1 (OCT.’97)<br />
<strong>CI</strong> GLOBAL VALUE JOHN HOCK 024 / 924 /– $9.58 $0.6 -0.1 -2.4 -0.1 13.6 -0.1 -3.1 -1.4 -0.3 (OCT.’97)<br />
<strong>CI</strong> HARBOUR G. COLEMAN / S. JENKINS 021 / 921 /– $26.91 $11.3 0.3 -1.8 0.3 16.7 0.0 3.2 6.8 7.5 (OCT.’97)<br />
<strong>CI</strong> HARBOUR GROWTH & INCOME G. COLEMAN / S. JENKINS 022 / 922 /– $20.36 $10.2 -0.5 -1.4 -0.5 13.0 0.0 2.2 5.4 5.3 (OCT.’97)<br />
<strong>CI</strong> MONEY MARKET PAUL SIMON 020 / 920 /– $12.89 $0.8 0.1 0.0 0.1 0.0 0.0 1.2 1.3 1.9 (OCT.’97)<br />
<strong>CI</strong> SYNERGY AMERICAN DAVID PICTON 023 / 923 /– $9.27 $0.6 2.1 -2.5 2.1 18.2 -4.1 -2.7 -3.0 -0.6 (OCT.’97)<br />
Legacy Segregated Funds I Issued by Transamerica Life Canada<br />
CAMBRIDGE AMERICAN EQUITY I 3 A. RADLO / B. SNOW 134 / 234 /– $9.25 $0.6 -1.1 -2.9 -1.1 19.4 -2.5 -4.4 -4.9 -0.6 (DEC.’97)<br />
<strong>CI</strong> AMERICAN SMALL COMPANIES I WILLIAM PRIEST / D. PEARL 133 / 233 /– $9.24 $0.2 2.1 -3.0 2.1 21.9 1.9 -1.0 -0.4 -0.6 (DEC.’97)<br />
<strong>CI</strong> GLOBAL I E. BUSHELL / S. VALI 135 / 235 /– $7.35 $1.0 -1.1 -2.3 -1.1 16.5 -4.7 -5.0 -5.5 -2.3 (DEC.’97)<br />
<strong>CI</strong> INTERNATIONAL I BUSHELL / D’ANGELO / BRODEUR 136 / 236 /– $7.82 $0.7 -1.0 -2.7 -1.0 15.0 -7.4 -6.1 -4.7 -1.8 (DEC.’97)<br />
<strong>CI</strong> MONEY MARKET I PAUL SIMON 142 / 242 /– $12.90 $1.9 0.3 0.0 0.3 0.5 0.3 1.2 1.1 1.9 (DEC.’97)<br />
SIGNATURE CANADIAN BALANCED I ERIC BUSHELL 137 / 237 /– $19.33 $7.6 1.0 -1.6 1.0 14.1 3.7 4.3 4.7 5.0 (DEC.’97)<br />
SIGNATURE CANADIAN BOND I JAMES DUTKIEWICZ 140 / 240 /– $15.88 $0.8 1.5 -0.2 1.5 3.0 4.3 3.7 3.7 3.5 (DEC.’97)<br />
SIGNATURE CANADIAN I ERIC BUSHELL 131 / 231 /– $16.51 $2.0 0.7 -2.3 0.7 18.4 1.2 3.2 4.1 3.8 (DEC.’97)<br />
SIGNATURE DIVIDEND INCOME I ERIC BUSHELL 139 / 239 /– $21.13 $10.1 3.9 -1.8 3.9 16.2 6.6 3.2 4.7 5.7 (DEC.’97)<br />
SIGNATURE HIGH INCOME B I ERIC BUSHELL 141 / 241 /– $25.66 $0.7 4.3 -1.4 4.3 17.9 5.7 4.1 8.7 7.9 (FEB.’99)<br />
SIGNATURE HIGH INCOME I ERIC BUSHELL 138 / 238 /– $28.49 $5.3 4.2 -1.5 4.2 17.8 5.7 4.1 8.7 8.1 (DEC.’97)<br />
SIGNATURE SELECT CANADIAN I ERIC BUSHELL 132 / 232 /– $30.51 $2.3 0.7 -2.2 0.7 18.4 1.2 3.2 5.7 9.4 (FEB.’99)<br />
Legacy Segregated Funds II Issued by Transamerica Life Canada<br />
CAMBRIDGE AMERICAN EQUITY II 4 A. RADLO / B. SNOW 334 / 434 /– $8.72 $0.8 -2.1 -3.1 -2.1 16.7 -4.2 -5.4 -5.4 -4.9 (FEB.’99)<br />
<strong>CI</strong> AMERICAN SMALL COMPANIES II W. PRIEST / D. PEARL 333 / 433 /– $8.60 $0.1 0.6 -3.3 0.6 18.5 -0.3 -2.3 -1.1 -0.7 (FEB.’99)<br />
<strong>CI</strong> GLOBAL II E. BUSHELL / S. VALI 335 / 435 /– $6.94 $1.2 -2.0 -2.4 -2.0 14.1 -6.2 -6.0 -6.0 -5.3 (FEB.’99)<br />
<strong>CI</strong> INTERNATIONAL II BUSHELL / D’ANGELO / BRODEUR 336 / 436 /– $7.35 $0.3 -2.1 -2.9 -2.1 12.6 -9.1 -7.1 -5.2 -4.6 (FEB.’99)<br />
<strong>CI</strong> MONEY MARKET II PAUL SIMON 342 / 442 /– $12.65 $2.0 0.0 0.0 0.0 -0.1 -0.3 0.8 0.9 1.6 (FEB.’99)<br />
SIGNATURE CANADIAN BALANCED II ERIC BUSHELL 337 / 437 /– $18.34 $4.9 0.1 -1.7 0.1 12.0 2.1 3.3 4.2 4.2 (FEB.’99)<br />
SIGNATURE CANADIAN BOND II JAMES DUTKIEWICZ 340 / 440 /– $15.40 $0.6 1.0 -0.3 1.0 1.9 3.3 3.1 3.4 3.1 (FEB.’99)<br />
SIGNATURE CANADIAN II ERIC BUSHELL 331 / 431 /– $15.42 $1.2 -0.5 -2.5 -0.5 15.6 -0.7 2.0 3.5 3.9 (FEB.’99)<br />
SIGNATURE DIVIDEND INCOME II ERIC BUSHELL 339 / 439 /– $20.26 $6.0 3.1 -1.9 3.1 14.5 5.3 2.4 4.3 5.6 (FEB.’99)<br />
SIGNATURE HIGH INCOME B II ERIC BUSHELL 341 / 441 /– $24.88 $0.4 3.5 -1.5 3.5 16.2 4.4 3.3 8.3 7.6 (FEB.’99)<br />
SIGNATURE HIGH INCOME II ERIC BUSHELL 338 / 438 /– $27.33 $3.1 3.5 -1.5 3.5 16.1 4.4 3.3 8.3 9.1 (FEB.’99)<br />
SIGNATURE SELECT CANADIAN II ERIC BUSHELL 332 / 432 /– $28.67 $4.1 -0.4 -2.4 -0.4 15.7 -0.7 2.0 5.1 8.9 (FEB.’99)<br />
*simple rates of return<br />
3<br />
formerly <strong>CI</strong> American Equity I<br />
4<br />
formerly <strong>CI</strong> American Equity II<br />
FOR DEALER USE ONLY<br />
MONTHLY PERFORMANCE SCORECARD AS AT JUNE 30, 2011 7 8
Clarica MVP<br />
Segregated Funds<br />
LEAD MANAGER<br />
CDN $<br />
FUND CODE: <strong>CI</strong>G<br />
ISC / DSC / LSC<br />
US $<br />
FUND CODE: <strong>CI</strong>G<br />
ISC / DSC / LSC<br />
NAV<br />
(CDN)<br />
FUND<br />
ASSETS<br />
($MM)<br />
Y–T–D<br />
(%)<br />
1<br />
MTH<br />
(%)*<br />
6<br />
MTH<br />
(%)*<br />
1 YR<br />
(%)<br />
3 YR<br />
(%)<br />
5 YR<br />
(%)<br />
10 YR<br />
(%)<br />
SINCE<br />
INCEPTION<br />
(%)<br />
Issued by Sun Life Assurance Company of Canada<br />
CLARICA MVP ASIAN-PA<strong>CI</strong>FIC NON-RSP EQUITY W. PRIEST / E. BAKER 9250 /– /– – $11.96 $0.1 -4.6 0.1 -4.6 10.4 -2.9 -0.80 -1.5 1.1 (JUL.’97)<br />
CLARICA MVP 1987 ASIAN-PA<strong>CI</strong>FIC NON-RSP EQUITY W. PRIEST / E. BAKER 9262 /– /– – $12.02 $0.0 -4.5 0.1 -4.5 10.7 -2.7 -0.70 -1.4 1.2 (JUL.’97)<br />
CLARICA MVP ASIAN-PA<strong>CI</strong>FIC RSP EQUITY W. PRIEST / E. BAKER 9251 /– /– – $12.82 $1.2 -4.6 0.2 -4.6 10.5 -2.9 -0.80 -1.0 1.7 (DEC.’96)<br />
CLARICA MVP 1987 ASIAN-PA<strong>CI</strong>FIC RSP EQUITY W. PRIEST / E. BAKER 9263 /– /– – $12.87 $0.1 -4.5 0.1 -4.5 10.8 -2.7 -0.70 -1.0 1.8 (DEC.’96)<br />
CLARICA MVP BALANCED E. BUSHELL / J. DUTKIEWICZ 9252 /– /– – $45.97 $50.6 0.8 -1.6 0.8 13.6 3.7 5.00 6.0 6.4 (DEC.’86)<br />
CLARICA MVP 1987 BALANCED E. BUSHELL / J. DUTKIEWICZ 9264 /– /– – $46.19 $3.0 1.0 -1.6 1.0 13.9 3.9 5.10 6.0 6.4 (DEC.’86)<br />
CLARICA MVP BOND JAMES DUTKIEWICZ 9253 /– /– – $37.56 $9.4 1.4 -0.2 1.4 2.7 4.2 4.10 4.3 5.5 (DEC.’86)<br />
CLARICA MVP 1987 BOND JAMES DUTKIEWICZ 9265 /– /– – $37.75 $0.4 1.5 -0.2 1.5 3.0 4.4 4.20 4.3 5.6 (DEC.’86)<br />
CLARICA MVP DIVIDEND ERIC BUSHELL 9257 /– /– – $15.66 $4.0 3.1 -1.9 3.1 14.5 5.4 2.60 2.9 3.4 (DEC.’97)<br />
CLARICA MVP 1987 DIVIDEND ERIC BUSHELL 9269 /– /– – $15.74 $0.2 3.3 -1.8 3.3 14.8 5.6 2.70 3.0 3.4 (DEC.’97)<br />
CLARICA MVP EQUITY DAVID PICTON 9254 /– /– – $39.82 $29.7 0.4 -2.3 0.4 19.5 -1.7 2.30 5.5 5.8 (DEC.’86)<br />
CLARICA MVP 1987 EQUITY DAVID PICTON 9266 /– /– – $40.03 $4.0 0.5 -2.3 0.5 19.8 -1.6 2.40 5.5 5.8 (DEC.’86)<br />
CLARICA MVP EUROPEAN GROWTH BUSHELL / D’ANGELO / BRODEUR 9258 /– /– – $9.05 $1.3 1.1 -4.6 1.1 16.6 -10.4 -4.70 -1.9 -0.7 (DEC.’97)<br />
CLARICA MVP 1987 EUROPEAN GROWTH BUSHELL / D’ANGELO / BRODEUR 9270 /– /– – $9.09 $0.0 1.2 -4.7 1.2 16.8 -10.2 -4.60 -1.9 -0.7 (DEC.’97)<br />
CLARICA MVP GLOBAL EQUITY E. BUSHELL / S. VALI 9255 /– /– – $11.05 $1.7 -1.2 -2.3 -1.2 16.3 -4.4 -4.10 -2.0 0.7 (DEC.’96)<br />
CLARICA MVP 1987 GLOBAL EQUITY E. BUSHELL / S. VALI 9267 /– /– – $11.12 $0.1 -0.9 -2.2 -0.9 16.7 -4.2 -4.00 -2.0 0.7 (DEC.’96)<br />
CLARICA MVP GROWTH W. PRIEST / D. PEARL 9256 /– /– – $45.18 $44.2 2.0 -3.1 2.0 21.6 2.3 0.30 2.8 8.5 (DEC.’92)<br />
CLARICA MVP 1987 GROWTH W. PRIEST / D. PEARL 9268 /– /– – $45.40 $1.2 2.1 -3.1 2.1 22.0 2.5 0.40 2.9 8.5 (DEC.’92)<br />
CLARICA MVP MONEY MARKET PAUL SIMON 9260 /– /– – $1.64 $2.6 0.0 0.0 0.0 0.0 0.1 1.30 1.4 2.5 (JAN.’88)<br />
CLARICA MVP 1987 MONEY MARKET PAUL SIMON 9272 /– /– – $1.26 $0.0 0.0 0.0 0.0 0.0 -8.3 -3.90 -1.2 1.2 (JAN.’88)<br />
CLARICA MVP SMALL CAP AMERICAN W. PRIEST / D. PEARL 9259 /– /– – $18.98 $1.3 1.7 -3.1 1.7 21.0 1.8 -0.20 0.3 4.9 (DEC.’97)<br />
CLARICA MVP 1987 SMALL CAP AMERICAN W. PRIEST / D. PEARL 9271 /– /– – $19.08 $0.1 1.9 -3.1 1.9 21.4 2.0 -0.10 0.3 4.9 (DEC.’97)<br />
CLARICA MVP US. EQUITY A. RADLO / B. SNOW 9261 /– /– – $12.08 $2.5 -2.1 -2.2 -2.1 9.9 -4.9 -10.60 -8.6 0.9 (DEC.’92)<br />
CLARICA MVP 1987 US. EQUITY A. RADLO / B. SNOW 9273 /– /– – $12.13 $0.1 -2.0 -2.2 -2.0 10.2 -4.8 -10.50 -8.6 0.9 (DEC.’92)<br />
*simple rates of return<br />
FOR DEALER USE ONLY<br />
MONTHLY PERFORMANCE SCORECARD AS AT JUNE 30, 2011 79
Clarica Portfolio<br />
Segregated Funds<br />
Issued by Sun Life Assurance Company of Canada<br />
LEAD MANAGER<br />
CDN $<br />
FUND CODE: <strong>CI</strong>G<br />
ISC / DSC / LSC<br />
NAV<br />
(CDN)<br />
FUND<br />
ASSETS<br />
($MM)<br />
Y–T–D<br />
(%)<br />
1<br />
MTH<br />
(%)*<br />
6<br />
MTH<br />
(%)*<br />
1 YR<br />
(%)<br />
3 YR<br />
(%)<br />
5 YR<br />
(%)<br />
10 YR<br />
(%)<br />
SINCE<br />
INCEPTION<br />
(%)<br />
CLARICA SF CAMBRIDGE AMERICAN EQUITY - DSC 1 A. RADLO / B. SNOW -- / 9219 /– $6.05 $2.0 -1.3 -3.0 -1.3 18.6 -2.7 -3.8 -4.0 -4.2 (FEB.’99)<br />
CLARICA SF CAMBRIDGE AMERICAN EQUITY - FE 2 A. RADLO / B. SNOW 9169 /– /– $6.05 $8.8 -1.3 -2.9 -1.3 18.9 -2.7 -3.8 -4.0 -4.0 (FEB.’99)<br />
CLARICA SF <strong>CI</strong> ALPINE GROWTH EQUITY - DSC TED WHITEHEAD -- / 9202 /– $22.16 $5.1 -6.4 -5.2 -6.4 18.8 1.9 3.9 7.5 7.5 (JAN.’98)<br />
CLARICA SF <strong>CI</strong> ALPINE GROWTH EQUITY - FE TED WHITEHEAD 9152 /– /– $22.07 $18.4 -6.4 -5.2 -6.4 18.8 1.8 3.9 7.5 6.1 (JAN.’98)<br />
CLARICA SF <strong>CI</strong> AMERICAN SMALL COMPANIES - DSC W. PRIEST / D. PEARL -- / 9212 /– $8.19 $2.8 1.9 -3.1 1.9 21.3 2.0 0.1 -1.2 -1.7 (JAN.’00)<br />
CLARICA SF <strong>CI</strong> AMERICAN SMALL COMPANIES - FE W. PRIEST / D. PEARL 9162 /– /– $8.16 $5.4 1.9 -3.2 1.9 21.2 2.0 0.1 -1.2 -1.7 (JAN.’00)<br />
CLARICA SF <strong>CI</strong> ASIAN AND PA<strong>CI</strong>FIC - DSC W. PRIEST / E. BAKER -- / 9203 /– $6.39 $0.6 -5.1 0.0 -5.1 9.6 -3.8 -1.8 -1.4 -4.1 (JAN.’01)<br />
CLARICA SF <strong>CI</strong> ASIAN AND PA<strong>CI</strong>FIC - FE W. PRIEST / E. BAKER 9153 /– /– $6.35 $0.9 -5.1 0.0 -5.1 9.5 -3.9 -1.8 -1.5 -4.2 (JAN.’01)<br />
CLARICA SF <strong>CI</strong> CANADIAN INVESTMENT - DSC DANIEL BUBIS -- / 9206 /– $21.16 $24.1 0.8 -2.3 0.8 19.5 0.7 2.9 5.6 6.7 (JAN.’00)<br />
CLARICA SF <strong>CI</strong> CANADIAN INVESTMENT - FE DANIEL BUBIS 9156 /– /– $21.09 $56.0 0.8 -2.3 0.8 19.6 0.7 2.9 5.6 6.6 (JAN.’00)<br />
CLARICA SF <strong>CI</strong> CANADIAN SMALL/MID CAP - DSC J. LAWSON / D. PICTON -- / 9225 /– $15.68 $9.3 -2.1 -3.4 -2.1 23.4 2.3 2.4 5.9 4.6 (JAN.’98)<br />
CLARICA SF <strong>CI</strong> CANADIAN SMALL/MID CAP - FE J. LAWSON / D. PICTON 9175 /– /– $15.68 $58.8 -2.1 -3.3 -2.1 23.4 2.3 2.4 5.9 3.4 (JAN.’98)<br />
CLARICA SF <strong>CI</strong> EMERGING MARKETS - DSC E. BUSHELL / M. STRAUSS -- / 9224 /– $16.23 $3.8 -8.0 -2.6 -8.0 10.6 -4.1 3.8 6.4 3.0 (JAN.’98)<br />
CLARICA SF <strong>CI</strong> EMERGING MARKETS - FE E. BUSHELL / M. STRAUSS 9174 /– /– $16.12 $7.5 -8.0 -2.7 -8.0 10.6 -4.2 3.7 6.3 3.6 (JAN.’98)<br />
CLARICA SF <strong>CI</strong> EUROPEAN - DSC BUSHELL / D’ANGELO / BRODEUR -- / 9207 /– $7.09 $1.0 1.0 -4.7 1.0 16.2 -10.7 -5.1 -3.1 -2.9 (JAN.’00)<br />
CLARICA SF <strong>CI</strong> EUROPEAN - FE BUSHELL / D’ANGELO / BRODEUR 9157 /– /– $7.00 $2.6 0.9 -4.8 0.9 16.1 -10.8 -5.2 -3.2 -3.0 (JAN.’00)<br />
CLARICA SF <strong>CI</strong> GLOBAL E. BUSHELL / S. VALI 9188 / 9238 /– $11.14 $1.7 -1.3 -2.4 -1.3 15.9 -4.8 -4.5 N/A 1.3 (APR.’03)<br />
CLARICA SF <strong>CI</strong> GLOBAL BOND - DSC J. DUTKIEWICZ / J. SHAW -- / 9209 /– $11.42 $3.6 1.2 -0.3 1.2 0.7 4.7 4.5 1.7 1.1 (JAN.’00)<br />
CLARICA SF <strong>CI</strong> GLOBAL BOND - FE J. DUTKIEWICZ / J. SHAW 9159 /– /– $11.39 $6.7 1.2 -0.3 1.2 0.7 4.7 4.5 1.7 1.1 (JAN.’00)<br />
CLARICA SF <strong>CI</strong> GLOBAL S<strong>CI</strong>ENCE & TECHNOLOGY - DSC M. WHITE / J. YEUNG -- / 9216 /– $6.85 $1.9 1.8 -3.2 1.8 22.8 11.7 4.9 -3.6 -3.2 (FEB.’99)<br />
CLARICA SF <strong>CI</strong> GLOBAL S<strong>CI</strong>ENCE & TECHNOLOGY - FE M. WHITE / J. YEUNG 9166 /– /– $6.95 $9.4 1.9 -3.2 1.9 22.8 11.8 4.9 -3.7 -2.9 (FEB.’99)<br />
CLARICA SF <strong>CI</strong> HARBOUR - DSC G. COLEMAN / S. JENKINS -- / 9229 /– $25.53 $23.5 0.4 -1.8 0.4 16.9 0.2 3.5 7.1 7.7 (JAN.’98)<br />
CLARICA SF <strong>CI</strong> HARBOUR - FE G. COLEMAN / S. JENKINS 9179 /– /– $25.48 $68.4 0.4 -1.8 0.4 16.9 0.2 3.5 7.1 7.2 (JAN.’98)<br />
CLARICA SF <strong>CI</strong> HARBOUR FOREIGN EQUITY CORPORATE CLASS - DSC S. JENKINS / G. COLEMAN -- / 9230 /– $13.93 $3.1 1.8 -1.8 1.8 17.9 -2.0 -0.5 0.5 1.2 (JAN.’98)<br />
CLARICA SF <strong>CI</strong> HARBOUR FOREIGN EQUITY CORPORATE CLASS - FE S. JENKINS / G. COLEMAN 9180 /– /– $13.91 $15.3 1.8 -1.8 1.8 17.9 -2.0 -0.5 0.5 2.5 (JAN.’98)<br />
CLARICA SF <strong>CI</strong> HARBOUR GLOBAL EQUITY - DSC S. JENKINS / G. COLEMAN -- / 9217 /– $14.16 $6.3 1.7 -1.7 1.7 17.4 -2.4 -0.9 0.7 3.0 (FEB.’99)<br />
CLARICA SF <strong>CI</strong> HARBOUR GLOBAL EQUITY - FE S. JENKINS / G. COLEMAN 9167 /– /– $14.08 $26.1 1.7 -1.7 1.7 17.4 -2.4 -0.9 0.6 2.8 (FEB.’99)<br />
CLARICA SF <strong>CI</strong> HARBOUR GROWTH & INCOME - DSC G. COLEMAN / S. JENKINS -- / 9231 /– $20.97 $23.9 -0.5 -1.5 -0.5 13.0 0.0 2.4 5.5 6.1 (JAN.’98)<br />
CLARICA SF <strong>CI</strong> HARBOUR GROWTH & INCOME - FE G. COLEMAN / S. JENKINS 9181 /– /– $20.90 $98.7 -0.5 -1.4 -0.5 13.0 0.1 2.4 5.5 5.6 (JAN.’98)<br />
CLARICA SF <strong>CI</strong> INTERNATIONAL BALANCED E. BUSHELL / J. DUTKIEWICZ 9191 / 9241 /– $11.86 $1.4 -1.0 -1.6 -1.0 10.8 -0.7 -0.5 N/A 2.1 (APR.’03)<br />
CLARICA SF <strong>CI</strong> INTERNATIONAL VALUE - DSC JOHN HOCK -- / 9226 /– $8.76 $5.3 0.6 -1.7 0.6 15.3 -0.1 -2.4 -2.1 -3.8 (JAN.’98)<br />
CLARICA SF <strong>CI</strong> INTERNATIONAL VALUE - FE JOHN HOCK 9176 /– /– $8.72 $16.1 0.6 -1.7 0.6 15.3 -0.1 -2.4 -2.1 -1.0 (JAN.’98)<br />
CLARICA SF <strong>CI</strong> MONEY MARKET PAUL SIMON 9183 / 9233 /– $10.85 $18.1 0.1 0.0 0.1 0.0 -0.1 1.0 N/A 1.0 (APR.’03)<br />
CLARICA SF <strong>CI</strong> PA<strong>CI</strong>FIC - DSC W. PRIEST / E. BAKER -- / 9200 / – $14.10 $0.9 -5.0 0.1 -5.0 9.5 -3.7 -1.7 1.0 -0.5 (JAN.’98)<br />
CLARICA SF <strong>CI</strong> PA<strong>CI</strong>FIC - FE W. PRIEST / E. BAKER 9150 /– /– $13.91 $4.1 -5.1 0.0 -5.1 9.4 -3.8 -1.8 0.9 2.5 (JAN.’98)<br />
CLARICA SF <strong>CI</strong> SIGNATURE CANADIAN - DSC ERIC BUSHELL -- / 9215 /– $20.26 $6.9 0.4 -2.3 0.4 17.5 0.8 3.6 4.1 6.3 (FEB.’99)<br />
CLARICA SF <strong>CI</strong> SIGNATURE CANADIAN - FE ERIC BUSHELL 9165 /– /– $20.13 $24.3 0.4 -2.2 0.4 17.6 0.9 3.6 4.0 5.8 (FEB.’99)<br />
CLARICA SF <strong>CI</strong> SIGNATURE CANADIAN BALANCED - DSC E. BUSHELL / J. DUTKIEWICZ -- / 9201 /– $19.35 $8.0 0.6 -1.6 0.6 13.2 3.2 4.5 6.1 5.8 (FEB.’99)<br />
CLARICA SF <strong>CI</strong> SIGNATURE CANADIAN BALANCED - FE E. BUSHELL / J. DUTKIEWICZ 9151 /– /– $19.27 $39.1 0.6 -1.6 0.6 13.2 3.2 4.4 6.1 5.4 (FEB.’99)<br />
*simple rates of return 1<br />
formerly Clarica SF <strong>CI</strong> American Equity - DSC<br />
2<br />
formerly Clarica SF <strong>CI</strong> American Equity - FE<br />
FOR DEALER USE ONLY<br />
MONTHLY PERFORMANCE SCORECARD AS AT JUNE 30, 2011 8 0
Clarica Portfolio<br />
Segregated Funds cont’d<br />
Issued by Sun Life Assurance Company of Canada<br />
LEAD MANAGER<br />
CDN $<br />
FUND CODE: <strong>CI</strong>G<br />
ISC / DSC / LSC<br />
CLARICA SF <strong>CI</strong> SIGNATURE CANADIAN BOND - DSC JAMES DUTKIEWICZ -- / 9221 /– $16.35 $11.6 1.3 -0.2 1.3 2.5 4.0 3.8 3.9 4.3 (JAN.’98)<br />
CLARICA SF <strong>CI</strong> SIGNATURE CANADIAN BOND - FE JAMES DUTKIEWICZ 9171 /– /– $16.23 $37.2 1.3 -0.2 1.3 2.5 4.0 3.8 3.9 3.7 (JAN.’98)<br />
CLARICA SF <strong>CI</strong> SIGNATURE CANADIAN RESOURCE - DSC SCOTT VALI -- / 9204 /– $36.38 $23.1 -2.6 -3.0 -2.6 24.5 -3.7 7.7 15.2 14.9 (JAN.’98)<br />
CLARICA SF <strong>CI</strong> SIGNATURE CANADIAN RESOURCE - FE SCOTT VALI 9154 /– /– $36.02 $61.3 -2.6 -3.0 -2.6 24.5 -3.7 7.8 15.2 10.0 (JAN.’98)<br />
CLARICA SF <strong>CI</strong> SIGNATURE CORPORATE BOND - DSC DUTKIEWICZ / SHAW / MARSHALL -- / 9205 /– $16.44 $4.3 1.9 -1.2 1.9 6.6 6.1 4.3 4.6 4.4 (FEB.’99)<br />
CLARICA SF <strong>CI</strong> SIGNATURE CORPORATE BOND - FE DUTKIEWICZ / SHAW / MARSHALL 9155 /– /– $16.18 $12.9 1.8 -1.2 1.8 6.5 6.0 4.2 4.5 3.9 (FEB.’99)<br />
CLARICA SF <strong>CI</strong> SIGNATURE DIVERSIFIED CANADIAN BALANCED - DSC E. BUSHELL / J. DUTKIEWICZ -- / 9223 /– $17.77 $10.8 0.7 -1.7 0.7 13.5 3.5 4.7 5.7 4.1 (JAN.’98)<br />
CLARICA SF <strong>CI</strong> SIGNATURE DIVERSIFIED CANADIAN BALANCED - FE ERIC BUSHELL 9173 /– /– $17.73 $86.9 0.7 -1.7 0.7 13.5 3.5 4.7 5.7 4.3 (JAN.’98)<br />
CLARICA SF <strong>CI</strong> SIGNATURE MORTGAGE - DSC JAMES DUTKIEWICZ -- / 9227 /– $14.41 $3.4 0.8 0.2 0.8 0.8 2.1 2.2 2.3 2.7 (JAN.’98)<br />
CLARICA SF <strong>CI</strong> SIGNATURE MORTGAGE - FE JAMES DUTKIEWICZ 9177 /– /– $14.37 $8.8 0.8 0.2 0.8 0.8 2.1 2.2 2.3 2.7 (JAN.’98)<br />
CLARICA SF <strong>CI</strong> SIGNATURE SELECT CANADIAN - DSC ERIC BUSHELL -- / 9222 /– $17.50 $25.3 0.5 -2.3 0.5 17.8 1.2 4.0 5.6 3.5 (JAN.’98)<br />
CLARICA SF <strong>CI</strong> SIGNATURE SELECT CANADIAN - FE E. BUSHELL / J. DUTKIEWICZ 9172 /– /– $17.49 $120.0 0.5 -2.3 0.5 17.9 1.2 4.0 5.5 4.2 (JAN.’98)<br />
CLARICA SF <strong>CI</strong> SIGNATURE SELECT CANADIAN BALANCED - DSC ERIC BUSHELL -- / 9213 /– $21.93 $26.0 0.5 -1.7 0.5 13.0 3.0 4.4 5.2 7.0 (FEB.’99)<br />
CLARICA SF <strong>CI</strong> SIGNATURE SELECT CANADIAN BALANCED - FE ERIC BUSHELL 9163 /– /– $21.69 $77.2 0.5 -1.8 0.5 13.0 3.1 4.4 5.1 6.4 (FEB.’99)<br />
CLARICA SF <strong>CI</strong> SIGNATURE SHORT TERM BOND - DSC J. DUTKIEWICZ / P. SIMON -- / 9232 /– $13.21 $2.2 0.8 -0.1 0.8 0.7 1.9 2.4 2.2 2.4 (JAN.’00)<br />
CLARICA SF <strong>CI</strong> SIGNATURE SHORT TERM BOND - FE J. DUTKIEWICZ / P. SIMON 9182 /– /– $13.05 $4.8 0.7 -0.2 0.7 0.5 1.8 2.3 2.1 2.3 (JAN.’00)<br />
CLARICA SF <strong>CI</strong> SIGNATURE SUMMIT SELECT CANADIAN - DSC ERIC BUSHELL -- / 9228 /– $25.22 $20.1 0.6 -2.3 0.6 18.0 1.3 4.0 6.6 8.2 (JAN.’98)<br />
CLARICA SF <strong>CI</strong> SIGNATURE SUMMIT SELECT CANADIAN - FE E. BUSHELL / J. DUTKIEWICZ 9178 /– /– $25.02 $55.3 0.5 -2.3 0.5 17.9 1.3 4.0 6.5 7.0 (JAN.’98)<br />
CLARICA SF <strong>CI</strong> SYNERGY AMERICAN DAVID PICTON 9192 / 9242 /– $9.90 $1.4 2.1 -2.5 2.1 18.3 -4.0 -2.6 N/A -0.1 (APR.’03)<br />
CLARICA SF <strong>CI</strong> SYNERGY CANADIAN CLASS - DSC DAVID PICTON -- / 9218 /– $21.74 $13.1 0.1 -2.4 0.1 18.9 -2.3 1.7 4.7 6.9 (FEB.’99)<br />
CLARICA SF <strong>CI</strong> SYNERGY CANADIAN CLASS - FE DAVID PICTON 9168 /– /– $21.78 $59.5 0.1 -2.3 0.1 18.9 -2.3 1.7 4.7 6.5 (FEB.’99)<br />
CLARICA SF <strong>CI</strong> SYNERGY TACTICAL ASSET ALLOCATION - DSC DAVID PICTON -- / 9214 /– $16.80 $14.3 0.3 -2.0 0.3 13.0 1.2 2.0 3.8 4.6 (FEB.’99)<br />
CLARICA SF <strong>CI</strong> SYNERGY TACTICAL ASSET ALLOCATION - FE DAVID PICTON 9164 /– /– $16.78 $81.6 0.3 -2.0 0.3 13.0 1.2 2.0 3.8 4.3 (FEB.’99)<br />
CLARICA SF <strong>CI</strong> VALUE TRUST CORPORATE CLASS - DSC A. RADLO / B. SNOW -- / 9211 /– $3.11 $1.9 -2.2 -2.2 -2.2 9.1 -5.5 -11.2 -9.3 -9.6 (JAN.’00)<br />
CLARICA SF <strong>CI</strong> VALUE TRUST CORPORATE CLASS - FE A. RADLO / B. SNOW 9161 /– /– $3.07 $3.8 -2.5 -2.2 -2.5 8.9 -5.7 -11.4 -9.4 -9.7 (JAN.’00)<br />
CLARICA SF GROWTH - DSC TED WHITEHEAD -- / 9208 /– $22.45 $2.8 -6.2 -5.2 -6.2 19.6 2.5 4.5 8.3 7.9 (JAN.’01)<br />
CLARICA SF GROWTH - FE TED WHITEHEAD 9158 /– /– $22.24 $4.3 -6.2 -5.2 -6.2 19.5 2.4 4.4 8.2 7.8 (JAN.’01)<br />
CLARICA SF PORTFOLIO SERIES BALANCED <strong>CI</strong> INVESTMENT CONSULTING 9193 / 9243 /– $14.24 $83.7 1.0 -1.7 1.0 12.9 1.2 1.6 N/A 4.7 (SEPT.’03)<br />
CLARICA SF PORTFOLIO SERIES BALANCED GROWTH <strong>CI</strong> INVESTMENT CONSULTING 9186 / 9236 /– $14.41 $38.9 0.7 -1.8 0.7 14.0 0.8 1.2 N/A 4.5 (APR.’03)<br />
CLARICA SF PORTFOLIO SERIES CONSERVATIVE <strong>CI</strong> INVESTMENT CONSULTING 9184 / 9234 /– $15.16 $37.5 1.5 -1.4 1.5 11.1 2.5 2.5 N/A 5.2 (APR.’03)<br />
CLARICA SF PORTFOLIO SERIES CONSERVATIVE BALANCED <strong>CI</strong> INVESTMENT CONSULTING 9187 / 9237 /– $14.79 $25.2 1.2 -1.6 1.2 11.7 1.9 1.9 N/A 4.9 (APR.’03)<br />
CLARICA SF PORTFOLIO SERIES GROWTH <strong>CI</strong> INVESTMENT CONSULTING 9189 / 9239 /– $14.16 $17.8 0.5 -2.1 0.5 15.0 -0.4 0.6 N/A 4.3 (APR.’03)<br />
CLARICA SF PORTFOLIO SERIES INCOME <strong>CI</strong> INVESTMENT CONSULTING 9185 / 9235 /– $14.99 $31.3 2.5 -1.1 2.5 9.9 4.8 3.8 N/A 5.0 (APR.’03)<br />
CLARICA SF PORTFOLIO SERIES MAXIMUM GROWTH <strong>CI</strong> INVESTMENT CONSULTING 9190 / 9240 /– $14.18 $4.5 0.1 -2.3 0.1 17.3 -1.7 -0.2 N/A 4.3 (APR.’03)<br />
CLARICA SF PREMIER <strong>CI</strong> SIGNATURE CANADIAN BOND - DSC JAMES DUTKIEWICZ -- / 9210 /– $15.82 $8.0 1.4 -0.2 1.4 2.7 4.2 4.0 4.0 4.0 (JAN.’00)<br />
CLARICA SF PREMIER <strong>CI</strong> SIGNATURE CANADIAN BOND - FE JAMES DUTKIEWICZ 9160 /– /– $15.64 $12.5 1.3 -0.3 1.3 2.6 4.0 3.9 4.0 3.9 (JAN.’00)<br />
CLARICA SF PREMIER <strong>CI</strong> VALUE TRUST CORPORATE CLASS - DSC A. RADLO / B. SNOW -- / 9220 /– $4.82 $1.8 -2.2 -2.2 -2.2 9.8 -5.1 -10.8 -7.4 -7.8 (JAN.’98)<br />
CLARICA SF PREMIER <strong>CI</strong> VALUE TRUST CORPORATE CLASS - FE A. RADLO / B. SNOW 9170 /– /– $4.80 $8.5 -2.2 -2.2 -2.2 9.6 -5.2 -10.9 -7.5 -5.3 (JAN.’98)<br />
NAV<br />
(CDN)<br />
FUND<br />
ASSETS<br />
($MM)<br />
Y–T–D<br />
(%)<br />
1<br />
MTH<br />
(%)*<br />
6<br />
MTH<br />
(%)*<br />
1 YR<br />
(%)<br />
3 YR<br />
(%)<br />
5 YR<br />
(%)<br />
10 YR<br />
(%)<br />
SINCE<br />
INCEPTION<br />
(%)<br />
*simple rates of return<br />
FOR DEALER USE ONLY<br />
MONTHLY PERFORMANCE SCORECARD AS AT JUNE 30, 2011 8 1
SunWise<br />
®<br />
Basic Guarantee<br />
I<br />
Funds<br />
Issued by Sun Life Assurance Company of Canada<br />
LEAD MANAGER<br />
CDN $<br />
FUND CODE: <strong>CI</strong>G<br />
ISC / DSC / LSC<br />
SUNWISE <strong>CI</strong> AMERICAN VALUE W. PRIEST / D. PEARL 8792 / 8820 /– $8.47 $0.3 2.5 -2.5 2.5 16.5 -1.9 -0.3 -1.5 -1.3 (JAN.’99)<br />
SUNWISE <strong>CI</strong> CAMBRIDGE CORE CANADIAN EQUITY CORPORATE 1 ALAN RADLO 8800 / 8828 /– $21.40 $0.9 3.6 -1.5 3.6 23.4 3.2 2.8 4.8 6.2 (JAN.’99)<br />
SUNWISE <strong>CI</strong> CAMBRIDGE CORE GLOBAL EQUITY CORPORATE 2 ALAN RADLO 8788 / 8816 /– $11.46 $0.5 -0.1 -1.1 -0.1 13.4 -4.6 -5.2 -1.3 1.1 (JAN.’99)<br />
SUNWISE <strong>CI</strong> CANADIAN EQUITY DANIEL BUBIS 8796 / 8824 /– $22.44 $1.8 0.8 -2.3 0.8 19.6 0.7 2.8 5.3 6.6 (JAN.’99)<br />
SUNWISE <strong>CI</strong> CANADIAN INVESTMENT DANIEL BUBIS 8797 / 8825 /– $26.34 $4.5 0.8 -2.3 0.8 19.6 0.7 2.9 7.3 8.0 (JAN.’99)<br />
SUNWISE <strong>CI</strong> CANADIAN STOCK ERIC BUSHELL 8799 / 8827 /– $23.79 $0.3 0.5 -2.2 0.5 18.0 1.2 4.0 6.2 7.1 (JAN.’99)<br />
SUNWISE <strong>CI</strong> DIVIDEND ERIC BUSHELL 8809 / 8837 /– $17.99 $2.3 3.4 -1.8 3.4 15.2 6.0 3.2 5.8 4.8 (JAN.’99)<br />
SUNWISE <strong>CI</strong> HARBOUR GROWTH & INCOME G. COLEMAN / S. JENKINS 8803 / 8831 /– $16.38 $3.2 -0.4 -1.4 -0.4 13.2 0.3 2.7 4.4 4.0 (JAN.’99)<br />
SUNWISE <strong>CI</strong> MONEY MARKET PAUL SIMON 8812 / 8840 /– $12.90 $0.8 0.2 0.0 0.2 0.4 0.3 1.5 1.5 2.0 (JAN.’99)<br />
SUNWISE <strong>CI</strong> SIGNATURE CANADIAN BOND JAMES DUTKIEWICZ 8810 / 8838 /– $16.25 $0.7 1.4 -0.2 1.4 2.7 4.2 4.0 4.3 3.9 (JAN.’99)<br />
SUNWISE <strong>CI</strong> SIGNATURE CANADIAN SELECT BOND JAMES DUTKIEWICZ 8807 / 8835 /– $15.05 $0.8 1.4 -0.3 1.4 2.7 4.2 4.0 4.0 3.3 (JAN.’99)<br />
SUNWISE <strong>CI</strong> SIGNATURE CANADIAN SPE<strong>CI</strong>AL BOND JAMES DUTKIEWICZ 8811 / 8839 /– $16.12 $0.4 1.4 -0.2 1.4 2.6 4.1 4.0 4.2 3.9 (JAN.’99)<br />
SUNWISE <strong>CI</strong> SIGNATURE SELECT CANADIAN ERIC BUSHELL 8795 / 8823 /– $20.78 $0.5 0.6 -2.2 0.6 18.1 1.2 4.0 6.1 6.0 (JAN.’99)<br />
SUNWISE <strong>CI</strong> US. EQUITY W. PRIEST / D. PEARL 8791 / 8819 /– $7.03 $0.0 2.5 -2.5 2.5 16.4 -2.0 -0.3 -2.0 -2.8 (JAN.’99)<br />
SUNWISE <strong>CI</strong> WORLD EQUITY JOHN HOCK 8786 / 8814 /– $8.32 $0.2 0.0 -2.5 0.0 13.8 0.2 -2.8 -1.6 -1.4 (JAN.’99)<br />
SUNWISE DYNAMIC POWER AMERICAN GROWTH NOAH BLACKSTEIN 8789 / 8817 /– $9.03 $0.7 15.9 2.1 15.9 50.8 5.8 7.0 -0.6 -0.8 (JAN.’99)<br />
SUNWISE FIDELITY CANADIAN ASSET ALLOCATION D. YOUNG / G. STEIN 8802 / 8830 /– $20.51 $11.2 -1.9 -2.2 -1.9 10.9 0.6 4.6 5.5 5.9 (JAN.’99)<br />
SUNWISE FIDELITY GROWTH AMERICA JOHN POWER 8790 / 8818 /– $6.00 $0.0 -1.0 -2.9 -1.0 15.6 -2.9 -6.3 -4.8 -4.0 (JAN.’99)<br />
SUNWISE FIDELITY INTERNATIONAL PORTFOLIO MICHAEL STRONG 8785 / 8813 /– $7.83 $1.0 0.0 -2.6 0.0 15.8 -4.3 -5.0 -2.6 -1.9 (JAN.’99)<br />
SUNWISE FIDELITY TRUE NORTH MAXIME LEMIEUX 8794 / 8822 /– $26.52 $2.4 -1.2 -2.7 -1.2 15.7 -4.1 3.8 6.0 8.0 (JAN.’99)<br />
SUNWISE MACKENZIE CUNDILL CANADIAN BALANCED D. SLATER / L. CHIN 8801 / 8829 /– $19.26 $0.7 3.1 -1.9 3.1 17.1 7.3 4.3 4.4 5.3 (JAN.’99)<br />
SUNWISE MACKENZIE CUNDILL CANADIAN SECURITY D. SLATER / L. CHIN 8793 / 8821 /– $24.00 $0.6 4.9 -2.6 4.9 27.1 9.0 3.9 4.5 7.2 (JAN.’99)<br />
SUNWISE PORTFOLIO SERIES BALANCED <strong>CI</strong> INVESTMENT CONSULTING 8804 / 8832 /– $16.65 $2.7 1.1 -1.8 1.1 13.0 1.4 1.9 3.8 4.1 (JAN.’99)<br />
SUNWISE PORTFOLIO SERIES BALANCED GROWTH <strong>CI</strong> INVESTMENT CONSULTING 8806 / 8834 /– $17.19 $0.4 0.8 -1.9 0.8 14.4 1.2 1.6 3.7 4.4 (JAN.’99)<br />
SUNWISE PORTFOLIO SERIES CONSERVATIVE <strong>CI</strong> INVESTMENT CONSULTING 8805 / 8833 /– $16.36 $1.2 1.6 -1.4 1.6 11.3 2.7 2.7 4.3 4.0 (JAN.’99)<br />
SUNWISE PORTFOLIO SERIES GROWTH <strong>CI</strong> INVESTMENT CONSULTING 8787 / 8815 /– $13.24 $0.5 0.5 -2.1 0.5 15.1 -0.2 0.8 1.3 2.3 (JAN.’99)<br />
SUNWISE PORTFOLIO SERIES INCOME <strong>CI</strong> INVESTMENT CONSULTING 8808 / 8836 /– $17.67 $1.1 2.8 -1.1 2.8 10.4 5.3 4.4 5.2 4.6 (JAN.’99)<br />
SUNWISE PORTFOLIO SERIES MAXIMUM GROWTH <strong>CI</strong> INVESTMENT CONSULTING 8798 / 8826 /– $15.89 $0.1 0.3 -2.3 0.3 17.6 -1.4 0.2 2.6 3.7 (JAN.’99)<br />
SunWise<br />
®<br />
Full Guarantee<br />
I<br />
Funds<br />
Issued by Sun Life Assurance Company of Canada<br />
SUNWISE <strong>CI</strong> AMERICAN VALUE W. PRIEST / D. PEARL 8708 / 8736 /– $8.23 $0.7 2.2 -2.5 2.2 15.9 -2.5 -0.9 -2.1 -1.5 (JAN.’99)<br />
SUNWISE <strong>CI</strong> CAMBRIDGE CORE CANADIAN EQUITY CORPORATE 1 ALAN RADLO 8716 / 8744 /– $19.71 $0.9 3.2 -1.5 3.2 22.7 2.5 2.0 4.0 5.5 (JAN.’99)<br />
SUNWISE <strong>CI</strong> CAMBRIDGE CORE GLOBAL EQUITY CORPORATE 2 ALAN RADLO 8704 / 8732 /– $10.33 $0.6 -0.5 -1.2 -0.5 12.5 -5.4 -6.0 -2.2 0.3 (JAN.’99)<br />
SUNWISE <strong>CI</strong> CANADIAN EQUITY DANIEL BUBIS 8712 / 8740 /– $21.12 $2.0 0.4 -2.4 0.4 18.7 -0.1 2.1 4.6 6.1 (JAN.’99)<br />
SUNWISE <strong>CI</strong> CANADIAN INVESTMENT DANIEL BUBIS 8713 / 8741 /– $24.56 $6.6 0.4 -2.3 0.4 18.8 0.0 2.1 6.6 7.4 (JAN.’99)<br />
SUNWISE <strong>CI</strong> CANADIAN STOCK ERIC BUSHELL 8715 / 8743 /– $21.60 $0.9 0.2 -2.3 0.2 17.2 0.5 3.3 5.4 6.3 (JAN.’99)<br />
SUNWISE <strong>CI</strong> DIVIDEND ERIC BUSHELL 8725 / 8753 /– $17.38 $5.6 3.2 -1.9 3.2 14.9 5.7 2.9 5.6 4.5 (JAN.’99)<br />
SUNWISE <strong>CI</strong> HARBOUR GROWTH & INCOME G. COLEMAN / S. JENKINS 8719 / 8747 /– $15.37 $4.6 -0.6 -1.4 -0.6 12.6 -0.2 2.1 3.8 3.5 (JAN.’99)<br />
SUNWISE <strong>CI</strong> MONEY MARKET PAUL SIMON 8728 / 8756 /– $12.70 $1.2 0.2 0.0 0.2 0.2 0.2 1.3 1.4 1.9 (JAN.’99)<br />
SUNWISE <strong>CI</strong> SIGNATURE CANADIAN BOND JAMES DUTKIEWICZ 8726 / 8754 /– $15.69 $1.8 1.2 -0.3 1.2 2.3 3.9 3.7 4.0 3.6 (JAN.’99)<br />
SUNWISE <strong>CI</strong> SIGNATURE CANADIAN SELECT BOND JAMES DUTKIEWICZ 8723 / 8751 /– $15.11 $2.1 1.3 -0.3 1.3 2.4 3.9 3.7 3.8 3.3 (JAN.’99)<br />
NAV<br />
(CDN)<br />
FUND<br />
ASSETS<br />
($MM)<br />
Y–T–D<br />
(%)<br />
1<br />
MTH<br />
(%)*<br />
6<br />
MTH<br />
(%)*<br />
1 YR<br />
(%)<br />
3 YR<br />
(%)<br />
5 YR<br />
(%)<br />
10 YR<br />
(%)<br />
SINCE<br />
INCEPTION<br />
(%)<br />
*simple rates of return<br />
1<br />
formerly SunWise Trimark Select Canadian Growth<br />
2<br />
formerly SunWise Trimark Select Growth<br />
FOR DEALER USE ONLY<br />
MONTHLY PERFORMANCE SCORECARD AS AT JUNE 30, 2011 8 2
SunWise<br />
®<br />
I<br />
Funds<br />
Full Guarantee cont’d<br />
Issued by Sun Life Assurance Company of Canada<br />
LEAD MANAGER<br />
CDN $<br />
FUND CODE: <strong>CI</strong>G<br />
ISC / DSC / LSC<br />
SUNWISE <strong>CI</strong> SIGNATURE CANADIAN SPE<strong>CI</strong>AL BOND JAMES DUTKIEWICZ 8727 / 8755 /– $15.75 $0.3 1.3 -0.3 1.3 2.3 3.9 3.7 3.9 3.7 (JAN.’99)<br />
SUNWISE <strong>CI</strong> SIGNATURE SELECT CANADIAN ERIC BUSHELL 8711 / 8739 /– $18.94 $1.0 0.3 -2.3 0.3 17.2 0.5 3.3 5.4 5.2 (JAN.’99)<br />
SUNWISE <strong>CI</strong> US. EQUITY D. PEARL / W. PRIEST 8707 / 8735 /– $6.23 $0.0 2.3 -2.5 2.3 15.8 -2.5 -0.9 -2.6 -3.7 (JAN.’99)<br />
SUNWISE <strong>CI</strong> WORLD EQUITY JOHN HOCK 8702 / 8730 /– $7.47 $0.4 -0.4 -2.5 -0.4 13.0 -0.6 -3.6 -2.4 -2.3 (JAN.’99)<br />
SUNWISE DYNAMIC POWER AMERICAN GROWTH NOAH BLACKSTEIN 8705 / 8733 /– $8.17 $0.8 15.6 2.0 15.6 49.9 5.2 6.4 -1.2 -1.6 (JAN.’99)<br />
SUNWISE FIDELITY CANADIAN ASSET ALLOCATION D. YOUNG / G. STEIN 8718 / 8746 /– $19.27 $13.1 -2.1 -2.2 -2.1 10.4 0.1 4.1 5.1 5.3 (JAN.’99)<br />
SUNWISE FIDELITY GROWTH AMERICA JOHN POWER 8706 / 8734 /– $5.32 $0.2 -1.3 -2.9 -1.3 14.9 -3.6 -6.9 -5.5 -4.9 (JAN.’99)<br />
SUNWISE FIDELITY INTERNATIONAL PORTFOLIO MICHAEL STRONG 8701 / 8729 /– $7.09 $1.1 -0.4 -2.6 -0.4 14.9 -5.0 -5.7 -3.4 -2.7 (JAN.’99)<br />
SUNWISE FIDELITY TRUE NORTH ® MAXIME LEMIEUX 8710 / 8738 /– $24.00 $4.5 -1.6 -2.8 -1.6 14.8 -4.8 3.0 5.2 7.2 (JAN.’99)<br />
SUNWISE MACKENZIE CUNDILL CANADIAN BALANCED D. SLATER / L. CHIN 8717 / 8745 /– $18.27 $1.2 2.9 -1.9 2.9 16.5 6.8 3.9 3.9 4.9 (JAN.’99)<br />
SUNWISE MACKENZIE CUNDILL CANADIAN SECURITY D. SLATER / L. CHIN 8709 / 8737 /– $21.81 $1.3 4.5 -2.7 4.5 26.1 8.2 3.1 3.7 6.4 (JAN.’99)<br />
SUNWISE PORTFOLIO SERIES BALANCED <strong>CI</strong> INVESTMENT CONSULTING 8720 / 8748 /– $15.67 $4.4 0.8 -1.8 0.8 12.4 0.9 1.3 3.3 3.6 (JAN.’99)<br />
SUNWISE PORTFOLIO SERIES BALANCED GROWTH <strong>CI</strong> INVESTMENT CONSULTING 8722 / 8750 /– $16.32 $0.3 0.6 -1.9 0.6 14.0 0.7 1.2 3.2 4.0 (JAN.’99)<br />
SUNWISE PORTFOLIO SERIES CONSERVATIVE <strong>CI</strong> INVESTMENT CONSULTING 8721 / 8749 /– $15.74 $1.4 1.4 -1.4 1.4 10.7 2.2 2.2 3.8 3.7 (JAN.’99)<br />
SUNWISE PORTFOLIO SERIES GROWTH <strong>CI</strong> INVESTMENT CONSULTING 8703 / 8731 /– $11.46 $0.6 0.1 -2.1 0.1 14.3 -1.0 -0.1 0.5 1.1 (JAN.’99)<br />
SUNWISE PORTFOLIO SERIES INCOME <strong>CI</strong> INVESTMENT CONSULTING 8724 / 8752 /– $17.09 $1.8 2.6 -1.1 2.6 10.1 5.0 4.1 4.9 4.3 (JAN.’99)<br />
SUNWISE PORTFOLIO SERIES MAXIMUM GROWTH <strong>CI</strong> INVESTMENT CONSULTING 8714 / 8742 /– $14.32 $0.3 -0.1 -2.4 -0.1 16.7 -2.2 -0.5 1.8 2.9 (JAN.’99)<br />
SunWise<br />
®<br />
Basic Guarantee<br />
II<br />
Funds<br />
Issued by Sun Life Assurance Company of Canada<br />
SUNWISE AIC AMERICAN FOCUSED ROGER HAMILTON 8112 / 8212 /– $6.67 $0.3 -0.3 -3.5 -0.3 17.8 1.0 -9.4 N/A -4.1 (DEC.’01)<br />
SUNWISE 2001 AIC AMERICAN FOCUSED ROGER HAMILTON 8012 / 8912 /– $6.67 $0.1 -0.3 -3.6 -0.3 17.8 1.0 -9.4 N/A -4.1 (DEC.’01)<br />
SUNWISE AIC DIVERSIFIED CANADA JAMES COLE 8120 / 8220 /– $10.53 $0.2 1.7 -4.4 1.7 11.7 -3.5 -2.0 N/A 0.5 (DEC.’01)<br />
SUNWISE 2001 AIC DIVERSIFIED CANADA JAMES COLE 8020 / 8920 /– $10.52 $0.0 1.7 -4.4 1.7 11.6 -3.6 -2.0 N/A 0.5 (DEC.’01)<br />
SUNWISE BOND INDEX TD ASSET MGNT INC. 8152 / 8252 /– $14.87 $1.0 1.4 0.0 1.4 2.8 4.3 4.3 N/A 4.2 (DEC.’01)<br />
SUNWISE 2001 BOND INDEX TD ASSET MGNT INC. 8186 / 8286 /– $14.88 $0.1 1.3 -0.1 1.3 2.8 4.3 4.3 N/A 4.2 (DEC.’01)<br />
SUNWISE CANADIAN EQUITY INDEX TD ASSET MGNT INC. 8127 / 8227 /– $17.56 $0.1 -1.3 -3.6 -1.3 17.5 -2.6 2.9 N/A 6.1 (DEC.’01)<br />
SUNWISE 2001 CANADIAN EQUITY INDEX TD ASSET MGNT INC. 8169 / 8269 /– $17.59 $0.0 -1.2 -3.5 -1.2 17.7 -2.5 3.0 N/A 6.1 (DEC.’01)<br />
SUNWISE <strong>CI</strong> AMERICAN GROWTH A. RADLO / B. SNOW 8114 / 8214 /– $4.71 $0.0 -2.3 -2.3 -2.3 9.8 -5.1 -10.8 N/A -7.6 (DEC.’01)<br />
SUNWISE 2001 <strong>CI</strong> AMERICAN GROWTH A. RADLO / B. SNOW 8014 / 8914 /– $4.71 $0.2 -2.1 -2.3 -2.1 9.8 -5.1 -10.8 N/A -7.6 (DEC.’01)<br />
SUNWISE <strong>CI</strong> AMERICAN VALUE W. PRIEST / D. PEARL 8116 / 8216 /– $9.46 $0.6 2.5 -2.5 2.5 16.4 -1.9 -0.3 N/A -0.6 (DEC.’01)<br />
SUNWISE 2001 <strong>CI</strong> AMERICAN VALUE W. PRIEST / D. PEARL 8016 / 8916 /– $9.45 $0.1 2.4 -2.6 2.4 16.2 -2.0 -0.3 N/A -0.6 (DEC.’01)<br />
SUNWISE <strong>CI</strong> CAMBRIDGE CORE CANADIAN EQUITY CORPORATE 1 ALAN RADLO 8121 / 8221 /– $15.96 $1.2 3.6 -1.5 3.6 24.9 -2.7 -1.4 N/A 5.0 (DEC.’01)<br />
SUNWISE 2001 <strong>CI</strong> CAMBRIDGE CORE CANADIAN EQUITY CORPORATE 2 ALAN RADLO 8021 / 8921 /– $15.97 $0.4 3.6 -1.5 3.6 24.9 -2.6 -1.3 N/A 5.0 (DEC.’01)<br />
SUNWISE <strong>CI</strong> CAMBRIDGE CORE GLOBAL EQUITY CORPORATE 3 ALAN RADLO 8106 / 8206 /– $8.80 $3.2 -0.1 -1.1 -0.1 13.4 -4.5 -5.1 N/A -1.3 (DEC.’01)<br />
SUNWISE 2001 <strong>CI</strong> CAMBRIDGE CORE GLOBAL EQUITY CORPORATE 4 ALAN RADLO 8006 / 8906 /– $8.80 $1.0 -0.1 -1.1 -0.1 13.4 -4.5 -5.1 N/A -1.3 (DEC.’01)<br />
SUNWISE <strong>CI</strong> CANADIAN EQUITY DANIEL BUBIS 8125 / 8225 /– $17.17 $0.0 0.8 -2.3 0.8 19.8 0.7 2.9 N/A 5.8 (DEC.’01)<br />
SUNWISE 2001 <strong>CI</strong> CANADIAN EQUITY DANIEL BUBIS 8167 / 8267 /– $17.24 $0.3 0.9 -2.3 0.9 19.8 0.8 3.0 N/A 5.9 (DEC.’01)<br />
SUNWISE <strong>CI</strong> CANADIAN INVESTMENT FUND DANIEL BUBIS 8126 / 8226 /– $19.94 $15.8 0.8 -2.3 0.8 19.6 0.6 2.8 N/A 7.5 (DEC.’01)<br />
SUNWISE 2001 <strong>CI</strong> CANADIAN INVESTMENT FUND DANIEL BUBIS 8168 / 8268 /– $19.95 $4.1 0.8 -2.3 0.8 19.6 0.6 2.8 N/A 7.5 (DEC.’01)<br />
SUNWISE <strong>CI</strong> DIVIDEND ERIC BUSHELL 8150 / 8250 /– $17.08 $0.0 3.5 -1.8 3.5 15.3 6.1 3.3 N/A 5.7 (DEC.’01)<br />
SUNWISE 2001 <strong>CI</strong> DIVIDEND ERIC BUSHELL 8184 / 8284 /– $17.06 $0.4 3.5 -1.8 3.5 15.3 6.1 3.3 N/A 5.7 (DEC.’01)<br />
SUNWISE <strong>CI</strong> GLOBAL E. BUSHELL / S. VALI 8102 / 8202 /– $8.78 $0.5 -1.2 -2.3 -1.2 16.1 -4.7 -4.3 N/A -1.3 (DEC.’01)<br />
SUNWISE 2001 <strong>CI</strong> GLOBAL E. BUSHELL / S. VALI 8002 / 8902 /– $8.79 $0.1 -1.2 -2.2 -1.2 16.1 -4.6 -4.3 N/A -1.3 (DEC.’01)<br />
NAV<br />
(CDN)<br />
FUND<br />
ASSETS<br />
($MM)<br />
Y–T–D<br />
(%)<br />
1<br />
MTH<br />
(%)*<br />
6<br />
MTH<br />
(%)*<br />
1 YR<br />
(%)<br />
3 YR<br />
(%)<br />
5 YR<br />
(%)<br />
10 YR<br />
(%)<br />
SINCE<br />
INCEPTION<br />
(%)<br />
*simple rates of return<br />
1<br />
formerly SunWise Trimark Canadian First Class<br />
3<br />
formerly SunWise Trimark Select Growth<br />
2<br />
formerly SunWise 2001Trimark Canadian First Class<br />
4<br />
formerly SunWise 2001Trimark Select Growth<br />
FOR DEALER USE ONLY<br />
MONTHLY PERFORMANCE SCORECARD AS AT JUNE 30, 2011 8 3
SunWise<br />
®<br />
II<br />
Funds<br />
Basic Guarantee cont’d<br />
Issued by Sun Life Assurance Company of Canada<br />
LEAD MANAGER<br />
CDN $<br />
FUND CODE: <strong>CI</strong>G<br />
ISC / DSC / LSC<br />
SUNWISE <strong>CI</strong> GLOBAL BOND J. DUTKIEWICZ / J. SHAW 8160 / 8260 /– $10.85 $0.2 1.5 -0.3 1.5 1.3 5.4 5.2 N/A 1.0 (JAN.’03)<br />
SUNWISE 2001 <strong>CI</strong> GLOBAL BOND J. DUTKIEWICZ / J. SHAW 8194 / 8294 /– $10.85 $0.0 1.5 -0.2 1.5 1.3 5.4 5.2 N/A 1.0 (JAN.’03)<br />
SUNWISE <strong>CI</strong> GLOBAL VALUE JOHN HOCK 8103 / 8203 /– $7.85 $0.7 0.0 -2.4 0.0 13.9 0.3 -2.8 N/A -2.5 (DEC.’01)<br />
SUNWISE 2001 <strong>CI</strong> GLOBAL VALUE JOHN HOCK 8003 / 8903 /– $7.85 $0.1 0.0 -2.5 0.0 13.8 0.3 -2.8 N/A -2.5 (DEC.’01<br />
SUNWISE <strong>CI</strong> HARBOUR G. COLEMAN / S. JENKINS 8122 / 8222 /– $19.76 $12.1 0.4 -1.7 0.4 16.9 0.2 3.4 N/A 7.4 (DEC.’01)<br />
SUNWISE 2001 <strong>CI</strong> HARBOUR G. COLEMAN / S. JENKINS 8022 / 8922 /– $19.77 $2.7 0.4 -1.7 0.4 16.9 0.2 3.5 N/A 7.4 (DEC.’01)<br />
SUNWISE <strong>CI</strong> HARBOUR GROWTH & INCOME G. COLEMAN / S. JENKINS 8129 / 8229 /– $17.41 $18.0 -0.3 -1.4 -0.3 13.3 0.3 2.7 N/A 6.0 (DEC.’01)<br />
SUNWISE 2001 <strong>CI</strong> HARBOUR GROWTH & INCOME G. COLEMAN / S. JENKINS 8171 / 8271 /– $17.42 $2.7 -0.3 -1.4 -0.3 13.3 0.3 2.7 N/A 6.0 (DEC.’01)<br />
SUNWISE <strong>CI</strong> INTERNATIONAL BUSHELL / D’ANGELO / BRODEUR 8154 / 8254 /– $12.79 $0.3 -1.2 -2.7 -1.2 14.7 -7.5 -5.4 N/A 3.0 (JAN.’03)<br />
SUNWISE 2001 <strong>CI</strong> INTERNATIONAL BUSHELL / D’ANGELO / BRODEUR 8188 / 8288 /– $12.79 $0.0 -1.2 -2.7 -1.2 14.7 -7.5 -5.4 N/A 3.0 (JAN.’03)<br />
SUNWISE <strong>CI</strong> INTERNATIONAL BALANCED E. BUSHELL / J. DUTKIEWICZ 8155 / 8255 /– $12.22 $0.3 -0.8 -1.5 -0.8 11.4 -0.1 0.0 N/A 2.4 (JAN.’03)<br />
SUNWISE 2001 <strong>CI</strong> INTERNATIONAL BALANCED E. BUSHELL / J. DUTKIEWICZ 8189 / 8289 /– $12.22 $0.1 -0.8 -1.5 -0.8 11.3 -0.1 0.0 N/A 2.4 (JAN.’03)<br />
SUNWISE <strong>CI</strong> INTERNATIONAL BALANCED CORPORATE E. BUSHELL / J. DUTKIEWICZ 8108 / 8208 /– $9.48 $0.1 0.4 -1.8 0.4 12.7 -0.3 -0.7 N/A -0.6 (DEC.’01)<br />
SUNWISE 2001 <strong>CI</strong> INTERNATIONAL BALANCED CORPORATE E. BUSHELL / J. DUTKIEWICZ 8008 / 8908 /– $9.48 $0.0 0.4 -1.8 0.4 12.7 -0.3 -0.7 N/A -0.6 (DEC.’01)<br />
SUNWISE <strong>CI</strong> INTERNATIONAL VALUE JOHN HOCK 8107 / 8207 /– $10.07 $0.7 0.6 -1.7 0.6 15.1 -0.1 -2.4 N/A 0.1 (DEC.’01)<br />
SUNWISE 2001 <strong>CI</strong> INTERNATIONAL VALUE JOHN HOCK 8007 / 8907 /– $10.08 $0.1 0.6 -1.7 0.6 15.1 -0.1 -2.4 N/A 0.1 (DEC.’01)<br />
SUNWISE <strong>CI</strong> MONEY MARKET PAUL SIMON 8153 / 8253 /– $11.56 $3.4 0.2 0.0 0.2 0.3 0.3 1.5 N/A 1.5 (DEC.’01)<br />
SUNWISE 2001 <strong>CI</strong> MONEY MARKET PAUL SIMON 8187 / 8287 /– $11.57 $0.2 0.3 0.0 0.3 0.4 0.3 1.5 N/A 1.5 (DEC.’01)<br />
SUNWISE <strong>CI</strong> PREMIER AMERICAN VALUE CORPORATE 1 W. PRIEST / D. PEARL 8117 / 8217 /– $7.33 $0.1 2.8 -2.3 2.8 17.3 1.8 -0.7 N/A -3.2 (DEC.’01)<br />
SUNWISE 2001 <strong>CI</strong> PREMIER AMERICAN VALUE CORPORATE 2 W. PRIEST / D. PEARL 8017 / 8917 /– $7.32 $0.0 2.8 -2.4 2.8 17.1 1.7 -0.7 N/A -3.2 (DEC.’01)<br />
SUNWISE <strong>CI</strong> SYNERGY AMERICAN DAVID PICTON 8156 / 8256 /– $11.76 $0.0 2.1 -2.6 2.1 18.2 -3.9 -2.4 N/A 1.9 (JAN.’03)<br />
SUNWISE 2001 <strong>CI</strong> SYNERGY AMERICAN DAVID PICTON 8190 / 8290 /– $12.01 $0.0 2.2 -2.6 2.2 18.4 -3.2 -2.0 N/A 2.2 (JAN.’03)<br />
SUNWISE <strong>CI</strong> SIGNATURE CANADIAN BALANCED E. BUSHELL / J. DUTKIEWICZ 8131 / 8231 /– $17.90 $4.0 0.8 -1.6 0.8 13.8 3.7 5.0 N/A 6.3 (DEC.’01)<br />
SUNWISE 2001 <strong>CI</strong> SIGNATURE CANADIAN BALANCED E. BUSHELL / J. DUTKIEWICZ 8173 / 8273 /– $17.90 $0.9 0.8 -1.6 0.8 13.8 3.7 5.0 N/A 6.3 (DEC.’01)<br />
SUNWISE <strong>CI</strong> SIGNATURE CANADIAN BOND JAMES DUTKIEWICZ 8162 / 8262 /– $13.56 $2.2 1.4 -0.3 1.4 2.6 4.2 4.0 N/A 3.7 (JAN.’03)<br />
SUNWISE 2001 <strong>CI</strong> SIGNATURE CANADIAN BOND JAMES DUTKIEWICZ 8196 / 8296 /– $13.58 $0.5 1.5 -0.2 1.5 2.8 4.3 4.1 N/A 3.7 (JAN.’03)<br />
SUNWISE <strong>CI</strong> CANADIAN PREMIER BOND JAMES DUTKIEWICZ 8149 / 8249 /– $14.30 $0.0 1.4 -0.3 1.4 2.6 4.1 4.0 N/A 3.8 (DEC.’01)<br />
SUNWISE 2001 <strong>CI</strong> CANADIAN PREMIER BOND JAMES DUTKIEWICZ 8183 / 8283 /– $14.34 $0.5 1.4 -0.3 1.4 2.6 4.2 4.0 N/A 3.8 (DEC.’01)<br />
SUNWISE <strong>CI</strong> SIGNATURE DIVIDEND ERIC BUSHELL 8161 / 8261 /– $16.16 $5.7 3.4 -1.8 3.4 15.1 5.9 3.0 N/A 5.9 (JAN.’03)<br />
SUNWISE 2001 <strong>CI</strong> SIGNATURE DIVIDEND ERIC BUSHELL 8195 / 8295 /– $16.14 $0.5 3.4 -1.8 3.4 15.1 5.9 3.0 N/A 5.8 (JAN.’03)<br />
SUNWISE <strong>CI</strong> SIGNATURE HIGH INCOME ERIC BUSHELL 8148 / 8248 /– $23.54 $13.6 4.0 -1.5 4.0 17.2 5.4 4.4 N/A 9.3 (DEC.’01)<br />
SUNWISE 2001 <strong>CI</strong> SIGNATURE HIGH INCOME ERIC BUSHELL 8182 / 8282 /– $23.54 $2.3 4.0 -1.5 4.0 17.2 5.4 4.4 N/A 9.3 (DEC.’01)<br />
SUNWISE <strong>CI</strong> SIGNATURE INCOME & GROWTH E. BUSHELL / J. DUTKIEWICZ 8164 / 8264 /– $14.62 $4.4 1.2 -1.8 1.2 14.8 3.4 4.3 N/A 6.3 (MAR.’05)<br />
SUNWISE 2001 <strong>CI</strong> SIGNATURE INCOME & GROWTH E. BUSHELL / J. DUTKIEWICZ 8198 / 8298 /– $14.64 $0.7 1.3 -1.8 1.3 14.8 3.4 4.3 N/A 6.3 (MAR.’05)<br />
SUNWISE <strong>CI</strong> SIGNATURE SHORT-TERM BOND J. DUTKIEWICZ / P. SIMON 8151 / 8251 /– $12.33 $0.0 0.7 -0.1 0.7 0.6 1.9 2.4 N/A 2.2 (DEC.’01)<br />
SUNWISE 2001 <strong>CI</strong> SIGNATURE SHORT-TERM BOND J. DUTKIEWICZ / P. SIMON 8185 / 8285 /– $12.33 $0.1 0.7 -0.1 0.7 0.7 1.9 2.4 N/A 2.2 (DEC.’01)<br />
SUNWISE <strong>CI</strong> SIGNATURE SELECT CANADIAN ERIC BUSHELL 8124 / 8224 /– $20.18 $6.9 0.6 -2.2 0.6 18.0 1.2 4.0 N/A 7.6 (DEC.’01)<br />
SUNWISE 2001 <strong>CI</strong> SIGNATURE SELECT CANADIAN ERIC BUSHELL 8166 / 8266 /– $20.20 $1.1 0.6 -2.2 0.6 18.1 1.2 4.0 N/A 7.6 (DEC.’01)<br />
SUNWISE <strong>CI</strong> SIGNATURE PREMIER CANADIAN BALANCED 3 E. BUSHELL / J. DUTKIEWICZ 8132 / 8232 /– $17.57 $1.0 0.8 -1.7 0.8 13.7 3.5 4.2 N/A 6.1 (DEC.’01)<br />
SUNWISE 2001 <strong>CI</strong> SIGNATURE PREMIER CANADIAN BALANCED 4 E. BUSHELL / J. DUTKIEWICZ 8174 / 8274 /– $17.58 $0.3 0.8 -1.7 0.8 13.7 3.6 4.2 N/A 6.1 (DEC.’01)<br />
SUNWISE <strong>CI</strong> SIGNATURE SELECT CANADIAN BALANCED 5 E. BUSHELL / J. DUTKIEWICZ 8133 / 8233 /– $14.26 $7.5 0.8 -1.7 0.8 12.4 2.6 1.6 N/A 3.8 (DEC.’01)<br />
SUNWISE 2001 <strong>CI</strong> SIGNATURE SELECT CANADIAN BALANCED 6 E. BUSHELL / J. DUTKIEWICZ 8175 / 8275 /– $14.25 $1.6 0.8 -1.7 0.8 12.4 2.6 1.6 N/A 3.8 (DEC.’01)<br />
SUNWISE <strong>CI</strong> SIGNATURE SELECT GLOBAL INCOME & GROWTH 7 ERIC BUSHELL 8110 / 8210 /– $13.20 $2.3 -1.1 -2.7 -1.1 10.0 -1.4 -0.8 N/A 2.9 (DEC.’01)<br />
SUNWISE 2001 <strong>CI</strong> SIGNATURE SELECT GLOBAL INCOME & GROWTH 8 ERIC BUSHELL 8010 / 8910 /– $13.20 $0.2 -1.1 -2.7 -1.1 10.0 -1.4 -0.8 N/A 2.9 (DEC.’01)<br />
NAV<br />
(CDN)<br />
FUND<br />
ASSETS<br />
($MM)<br />
Y–T–D<br />
(%)<br />
1<br />
MTH<br />
(%)*<br />
6<br />
MTH<br />
(%)*<br />
1 YR<br />
(%)<br />
3 YR<br />
(%)<br />
5 YR<br />
(%)<br />
10 YR<br />
(%)<br />
SINCE<br />
INCEPTION<br />
(%)<br />
*simple rates of return 3 formerly SunWise <strong>CI</strong> Signature Select Canadian Balanced 6<br />
formerly SunWise 2001Trimark Income Growth<br />
1 formerly SunWise Trimark U.S. Companies 4 formerly SunWise 2001 <strong>CI</strong> Signature Select Canadian Balanced 7<br />
formerly SunWise Trimark Global Balanced<br />
2<br />
formerly SunWise 2001 Trimark U.S. Companies<br />
5<br />
formerly SunWise Trimark Income Growth<br />
8<br />
formerly SunWise 2001Trimark Global Balanced<br />
FOR DEALER USE ONLY<br />
MONTHLY PERFORMANCE SCORECARD AS AT JUNE 30, 2011 8 4
SunWise<br />
®<br />
II<br />
Funds<br />
Basic Guarantee cont’d<br />
Issued by Sun Life Assurance Company of Canada<br />
LEAD MANAGER<br />
CDN $<br />
FUND CODE: <strong>CI</strong>G<br />
ISC / DSC / LSC<br />
SUNWISE <strong>CI</strong> SYNERGY CANADIAN DAVID PICTON 8163 / 8263 /– $15.78 $1.0 0.3 -2.3 0.3 19.3 -2.0 2.0 N/A 6.7 (JUNE.’04)<br />
SUNWISE 2001 <strong>CI</strong> SYNERGY CANADIAN DAVID PICTON 8197 / 8297 /– $15.76 $0.0 0.1 -2.4 0.1 19.1 -2.1 2.0 N/A 6.7 (JUNE.’04)<br />
SUNWISE <strong>CI</strong> SYNERGY GLOBAL CORPORATE MICHAEL MAHONEY 8105 / 8205 /– $9.06 $0.4 1.7 -2.1 1.7 19.4 -4.3 -2.5 N/A -1.0 (DEC.’01)<br />
SUNWISE 2001 <strong>CI</strong> SYNERGY GLOBAL CORPORATE MICHAEL MAHONEY 8005 / 8905 /– $9.06 $0.5 1.7 -2.1 1.7 19.2 -4.3 -2.5 N/A -1.0 (DEC.’01)<br />
SUNWISE <strong>CI</strong> VALUE TRUST CORPORATE A. RADLO / B. SNOW 8115 / 8215 /– $5.05 $1.1 -2.1 -2.1 -2.1 9.8 -5.1 -10.7 N/A -6.9 (DEC.’01)<br />
SUNWISE 2001 <strong>CI</strong> VALUE TRUST CORPORATE A. RADLO / B. SNOW 8015 / 8915 /– $5.05 $0.1 -2.1 -2.1 -2.1 9.8 -5.1 -10.7 N/A -6.9 (DEC.’01)<br />
SUNWISE <strong>CI</strong> WORLD EQUITY JOHN HOCK 8104 / 8204 /– $8.76 $0.1 0.0 -2.4 0.0 13.8 0.2 -2.8 N/A -1.4 (DEC.’01)<br />
SUNWISE 2001 <strong>CI</strong> WORLD EQUITY JOHN HOCK 8004 / 8904 /– $8.77 $0.1 0.1 -2.4 0.1 14.0 0.3 -2.8 N/A -1.4 (DEC.’01)<br />
SUNWISE DYNAMIC POWER AMERICAN GROWTH NOAH BLACKSTEIN 8111 / 8211 /– $10.84 $0.5 15.9 2.2 15.9 51.0 5.8 7.1 N/A 0.8 (DEC.’01)<br />
SUNWISE 2001 DYNAMIC POWER AMERICAN GROWTH NOAH BLACKSTEIN 8011 / 8911 /– $10.86 $0.2 16.0 2.2 16.0 51.0 5.9 7.2 N/A 0.9 (DEC.’01)<br />
SUNWISE FIDELITY CANADIAN ASSET ALLOCATION D. YOUNG / G. STEIN 8130 / 8230 /– $17.23 $13.9 -1.9 -2.3 -1.9 11.0 0.7 4.7 N/A 5.8 (DEC.’01)<br />
SUNWISE 2001 FIDELITY CANADIAN ASSET ALLOCATION D. YOUNG / G. STEIN 8172 / 8272 /– $17.22 $3.5 -1.9 -2.2 -1.9 11.0 0.7 4.7 N/A 5.8 (DEC.’01)<br />
SUNWISE FIDELITY GLOBAL ASSET ALLOCATION MICHAEL STRONG 8109 / 8209 /– $10.26 $0.4 -1.6 -2.2 -1.6 7.7 -0.3 0.9 N/A 0.3 (DEC.’01)<br />
SUNWISE 2001 FIDELITY GLOBAL ASSET ALLOCATION MICHAEL STRONG 8009 / 8909 /– $10.26 $0.1 -1.6 -2.3 -1.6 7.7 -0.3 0.9 N/A 0.3 (DEC.’01)<br />
SUNWISE FIDELITY GROWTH AMERICA JOHN POWER 8113 / 8213 /– $6.23 $0.2 -1.1 -3.0 -1.1 15.6 -3.0 -6.3 N/A -4.8 (DEC.’01)<br />
SUNWISE 2001 FIDELITY GROWTH AMERICA JOHN POWER 8013 / 8913 /– $6.22 $0.0 -1.1 -3.0 -1.1 15.4 -3.1 -6.3 N/A -4.8 (DEC.’01)<br />
SUNWISE FIDELITY INTERNATIONAL PORTFOLIO MICHAEL STRONG 8101 / 8201 /– $8.16 $0.5 0.1 -2.5 0.1 16.2 -4.0 -4.7 N/A -2.1 (DEC.’01)<br />
SUNWISE 2001 FIDELITY INTERNATIONAL PORTFOLIO MICHAEL STRONG 8001 / 8901 /– $8.17 $0.3 0.1 -2.5 0.1 16.2 -4.0 -4.7 N/A -2.1 (DEC.’01)<br />
SUNWISE FIDELITY NORTHSTAR ® C. MO / J. TILLINGHAST 8165 / 8265 /– $10.48 $2.4 -0.8 -1.8 -0.8 14.3 -1.4 -0.5 N/A 0.8 (MAR.’05)<br />
SUNWISE 2001 FIDELITY NORTHSTAR ® C. MO / J. TILLINGHAST 8199 / 8299 /– $10.48 $1.0 -0.8 -1.8 -0.8 14.2 -1.4 -0.5 N/A 0.8 (MAR.’05)<br />
SUNWISE FIDELITY TRUE NORTH ® MAXIME LEMIEUX 8123 / 8223 /– $18.39 $7.8 -1.2 -2.7 -1.2 15.7 -4.2 3.8 N/A 6.6 (DEC.’01)<br />
SUNWISE 2001 FIDELITY TRUE NORTH ® MAXIME LEMIEUX 8023 / 8923 /– $18.39 $1.2 -1.2 -2.7 -1.2 15.6 -4.2 3.8 N/A 6.6 (DEC.’01)<br />
SUNWISE MACKENZIE CUNDILL CANADIAN BALANCED D. SLATER / L. CHIN 8128 / 8228 /– $14.99 $0.9 3.0 -1.9 3.0 16.7 7.1 4.2 N/A 4.3 (DEC.’01)<br />
SUNWISE 2001 MACKENZIE CUNDILL CANADIAN BALANCED D. SLATER / L. CHIN 8170 / 8270 /– $14.99 $0.1 3.0 -1.9 3.0 16.7 7.1 4.2 N/A 4.3 (DEC.’01)<br />
SUNWISE MACKENZIE CUNDILL CANADIAN SECURITY D. SLATER / L. CHIN 8119 / 8219 /– $15.56 $1.1 4.8 -2.7 4.8 26.7 8.7 3.7 N/A 4.7 (DEC.’01)<br />
SUNWISE 2001 MACKENZIE CUNDILL CANADIAN SECURITY D. SLATER / L. CHIN 8019 / 8919 /– $15.58 $0.2 4.8 -2.6 4.8 26.8 8.8 3.7 N/A 4.7 (DEC.’01)<br />
SUNWISE PORTFOLIO SERIES BALANCED <strong>CI</strong> INVESTMENT CONSULTING 8134 / 8234 /– $14.59 $9.2 1.2 -1.7 1.2 13.3 1.6 2.0 N/A 4.0 (DEC.’01)<br />
SUNWISE 2001 PORTFOLIO SERIES BALANCED <strong>CI</strong> INVESTMENT CONSULTING 8176 / 8276 /– $14.59 $1.1 1.2 -1.7 1.2 13.3 1.6 2.0 N/A 4.0 (DEC.’01)<br />
SUNWISE PORTFOLIO SERIES BALANCED GROWTH <strong>CI</strong> INVESTMENT CONSULTING 8158 / 8258 /– $14.79 $5.4 0.9 -1.8 0.9 14.5 1.2 1.7 N/A 4.8 (JAN.’03)<br />
SUNWISE 2001 PORTFOLIO SERIES BALANCED GROWTH <strong>CI</strong> INVESTMENT CONSULTING 8192 / 8292 /– $14.79 $0.3 0.9 -1.8 0.9 14.5 1.2 1.7 N/A 4.8 (JAN.’03)<br />
SUNWISE PORTFOLIO SERIES CONSERVATIVE <strong>CI</strong> INVESTMENT CONSULTING 8135 / 8235 /– $15.12 $5.2 1.7 -1.4 1.7 11.5 2.8 2.8 N/A 4.4 (DEC.’01)<br />
SUNWISE 2001 PORTFOLIO SERIES CONSERVATIVE <strong>CI</strong> INVESTMENT CONSULTING 8177 / 8277 /– $15.13 $0.5 1.7 -1.4 1.7 11.5 2.9 2.9 N/A 4.4 (DEC.’01)<br />
SUNWISE PORTFOLIO SERIES CONSERVATIVE BALANCED <strong>CI</strong> INVESTMENT CONSULTING 8157 / 8257 /– $15.15 $2.7 1.5 -1.6 1.5 12.2 2.3 2.4 N/A 5.1 (JAN.’03)<br />
SUNWISE 2001 PORTFOLIO SERIES CONSERVATIVE BALANCED <strong>CI</strong> INVESTMENT CONSULTING 8191 / 8291 /– $15.14 $0.1 1.5 -1.6 1.5 12.2 2.3 2.4 N/A 5.0 (JAN.’03)<br />
SUNWISE PORTFOLIO SERIES GROWTH <strong>CI</strong> INVESTMENT CONSULTING 8139 / 8239 /– $11.91 $3.6 0.5 -2.1 0.5 15.1 -0.1 0.8 N/A 1.8 (DEC.’01)<br />
SUNWISE 2001 PORTFOLIO SERIES GROWTH <strong>CI</strong> INVESTMENT CONSULTING 8181 / 8281 /– $11.91 $0.3 0.5 -2.1 0.5 15.2 -0.1 0.8 N/A 1.8 (DEC.’01)<br />
SUNWISE PORTFOLIO SERIES INCOME <strong>CI</strong> INVESTMENT CONSULTING 8137 / 8237 /– $15.73 $3.7 2.7 -1.1 2.7 10.2 5.2 4.2 N/A 4.8 (DEC.’01)<br />
SUNWISE 2001 PORTFOLIO SERIES INCOME <strong>CI</strong> INVESTMENT CONSULTING 8179 / 8279 /– $15.73 $0.8 2.7 -1.1 2.7 10.2 5.2 4.2 N/A 4.8 (DEC.’01)<br />
SUNWISE PORTFOLIO SERIES MAXIMUM GROWTH <strong>CI</strong> INVESTMENT CONSULTING 8159 / 8259 /– $14.61 $0.5 0.1 -2.3 0.1 17.4 -1.6 -0.1 N/A 4.6 (JAN.’03)<br />
SUNWISE 2001 PORTFOLIO SERIES MAXIMUM GROWTH <strong>CI</strong> INVESTMENT CONSULTING 8193 / 8293 /– $14.61 $0.0 0.1 -2.4 0.1 17.4 -1.6 -0.1 N/A 4.6 (JAN.’03)<br />
SUNWISE PORTFOLIO SERIES SUMMIT BALANCED GROWTH <strong>CI</strong> INVESTMENT CONSULTING 8136 / 8236 /– $15.42 $0.3 0.9 -1.9 0.9 14.6 1.4 1.8 N/A 4.6 (DEC.’01)<br />
SUNWISE 2001 PORTFOLIO SERIES SUMMIT BALANCED GROWTH <strong>CI</strong> INVESTMENT CONSULTING 8178 / 8278 /– $15.43 $0.1 1.0 -1.8 1.0 14.6 1.4 1.8 N/A 4.6 (DEC.’01)<br />
SUNWISE PORTFOLIO SERIES SUMMIT MAXIMUM GROWTH <strong>CI</strong> INVESTMENT CONSULTING 8138 / 8238 /– $13.58 $0.1 0.3 -2.4 0.3 17.6 -1.4 0.2 N/A 3.2 (DEC.’01)<br />
SUNWISE 2001 PORTFOLIO SERIES SUMMIT MAXIMUM GROWTH <strong>CI</strong> INVESTMENT CONSULTING 8180 / 8280 /– $13.61 $0.0 0.4 -2.3 0.4 17.8 -1.4 0.3 N/A 3.3 (DEC.’01)<br />
SUNWISE US. MARKET INDEX TD ASSET MGNT INC. 8118 / 8218 /– $6.70 $0.2 1.4 -2.3 1.4 14.9 -0.9 -2.4 N/A -4.1 (DEC.’01)<br />
SUNWISE 2001 US. MARKET INDEX TD ASSET MGNT INC. 8018 / 8918 /– $6.70 $0.0 1.5 -2.2 1.5 14.9 -0.9 -2.4 N/A -4.1 (DEC.’01)<br />
NAV<br />
(CDN)<br />
FUND<br />
ASSETS<br />
($MM)<br />
Y–T–D<br />
(%)<br />
1<br />
MTH<br />
(%)*<br />
6<br />
MTH<br />
(%)*<br />
1 YR<br />
(%)<br />
3 YR<br />
(%)<br />
5 YR<br />
(%)<br />
10 YR<br />
(%)<br />
SINCE<br />
INCEPTION<br />
(%)<br />
*simple rates of return<br />
FOR DEALER USE ONLY<br />
MONTHLY PERFORMANCE SCORECARD AS AT JUNE 30, 2011 8 5
SunWise<br />
®<br />
II<br />
Funds<br />
Combined Guarantee<br />
Issued by Sun Life Assurance Company of Canada<br />
LEAD MANAGER<br />
CDN $<br />
FUND CODE: <strong>CI</strong>G<br />
ISC / DSC / LSC<br />
SUNWISE AIC AMERICAN FOCUSED ROGER HAMILTON 8312 / 8412 /– $6.43 $0.4 -0.5 -3.6 -0.5 17.3 0.6 -9.7 N/A -4.5 (DEC.’01)<br />
SUNWISE 2001 AIC AMERICAN FOCUSED ROGER HAMILTON 8042 / 8942 /– $6.42 $0.0 -0.6 -3.6 -0.6 17.2 0.6 -9.8 N/A -4.5 (DEC.’01)<br />
SUNWISE AIC DIVERSIFIED CANADA JAMES COLE 8320 / 8420 /– $10.17 $0.2 1.6 -4.4 1.6 11.4 -3.8 -2.3 N/A 0.2 (DEC.’01)<br />
SUNWISE 2001 AIC DIVERSIFIED CANADA JAMES COLE 8050 / 8950 /– $10.16 $0.0 1.5 -4.4 1.5 11.2 -3.9 -2.3 N/A 0.2 (DEC.’01)<br />
SUNWISE BOND INDEX TD ASSET MGNT INC. 8352 / 8452 /– $14.78 $1.5 1.3 -0.1 1.3 2.7 4.2 4.2 N/A 4.2 (DEC.’01)<br />
SUNWISE 2001 BOND INDEX TD ASSET MGNT INC. 8386 / 8486 /– $14.80 $0.1 1.3 -0.1 1.3 2.8 4.3 4.2 N/A 4.2 (DEC.’01)<br />
SUNWISE CANADIAN EQUITY INDEX TD ASSET MGNT INC. 8327 / 8427 /– $16.93 $0.7 -1.5 -3.5 -1.5 17.1 -2.9 2.6 N/A 5.7 (DEC.’01)<br />
SUNWISE 2001 CANADIAN EQUITY INDEX TD ASSET MGNT INC. 8369 / 8469 /– $16.94 $0.1 -1.4 -3.5 -1.4 17.1 -2.9 2.6 N/A 5.7 (DEC.’01)<br />
SUNWISE <strong>CI</strong> AMERICAN GROWTH A. RADLO / B. SNOW 8314 / 8414 /– $4.54 $0.1 -2.4 -2.2 -2.4 9.4 -5.5 -11.2 N/A -7.9 (DEC.’01)<br />
SUNWISE 2001 <strong>CI</strong> AMERICAN GROWTH A. RADLO / B. SNOW 8044 / 8944 /– $4.54 $0.2 -2.4 -2.2 -2.4 9.4 -5.5 -11.2 N/A -7.9 (DEC.’01)<br />
SUNWISE <strong>CI</strong> AMERICAN VALUE W. PRIEST / D. PEARL 8316 / 8416 /– $9.10 $0.4 2.4 -2.5 2.4 15.9 -2.3 -0.6 N/A -1.0 (DEC.’01)<br />
SUNWISE 2001 <strong>CI</strong> AMERICAN VALUE W. PRIEST / D. PEARL 8046 / 8946 /– $9.12 $0.3 2.4 -2.5 2.4 16.0 -2.3 -0.6 N/A -1.0 (DEC.’01)<br />
SUNWISE <strong>CI</strong> CAMBRIDGE CORE CANADIAN EQUITY CORPORATE 1 ALAN RADLO 8321 / 8421 /– $15.42 $1.9 3.4 -1.5 3.4 24.6 -2.9 -1.7 N/A 4.6 (DEC.’01)<br />
SUNWISE 2001 <strong>CI</strong> CAMBRIDGE CORE CANADIAN EQUITY CORPORATE 2 ALAN RADLO 8051 / 8951 /– $15.40 $0.2 3.4 -1.5 3.4 24.5 -3.0 -1.7 N/A 4.6 (DEC.’01)<br />
SUNWISE <strong>CI</strong> CAMBRIDGE CORE GLOBAL EQUITY CORPORATE 3 ALAN RADLO 8306 / 8406 /– $8.48 $2.8 -0.2 -1.2 -0.2 13.1 -4.8 -5.4 N/A -1.7 (DEC.’01)<br />
SUNWISE 2001 <strong>CI</strong> CAMBRIDGE CORE GLOBAL EQUITY CORPORATE 4 ALAN RADLO 8036 / 8936 /– $8.48 $0.7 -0.4 -1.3 -0.4 12.9 -4.8 -5.4 N/A -1.7 (DEC.’01)<br />
SUNWISE <strong>CI</strong> CANADIAN EQUITY DANIEL BUBIS 8325 / 8425 /– $16.43 $0.0 0.6 -2.3 0.6 19.2 0.2 2.5 N/A 5.3 (DEC.’01)<br />
SUNWISE 2001 <strong>CI</strong> CANADIAN EQUITY DANIEL BUBIS 8367 / 8467 /– $16.50 $0.2 0.7 -2.3 0.7 19.3 0.4 2.6 N/A 5.4 (DEC.’01)<br />
SUNWISE <strong>CI</strong> CANADIAN INVESTMENT FUND DANIEL BUBIS 8326 / 8426 /– $19.31 $20.4 0.6 -2.3 0.6 19.3 0.3 2.5 N/A 7.1 (DEC.’01)<br />
SUNWISE 2001 <strong>CI</strong> CANADIAN INVESTMENT FUND DANIEL BUBIS 8368 / 8468 /– $19.34 $3.0 0.7 -2.3 0.7 19.4 0.4 2.5 N/A 7.1 (DEC.’01)<br />
SUNWISE <strong>CI</strong> DIVIDEND ERIC BUSHELL 8350 / 8450 /– $16.79 $0.0 3.3 -1.8 3.3 15.0 5.9 3.1 N/A 5.6 (DEC.’01)<br />
SUNWISE 2001 <strong>CI</strong> DIVIDEND ERIC BUSHELL 8384 / 8484 /– $16.81 $0.7 3.4 -1.8 3.4 15.2 5.9 3.1 N/A 5.6 (DEC.’01)<br />
SUNWISE <strong>CI</strong> GLOBAL E. BUSHELL / S. VALI 8302 / 8402 /– $8.39 $0.4 -1.5 -2.3 -1.5 15.6 -5.0 -4.7 N/A -1.8 (DEC.’01)<br />
SUNWISE 2001 <strong>CI</strong> GLOBAL E. BUSHELL / S. VALI 8032 / 8932 /– $8.40 $0.1 -1.4 -2.3 -1.4 15.7 -5.0 -4.6 N/A -1.8 (DEC.’01)<br />
SUNWISE <strong>CI</strong> GLOBAL BOND J. DUTKIEWICZ / J. SHAW 8360 / 8460 /– $10.72 $0.2 1.5 -0.2 1.5 1.3 5.4 5.1 N/A 0.8 (JAN.’03)<br />
SUNWISE 2001 <strong>CI</strong> GLOBAL BOND J. DUTKIEWICZ / J. SHAW 8394 / 8494 /– $10.72 $0.0 1.5 -0.2 1.5 1.2 5.4 5.1 N/A 0.8 (JAN.’03)<br />
SUNWISE <strong>CI</strong> GLOBAL VALUE JOHN HOCK 8303 / 8403 /– $7.60 $0.5 -0.3 -2.6 -0.3 13.4 -0.1 -3.2 N/A -2.8 (DEC.’01)<br />
SUNWISE 2001 <strong>CI</strong> GLOBAL VAVLUE JOHN HOCK 8033 / 8933 /– $7.60 $0.1 -0.1 -2.4 -0.1 13.4 -0.1 -3.2 N/A -2.8 (DEC.’01)<br />
SUNWISE <strong>CI</strong> HARBOUR G. COLEMAN / S. JENKINS 8322 / 8422 /– $19.10 $14.7 0.2 -1.8 0.2 16.5 -0.1 3.1 N/A 7.0 (DEC.’01)<br />
SUNWISE 2001 <strong>CI</strong> HARBOUR G. COLEMAN / S. JENKINS 8052 / 8952 /– $19.11 $2.2 0.3 -1.7 0.3 16.6 -0.1 3.2 N/A 7.0 (DEC.’01)<br />
SUNWISE <strong>CI</strong> HARBOUR GROWTH & INCOME G. COLEMAN / S. JENKINS 8329 / 8429 /– $17.07 $22.2 -0.5 -1.4 -0.5 13.0 0.2 2.6 N/A 5.7 (DEC.’01)<br />
SUNWISE 2001 <strong>CI</strong> HARBOUR GROWTH & INCOME G. COLEMAN / S. JENKINS 8371 / 8471 /– $17.07 $3.6 -0.4 -1.4 -0.4 13.0 0.2 2.6 N/A 5.7 (DEC.’01)<br />
SUNWISE <strong>CI</strong> INTERNATIONAL BUSHELL / D’ANGELO / BRODEUR 8354 / 8454 /– $12.28 $0.4 -1.4 -2.8 -1.4 14.2 -7.8 -5.7 N/A 2.5 (JAN.’03)<br />
SUNWISE 2001 <strong>CI</strong> INTERNATIONAL BUSHELL / D’ANGELO / BRODEUR 8388 / 8488 /– $12.30 $0.0 -1.2 -2.7 -1.2 14.4 -7.8 -5.7 N/A 2.5 (JAN.’03)<br />
SUNWISE <strong>CI</strong> INTERNATIONAL BALANCED E. BUSHELL / J. DUTKIEWICZ 8355 / 8455 /– $12.03 $0.2 -1.0 -1.6 -1.0 11.1 -0.4 -0.2 N/A 2.2 (JAN.’03)<br />
SUNWISE 2001 <strong>CI</strong> INTERNATIONAL BALANCED E. BUSHELL / J. DUTKIEWICZ 8389 / 8489 /– $12.04 $0.1 -1.0 -1.6 -1.0 11.1 -0.3 -0.1 N/A 2.2 (JAN.’03)<br />
SUNWISE <strong>CI</strong> INTERNATIONAL BALANCED CORPORATE E. BUSHELL / J. DUTKIEWICZ 8308 / 8408 /– $9.30 $0.1 0.2 -1.8 0.2 12.3 -0.5 -0.9 N/A -0.8 (DEC.’01)<br />
SUNWISE 2001 <strong>CI</strong> INTERNATIONAL BALANCED CORPORATE E. BUSHELL / J. DUTKIEWICZ 8038 / 8938 /– $9.31 $0.0 0.3 -1.8 0.3 12.6 -0.5 -0.9 N/A -0.7 (DEC.’01)<br />
SUNWISE <strong>CI</strong> INTERNATIONAL VALUE JOHN HOCK 8307 / 8407 /– $9.63 $0.4 0.3 -1.6 0.3 14.5 -0.5 -2.7 N/A -0.4 (DEC.’01)<br />
SUNWISE 2001 <strong>CI</strong> INTERNATIONAL VALUE JOHN HOCK 8037 / 8937 /– $9.65 $0.0 0.4 -1.6 0.4 14.7 -0.4 -2.7 N/A -0.4 (DEC.’01)<br />
SUNWISE <strong>CI</strong> MONEY MARKET PAUL SIMON 8353 / 8453 /– $11.51 $3.2 0.3 0.1 0.3 0.3 0.3 1.4 N/A 1.5 (DEC.’01)<br />
SUNWISE 2001 <strong>CI</strong> MONEY MARKET PAUL SIMON 8387 / 8487 /– $11.51 $0.2 0.2 0.0 0.2 0.3 0.3 1.4 N/A 1.5 (DEC.’01)<br />
SUNWISE <strong>CI</strong> PREMIER AMERICAN VALUE CORPORATE 5 W. PRIEST / D. PEARL 8317 / 8417 /– $7.04 $0.2 2.6 -2.4 2.6 16.7 1.4 -1.1 N/A -3.6 (DEC.’01)<br />
SUNWISE 2001 <strong>CI</strong> PREMIER AMERICAN VALUE CORPORATE 6 W. PRIEST / D. PEARL 8047 / 8947 /– $7.03 $0.0 2.6 -2.4 2.6 16.6 1.4 -1.2 N/A -3.6 (DEC.’01)<br />
SUNWISE <strong>CI</strong> SIGNATURE CANADIAN BALANCED E. BUSHELL / J. DUTKIEWICZ 8331 / 8431 /– $17.57 $4.1 0.7 -1.6 0.7 13.5 3.5 4.8 N/A 6.1 (DEC.’01)<br />
SUNWISE 2001 <strong>CI</strong> SIGNATURE CANADIAN BALANCED E. BUSHELL / J. DUTKIEWICZ 8373 / 8473 /– $17.58 $1.2 0.7 -1.6 0.7 13.6 3.6 4.8 N/A 6.1 (DEC.’01)<br />
*simple rates of return<br />
1<br />
formerly SunWise Trimark Canadian First Class<br />
4<br />
formerly SunWise 2001 Trimark Select Growth<br />
2<br />
formerly SunWise 2001 Trimark Canadian First Class 5 formerly SunWise Trimark U.S. Companies<br />
NAV<br />
(CDN)<br />
FUND<br />
ASSETS<br />
($MM)<br />
Y–T–D<br />
(%)<br />
1<br />
MTH<br />
(%)*<br />
6<br />
MTH<br />
(%)*<br />
1 YR<br />
(%)<br />
3 YR<br />
(%)<br />
5 YR<br />
(%)<br />
10 YR<br />
(%)<br />
SINCE<br />
INCEPTION<br />
(%)<br />
3<br />
formerly SunWise Trimark Select Growth<br />
6<br />
formerly SunWise 2001 Trimark U.S. Companies<br />
FOR DEALER USE ONLY<br />
MONTHLY PERFORMANCE SCORECARD AS AT JUNE 30, 2011 8 6
SunWise<br />
®<br />
II<br />
Funds<br />
Combined Guarantee cont’d<br />
Issued by Sun Life Assurance Company of Canada<br />
LEAD MANAGER<br />
CDN $<br />
FUND CODE: <strong>CI</strong>G<br />
ISC / DSC / LSC<br />
SUNWISE <strong>CI</strong> SIGNATURE CANADIAN BOND JAMES DUTKIEWICZ 8362 / 8462 /– $13.49 $4.3 1.4 -0.3 1.4 2.6 4.2 4.0 N/A 3.6 (JAN.’03)<br />
SUNWISE 2001 <strong>CI</strong> SIGNATURE CANADIAN BOND JAMES DUTKIEWICZ 8396 / 8496 /– $13.50 $0.2 1.4 -0.3 1.4 2.7 4.2 4.0 N/A 3.6 (JAN.’03)<br />
SUNWISE <strong>CI</strong> SIGNATURE CANADIAN PREMIER BOND JAMES DUTKIEWICZ 8349 / 8449 /– $14.09 $0.0 1.3 -0.4 1.3 2.5 4.0 3.8 N/A 3.6 (DEC.’01)<br />
SUNWISE 2001 <strong>CI</strong> SIGNATURE CANADIAN PREMIER BOND JAMES DUTKIEWICZ 8383 / 8483 /– $14.12 $0.7 1.4 -0.3 1.4 2.5 4.1 3.9 N/A 3.7 (DEC.’01)<br />
SUNWISE <strong>CI</strong> SIGNATURE DIVIDEND ERIC BUSHELL 8361 / 8461 /– $16.08 $14.3 3.3 -1.8 3.3 14.9 5.8 2.9 N/A 5.8 (JAN.’03)<br />
SUNWISE 2001 <strong>CI</strong> SIGNATURE DIVIDEND ERIC BUSHELL 8395 / 8495 /– $16.07 $0.7 3.3 -1.8 3.3 15.0 5.8 2.9 N/A 5.8 (JAN.’03)<br />
SUNWISE <strong>CI</strong> SIGNATURE HIGH INCOME ERIC BUSHELL 8348 / 8448 /– $23.17 $26.7 3.9 -1.5 3.9 17.0 5.3 4.3 N/A 9.2 (DEC.’01)<br />
SUNWISE 2001 <strong>CI</strong> SIGNATURE HIGH INCOME ERIC BUSHELL 8382 / 8482 /– $23.19 $2.6 3.9 -1.5 3.9 17.0 5.3 4.3 N/A 9.2 (DEC.’01)<br />
SUNWISE <strong>CI</strong> SIGNATURE INCOME & GROWTH E. BUSHELL / J. DUTKIEWICZ 8364 / 8464 /– $14.49 $5.9 1.2 -1.8 1.2 14.5 3.2 4.1 N/A 6.1 (MAR.’05)<br />
SUNWISE 2001 <strong>CI</strong> SIGNATURE INCOME & GROWTH E. BUSHELL / J. DUTKIEWICZ 8398 / 8498 /– $14.49 $0.5 1.1 -1.8 1.1 14.5 3.2 4.1 N/A 6.1 (MAR.’05)<br />
SUNWISE <strong>CI</strong> SIGNATURE SHORT-TERM BOND J. DUTKIEWICZ / P. SIMON 8351 / 8451 /– $12.09 $0.0 0.6 -0.2 0.6 0.2 1.6 2.2 N/A 2.0 (DEC.’01)<br />
SUNWISE 2001 <strong>CI</strong> SIGNATURE SHORT-TERM BOND J. DUTKIEWICZ / P. SIMON 8385 / 8485 /– $12.15 $0.1 0.7 -0.2 0.7 0.5 1.8 2.3 N/A 2.1 (DEC.’01)<br />
SUNWISE <strong>CI</strong> SIGNATURE SELECT CANADIAN ERIC BUSHELL 8324 / 8424 /– $19.54 $6.6 0.5 -2.3 0.5 17.7 0.9 3.7 N/A 7.2 (DEC.’01)<br />
SUNWISE 2001 <strong>CI</strong> SIGNATURE SELECT CANADIAN ERIC BUSHELL 8366 / 8466 /– $19.56 $0.7 0.5 -2.2 0.5 17.8 1.0 3.7 N/A 7.3 (DEC.’01)<br />
SUNWISE <strong>CI</strong> SIGNATURE PREMIER CANADIAN BALANCED 1 ERIC BUSHELL 8332 / 8432 /– $17.25 $1.8 0.7 -1.7 0.7 13.5 3.4 4.1 N/A 5.9 (DEC.’01)<br />
SUNWISE 2001 <strong>CI</strong> SIGNATURE PREMIER CANADIAN BALANCED 2 ERIC BUSHELL 8374 / 8474 /– $17.27 $0.2 0.8 -1.7 0.8 13.6 3.4 4.1 N/A 5.9 (DEC.’01)<br />
SUNWISE <strong>CI</strong> SIGNATURE SELECT CANADIAN BALANCED 3 E. BUSHELL / J. DUTKIEWICZ 8333 / 8433 /– $13.99 $8.3 0.6 -1.8 0.6 12.1 2.4 1.5 N/A 3.6 (DEC.’01)<br />
SUNWISE 2001 <strong>CI</strong> SIGNATURE SELECT CANADIAN BALANCED 4 E. BUSHELL / J. DUTKIEWICZ 8375 / 8475 /– $14.00 $1.6 0.7 -1.7 0.7 12.2 2.4 1.5 N/A 3.6 (DEC.’01)<br />
SUNWISE <strong>CI</strong> SIGNATURE SELECT GLOBAL INCOME & GROWTH 5 ERIC BUSHELL 8310 / 8410 /– $13.05 $2.5 -1.2 -2.8 -1.2 9.7 -1.5 -0.9 N/A 2.8 (DEC.’01)<br />
SUNWISE 2001 <strong>CI</strong> SIGNATURE SELECT GLOBAL INCOME & GROWTH 6 ERIC BUSHELL 8040 / 8940 /– $13.05 $0.1 -1.2 -2.7 -1.2 9.7 -1.5 -0.9 N/A 2.8 (DEC.’01)<br />
SUNWISE <strong>CI</strong> SYNERGY AMERICAN DAVID PICTON 8356 / 8456 /– $11.39 $0.1 1.9 -2.6 1.9 17.7 -4.3 -2.8 N/A 1.6 (JAN.’03)<br />
SUNWISE 2001 <strong>CI</strong> SYNERGY AMERICAN DAVID PICTON 8390 / 8490 /– $11.39 $0.0 1.9 -2.6 1.9 17.7 -4.3 -2.8 N/A 1.6 (JAN.’03)<br />
SUNWISE <strong>CI</strong> SYNERGY CANADIAN DAVID PICTON 8363 / 8463 /– $15.58 $0.8 0.1 -2.3 0.1 18.9 -2.3 1.7 N/A 6.5 (JUNE.’04)<br />
SUNWISE 2001 <strong>CI</strong> SYNERGY CANADIAN DAVID PICTON 8397 / 8497 /– $15.57 $0.0 0.1 -2.4 0.1 18.9 -2.3 1.7 N/A 6.5 (JUNE.’04)<br />
SUNWISE <strong>CI</strong> SYNERGY GLOBAL CORPORATE MICHAEL MAHONEY 8305 / 8405 /– $8.70 $0.5 1.5 -2.1 1.5 18.9 -4.7 -2.8 N/A -1.4 (DEC.’01)<br />
SUNWISE 2001 <strong>CI</strong> SYNERGY GLOBAL CORPORATE MICHAEL MAHONEY 8035 / 8935 /– $8.71 $0.2 1.5 -2.0 1.5 18.8 -4.6 -2.8 N/A -1.4 (DEC.’01)<br />
SUNWISE <strong>CI</strong> VALUE TRUST CORPORATE A. RADLO / B. SNOW 8315 / 8415 /– $4.91 $0.5 -2.4 -2.2 -2.4 9.1 -5.5 -11.1 N/A -7.2 (DEC.’01)<br />
SUNWISE 2001 <strong>CI</strong> VALUE TRUST CORPORATE A. RADLO / B. SNOW 8045 / 8945 /– $4.92 $0.1 -2.2 -2.2 -2.2 9.3 -5.4 -11.1 N/A -7.1 (DEC.’01)<br />
SUNWISE <strong>CI</strong> WORLD EQUITY JOHN HOCK 8304 / 8404 /– $8.44 $0.1 -0.2 -2.5 -0.2 13.4 -0.2 -3.2 N/A -1.8 (DEC.’01)<br />
SUNWISE 2001 <strong>CI</strong> WORLD EQUITY JOHN HOCK 8034 / 8934 /– $8.45 $0.0 -0.2 -2.4 -0.2 13.4 -0.2 -3.2 N/A -1.8 (DEC.’01)<br />
SUNWISE DYNAMIC POWER AMERICAN GROWTH NOAH BLACKSTEIN 8311 / 8411 /– $10.45 $0.3 15.6 2.1 15.6 50.1 5.4 6.7 N/A 0.5 (DEC.’01)<br />
SUNWISE 2001 DYNAMIC POWER AMERICAN GROWTH NOAH BLACKSTEIN 8041 / 8941 /– $10.46 $0.1 15.6 2.0 15.6 50.1 5.4 6.7 N/A 0.5 (DEC.’01)<br />
SUNWISE FIDELITY CANADIAN ASSET ALLOCATION D. YOUNG / G. STEIN 8330 / 8430 /– $16.95 $11.2 -2.0 -2.2 -2.0 10.8 0.6 4.5 N/A 5.7 (DEC.’01)<br />
SUNWISE 2001 FIDELITY CANADIAN ASSET ALLOCATION D. YOUNG / G. STEIN 8372 / 8472 /– $16.95 $2.4 -2.0 -2.2 -2.0 10.8 0.6 4.5 N/A 5.7 (DEC.’01)<br />
SUNWISE FIDELITY GLOBAL ASSET ALLOCATION MICHAEL STRONG 8309 / 8409 /– $10.08 $0.5 -1.8 -2.3 -1.8 7.5 -0.5 0.8 N/A 0.1 (DEC.’01)<br />
SUNWISE 2001 FIDELITY GLOBAL ASSET ALLOCATION MICHAEL STRONG 8039 / 8939 /– $10.10 $0.0 -1.7 -2.2 -1.7 7.6 -0.5 0.8 N/A 0.1 (DEC.’01)<br />
SUNWISE FIDELITY GROWTH AMERICA JOHN POWER 8313 / 8413 /– $6.04 $0.1 -1.3 -3.0 -1.3 15.0 -3.4 -6.7 N/A -5.1 (DEC.’01)<br />
SUNWISE 2001 FIDELITY GROWTH AMERICA JOHN POWER 8043 / 8943 /– $6.04 $0.0 -1.3 -3.0 -1.3 15.0 -3.4 -6.7 N/A -5.1 (DEC.’01)<br />
SUNWISE FIDELITY INTERNATIONAL PORTFOLIO MICHAEL STRONG 8301 / 8401 /– $7.82 $0.5 -0.1 -2.6 -0.1 15.7 -4.4 -5.1 N/A -2.5 (DEC.’01)<br />
SUNWISE 2001 FIDELITY INTERNATIONAL PORTFOLIO MICHAEL STRONG 8031 / 8931 /– $7.85 $0.3 -0.1 -2.5 -0.1 16.0 -4.3 -5.0 N/A -2.5 (DEC.’01)<br />
SUNWISE FIDELITY NORTHSTAR ® C. MO / J. TILLINGHAST 8365 / 8465 /– $10.24 $1.9 -0.9 -1.7 -0.9 13.9 -1.7 -0.8 N/A 0.4 (MAR.’05)<br />
SUNWISE 2001 FIDELITY NORTHSTAR ® C. MO / J. TILLINGHAST 8399 / 8499 /– $10.24 $0.2 -0.9 -1.7 -0.9 13.9 -1.7 -0.8 N/A 0.4 (MAR.’05)<br />
SUNWISE FIDELITY TRUE NORTH ® MAXIME LEMIEUX 8323 / 8423 /– $17.78 $5.0 -1.3 -2.7 -1.3 15.2 -4.4 3.5 N/A 6.2 (DEC.’01)<br />
SUNWISE 2001 FIDELITY TRUE NORTH ® MAXIME LEMIEUX 8053 / 8953 /– $17.80 $0.7 -1.3 -2.7 -1.3 15.4 -4.4 3.5 N/A 6.2 (DEC.’01)<br />
SUNWISE MACKENZIE CUNDILL CANADIAN BALANCED D. SLATER / L. CHIN 8328 / 8428 /– $14.71 $1.7 2.9 -1.9 2.9 16.6 7.0 4.1 N/A 4.1 (DEC.’01)<br />
SUNWISE 2001 MACKENZIE CUNDILL CANADIAN BALANCED D. SLATER / L. CHIN 8370 / 8470 /– $14.71 $0.1 2.9 -1.9 2.9 16.6 7.0 4.1 N/A 4.1 (DEC.’01)<br />
NAV<br />
(CDN)<br />
FUND<br />
ASSETS<br />
($MM)<br />
Y–T–D<br />
(%)<br />
1<br />
MTH<br />
(%)*<br />
6<br />
MTH<br />
(%)*<br />
1 YR<br />
(%)<br />
3 YR<br />
(%)<br />
5 YR<br />
(%)<br />
10 YR<br />
(%)<br />
SINCE<br />
INCEPTION<br />
(%)<br />
*simple rates of return 3 formerly SunWise Trimark Income Growth 5<br />
formerly SunWise Trimark Global Balanced<br />
1 formerly SunWise <strong>CI</strong> Signature Select Canadian Balanced 4 formerly SunWise 2001Trimark Income Growths 6<br />
formerly SunWise 2001Trimark Global Balanced<br />
2<br />
formerly SunWise 2001 <strong>CI</strong> Signature Select Canadian Balanced<br />
FOR DEALER USE ONLY<br />
MONTHLY PERFORMANCE SCORECARD AS AT JUNE 30, 2011 8 7
SunWise<br />
®<br />
II<br />
Funds<br />
Combined Guarantee cont’d<br />
Issued by Sun Life Assurance Company of Canada<br />
LEAD MANAGER<br />
CDN $<br />
FUND CODE: <strong>CI</strong>G<br />
ISC / DSC / LSC<br />
SUNWISE MACKENZIE CUNDILL CANADIAN SECURITY D. SLATER / L. CHIN 8319 / 8419 /– $15.06 $0.9 4.7 -2.7 4.7 26.6 8.5 3.4 N/A 4.4 (DEC.’01)<br />
SUNWISE 2001 MACKENZIE CUNDILL CANADIAN SECURITY D. SLATER / L. CHIN 8049 / 8949 /– $15.06 $0.2 4.7 -2.7 4.7 26.6 8.5 3.4 N/A 4.4 (DEC.’01)<br />
SUNWISE PORTFOLIO SERIES BALANCED <strong>CI</strong> INVESTMENT CONSULTING 8334 / 8434 /– $14.35 $17.4 1.1 -1.7 1.1 13.1 1.5 1.9 N/A 3.8 (DEC.’01)<br />
SUNWISE 2001 PORTFOLIO SERIES BALANCED <strong>CI</strong> INVESTMENT CONSULTING 8376 / 8476 /– $14.35 $1.4 1.1 -1.7 1.1 13.0 1.5 1.9 N/A 3.8 (DEC.’01)<br />
SUNWISE PORTFOLIO SERIES BALANCED GROWTH <strong>CI</strong> INVESTMENT CONSULTING 8358 / 8458 /– $14.63 $8.9 0.8 -1.8 0.8 14.2 1.0 1.5 N/A 4.6 (JAN.’03)<br />
SUNWISE 2001 PORTFOLIO SERIES BALANCED GROWTH <strong>CI</strong> INVESTMENT CONSULTING 8392 / 8492 /– $14.64 $0.1 0.8 -1.8 0.8 14.2 1.0 1.5 N/A 4.6 (JAN.’03)<br />
SUNWISE PORTFOLIO SERIES CONSERVATIVE <strong>CI</strong> INVESTMENT CONSULTING 8335 / 8435 /– $14.82 $13.9 1.6 -1.4 1.6 11.3 2.7 2.7 N/A 4.2 (DEC.’01)<br />
SUNWISE 2001 PORTFOLIO SERIES CONSERVATIVE <strong>CI</strong> INVESTMENT CONSULTING 8377 / 8477 /– $14.82 $1.3 1.6 -1.4 1.6 11.3 2.7 2.7 N/A 4.2 (DEC.’01)<br />
SUNWISE PORTFOLIO SERIES CONSERVATIVE BALANCED <strong>CI</strong> INVESTMENT CONSULTING 8357 / 8457 /– $15.11 $8.0 1.3 -1.6 1.3 11.9 2.1 2.2 N/A 5.0 (JAN.’03)<br />
SUNWISE 2001 PORTFOLIO SERIES CONSERVATIVE BALANCED <strong>CI</strong> INVESTMENT CONSULTING 8391 / 8491 /– $15.12 $0.6 1.3 -1.6 1.3 12.0 2.2 2.3 N/A 5.0 (JAN.’03)<br />
SUNWISE PORTFOLIO SERIES GROWTH <strong>CI</strong> INVESTMENT CONSULTING 8339 / 8439 /– $11.48 $3.6 0.4 -2.0 0.4 14.9 -0.4 0.5 N/A 1.5 (DEC.’01)<br />
SUNWISE 2001 PORTFOLIO SERIES GROWTH <strong>CI</strong> INVESTMENT CONSULTING 8381 / 8481 /– $11.47 $0.1 0.3 -2.1 0.3 14.7 -0.4 0.5 N/A 1.4 (DEC.’01)<br />
SUNWISE PORTFOLIO SERIES INCOME <strong>CI</strong> INVESTMENT CONSULTING 8337 / 8437 /– $15.56 $9.3 2.6 -1.1 2.6 10.2 5.1 4.2 N/A 4.7 (DEC.’01)<br />
SUNWISE 2001 PORTFOLIO SERIES INCOME <strong>CI</strong> INVESTMENT CONSULTING 8379 / 8479 /– $15.56 $0.8 2.7 -1.1 2.7 10.2 5.1 4.2 N/A 4.7 (DEC.’01)<br />
SUNWISE PORTFOLIO SERIES MAXIMUM GROWTH <strong>CI</strong> INVESTMENT CONSULTING 8359 / 8459 /– $14.39 $1.2 0.0 -2.4 0.0 17.1 -1.9 -0.4 N/A 4.4 (JAN.’03)<br />
SUNWISE 2001 PORTFOLIO SERIES MAXIMUM GROWTH <strong>CI</strong> INVESTMENT CONSULTING 8393 / 8493 /– $14.39 $0.1 0.0 -2.4 0.0 17.1 -1.9 -0.4 N/A 4.4 (JAN.’03)<br />
SUNWISE PORTFOLIO SERIES SUMMIT BALANCED GROWTH <strong>CI</strong> INVESTMENT CONSULTING 8336 / 8436 /– $14.94 $0.2 0.7 -1.9 0.7 14.2 1.0 1.5 N/A 4.3 (DEC.’01)<br />
SUNWISE 2001 PORTFOLIO SERIES SUMMIT BALANCED GROWTH <strong>CI</strong> INVESTMENT CONSULTING 8378 / 8478 /– $14.97 $0.0 0.8 -1.9 0.8 14.3 1.1 1.6 N/A 4.3 (DEC.’01)<br />
SUNWISE PORTFOLIO SERIES SUMMIT MAXIMUM GROWTH <strong>CI</strong> INVESTMENT CONSULTING 8338 / 8438 /– $13.04 $0.1 0.2 -2.3 0.2 17.3 -1.7 -0.1 N/A 2.8 (DEC.’01)<br />
SUNWISE 2001 PORTFOLIO SERIES SUMMIT MAXIMUM GROWTH <strong>CI</strong> INVESTMENT CONSULTING 8380 / 8480 /– $13.05 $0.0 0.1 -2.4 0.1 17.3 -1.7 -0.1 N/A 2.8 (DEC.’01)<br />
SUNWISE US. MARKET INDEX TD ASSET MGNT INC. 8318 / 8418 /– $6.40 $0.1 1.1 -2.3 1.1 14.3 -1.4 -2.8 N/A -4.6 (DEC.’01)<br />
SUNWISE 2001 US. MARKET INDEX TD ASSET MGNT INC. 8048 / 8948 /– $6.40 $0.0 1.3 -2.3 1.3 14.3 -1.4 -2.8 N/A -4.6 (DEC.’01)<br />
SunWise<br />
®<br />
Full Guarantee<br />
II<br />
Funds<br />
Issued by Sun Life Assurance Company of Canada<br />
SUNWISE AIC AMERICAN FOCUSED ROGER HAMILTON 8512 / 8612 /– $6.23 $2.5 -0.6 -3.6 -0.6 17.1 0.3 -10.1 N/A -4.8 (DEC.’01)<br />
SUNWISE 2001 AIC AMERICAN FOCUSED ROGER HAMILTON 8072 / 8972 /– $6.22 $0.3 -0.6 -3.6 -0.6 16.9 0.3 -10.1 N/A -4.8 (DEC.’01)<br />
SUNWISE AIC DIVERSIFIED CANADA JAMES COLE 8520 / 8620 /– $9.86 $1.5 1.4 -4.4 1.4 10.9 -4.1 -2.7 N/A -0.1 (DEC.’01)<br />
SUNWISE 2001 AIC DIVERSIFIED CANADA JAMES COLE 8080 / 8980 /– $9.86 $0.3 1.4 -4.4 1.4 10.9 -4.1 -2.7 N/A -0.1 (DEC.’01)<br />
SUNWISE BOND INDEX TD ASSET MGNT INC. 8552 / 8652 /– $14.65 $6.6 1.2 -0.1 1.2 2.7 4.1 4.2 N/A 4.1 (DEC.’01)<br />
SUNWISE 2001 BOND INDEX TD ASSET MGNT INC. 8586 / 8686 /– $14.65 $0.7 1.2 -0.1 1.2 2.7 4.1 4.2 N/A 4.1 (DEC.’01)<br />
SUNWISE CANADIAN EQUITY INDEX TD ASSET MGNT INC. 8527 / 8627 /– $16.41 $2.6 -1.5 -3.5 -1.5 16.8 -3.2 2.3 N/A 5.3 (DEC.’01)<br />
SUNWISE 2001 CANADIAN EQUITY INDEX TD ASSET MGNT INC. 8569 / 8669 /– $16.41 $0.2 -1.5 -3.5 -1.5 16.8 -3.2 2.3 N/A 5.3 (DEC.’01)<br />
SUNWISE <strong>CI</strong> AMERICAN GROWTH A. RADLO / B. SNOW 8514 / 8614 /– $4.39 $0.7 -2.4 -2.2 -2.4 8.9 -5.8 -11.5 N/A -8.2 (DEC.’01)<br />
SUNWISE 2001 <strong>CI</strong> AMERICAN GROWTH A. RADLO / B. SNOW 8074 / 8974 /– $4.40 $0.3 -2.4 -2.2 -2.4 8.9 -5.7 -11.4 N/A -8.2 (DEC.’01)<br />
SUNWISE <strong>CI</strong> AMERICAN VALUE W. PRIEST / D. PEARL 8516 / 8616 /– $8.79 $2.6 2.1 -2.7 2.1 15.5 -2.7 -1.0 N/A -1.3 (DEC.’01)<br />
SUNWISE 2001 <strong>CI</strong> AMERICAN VALUE W. PRIEST / D. PEARL 8076 / 8976 /– $8.80 $0.4 2.1 -2.5 2.1 15.6 -2.7 -1.0 N/A -1.3 (DEC.’01)<br />
SUNWISE <strong>CI</strong> CAMBRIDGE CORE CANADIAN EQUITY CORPORATE 1 ALAN RADLO 8521 / 8621 /– $14.97 $9.2 3.3 -1.6 3.3 24.2 -3.2 -2.0 N/A 4.3 (DEC.’01)<br />
SUNWISE 2001 <strong>CI</strong> CAMBRIDGE CORE CANADIAN EQUITY CORPORATE 2 ALAN RADLO 8081 / 8981 /– $14.97 $0.9 3.3 -1.5 3.3 24.2 -3.2 -2.0 N/A 4.3 (DEC.’01)<br />
SUNWISE <strong>CI</strong> CAMBRIDGE CORE GLOBAL EQUITY CORPORATE 3 ALAN RADLO 8506 / 8606 /– $8.23 $15.8 -0.5 -1.2 -0.5 12.7 -5.2 -5.8 N/A -2.0 (DEC.’01)<br />
SUNWISE 2001 <strong>CI</strong> CAMBRIDGE CORE GLOBAL EQUITY CORPORATE 4 ALAN RADLO 8066 / 8966 /– $8.23 $1.9 -0.4 -1.2 -0.4 12.7 -5.2 -5.8 N/A -2.0 (DEC.’01)<br />
SUNWISE <strong>CI</strong> CANADIAN EQUITY DANIEL BUBIS 8525 / 8625 /– $15.91 $0.0 0.5 -2.3 0.5 18.8 -0.1 2.1 N/A 5.0 (DEC.’01)<br />
SUNWISE 2001 <strong>CI</strong> CANADIAN EQUITY DANIEL BUBIS 8567 / 8667 /– $16.01 $0.9 0.6 -2.4 0.6 19.0 0.1 2.3 N/A 5.0 (DEC.’01)<br />
SUNWISE <strong>CI</strong> CANADIAN INVESTMENT DANIEL BUBIS 8526 / 8626 /– $18.80 $114.0 0.5 -2.3 0.5 19.0 0.0 2.2 N/A 6.8 (DEC.’01)<br />
SUNWISE 2001 <strong>CI</strong> CANADIAN INVESTMENT DANIEL BUBIS 8568 / 8668 /– $18.82 $10.6 0.5 -2.3 0.5 19.0 0.1 2.2 N/A 6.8 (DEC.’01)<br />
NAV<br />
(CDN)<br />
FUND<br />
ASSETS<br />
($MM)<br />
Y–T–D<br />
(%)<br />
1<br />
MTH<br />
(%)*<br />
6<br />
MTH<br />
(%)*<br />
1 YR<br />
(%)<br />
3 YR<br />
(%)<br />
5 YR<br />
(%)<br />
10 YR<br />
(%)<br />
SINCE<br />
INCEPTION<br />
(%)<br />
*simple rates of return 1 formerly SunWise Trimark Canadian First Class 3<br />
formerly SunWise Trimark Select Growth<br />
2 formerly SunWise 2001Trimark Canadian First Class 4<br />
formerly SunWise 2001Trimark Select Growth<br />
FOR DEALER USE ONLY<br />
MONTHLY PERFORMANCE SCORECARD AS AT JUNE 30, 2011 88
SunWise<br />
®<br />
II<br />
Funds<br />
Full Guarantee cont’d<br />
Issued by Sun Life Assurance Company of Canada<br />
LEAD MANAGER<br />
CDN $<br />
FUND CODE: <strong>CI</strong>G<br />
ISC / DSC / LSC<br />
SUNWISE <strong>CI</strong> DIVIDEND ERIC BUSHELL 8550 / 8650 /– $15.36 $0.0 3.2 -1.8 3.2 14.9 3.1 1.4 N/A 4.6 (DEC.’01)<br />
SUNWISE 2001 <strong>CI</strong> DIVIDEND ERIC BUSHELL 8584 / 8684 /– $16.53 $2.5 3.2 -1.8 3.2 14.9 5.7 2.9 N/A 5.4 (DEC.’01)<br />
SUNWISE <strong>CI</strong> GLOBAL E. BUSHELL / S. VALI 8502 / 8602 /– $8.15 $2.5 -1.6 -2.4 -1.6 15.3 -5.3 -5.0 N/A -2.1 DEC.’01)<br />
SUNWISE 2001 <strong>CI</strong> GLOBAL E. BUSHELL / S. VALI 8062 / 8962 /– $8.16 $0.3 -1.6 -2.3 -1.6 15.4 -5.3 -5.0 N/A -2.1 DEC.’01)<br />
SUNWISE <strong>CI</strong> GLOBAL BOND J. DUTKIEWICZ / J. SHAW 8560 / 8660 /– $10.60 $2.1 1.5 -0.2 1.5 1.2 5.3 5.0 N/A 0.7 (JAN.’03)<br />
SUNWISE 2001 <strong>CI</strong> GLOBAL BOND J. DUTKIEWICZ / J. SHAW 8594 / 8694 /– $10.59 $0.1 1.4 -0.3 1.4 1.1 5.3 5.0 N/A 0.7 (JAN.’03)<br />
SUNWISE <strong>CI</strong> GLOBAL VALUE JOHN HOCK 8503 / 8603 /– $7.34 $2.7 -0.1 -2.4 -0.1 13.3 -0.4 -3.5 N/A -3.2 (DEC.’01)<br />
SUNWISE 2001 <strong>CI</strong> GLOBAL VALUE JOHN HOCK 8063 / 8963 /– $7.34 $0.1 -0.3 -2.4 -0.3 13.3 -0.4 -3.5 N/A -3.2 (DEC.’01)<br />
SUNWISE <strong>CI</strong> HARBOUR G. COLEMAN / S. JENKINS 8522 / 8622 /– $18.48 $87.1 0.1 -1.8 0.1 16.2 -0.4 2.8 N/A 6.6 (DEC.’01)<br />
SUNWISE 2001 <strong>CI</strong> HARBOUR G. COLEMAN / S. JENKINS 8082 / 8982 /– $18.48 $7.7 0.1 -1.8 0.1 16.2 -0.4 2.8 N/A 6.6 (DEC.’01)<br />
SUNWISE <strong>CI</strong> HARBOUR GROWTH & INCOME G. COLEMAN / S. JENKINS 8529 / 8629 /– $16.57 $97.3 -0.6 -1.4 -0.6 12.7 -0.2 2.2 N/A 5.4 (DEC.’01)<br />
SUNWISE 2001 <strong>CI</strong> HARBOUR GROWTH & INCOME G. COLEMAN / S. JENKINS 8571 / 8671 /– $16.59 $10.3 -0.6 -1.4 -0.6 12.7 -0.2 2.2 N/A 5.4 (DEC.’01)<br />
SUNWISE <strong>CI</strong> INTERNATIONAL BUSHELL / D’ANGELO / BRODEUR 8554 / 8654 /– $11.05 $3.0 -1.4 -2.7 -1.4 14.0 -8.1 -6.1 N/A 1.2 (JAN.’03)<br />
SUNWISE 2001 <strong>CI</strong> INTERNATIONAL BUSHELL / D’ANGELO / BRODEUR 8588 / 8688 /– $11.05 $0.1 -1.4 -2.7 -1.4 14.0 -8.1 -6.1 N/A 1.2 (JAN.’03)<br />
SUNWISE <strong>CI</strong> INTERNATIONAL BALANCED E. BUSHELL / J. DUTKIEWICZ 8555 / 8655 /– $11.68 $0.9 -1.1 -1.6 -1.1 10.7 -0.7 -0.5 N/A 1.9 (JAN.’03)<br />
SUNWISE 2001 <strong>CI</strong> INTERNATIONAL BALANCED E. BUSHELL / J. DUTKIEWICZ 8589 / 8689 /– $11.69 $0.1 -1.1 -1.6 -1.1 10.8 -0.6 -0.5 N/A 1.9 (JAN.’03)<br />
SUNWISE <strong>CI</strong> INTERNATIONAL BALANCED CORPORATE E. BUSHELL / J. DUTKIEWICZ 8508 / 8608 /– $9.07 $1.5 0.1 -1.8 0.1 12.1 -0.8 -1.2 N/A -1.0 (DEC.’01)<br />
SUNWISE 2001 <strong>CI</strong> INTERNATIONAL BALANCED CORPORATE E. BUSHELL / J. DUTKIEWICZ 8068 / 8968 /– $9.06 $0.3 0.1 -1.8 0.1 12.0 -0.8 -1.3 N/A -1.0 (DEC.’01)<br />
SUNWISE <strong>CI</strong> INTERNATIONAL VALUE JOHN HOCK 8507 / 8607 /– $9.28 $1.6 0.2 -1.7 0.2 14.3 -0.9 -3.1 N/A -0.8 (DEC.’01)<br />
SUNWISE 2001 <strong>CI</strong> INTERNATIONAL VALUE JOHN HOCK 8067 / 8967 /– $9.29 $0.1 0.2 -1.7 0.2 14.3 -0.8 -3.1 N/A -0.8 (DEC.’01)<br />
SUNWISE <strong>CI</strong> MONEY MARKET PAUL SIMON 8553 / 8653 /– $11.45 $31.7 0.1 0.0 0.1 0.2 0.1 1.3 N/A 1.4 (DEC.’01)<br />
SUNWISE 2001 <strong>CI</strong> MONEY MARKET PAUL SIMON 8587 / 8687 /– $11.46 $1.1 0.2 0.0 0.2 0.2 0.1 1.3 N/A 1.4 (DEC.’01)<br />
SUNWISE <strong>CI</strong> PREMIER AMERICAN VALUE CORPORATE 1 W. PRIEST / D. PEARL 8517 / 8617 /– $6.81 $0.8 2.4 -2.3 2.4 16.4 1.0 -1.5 N/A -3.9 (DEC.’01)<br />
SUNWISE 2001 <strong>CI</strong> PREMIER AMERICAN VALUE CORPORATE 2 W. PRIEST / D. PEARL 8077 / 8977 /– $6.81 $0.1 2.6 -2.3 2.6 16.4 1.0 -1.5 N/A -3.9 (DEC.’01)<br />
SUNWISE <strong>CI</strong> SIGNATURE CANADIAN BALANCED E. BUSHELL / J. DUTKIEWICZ 8531 / 8631 /– $17.06 $16.1 0.5 -1.7 0.5 13.1 3.2 4.4 N/A 5.7 (DEC.’01)<br />
SUNWISE 2001 <strong>CI</strong> SIGNATURE CANADIAN BALANCED E. BUSHELL / J. DUTKIEWICZ 8573 / 8673 /– $17.08 $2.6 0.6 -1.7 0.6 13.2 3.2 4.5 N/A 5.7 (DEC.’01)<br />
SUNWISE <strong>CI</strong> SIGNATURE CANADIAN BOND JAMES DUTKIEWICZ 8562 / 8662 /– $13.42 $21.8 1.4 -0.2 1.4 2.6 4.1 3.9 N/A 3.6 (JAN.’03)<br />
SUNWISE 2001 <strong>CI</strong> SIGNATURE CANADIAN BOND JAMES DUTKIEWICZ 8596 / 8696 /– $13.41 $1.2 1.4 -0.3 1.4 2.4 4.1 3.9 N/A 3.5 (JAN.’03)<br />
SUNWISE <strong>CI</strong> SIGNATURE CANADIAN PREMIER BOND JAMES DUTKIEWICZ 8549 / 8649 /– $13.87 $0.0 1.2 -0.3 1.2 2.3 3.8 3.7 N/A 3.5 (DEC.’01)<br />
SUNWISE 2001 <strong>CI</strong> SIGNATURE CANADIAN PREMIER BOND JAMES DUTKIEWICZ 8583 / 8683 /– $13.89 $1.5 1.2 -0.3 1.2 2.3 3.9 3.7 N/A 3.5 (DEC.’01)<br />
SUNWISE <strong>CI</strong> SIGNATURE DIVIDEND ERIC BUSHELL 8561 / 8661 /– $16.03 $60.6 3.3 -1.9 3.3 14.9 5.8 2.9 N/A 5.8 (JAN.’03)<br />
SUNWISE 2001 <strong>CI</strong> SIGNATURE DIVIDEND ERIC BUSHELL 8595 / 8695 /– $16.02 $2.1 3.3 -1.8 3.3 14.9 5.7 2.9 N/A 5.8 (JAN.’03)<br />
SUNWISE <strong>CI</strong> SIGNATURE HIGH INCOME ERIC BUSHELL 8548 / 8648 /– $22.73 $134.3 3.8 -1.5 3.8 16.7 5.0 4.1 N/A 9.0 (DEC.’01)<br />
SUNWISE 2001 <strong>CI</strong> SIGNATURE HIGH INCOME ERIC BUSHELL 8582 / 8682 /– $22.73 $9.7 3.7 -1.6 3.7 16.7 5.0 4.1 N/A 9.0 (DEC.’01)<br />
SUNWISE <strong>CI</strong> SIGNATURE INCOME & GROWTH E. BUSHELL / J. DUTKIEWICZ 8564 / 8664 /– $14.18 $35.7 1.1 -1.9 1.1 14.2 2.9 3.8 N/A 5.7 (MAR.’05)<br />
SUNWISE 2001 <strong>CI</strong> SIGNATURE INCOME & GROWTH E. BUSHELL / J. DUTKIEWICZ 8598 / 8698 /– $14.19 $1.6 1.1 -1.8 1.1 14.2 2.9 3.8 N/A 5.7 (MAR.’05)<br />
SUNWISE <strong>CI</strong> SIGNATURE SHORT-TERM BOND J. DUTKIEWICZ / P. SIMON 8551 / 8651 /– $11.93 $0.0 0.5 -0.2 0.5 0.2 1.5 2.0 N/A 1.9 (DEC.’01)<br />
SUNWISE 2001 <strong>CI</strong> SIGNATURE SHORT-TERM BOND J. DUTKIEWICZ / P. SIMON 8585 / 8685 /– $11.96 $0.5 0.6 -0.1 0.6 0.3 1.6 2.1 N/A 1.9 (DEC.’01)<br />
SUNWISE <strong>CI</strong> SIGNATURE SELECT CANADIAN ERIC BUSHELL 8524 / 8624 /– $18.90 $41.4 0.4 -2.3 0.4 17.5 0.6 3.3 N/A 6.9 (DEC.’01)<br />
SUNWISE 2001 <strong>CI</strong> SIGNATURE SELECT CANADIAN ERIC BUSHELL 8566 / 8666 /– $18.89 $2.0 0.3 -2.3 0.3 17.3 0.6 3.3 N/A 6.9 (DEC.’01)<br />
SUNWISE <strong>CI</strong> SIGNATURE PREMIER CANADIAN BALANCED 3 E. BUSHELL / J. DUTKIEWICZ 8532 / 8632 /– $16.71 $9.1 0.6 -1.8 0.6 13.1 3.0 3.7 N/A 5.5 (DEC.’01)<br />
SUNWISE 2001 <strong>CI</strong> SIGNATURE PREMIER CANADIAN BALANCED 4 E. BUSHELL / J. DUTKIEWICZ 8574 / 8674 /– $16.71 $0.5 0.6 -1.7 0.6 13.1 3.0 3.7 N/A 5.5 (DEC.’01)<br />
SUNWISE <strong>CI</strong> SIGNATURE SELECT CANADIAN BALANCED 5 E. BUSHELL / J. DUTKIEWICZ 8533 / 8633 /– $13.57 $28.6 0.5 -1.7 0.5 11.8 2.0 1.1 N/A 3.2 (DEC.’01)<br />
SUNWISE 2001 <strong>CI</strong> SIGNATURE SELECT CANADIAN BALANCED 6 E. BUSHELL / J. DUTKIEWICZ 8575 / 8675 /– $13.57 $3.9 0.5 -1.7 0.5 11.8 2.0 1.1 N/A 3.2 (DEC.’01)<br />
SUNWISE <strong>CI</strong> SIGNATURE SELECT GLOBAL INCOME & GROWTH 7 ERIC BUSHELL 8510 / 8610 /– $12.69 $10.7 -1.4 -2.8 -1.4 9.4 -1.8 -1.3 N/A 2.5 (DEC.’01)<br />
SUNWISE 2001 <strong>CI</strong> SIGNATURE SELECT GLOBAL INCOME & GROWTH 8 ERIC BUSHELL 8070 / 8970 /– $12.69 $0.7 -1.4 -2.8 -1.4 9.3 -1.8 -1.3 N/A 2.5 (DEC.’01)<br />
NAV<br />
(CDN)<br />
FUND<br />
ASSETS<br />
($MM)<br />
Y–T–D<br />
(%)<br />
1<br />
MTH<br />
(%)*<br />
6<br />
MTH<br />
(%)*<br />
1 YR<br />
(%)<br />
3 YR<br />
(%)<br />
5 YR<br />
(%)<br />
10 YR<br />
(%)<br />
SINCE<br />
INCEPTION<br />
(%)<br />
*simple rates of return 3 formerly SunWise <strong>CI</strong> Signature Select Canadian Balanced 6<br />
formerly SunWise 2001 Trimark Income Growth<br />
1 formerly SunWise Trimark U.S. Companies 4 formerly SunWise 2001 <strong>CI</strong> Signature Select Canadian Balanced 7<br />
formerly SunWise Trimark Global Balanced<br />
2<br />
formerly SunWise 2001 Trimark U.S. Companies<br />
5<br />
formerly SunWise Trimark Income Growth<br />
8<br />
formerly SunWise 2001 Trimark Global Balanced<br />
FOR DEALER USE ONLY<br />
MONTHLY PERFORMANCE SCORECARD AS AT JUNE 30, 2011 8 9
SunWise<br />
®<br />
II<br />
Funds<br />
Full Guarantee cont’d<br />
LEAD MANAGER<br />
CDN $<br />
FUND CODE: <strong>CI</strong>G<br />
ISC / DSC / LSC<br />
Issued by Sun Life Assurance Company of Canada<br />
SUNWISE <strong>CI</strong> SYNERGY AMERICAN DAVID PICTON 8556 / 8656 /– $10.82 $0.8 1.7 -2.6 1.7 17.2 -4.7 -3.2 N/A 0.9 (JAN.’03)<br />
SUNWISE 2001 <strong>CI</strong> SYNERGY AMERICAN DAVID PICTON 8590 / 8690 /– $10.84 $0.0 1.8 -2.6 1.8 17.4 -4.6 -3.2 N/A 1.0 (JAN.’03)<br />
SUNWISE <strong>CI</strong> SYNERGY CANADIAN DAVID PICTON 8563 / 8663 /– $14.48 $3.4 -0.1 -2.4 -0.1 18.6 -2.6 1.4 N/A 5.4 (JUNE.’04)<br />
SUNWISE 2001 <strong>CI</strong> SYNERGY CANADIAN DAVID PICTON 8597 / 8697 /– $14.47 $0.0 0.0 -2.4 0.0 18.5 -2.6 1.3 N/A 5.4 (JUNE.’04)<br />
SUNWISE <strong>CI</strong> SYNERGY GLOBAL CORPORATE MICHAEL MAHONEY 8505 / 8605 /– $8.44 $2.7 1.4 -2.1 1.4 18.5 -5.0 -3.2 N/A -1.8 (DEC.’01)<br />
SUNWISE 2001 <strong>CI</strong> SYNERGY GLOBAL CORPORATE MICHAEL MAHONEY 8065 / 8965 /– $8.44 $0.4 1.3 -2.2 1.3 18.5 -5.0 -3.2 N/A -1.8 (DEC.’01)<br />
SUNWISE <strong>CI</strong> VALUE TRUST CORPORATE A. RADLO / B. SNOW 8515 / 8615 /– $4.69 $3.3 -2.5 -2.3 -2.5 8.8 -5.8 -11.5 N/A -7.6 (DEC.’01)<br />
SUNWISE 2001 <strong>CI</strong> VALUE TRUST CORPORATE A. RADLO / B. SNOW 8075 / 8975 /– $4.70 $0.2 -2.5 -2.3 -2.5 9.0 -5.7 -11.4 N/A -7.6 (DEC.’01)<br />
SUNWISE <strong>CI</strong> WORLD EQUITY JOHN HOCK 8504 / 8604 /– $8.18 $0.4 -0.4 -2.5 -0.4 13.1 -0.4 -3.5 N/A -2.1 (DEC.’01)<br />
SUNWISE 2001 <strong>CI</strong> WORLD EQUITY JOHN HOCK 8064 / 8964 /– $8.17 $0.0 -0.4 -2.5 -0.4 13.0 -0.5 -3.5 N/A -2.1 (DEC.’01)<br />
SUNWISE DYNAMIC POWER AMERICAN GROWTH NOAH BLACKSTEIN 8511 / 8611 /– $10.11 $3.5 15.4 2.0 15.4 49.6 5.0 6.3 N/A 0.1 (DEC.’01)<br />
SUNWISE 2001 DYNAMIC POWER AMERICAN GROWTH NOAH BLACKSTEIN 8071 / 8971 /– $10.12 $0.2 15.5 2.1 15.5 49.7 5.0 6.3 N/A 0.1 (DEC.’01)<br />
SUNWISE FIDELITY CANADIAN ASSET ALLOCATION D. YOUNG / G. STEIN 8530 / 8630 /– $16.44 $49.5 -2.1 -2.3 -2.1 10.4 0.2 4.2 N/A 5.3 (DEC.’01)<br />
SUNWISE 2001 FIDELITY CANADIAN ASSET ALLOCATION D. YOUNG / G. STEIN 8572 / 8672 /– $16.45 $6.1 -2.1 -2.3 -2.1 10.4 0.2 4.2 N/A 5.3 (DEC.’01)<br />
SUNWISE FIDELITY GLOBAL ASSET ALLOCATION MICHAEL STRONG 8509 / 8609 /– $9.76 $1.9 -1.9 -2.2 -1.9 7.1 -0.8 0.4 N/A -0.3 (DEC.’01)<br />
SUNWISE 2001 FIDELITY GLOBAL ASSET ALLOCATION MICHAEL STRONG 8069 / 8969 /– $9.77 $0.1 -1.9 -2.3 -1.9 7.1 -0.8 0.5 N/A -0.2 (DEC.’01)<br />
SUNWISE FIDELITY GROWTH AMERICA JOHN POWER 8513 / 8613 /– $5.81 $0.6 -1.4 -3.0 -1.4 14.8 -3.7 -7.0 N/A -5.5 (DEC.’01)<br />
SUNWISE 2001 FIDELITY GROWTH AMERICA JOHN POWER 8073 / 8973 /– $5.82 $0.1 -1.4 -3.0 -1.4 14.8 -3.7 -7.0 N/A -5.5 (DEC.’01)<br />
SUNWISE FIDELITY INTERNATIONAL PORTFOLIO MICHAEL STRONG 8501 / 8601 /– $7.63 $3.5 -0.1 -2.6 -0.1 15.6 -4.6 -5.4 N/A -2.8 (DEC.’01)<br />
SUNWISE 2001 FIDELITY INTERNATIONAL PORTFOLIO MICHAEL STRONG 8061 / 8961 /– $7.63 $0.4 -0.3 -2.6 -0.3 15.4 -4.6 -5.4 N/A -2.8 (DEC.’01)<br />
SUNWISE FIDELITY NORTHSTAR ® C. MO / J. TILLINGHAST 8565 / 8665 /– $10.10 $9.2 -1.1 -1.8 -1.1 13.5 -2.1 -1.2 N/A 0.2 (MAR.’05)<br />
SUNWISE 2001 FIDELITY NORTHSTAR ® C. MO / J. TILLINGHAST 8599 / 8699 /– $10.10 $0.8 -1.1 -1.8 -1.1 13.5 -2.1 -1.2 N/A 0.2 (MAR.’05)<br />
SUNWISE FIDELITY TRUE NORTH ® MAXIME LEMIEUX 8523 / 8623 /– $17.06 $32.0 -1.5 -2.7 -1.5 15.0 -4.7 3.1 N/A 5.7 (DEC.’01)<br />
SUNWISE 2001 FIDELITY TRUE NORTH ® MAXIME LEMIEUX 8083 / 8983 /– $17.08 $2.1 -1.5 -2.7 -1.5 15.0 -4.7 3.2 N/A 5.7 (DEC.’01)<br />
SUNWISE MACKENZIE CUNDILL CANADIAN BALANCED D. SLATER / L. CHIN 8528 / 8628 /– $14.27 $6.2 2.7 -1.9 2.7 16.1 6.6 3.7 N/A 3.8 (DEC.’01)<br />
SUNWISE 2001 MACKENZIE CUNDILL CANADIAN BALANCED D. SLATER / L. CHIN 8570 / 8670 /– $14.29 $0.6 2.7 -1.9 2.7 16.2 6.6 3.7 N/A 3.8 (DEC.’01)<br />
SUNWISE MACKENZIE CUNDILL CANADIAN SECURITY D. SLATER / L. CHIN 8519 / 8619 /– $14.60 $7.4 4.5 -2.7 4.5 26.1 8.1 3.1 N/A 4.0 (DEC.’01)<br />
SUNWISE 2001 MACKENZIE CUNDILL CANADIAN SECURITY D. SLATER / L. CHIN 8079 / 8979 /– $14.60 $0.4 4.6 -2.7 4.6 26.1 8.1 3.1 N/A 4.0 (DEC.’01)<br />
SUNWISE PORTFOLIO SERIES BALANCED <strong>CI</strong> INVESTMENT CONSULTING 8534 / 8634 /– $13.86 $66.3 1.0 -1.7 1.0 12.7 1.1 1.5 N/A 3.5 (DEC.’01)<br />
SUNWISE 2001 PORTFOLIO SERIES BALANCED <strong>CI</strong> INVESTMENT CONSULTING 8576 / 8676 /– $13.86 $3.3 0.9 -1.8 0.9 12.7 1.1 1.5 N/A 3.5 (DEC.’01)<br />
SUNWISE PORTFOLIO SERIES BALANCED GROWTH <strong>CI</strong> INVESTMENT CONSULTING 8558 / 8658 /– $14.29 $39.4 0.6 -1.9 0.6 13.8 0.6 1.1 N/A 4.3 (JAN.’03)<br />
SUNWISE 2001 PORTFOLIO SERIES BALANCED GROWTH <strong>CI</strong> INVESTMENT CONSULTING 8592 / 8692 /– $14.29 $2.9 0.6 -1.9 0.6 13.8 0.6 1.1 N/A 4.3 (JAN.’03)<br />
SUNWISE PORTFOLIO SERIES CONSERVATIVE <strong>CI</strong> INVESTMENT CONSULTING 8535 / 8635 /– $14.39 $49.6 1.4 -1.4 1.4 10.9 2.3 2.3 N/A 3.9 (DEC.’01)<br />
SUNWISE 2001 PORTFOLIO SERIES CONSERVATIVE <strong>CI</strong> INVESTMENT CONSULTING 8577 / 8677 /– $14.39 $2.3 1.4 -1.4 1.4 10.9 2.3 2.3 N/A 3.9 (DEC.’01)<br />
SUNWISE PORTFOLIO SERIES CONSERVATIVE BALANCED <strong>CI</strong> INVESTMENT CONSULTING 8557 / 8657 /– $14.47 $28.9 1.1 -1.6 1.1 11.5 1.8 1.9 N/A 4.5 (JAN.’03)<br />
SUNWISE 2001 PORTFOLIO SERIES CONSERVATIVE BALANCED <strong>CI</strong> INVESTMENT CONSULTING 8591 / 8691 /– $14.48 $1.3 1.2 -1.6 1.2 11.6 1.8 1.9 N/A 4.5 (JAN.’03)<br />
SUNWISE PORTFOLIO SERIES GROWTH <strong>CI</strong> INVESTMENT CONSULTING 8539 / 8639 /– $11.14 $14.6 0.2 -2.1 0.2 14.4 -0.8 0.1 N/A 1.1 (DEC.’01)<br />
SUNWISE 2001 PORTFOLIO SERIES GROWTH <strong>CI</strong> INVESTMENT CONSULTING 8581 / 8681 /– $11.14 $0.9 0.1 -2.1 0.1 14.3 -0.8 0.1 N/A 1.1 (DEC.’01)<br />
SUNWISE PORTFOLIO SERIES INCOME <strong>CI</strong> INVESTMENT CONSULTING 8537 / 8637 /– $15.44 $33.9 2.7 -1.1 2.7 10.1 5.0 4.1 N/A 4.6 (DEC.’01)<br />
SUNWISE 2001 PORTFOLIO SERIES INCOME <strong>CI</strong> INVESTMENT CONSULTING 8579 / 8679 /– $15.45 $2.4 2.7 -1.1 2.7 10.1 5.0 4.1 N/A 4.6 (DEC.’01)<br />
SUNWISE PORTFOLIO SERIES MAXIMUM GROWTH <strong>CI</strong> INVESTMENT CONSULTING 8559 / 8659 /– $13.95 $9.4 -0.2 -2.4 -0.2 16.7 -2.2 -0.8 N/A 4.0 (JAN.’03)<br />
SUNWISE 2001 PORTFOLIO SERIES MAXIMUM GROWTH <strong>CI</strong> INVESTMENT CONSULTING 8593 / 8693 /– $13.95 $1.1 -0.2 -2.4 -0.2 16.6 -2.2 -0.8 N/A 4.0 (JAN.’03)<br />
SUNWISE PORTFOLIO SERIES SUMMIT BALANCED GROWTH <strong>CI</strong> INVESTMENT CONSULTING 8536 / 8636 /– $14.63 $1.9 0.6 -1.9 0.6 13.9 0.8 1.3 N/A 4.1 (DEC.’01)<br />
SUNWISE 2001 PORTFOLIO SERIES SUMMIT BALANCED GROWTH <strong>CI</strong> INVESTMENT CONSULTING 8578 / 8678 /– $14.64 $0.3 0.6 -1.9 0.6 13.9 0.8 1.3 N/A 4.1 (DEC.’01)<br />
SUNWISE PORTFOLIO SERIES SUMMIT MAXIMUM GROWTH <strong>CI</strong> INVESTMENT CONSULTING 8538 / 8638 /– $12.69 $0.6 0.0 -2.4 0.0 17.1 -1.9 -0.4 N/A 2.5 (DEC.’01)<br />
SUNWISE 2001 PORTFOLIO SERIES SUMMIT MAXIMUM GROWTH <strong>CI</strong> INVESTMENT CONSULTING 8580 / 8680 /– $12.68 $0.1 0.0 -2.4 0.0 17.0 -2.0 -0.4 N/A 2.5 (DEC.’01)<br />
SUNWISE US. MARKET INDEX TD ASSET MGNT INC. 8518 / 8618 /– $6.21 $0.4 1.0 -2.4 1.0 13.9 -1.8 -3.2 N/A -4.9 (DEC.’01)<br />
SUNWISE 2001 US. MARKET INDEX TD ASSET MGNT INC. 8078 / 8978 /– $6.21 $0.0 1.0 -2.4 1.0 13.9 -1.8 -3.2 N/A -4.9 (DEC.’01)<br />
NAV<br />
(CDN)<br />
FUND<br />
ASSETS<br />
($MM)<br />
Y–T–D<br />
(%)<br />
1<br />
MTH<br />
(%)*<br />
6<br />
MTH<br />
(%)*<br />
1 YR<br />
(%)<br />
3 YR<br />
(%)<br />
5 YR<br />
(%)<br />
10 YR<br />
(%)<br />
SINCE<br />
INCEPTION<br />
(%)<br />
*simple rates of return<br />
FOR DEALER USE ONLY<br />
MONTHLY PERFORMANCE SCORECARD AS AT JUNE 30, 2011 90
SunWise<br />
®<br />
Basic Guarantee<br />
Elite<br />
Funds<br />
Issued by Sun Life Assurance Company of Canada<br />
LEAD MANAGER<br />
CDN $<br />
FUND CODE † : <strong>CI</strong>G<br />
ISC / DSC / LSC<br />
SUNWISE ELITE <strong>CI</strong> AMERICAN VALUE W. PRIEST / D. PEARL 7361 / 7841 /– $9.87 $10.0 2.5 -2.5 2.5 16.3 -2.0 -0.3 N/A -0.2 (OCT.’05)<br />
SUNWISE ELITE <strong>CI</strong> CAMBRIDGE CANADIAN ASSET ALLOCATION CORPORATE ALAN RADLO 7507 / 7557 /– $11.69 $22.8 4.9 -0.3 4.9 22.7 4.1 N/A N/A 4.9 (MAR.’08)<br />
SUNWISE ELITE <strong>CI</strong> CAMBRIDGE BALANCED BUNDLE MULTI-MANAGER 7522 / 7572 /– $11.79 $3.7 3.5 -1.5 3.5 18.7 N/A N/A N/A 11.9 (JAN.’10)<br />
SUNWISE ELITE <strong>CI</strong> CAMBRIDGE CANADIAN EQUITY CORPORATE ALAN RADLO 7508 / 7558 /– $10.62 $9.3 3.5 -1.5 3.5 22.2 0.5 N/A N/A 1.9 (MAR.’08)<br />
SUNWISE ELITE <strong>CI</strong> CAMBRIDGE CORE BUNDLE MULTI-MANAGER 7521 / 7571 /– $11.36 $1.6 3.3 -1.4 3.3 18.5 N/A N/A N/A 9.1 (JAN.’10)<br />
SUNWISE ELITE <strong>CI</strong> CAMBRIDGE CORE CANADIAN EQUITY CORPORATE 1 ALAN RADLO 7365 / 7845 /– $10.37 $3.2 3.5 -1.5 3.5 24.6 -2.7 -1.4 N/A 0.6 (OCT.’05)<br />
SUNWISE ELITE <strong>CI</strong> CAMBRIDGE CORE GLOBAL EQUITY CORPORATE 2 ALAN RADLO 7355 / 7835 /– $8.16 $4.8 -0.2 -1.2 -0.2 13.2 -4.5 -5.1 N/A -3.5 (OCT.’05)<br />
SUNWISE ELITE <strong>CI</strong> CAMBRIDGE GLOBAL EQUITY CORPORATE ALAN RADLO 7509 / 7559 /– $10.68 $11.3 -0.2 -1.1 -0.2 18.8 -0.8 N/A N/A 2.0 (MAR.’08)<br />
SUNWISE ELITE <strong>CI</strong> CANADIAN INVESTMENT DANIEL BUBIS 7366 / 7846 /– $12.64 $45.3 0.7 -2.3 0.7 19.4 0.5 2.7 N/A 4.2 (OCT.’05)<br />
SUNWISE ELITE <strong>CI</strong> GLOBAL E. BUSHELL / S. VALI 7350 / 7830 /– $8.26 $2.8 -1.3 -2.2 -1.3 15.8 -4.8 -4.4 N/A -3.4 (OCT.’05)<br />
SUNWISE ELITE <strong>CI</strong> GLOBAL BOND J. DUTKIEWICZ / J. SHAW 7386 / 7866 /– $12.29 $1.1 1.5 -0.2 1.5 1.3 5.5 5.2 N/A 3.7 (OCT.’05)<br />
SUNWISE ELITE <strong>CI</strong> GLOBAL HIGH DIVIDEND ADVANTAGE PRIEST / SAPPENFIELD / WELHOELTER 7395 / 7875 /– $8.21 $5.0 5.1 -1.9 5.1 19.9 0.3 N/A N/A -4.4 (APR.’07)<br />
SUNWISE ELITE <strong>CI</strong> GLOBAL VALUE JOHN HOCK 7351 / 7831 /– $9.04 $0.5 -0.1 -2.5 -0.1 13.7 0.1 -2.9 N/A -1.8 (OCT.’05)<br />
SUNWISE ELITE <strong>CI</strong> HARBOUR G. COLEMAN / S. JENKINS 7367 / 7847 /– $13.15 $102.0 0.3 -1.7 0.3 16.8 0.1 3.4 N/A 5.0 (OCT.’05)<br />
SUNWISE ELITE <strong>CI</strong> HARBOUR BALANCED BUNDLE MULTI-MANAGER 7513 / 7563 /– $11.09 $21.4 2.0 -1.5 2.0 16.6 N/A N/A N/A 7.3 (JAN.’10)<br />
SUNWISE ELITE <strong>CI</strong> HARBOUR CORE BUNDLE MULTI-MANAGER 7512 / 7562 /– $10.82 $16.7 0.8 -1.5 0.8 14.9 N/A N/A N/A 5.5 (JAN.’10)<br />
SUNWISE ELITE <strong>CI</strong> HARBOUR FOREIGN EQUITY CORPORATE S. JENKINS / G. COLEMAN 7393 / 7873 /– $8.19 $13.6 1.7 -1.7 1.7 17.7 -2.2 N/A N/A -4.6 (APR.’07)<br />
SUNWISE ELITE <strong>CI</strong> HARBOUR FOREIGN GROWTH & INCOME CORP. S. JENKINS / G. COLEMAN 7394 / 7874 /– $9.12 $13.7 0.1 -2.1 0.1 12.7 -0.1 N/A N/A -2.2 (APR.’07)<br />
SUNWISE ELITE <strong>CI</strong> HARBOUR GROWTH & INCOME G. COLEMAN / S. JENKINS 7373 / 7853 /– $12.44 $167.1 -0.3 -1.3 -0.3 13.2 0.3 2.7 N/A 3.9 (OCT.’05)<br />
SUNWISE ELITE <strong>CI</strong> INTERNATIONAL BALANCED E. BUSHELL / J. DUTKIEWICZ 7357 / 7837 /– $10.04 $1.9 -0.9 -1.6 -0.9 11.3 -0.2 0.0 N/A 0.1 (OCT.’05)<br />
SUNWISE ELITE <strong>CI</strong> INTERNATIONAL VALUE JOHN HOCK 7352 / 7832 /– $9.70 $2.8 0.5 -1.6 0.5 14.9 -0.2 -2.5 N/A -0.5 (OCT.’05)<br />
SUNWISE ELITE <strong>CI</strong> MONEY MARKET PAUL SIMON 7390 / 7870 /– $10.80 $36.0 0.2 0.0 0.2 0.3 0.2 1.2 N/A 1.4 (OCT.’05)<br />
SUNWISE ELITE <strong>CI</strong> SIGNATURE CANADIAN BALANCED E. BUSHELL / J. DUTKIEWICZ 7372 / 7852 /– $12.86 $15.4 0.8 -1.8 0.8 13.6 3.5 4.2 N/A 4.5 (OCT.’05)<br />
SUNWISE ELITE <strong>CI</strong> SIGNATURE CANADIAN BOND JAMES DUTKIEWICZ 7385 / 7865 /– $12.08 $20.2 1.4 -0.3 1.4 2.6 4.2 4.0 N/A 3.4 (OCT.’05)<br />
SUNWISE ELITE <strong>CI</strong> SIGNATURE CORE BUNDLE MULTI-MANAGER 7514 / 7564 /– $10.89 $17.8 1.0 -1.9 1.0 15.2 N/A N/A N/A 6.0 (JAN.’10)<br />
SUNWISE ELITE <strong>CI</strong> SIGNATURE CORPORATE BOND CORPORATE DUTKIEWICZ / MARSHALL / SHAW 7511 / 7561 /– $11.01 $3.7 2.5 -1.1 2.5 7.6 N/A N/A N/A 6.8 (JAN.’10)<br />
SUNWISE ELITE <strong>CI</strong> SIGNATURE DIVIDEND ERIC BUSHELL 7388 / 7868 /– $12.31 $34.5 3.4 -1.8 3.4 15.2 6.0 3.1 N/A 3.7 (OCT.’05)<br />
SUNWISE ELITE <strong>CI</strong> SIGNATURE GLOBAL INCOME & GROWTH ERIC BUSHELL 7501 / 7551 /– $10.65 $4.0 -1.1 -2.7 -1.1 11.8 2.6 N/A N/A 2.0 (MAR.’08)<br />
SUNWISE ELITE <strong>CI</strong> SIGNATURE HIGH INCOME ERIC BUSHELL 7389 / 7869 /– $13.66 $105.5 4.0 -1.5 4.0 17.2 5.4 4.4 N/A 5.7 (OCT.’05)<br />
SUNWISE ELITE <strong>CI</strong> SIGNATURE INCOME & GROWTH E. BUSHELL / J. DUTKIEWICZ 7376 / 7856 /– $13.40 $83.0 1.2 -1.8 1.2 14.7 3.3 4.2 N/A 5.3 (OCT.’05)<br />
SUNWISE ELITE <strong>CI</strong> SIGNATURE SELECT CANADIAN ERIC BUSHELL 7368 / 7848 /– $13.47 $59.5 0.5 -2.2 0.5 17.7 1.0 3.9 N/A 5.4 (OCT.’05)<br />
SUNWISE ELITE <strong>CI</strong> SIGNATURE SELECT CANADIAN BALANCED 3 E. BUSHELL / J. DUTKIEWICZ 7377 / 7857 /– $10.84 $9.2 0.7 -1.7 0.7 12.2 2.5 1.5 N/A 1.4 (OCT.’05)<br />
SUNWISE ELITE <strong>CI</strong> SIGNATURE SELECT GLOBAL INCOME & GROWTH CORP. 4 ERIC BUSHELL 7359 / 7839 /– $10.10 $8.0 -1.1 -2.7 -1.1 9.9 -1.3 -0.8 N/A 0.2 (OCT.’05)<br />
SUNWISE ELITE <strong>CI</strong> SYNERGY AMERICAN DAVID PICTON 7362 / 7842 /– $8.93 $0.8 2.1 -2.6 2.1 18.1 -4.0 -2.5 N/A -2.0 (OCT.’05)<br />
SUNWISE ELITE <strong>CI</strong> SYNERGY CANADIAN DAVID PICTON 7369 / 7849 /– $12.32 $9.9 0.2 -2.3 0.2 19.0 -2.1 1.9 N/A 3.8 (OCT.’05)<br />
SUNWISE ELITE <strong>CI</strong> SYNERGY GLOBAL CORPORATE DAVID PICTON 7353 / 7833 /– $9.33 $3.2 1.6 -2.1 1.6 19.2 -4.4 -2.6 N/A -1.2 (OCT.’05)<br />
SUNWISE ELITE <strong>CI</strong> VALUE TRUST CORPORATE A. RADLO / B. SNOW 7363 / 7843 /– $5.23 $2.7 -2.2 -2.2 -2.2 9.6 -5.2 -10.8 N/A -10.8 (OCT.’05)<br />
SUNWISE ELITE DYNAMIC CORE BUNDLE MULTI-MANAGER 7524 / 7574 /– $10.62 $6.3 -1.2 -1.9 -1.2 11.6 N/A N/A N/A 4.2 (JAN.’10)<br />
SUNWISE ELITE DYNAMIC GLOBAL VALUE CHUK WONG 7391 / 7871 /– $8.34 $10.8 -5.7 -2.8 -5.7 8.9 -2.0 N/A N/A -4.2 (APR.’07)<br />
SUNWISE ELITE DYNAMIC POWER AMERICAN GROWTH NOAH BLACKSTEIN 7360 / 7840 /– $12.87 $5.1 15.9 2.1 15.9 50.9 6.1 7.3 N/A 4.6 (OCT.’05)<br />
SUNWISE ELITE FIDELITY CANADIAN ASSET ALLOCATION D. YOUNG / G. STEIN 7374 / 7854 /– $13.05 $76.9 -1.9 -2.2 -1.9 10.9 0.6 4.5 N/A 4.8 (OCT.’05)<br />
SUNWISE ELITE FIDELITY DIS<strong>CI</strong>PLINED CORE BUNDLE MULTI-MANAGER 7523 / 7573 /– $10.88 $3.2 -1.1 -2.4 -1.1 13.6 N/A N/A N/A 5.9 (JAN.’10)<br />
SUNWISE ELITE FIDELITY GLOBAL ASSET ALLOCATION MICHAEL STRONG 7358 / 7838 /– $10.63 $2.9 -1.8 -2.3 -1.8 7.5 -0.4 0.9 N/A 1.1 (OCT.’05)<br />
*simple rates of return<br />
1formerly SunWise Elite Trimark Canadian First Class<br />
2<br />
formerly SunWise Elite Trimark Select Growth<br />
3<br />
formerly SunWise Elite Trimark Income Growth 4formerly SunWise Elite Trimark Global Balanced<br />
†For the SunWise Elite Plus (the Guaranteed Minimum Withdrawal Benefit) fund code, add a “P” to the end of the SunWise Elite fund code.<br />
NAV<br />
(CDN)<br />
FUND<br />
ASSETS<br />
($MM)<br />
Y–T–D<br />
(%)<br />
1<br />
MTH<br />
(%)*<br />
6<br />
MTH<br />
(%)*<br />
1 YR<br />
(%)<br />
3 YR<br />
(%)<br />
5 YR<br />
(%)<br />
10 YR<br />
(%)<br />
SINCE<br />
INCEPTION<br />
(%)<br />
FOR DEALER USE ONLY<br />
MONTHLY PERFORMANCE SCORECARD AS AT JUNE 30, 2011 91
SunWise<br />
®<br />
Elite<br />
Funds<br />
Basic Guarantee cont’d<br />
Issued by Sun Life Assurance Company of Canada<br />
LEAD MANAGER<br />
CDN $<br />
FUND CODE † : <strong>CI</strong>G<br />
ISC / DSC / LSC<br />
SUNWISE ELITE FIDELITY GROWTH AMERICA JOHN POWER 7364 / 7844 /– $7.14 $1.2 -1.1 -3.0 -1.1 15.3 -3.3 -6.3 N/A -5.8 (OCT.’05)<br />
SUNWISE ELITE FIDELITY NORTHSTAR ® C. MO / J. TILLINGHAST 7354 / 7834 /– $10.00 $13.3 -0.9 -1.8 -0.9 13.9 -1.5 -0.6 N/A 0.0 (OCT.’05)<br />
SUNWISE ELITE FIDELITY TRUE NORTH ® MAXIME LEMIEUX 7370 / 7850 /– $12.75 $24.8 -1.3 -2.7 -1.3 15.4 -4.3 3.7 N/A 4.4 (OCT.’05)<br />
SWE FRANKLIN TEMPLETON QUOTENTIAL BALANCED GROWTH STEVE LINGARD / BRENT SMITH 9451 / 9951 /– $13.28 $7.3 0.1 -2.0 0.1 10.9 N/A N/A N/A 11.1 (OCT.’08)<br />
SWE FRANKLIN TEMPLETON QUOTENTIAL BALANCED INCOME STEVE LINGARD / BRENT SMITH 9450 / 9950 /– $13.51 $2.3 0.6 -1.5 0.6 8.3 N/A N/A N/A 11.8 (OCT.’08)<br />
SWE FRANKLIN TEMPLETON QUOTENTIAL CANADIAN GROWTH STEVE LINGARD / BRENT SMITH 9454 / 9954 /– $17.42 $0.3 0.6 -3.2 0.6 23.0 N/A N/A N/A 22.9 (OCT.’08)<br />
SWE FRANKLIN TEMPLETON QUOTENTIAL DIVERSIFIED INCOME STEVE LINGARD / BRENT SMITH 9449 / 9949 /– $12.70 $2.4 1.7 -1.0 1.7 6.5 N/A N/A N/A 9.3 (OCT.’08)<br />
SWE FRANKLIN TEMPLETON QUOTENTIAL GLOBAL BALANCED STEVE LINGARD / BRENT SMITH 9452 / 9952 /– $13.01 $0.5 0.1 -1.7 0.1 9.1 N/A N/A N/A 10.3 (OCT.’08)<br />
SWE FRANKLIN TEMPLETON QUOTENTIAL GLOBAL GROWTH STEVE LINGARD / BRENT SMITH 9455 / 9955 /– $12.48 $1.0 0.2 -2.3 0.2 13.8 N/A N/A N/A 8.6 (OCT.’08)<br />
SWE FRANKLIN TEMPLETON QUOTENTIAL GROWTH STEVE LINGARD / BRENT SMITH 9453 / 9953 /– $13.93 $0.9 -0.4 -2.3 -0.4 12.7 N/A N/A N/A 13.1 (OCT.’08)<br />
SWE FRANKLIN TEMPLETON QUOTENTIAL MAXIMUM GROWTH STEVE LINGARD / BRENT SMITH 9456 / 9956 /– $13.98 $0.4 0.1 -2.7 0.1 17.0 N/A N/A N/A 13.2 (OCT.’08)<br />
SUNWISE ELITE MACKENZIE CUNDILL CANADIAN BALANCED D. SLATER / L. CHIN 7375 / 7855 /– $12.34 $6.5 3.0 -1.9 3.0 16.9 7.1 4.2 N/A 3.8 (OCT.’05)<br />
SUNWISE ELITE MACKENZIE CUNDILL CANADIAN SECURITY D. SLATER / L. CHIN 7371 / 7851 /– $12.04 $3.6 4.8 -2.6 4.8 26.6 8.6 3.6 N/A 3.3 (OCT.’05)<br />
SUNWISE ELITE MACKENZIE CUNDILL VALUE A. MASSIE / D. TILEY 7392 / 7872 /– $8.62 $19.9 0.2 -2.6 0.2 18.6 1.4 N/A N/A -3.5 (APR.’07)<br />
SUNWISE ELITE MANULIFE GLOBAL MONTHLY INCOME DANNY TOMKA 7503 / 7553 /– $9.30 $0.6 -3.8 -3.7 -3.8 4.3 -0.8 N/A N/A -2.3 (MAR.’08)<br />
SUNWISE ELITE MANULIFE GLOBAL OPPORTUNITIES CHRISTOPHER ARBUTHNOT 7504 / 7554 /– $10.74 $0.5 -9.2 -4.0 -9.2 13.2 3.0 N/A N/A 2.2 (MAR.’08)<br />
SUNWISE ELITE NORTHWEST GROWTH AND INCOME MULTI-MANAGER 7502 / 7552 /– $9.91 $0.2 4.2 -2.2 4.2 15.6 1.8 N/A N/A -0.3 MAR.’08)<br />
SUNWISE ELITE PORTFOLIO SERIES BALANCED <strong>CI</strong> INVESTMENT CONSULTING 7378 / 7858 /– $11.69 $90.7 1.2 -1.7 1.2 13.3 1.6 2.0 N/A 2.8 (OCT.’05)<br />
SUNWISE ELITE PORTFOLIO SERIES BALANCED GROWTH <strong>CI</strong> INVESTMENT CONSULTING 7381 / 7861 /– $11.39 $49.9 0.8 -1.9 0.8 14.4 1.1 1.7 N/A 2.3 (OCT.’05)<br />
SUNWISE ELITE PORTFOLIO SERIES CONSERVATIVE <strong>CI</strong> INVESTMENT CONSULTING 7379 / 7859 /– $12.06 $21.8 1.6 -1.5 1.6 11.5 2.8 2.8 N/A 3.4 (OCT.’05)<br />
SUNWISE ELITE PORTFOLIO SERIES CONSERVATIVE BALANCED <strong>CI</strong> INVESTMENT CONSULTING 7382 / 7862 /– $11.80 $32.7 1.5 -1.5 1.5 12.1 2.3 2.4 N/A 3.0 (OCT.’05)<br />
SUNWISE ELITE PORTFOLIO SERIES GROWTH <strong>CI</strong> INVESTMENT CONSULTING 7383 / 7863 /– $10.97 $28.6 0.5 -2.1 0.5 15.1 0.0 0.9 N/A 1.6 (OCT.’05)<br />
SUNWISE ELITE PORTFOLIO SERIES INCOME <strong>CI</strong> INVESTMENT CONSULTING 7380 / 7860 /– $12.66 $26.2 2.7 -1.1 2.7 10.2 5.1 4.2 N/A 4.3 (OCT.’05)<br />
SUNWISE ELITE PORTFOLIO SERIES MAXIMUM GROWTH <strong>CI</strong> INVESTMENT CONSULTING 7384 / 7864 /– $10.63 $9.8 0.3 -2.4 0.3 17.6 -1.5 0.1 N/A 1.1 (OCT.’05)<br />
SUNWISE ELITE RBC CANADIAN DIVIDEND S. KEDWELL / D. RAYMOND 7398 / 7878 /– $10.19 $22.9 2.9 -2.1 2.9 16.2 1.5 N/A N/A 0.4 (APR.’07)<br />
SUNWISE ELITE RBC O.’SHAUGHNESSY INTERNATIONAL EQUITY JIM O.’SHAUGHNESSY 7397 / 7877 /– $6.14 $1.9 3.5 -1.4 3.5 26.3 -5.9 N/A N/A -10.9 (APR.’07)<br />
SUNWISE ELITE TD CANADIAN BOND S. RAI / G. WILSON 7396 / 7876 /– $11.80 $34.5 1.4 -0.1 1.4 2.8 5.0 N/A N/A 4.0 (APR.’07)<br />
NAV<br />
(CDN)<br />
FUND<br />
ASSETS<br />
($MM)<br />
Y–T–D<br />
(%)<br />
1<br />
MTH<br />
(%)*<br />
6<br />
MTH<br />
(%)*<br />
1 YR<br />
(%)<br />
3 YR<br />
(%)<br />
5 YR<br />
(%)<br />
10 YR<br />
(%)<br />
SINCE<br />
INCEPTION<br />
(%)<br />
SunWise<br />
®<br />
Combined Guarantee<br />
Elite<br />
Funds<br />
Issued by Sun Life Assurance Company of Canada<br />
SUNWISE ELITE <strong>CI</strong> AMERICAN VALUE W. PRIEST / D. PEARL 7261 / 7061 /– $9.49 $13.1 2.3 -2.6 2.3 15.7 -2.5 -0.8 N/A -0.9 (OCT.’05)<br />
SUNWISE ELITE <strong>CI</strong> CAMBRIDGE CANADIAN ASSET ALLOCATION CORPORATE ALAN RADLO 7607 / 7657 /– $11.63 $66.7 4.8 -0.3 4.8 22.3 3.8 N/A N/A 4.7 (MAR.’08)<br />
SUNWISE ELITE <strong>CI</strong> CAMBRIDGE BALANCED BUNDLE MULTI-MANAGER 7622 / 7672 /– $11.45 $19.3 3.3 -1.5 3.3 18.3 N/A N/A N/A 9.7 (JAN.’10)<br />
SUNWISE ELITE <strong>CI</strong> CAMBRIDGE CANADIAN EQUITY CORPORATE ALAN RADLO 7608 / 7658 /– $10.39 $22.8 3.3 -1.5 3.3 21.7 0.1 N/A N/A 1.2 (MAR.’08)<br />
SUNWISE ELITE <strong>CI</strong> CAMBRIDGE CORE BUNDLE MULTI-MANAGER 7621 / 7671 /– $11.28 $11.8 3.0 -1.5 3.0 18.0 N/A N/A N/A 8.6 (JAN.’10)<br />
SUNWISE ELITE <strong>CI</strong> CAMBRIDGE CORE CANADIAN EQUITY CORPORATE 1 ALAN RADLO 7265 / 7065 /– $10.15 $7.4 3.3 -1.6 3.3 23.9 -3.2 -1.9 N/A 0.3 (OCT.’05)<br />
SUNWISE ELITE <strong>CI</strong> CAMBRIDGE CORE GLOBAL EQUITY CORPORATE 2 ALAN RADLO 7255 / 7055 /– $7.92 $9.6 -0.5 -1.2 -0.5 12.7 -5.1 -5.6 N/A -4.0 (OCT.’05)<br />
SUNWISE ELITE <strong>CI</strong> CAMBRIDGE GLOBAL EQUITY CORPORATE ALAN RADLO 7609 / 7659 /– $10.22 $32.3 -0.4 -1.2 -0.4 18.2 -1.2 N/A N/A 0.7 (MAR.’08)<br />
SUNWISE ELITE <strong>CI</strong> CANADIAN INVESTMENT DANIEL BUBIS 7266 / 7066 /– $12.56 $146.8 0.5 -2.4 0.5 18.8 0.1 2.3 N/A 4.1 (OCT.’05)<br />
SUNWISE ELITE <strong>CI</strong> GLOBAL E. BUSHELL / S. VALI 7250 / 7050 /– $7.98 $3.4 -1.6 -2.4 -1.6 15.2 -5.3 -4.8 N/A -3.9 (OCT.’05)<br />
SUNWISE ELITE <strong>CI</strong> GLOBAL BOND J. DUTKIEWICZ / J. SHAW 7286 / 7086 /– $12.24 $4.7 1.4 -0.2 1.4 1.2 5.3 5.1 N/A 3.6 (OCT.’05)<br />
SUNWISE ELITE <strong>CI</strong> GLOBAL HIGH DIVIDEND ADVANTAGE PRIEST / SAPPENFIELD / WELHOELTER 7295 / 7095 /– $8.05 $12.1 4.8 -1.9 4.8 19.1 -0.2 N/A N/A -4.9 (APR.’07)<br />
*simple rates of return<br />
1<br />
formerly SunWise Elite Trimark Canadian First Class<br />
2<br />
formerly SunWise Elite Trimark Select Growth<br />
†For the SunWise Elite Plus (the Guaranteed Minimum Withdrawal Benefit) fund code, add a “P” to the end of the SunWise Elite fund code.<br />
FOR DEALER USE ONLY<br />
MONTHLY PERFORMANCE SCORECARD AS AT JUNE 30, 2011 92
SunWise<br />
®<br />
Elite<br />
Funds<br />
Combined Guarantee cont’d<br />
Issued by Sun Life Assurance Company of Canada<br />
LEAD MANAGER<br />
CDN $<br />
FUND CODE † : <strong>CI</strong>G<br />
ISC / DSC / LSC<br />
SUNWISE ELITE <strong>CI</strong> GLOBAL VALUE JOHN HOCK 7251 / 7051 /– $8.67 $2.7 -0.3 -2.6 -0.3 13.0 -0.4 -3.3 N/A -2.5 (OCT.’05)<br />
SUNWISE ELITE <strong>CI</strong> HARBOUR G. COLEMAN / S. JENKINS 7267 / 7067 /– $12.93 $339.3 0.0 -1.8 0.0 16.2 -0.4 2.9 N/A 4.6 (OCT.’05)<br />
SUNWISE ELITE <strong>CI</strong> HARBOUR BALANCED BUNDLE MULTI-MANAGER 7613 / 7663 /– $11.04 $88.4 1.8 -1.5 1.8 16.2 N/A N/A N/A 7.0 (JAN.’10)<br />
SUNWISE ELITE <strong>CI</strong> HARBOUR CORE BUNDLE MULTI-MANAGER 7612 / 7662 /– $10.77 $58.9 0.7 -1.6 0.7 14.3 N/A N/A N/A 5.2 (JAN.’10)<br />
SUNWISE ELITE <strong>CI</strong> HARBOUR FOREIGN EQUITY CORPORATE S. JENKINS / G. COLEMAN 7293 / 7093 /– $8.09 $31.0 1.5 -1.7 1.5 17.1 -2.7 N/A N/A -4.9 (APR.’07)<br />
SUNWISE ELITE <strong>CI</strong> HARBOUR FOREIGN GROWTH & INCOME CORP. S. JENKINS / G. COLEMAN 7294 / 7094 /– $9.08 $30.9 0.0 -2.3 0.0 12.4 -0.4 N/A N/A -2.3 (APR.’07)<br />
SUNWISE ELITE <strong>CI</strong> HARBOUR GROWTH & INCOME G. COLEMAN / S. JENKINS 7273 / 7073 /– $12.28 $528.0 -0.5 -1.4 -0.5 12.9 0.1 2.4 N/A 3.7 (OCT.’05)<br />
SUNWISE ELITE <strong>CI</strong> INTERNATIONAL BALANCED E. BUSHELL / J. DUTKIEWICZ 7257 / 7057 /– $10.01 $2.7 -1.0 -1.6 -1.0 11.0 -0.5 -0.2 N/A 0.0 (OCT.’05)<br />
SUNWISE ELITE <strong>CI</strong> INTERNATIONAL VALUE JOHN HOCK 7252 / 7052 /– $9.42 $6.9 0.2 -1.7 0.2 14.3 -0.7 -2.9 N/A -1.0 (OCT.’05)<br />
SUNWISE ELITE <strong>CI</strong> MONEY MARKET PAUL SIMON 7290 / 7090 /– $10.80 $128.0 0.2 0.0 0.2 0.3 0.1 1.2 N/A 1.4 (OCT.’05)<br />
SUNWISE ELITE <strong>CI</strong> SIGNATURE CANADIAN BALANCED E. BUSHELL / J. DUTKIEWICZ 7272 / 7072 /– $12.73 $46.4 0.6 -1.7 0.6 13.4 3.3 4.0 N/A 4.4 (OCT.’05)<br />
SUNWISE ELITE <strong>CI</strong> SIGNATURE CANADIAN BOND JAMES DUTKIEWICZ 7285 / 7085 /– $12.04 $74.9 1.3 -0.3 1.3 2.5 4.1 3.9 N/A 3.3 (OCT.’05)<br />
SUNWISE ELITE <strong>CI</strong> SIGNATURE CORE BUNDLE MULTI-MANAGER 7614 / 7664 /– $10.83 $59.0 0.8 -2.0 0.8 14.8 N/A N/A N/A 5.6 (JAN.’10)<br />
SUNWISE ELITE <strong>CI</strong> SIGNATURE CORPORATE BOND CORPORATE FUND DUTKIEWICZ / MARSHALL / SHAW 7611 / 7661 /– $10.99 $16.9 2.4 -1.1 2.4 7.5 N/A N/A N/A 6.7 (JAN.’10)<br />
SUNWISE ELITE <strong>CI</strong> SIGNATURE DIVIDEND ERIC BUSHELL 7288 / 7088 /– $12.27 $109.4 3.3 -1.8 3.3 15.0 5.8 3.0 N/A 3.7 (OCT.’05)<br />
SUNWISE ELITE <strong>CI</strong> SIGNATURE GLOBAL INCOME & GROWTH ERIC BUSHELL 7601 / 7651 /– $10.74 $10.4 -1.2 -2.7 -1.2 11.5 2.4 N/A N/A 2.2 (MAR.’08)<br />
SUNWISE ELITE <strong>CI</strong> SIGNATURE HIGH INCOME ERIC BUSHELL 7289 / 7089 /– $13.68 $341.6 3.8 -1.5 3.8 16.8 5.1 4.2 N/A 5.7 (OCT.’05)<br />
SUNWISE ELITE <strong>CI</strong> SIGNATURE INCOME & GROWTH E. BUSHELL / J. DUTKIEWICZ 7276 / 7076 /– $13.35 $230.0 1.1 -1.8 1.1 14.4 3.1 4.0 N/A 5.2 (OCT.’05)<br />
SUNWISE ELITE <strong>CI</strong> SIGNATURE SELECT CANADIAN ERIC BUSHELL 7268 / 7068 /– $13.40 $166.9 0.3 -2.3 0.3 17.2 0.6 3.4 N/A 5.3 (OCT.’05)<br />
SUNWISE ELITE <strong>CI</strong> SIGNATURE SELECT CANADIAN BALANCED 1 E. BUSHELL / J. DUTKIEWICZ 7277 / 7077 /– $10.73 $20.0 0.7 -1.7 0.7 12.0 2.3 1.4 N/A 1.3 (OCT.’05)<br />
SUNWISE ELITE <strong>CI</strong> SIGNATURE SELECT GLOBAL INCOME & GROWTH CORP. 2 ERIC BUSHELL 7259 / 7059 /– $10.00 $16.7 -1.3 -2.7 -1.3 9.6 -1.6 -1.0 N/A 0.0 (OCT.’05)<br />
SUNWISE ELITE <strong>CI</strong> SYNERGY AMERICAN DAVID PICTON 7262 / 7062 /– $8.69 $3.9 1.8 -2.7 1.8 17.4 -4.4 -2.9 N/A -2.4 (OCT.’05)<br />
SUNWISE ELITE <strong>CI</strong> SYNERGY CANADIAN DAVID PICTON 7269 / 7069 /– $11.88 $16.3 -0.1 -2.4 -0.1 18.3 -2.6 1.4 N/A 3.1 (OCT.’05)<br />
SUNWISE ELITE <strong>CI</strong> SYNERGY GLOBAL CORPORATE DAVID PICTON 7253 / 7053 /– $9.18 $6.5 1.3 -2.1 1.3 18.5 -4.9 -3.0 N/A -1.5 (OCT.’05)<br />
SUNWISE ELITE <strong>CI</strong> VALUE TRUST CORPORATE A. RADLO / B. SNOW 7263 / 7063 /– $5.11 $2.2 -2.5 -2.3 -2.5 9.2 -5.6 -11.2 N/A -11.2 (OCT.’05)<br />
SUNWISE ELITE DYNAMIC CORE BUNDLE MULTI-MANAGER 7624 / 7674 /– $10.55 $27.4 -1.4 -2.0 -1.4 11.1 N/A N/A N/A 3.7 (JAN.’10)<br />
SUNWISE ELITE DYNAMIC GLOBAL VALUE CHUK WONG 7291 / 7091 /– $8.18 $26.8 -5.8 -2.9 -5.8 8.3 -2.5 N/A N/A -4.7 (APR.’07)<br />
SUNWISE ELITE DYNAMIC POWER AMERICAN GROWTH NOAH BLACKSTEIN 7260 / 7060 /– $12.52 $18.2 15.6 2.1 15.6 50.1 5.5 6.8 N/A 4.0 (OCT.’05)<br />
SUNWISE ELITE FIDELITY CANADIAN ASSET ALLOCATION D. YOUNG / G. STEIN 7274 / 7074 /– $12.91 $279.0 -2.0 -2.3 -2.0 10.5 0.3 4.3 N/A 4.6 (OCT.’05)<br />
SUNWISE ELITE FIDELITY DIS<strong>CI</strong>PLINED CORE BUNDLE MULTI-MANAGER 7623 / 7673 /– $10.79 $19.2 -1.3 -2.4 -1.3 13.2 N/A N/A N/A 5.3 (JAN.’10)<br />
SUNWISE ELITE FIDELITY GLOBAL ASSET ALLOCATION MICHAEL STRONG 7258 / 7058 /– $10.53 $12.5 -1.8 -2.2 -1.8 7.2 -0.6 0.7 N/A 0.9 (OCT.’05)<br />
SUNWISE ELITE FIDELITY GROWTH AMERICA JOHN POWER 7264 / 7064 /– $6.90 $1.6 -1.4 -3.0 -1.4 14.8 -3.7 -6.8 N/A -6.3 (OCT.’05)<br />
SUNWISE ELITE FIDELITY NORTHSTAR ® C. MO / J. TILLINGHAST 7254 / 7054 /– $9.72 $36.9 -1.1 -1.8 -1.1 13.3 -2.1 -1.1 N/A -0.5 (OCT.’05)<br />
SUNWISE ELITE FIDELITY TRUE NORTH ® MAXIME LEMIEUX 7270 / 7070 /– $12.40 $102.9 -1.6 -2.7 -1.6 14.7 -4.8 3.2 N/A 3.9 (OCT.’05)<br />
SWE FRANKLIN TEMPLETON QUOTENTIAL DIVERSIFIED INCOME STEVE LINGARD / BRENT SMITH 9429 / 9929 /– $12.44 $9.5 1.6 -1.0 1.6 6.3 N/A N/A N/A 8.4 (OCT.’08)<br />
SWE FRANKLIN TEMPLETON QUOTENTIAL BALANCED INCOME STEVE LINGARD / BRENT SMITH 9430 / 9930 /– $13.07 $11.2 0.5 -1.5 0.5 8.1 N/A N/A N/A 10.5 (OCT.’08)<br />
SWE FRANKLIN TEMPLETON QUOTENTIAL BALANCED GROWTH STEVE LINGARD / BRENT SMITH 9431 / 9931 /– $13.17 $24.4 -0.1 -1.9 -0.1 10.7 N/A N/A N/A 10.8 (OCT.’08)<br />
SWE FRANKLIN TEMPLETON QUOTENTIAL GLOBAL BALANCED STEVE LINGARD / BRENT SMITH 9432 / 9932 /– $13.29 $4.3 -0.1 -1.7 -0.1 8.8 N/A N/A N/A 11.1 (OCT.’08)<br />
SWE FRANKLIN TEMPLETON QUOTENTIAL GROWTH STEVE LINGARD / BRENT SMITH 9433 / 9933 /– $13.06 $5.6 -0.5 -2.4 -0.5 12.2 N/A N/A N/A 10.4 (OCT.’08)<br />
SWE FRANKLIN TEMPLETON QUOTENTIAL CANADIAN GROWTH STEVE LINGARD / BRENT SMITH 9434 / 9934 /– $17.13 $2.4 0.4 -3.2 0.4 22.4 N/A N/A N/A 22.1 (OCT.’08)<br />
SWE FRANKLIN TEMPLETON QUOTENTIAL GLOBAL GROWTH STEVE LINGARD / BRENT SMITH 9435 / 9935 /– $12.61 $0.9 0.1 -2.2 0.1 13.3 N/A N/A N/A 9.0 (OCT.’08)<br />
SWE FRANKLIN TEMPLETON QUOTENTIAL MAXIMUM GROWTH STEVE LINGARD / BRENT SMITH 9436 / 9936 /– $16.22 $1.1 -0.1 -2.7 -0.1 16.4 N/A N/A N/A 19.7 (OCT.’08)<br />
NAV<br />
(CDN)<br />
FUND<br />
ASSETS<br />
($MM)<br />
Y–T–D<br />
(%)<br />
1<br />
MTH<br />
(%)*<br />
6<br />
MTH<br />
(%)*<br />
1 YR<br />
(%)<br />
3 YR<br />
(%)<br />
5 YR<br />
(%)<br />
10 YR<br />
(%)<br />
SINCE<br />
INCEPTION<br />
(%)<br />
*simple rates of return<br />
2 1formerly SunWise Elite Trimark Income Growth formerly SunWise Elite Trimark Global Balanced<br />
†For the SunWise Elite Plus (the Guaranteed Minimum Withdrawal Benefit) fund code, add a “P” to the end of the SunWise Elite fund code.<br />
FOR DEALER USE ONLY<br />
MONTHLY PERFORMANCE SCORECARD AS AT JUNE 30, 2011 93
SunWise<br />
®<br />
Elite<br />
Funds<br />
Combined Guarantee cont’d<br />
Issued by Sun Life Assurance Company of Canada<br />
LEAD MANAGER<br />
CDN $<br />
FUND CODE † : <strong>CI</strong>G<br />
ISC / DSC / LSC<br />
NAV<br />
(CDN)<br />
FUND<br />
ASSETS<br />
($MM)<br />
Y–T–D<br />
(%)<br />
1<br />
MTH<br />
(%)*<br />
6<br />
MTH<br />
(%)*<br />
1 YR<br />
(%)<br />
3 YR<br />
(%)<br />
5 YR<br />
(%)<br />
10 YR<br />
(%)<br />
SINCE<br />
INCEPTION<br />
(%)<br />
SUNWISE ELITE MACKENZIE CUNDILL CANADIAN BALANCED D. SLATER / L. CHIN 7275 / 7075 /– $12.36 $16.2 2.9 -1.9 2.9 16.5 6.9 4.0 N/A 3.8 (OCT.’05)<br />
SUNWISE ELITE MACKENZIE CUNDILL CANADIAN SECURITY D. SLATER / L. CHIN 7271 / 7071 /– $11.77 $7.3 4.5 -2.6 4.5 25.9 8.2 3.2 N/A 2.9 (OCT.’05)<br />
SUNWISE ELITE MACKENZIE CUNDILL VALUE A. MASSIE / D. TILEY 7292 / 7092 /– $8.43 $38.5 -0.1 -2.7 -0.1 17.7 0.8 N/A N/A -4.0 (APR.’07)<br />
SUNWISE ELITE MANULIFE GLOBAL MONTHLY INCOME DANNY TOMKA 7603 / 7653 /– $9.44 $3.5 -3.9 -3.8 -3.9 4.1 -1.0 N/A N/A -1.8 (MAR.’08)<br />
SUNWISE ELITE MANULIFE GLOBAL OPPORTUNITIES CHRISTOPHER ARBUTHNOT 7604 / 7654 /– $10.74 $1.9 -9.4 -4.1 -9.4 12.6 2.5 N/A N/A 2.2 (MAR.’08)<br />
SUNWISE ELITE NORTHWEST GROWTH AND INCOME MULTI-MANAGER 7602 / 7652 /– $10.32 $6.8 3.8 -2.4 3.8 14.9 1.5 N/A N/A 1.0 (MAR.’08)<br />
SUNWISE ELITE PORTFOLIO SERIES BALANCED <strong>CI</strong> INVESTMENT CONSULTING 7278 / 7078 /– $11.70 $277.2 1.0 -1.8 1.0 12.9 1.3 1.8 N/A 2.8 (OCT.’05)<br />
SUNWISE ELITE PORTFOLIO SERIES BALANCED GROWTH <strong>CI</strong> INVESTMENT CONSULTING 7281 / 7081 /– $11.22 $170.9 0.7 -1.9 0.7 14.1 0.9 1.5 N/A 2.1 (OCT.’05)<br />
SUNWISE ELITE PORTFOLIO SERIES CONSERVATIVE <strong>CI</strong> INVESTMENT CONSULTING 7279 / 7079 /– $12.12 $104.7 1.6 -1.4 1.6 11.3 2.7 2.7 N/A 3.5 (OCT.’05)<br />
SUNWISE ELITE PORTFOLIO SERIES CONSERVATIVE BALANCED <strong>CI</strong> INVESTMENT CONSULTING 7282 / 7082 /– $11.72 $98.2 1.5 -1.5 1.5 11.9 2.2 2.3 N/A 2.8 (OCT.’05)<br />
SUNWISE ELITE PORTFOLIO SERIES GROWTH <strong>CI</strong> INVESTMENT CONSULTING 7283 / 7083 /– $10.73 $63.6 0.4 -2.1 0.4 14.8 -0.3 0.6 N/A 1.3 (OCT.’05)<br />
SUNWISE ELITE PORTFOLIO SERIES INCOME <strong>CI</strong> INVESTMENT CONSULTING 7280 / 7080 /– $12.55 $97.3 2.7 -1.1 2.7 10.2 5.0 4.1 N/A 4.1 (OCT.’05)<br />
SUNWISE ELITE PORTFOLIO SERIES MAXIMUM GROWTH <strong>CI</strong> INVESTMENT CONSULTING 7284 / 7084 /– $10.37 $17.9 0.0 -2.4 0.0 17.0 -1.9 -0.3 N/A 0.6 (OCT.’05)<br />
SUNWISE ELITE RBC CANADIAN DIVIDEND S. KEDWELL / D. RAYMOND 7298 / 7098 /– $10.04 $82.4 2.8 -2.0 2.8 15.8 1.1 N/A N/A 0.1 (APR.’07)<br />
SUNWISE ELITE RBC O.’SHAUGHNESSY INTERNATIONAL EQUITY JIM O.’SHAUGHNESSY 7297 / 7097 /– $6.03 $5.3 3.3 -1.5 3.3 25.9 -6.3 N/A N/A -11.3 (APR.’07)<br />
SUNWISE ELITE TD CANADIAN BOND S. RAI / G. WILSON 7296 / 7096 /– $11.75 $147.8 1.4 -0.1 1.4 2.7 4.9 N/A N/A 3.9 (APR.’07)<br />
SunWise<br />
®<br />
Full Guarantee<br />
Elite<br />
Funds<br />
Issued by Sun Life Assurance Company of Canada<br />
SUNWISE ELITE <strong>CI</strong> AMERICAN VALUE W. PRIEST / D. PEARL 7161 / 7011 /– $9.15 $5.4 1.9 -2.7 1.9 15.1 -3.0 -1.3 N/A -1.6 (OCT.’05)<br />
SUNWISE ELITE <strong>CI</strong> CAMBRIDGE CANADIAN ASSET ALLOCATION CORPORATE ALAN RADLO 7707 / 7757 /– $11.46 $23.8 4.6 -0.3 4.6 21.8 3.4 N/A N/A 4.3 (MAR.’08)<br />
SUNWISE ELITE <strong>CI</strong> CAMBRIDGE CANADIAN EQUITY CORPORATE ALAN RADLO 7708 / 7758 /– $10.30 $11.2 3.0 -1.6 3.0 21.0 -0.4 N/A N/A 0.9 (MAR.’08)<br />
SUNWISE ELITE <strong>CI</strong> CAMBRIDGE CORE CANADIAN EQUITY CORPORATE 1 ALAN RADLO 7165 / 7015 /– $10.02 $12.0 3.0 -1.6 3.0 23.4 -3.6 -2.3 N/A 0.0 (OCT.’05)<br />
SUNWISE ELITE <strong>CI</strong> CAMBRIDGE CORE GLOBAL EQUITY CORPORATE 2 ALAN RADLO 7155 / 7005 /– $7.69 $11.0 -0.8 -1.3 -0.8 11.9 -5.6 -6.1 N/A -4.5 (OCT.’05)<br />
SUNWISE ELITE <strong>CI</strong> CAMBRIDGE GLOBAL EQUITY CORPORATE ALAN RADLO 7709 / 7759 /– $10.03 $10.2 -0.8 -1.3 -0.8 17.4 -1.8 N/A N/A 0.1 (MAR.’08)<br />
SUNWISE ELITE <strong>CI</strong> CANADIAN INVESTMENT DANIEL BUBIS 7166 / 7016 /– $12.00 $103.4 0.2 -2.4 0.2 18.2 -0.4 1.8 N/A 3.3 (OCT.’05)<br />
SUNWISE ELITE <strong>CI</strong> GLOBAL E. BUSHELL / S. VALI 7150 / 7000 /– $7.85 $3.6 -1.8 -2.4 -1.8 14.8 -5.7 -5.3 N/A -4.2 (OCT.’05)<br />
SUNWISE ELITE <strong>CI</strong> GLOBAL BOND J. DUTKIEWICZ / J. SHAW 7186 / 7036 /– $12.19 $6.3 1.4 -0.2 1.4 1.2 5.2 5.0 N/A 3.6 (OCT.’05)<br />
SUNWISE ELITE <strong>CI</strong> GLOBAL HIGH DIVIDEND ADVANTAGE PRIEST / SAPPENFIELD / WELHOELTER 7195 / 7045 /– $7.86 $6.6 4.4 -2.1 4.4 18.4 -0.8 N/A N/A -5.4 (APR.’07)<br />
SUNWISE ELITE <strong>CI</strong> GLOBAL VALUE JOHN HOCK 7151 / 7001 /– $8.56 $2.9 -0.5 -2.5 -0.5 12.6 -0.8 -3.8 N/A -2.7 (OCT.’05)<br />
SUNWISE ELITE <strong>CI</strong> HARBOUR G. COLEMAN / S. JENKINS 7167 / 7017 /– $12.58 $221.5 -0.2 -1.8 -0.2 15.6 -0.8 2.4 N/A 4.1 (OCT.’05)<br />
SUNWISE ELITE <strong>CI</strong> HARBOUR FOREIGN EQUITY CORPORATE S. JENKINS / G. COLEMAN 7193 / 7043 /– $7.91 $12.1 1.2 -1.9 1.2 16.5 -3.2 N/A N/A -5.4 (APR.’07)<br />
SUNWISE ELITE <strong>CI</strong> HARBOUR FOREIGN GROWTH & INCOME CORP. S. JENKINS / G. COLEMAN 7194 / 7044 /– $8.89 $11.3 -0.2 -2.2 -0.2 12.1 -0.8 N/A N/A -2.8 (APR.’07)<br />
SUNWISE ELITE <strong>CI</strong> HARBOUR GROWTH & INCOME G. COLEMAN / S. JENKINS 7173 / 7023 /– $11.99 $271.3 -0.7 -1.5 -0.7 12.4 -0.4 2.0 N/A 3.3 (OCT.’05)<br />
SUNWISE ELITE <strong>CI</strong> INTERNATIONAL BALANCED BUSHELL / D’ANGELO / BRODEUR 7157 / 7007 /– $9.81 $3.2 -1.2 -1.6 -1.2 10.5 -0.9 -0.7 N/A -0.3 (OCT.’05)<br />
SUNWISE ELITE <strong>CI</strong> INTERNATIONAL VALUE JOHN HOCK 7152 / 7002 /– $9.13 $7.0 0.0 -1.7 0.0 13.7 -1.2 -3.4 N/A -1.6 (OCT.’05)<br />
SUNWISE ELITE <strong>CI</strong> MONEY MARKET PAUL SIMON 7190 / 7040 /– $10.73 $70.2 0.2 0.0 0.2 0.2 0.0 1.1 N/A 1.3 (OCT.’05)<br />
SUNWISE ELITE <strong>CI</strong> SIGNATURE CANADIAN BALANCED E. BUSHELL / J. DUTKIEWICZ 7172 / 7022 /– $12.41 $15.5 0.4 -1.8 0.4 12.8 2.8 3.5 N/A 3.9 (OCT.’05)<br />
SUNWISE ELITE <strong>CI</strong> SIGNATURE CANADIAN BOND JAMES DUTKIEWICZ 7185 / 7035 /– $11.98 $46.1 1.4 -0.2 1.4 2.5 4.0 3.8 N/A 3.2 (OCT.’05)<br />
SUNWISE ELITE <strong>CI</strong> SIGNATURE DIVIDEND ERIC BUSHELL 7188 / 7038 /– $12.12 $76.3 3.2 -1.8 3.2 14.9 5.6 2.9 N/A 3.5 (OCT.’05)<br />
*simple rates of return<br />
1<br />
formerly SunWise Elite Trimark Canadian First Class<br />
2<br />
formerly SunWise Elite Trimark Select Growth<br />
†For the SunWise Elite Plus (the Guaranteed Minimum Withdrawal Benefit) fund code, add a “P” to the end of the SunWise Elite fund code.<br />
FOR DEALER USE ONLY<br />
MONTHLY PERFORMANCE SCORECARD AS AT JUNE 30, 2011 94
SunWise<br />
®<br />
Full Guarantee cont’d<br />
Elite<br />
Funds<br />
CDN $<br />
FUND CODE † : <strong>CI</strong>G<br />
ISC / DSC / LSC<br />
LEAD MANAGER<br />
Issued by Sun Life Assurance Company of Canada<br />
SUNWISE ELITE <strong>CI</strong> SIGNATURE GLOBAL INCOME & GROWTH ERIC BUSHELL 7701 / 7751 /– $10.55 $2.6 -1.4 -2.8 -1.4 11.1 1.9 N/A N/A 1.7 (MAR.’08)<br />
SUNWISE ELITE <strong>CI</strong> SIGNATURE HIGH INCOME ERIC BUSHELL 7189 / 7039 /– $13.36 $145.7 3.6 -1.5 3.6 16.4 4.8 3.8 N/A 5.2 (OCT.’05)<br />
SUNWISE ELITE <strong>CI</strong> SIGNATURE INCOME & GROWTH E. BUSHELL / J. DUTKIEWICZ 7176 / 7026 /– $12.94 $99.2 0.9 -1.9 0.9 13.9 2.7 3.6 N/A 4.7 (OCT.’05)<br />
SUNWISE ELITE <strong>CI</strong> SIGNATURE SELECT CANADIAN ERIC BUSHELL 7168 / 7018 /– $12.79 $85.4 0.0 -2.4 0.0 16.7 0.1 2.9 N/A 4.4 (OCT.’05)<br />
SUNWISE ELITE <strong>CI</strong> SIGNATURE SELECT CANADIAN BALANCED 1 E. BUSHELL / J. DUTKIEWICZ 7177 / 7027 /– $10.49 $19.3 0.4 -1.8 0.4 11.5 1.8 0.9 N/A 0.8 (OCT.’05)<br />
SUNWISE ELITE <strong>CI</strong> SIGNATURE SELECT GLOBAL INCOME & GROWTH CORP. 2 ERIC BUSHELL 7159 / 7009 /– $9.77 $15.4 -1.4 -2.7 -1.4 9.2 -2.0 -1.4 N/A -0.4 (OCT.’05)<br />
SUNWISE ELITE <strong>CI</strong> SYNERGY AMERICAN DAVID PICTON 7162 / 7012 /– $8.51 $1.7 1.6 -2.6 1.6 16.9 -5.0 -3.4 N/A -2.8 (OCT.’05)<br />
SUNWISE ELITE <strong>CI</strong> SYNERGY CANADIAN DAVID PICTON 7169 / 7019 /– $11.65 $10.5 -0.3 -2.4 -0.3 17.8 -3.1 0.9 N/A 2.7 (OCT.’05)<br />
SUNWISE ELITE <strong>CI</strong> SYNERGY GLOBAL CORPORATE DAVID PICTON 7153 / 7003 /– $8.94 $5.4 1.1 -2.2 1.1 17.8 -5.4 -3.5 N/A -2.0 (OCT.’05)<br />
SUNWISE ELITE <strong>CI</strong> VALUE TRUST CORPORATE A. RADLO / B. SNOW 7163 / 7013 /– $4.99 $2.0 -2.5 -2.2 -2.5 8.5 -6.1 -11.7 N/A -11.5 (OCT.’05)<br />
SUNWISE ELITE DYNAMIC GLOBAL VALUE CHUK WONG 7191 / 7041 /– $7.98 $9.5 -6.1 -2.9 -6.1 7.7 -3.0 N/A N/A -5.2 (APR.’07)<br />
SUNWISE ELITE DYNAMIC POWER AMERICAN GROWTH NOAH BLACKSTEIN 7160 / 7010 /– $12.14 $11.4 15.3 2.0 15.3 49.3 5.0 6.2 N/A 3.5 (OCT.’05)<br />
SUNWISE ELITE FIDELITY CANADIAN ASSET ALLOCATION D. YOUNG / G. STEIN 7174 / 7024 /– $12.57 $118.4 -2.3 -2.3 -2.3 10.1 -0.1 3.9 N/A 4.1 (OCT.’05)<br />
SUNWISE ELITE FIDELITY GLOBAL ASSET ALLOCATION MICHAEL STRONG 7158 / 7008 /– $10.28 $4.6 -2.0 -2.3 -2.0 6.7 -1.0 0.3 N/A 0.5 (OCT.’05)<br />
SUNWISE ELITE FIDELITY GROWTH AMERICA JOHN POWER 7164 / 7014 /– $6.76 $2.2 -1.7 -3.2 -1.7 14.0 -4.3 -7.3 N/A -6.7 (OCT.’05)<br />
SUNWISE ELITE FIDELITY NORTHSTAR ® C. MO / J. TILLINGHAST 7154 / 7004 /– $9.44 $26.9 -1.5 -1.9 -1.5 12.6 -2.5 -1.6 N/A -1.0 (OCT.’05)<br />
SUNWISE ELITE FIDELITY TRUE NORTH ® MAXIME LEMIEUX 7170 / 7020 /– $12.06 $68.5 -1.8 -2.7 -1.8 14.2 -5.2 2.8 N/A 3.4 (OCT.’05)<br />
SWE FRANKLIN TEMPLETON QUOTENTIAL DIVERSIFIED INCOME STEVE LINGARD / BRENT SMITH 9409 / 9909 /– $12.74 $2.5 1.6 -1.0 1.6 6.3 N/A N/A N/A 9.4 (OCT.’08)<br />
SWE FRANKLIN TEMPLETON QUOTENTIAL BALANCED INCOME STEVE LINGARD / BRENT SMITH 9410 / 9910 /– $13.37 $3.6 0.2 -1.5 0.2 7.6 N/A N/A N/A 11.4 (OCT.’08)<br />
SWE FRANKLIN TEMPLETON QUOTENTIAL BALANCED GROWTH STEVE LINGARD / BRENT SMITH 9411 / 9911 /– $13.78 $3.1 -0.3 -2.0 -0.3 10.1 N/A N/A N/A 12.6 (OCT.’08)<br />
SWE FRANKLIN TEMPLETON QUOTENTIAL GLOBAL BALANCED STEVE LINGARD / BRENT SMITH 9412 / 9912 /– $13.09 $0.1 -0.3 -1.7 -0.3 8.2 N/A N/A N/A 10.5 (OCT.’08)<br />
SWE FRANKLIN TEMPLETON QUOTENTIAL GROWTH STEVE LINGARD / BRENT SMITH 9413 / 9913 /– $14.13 $1.3 -0.8 -2.3 -0.8 11.7 N/A N/A N/A 13.7 (OCT.’08)<br />
SWE FRANKLIN TEMPLETON QUOTENTIAL CANADIAN GROWTH STEVE LINGARD / BRENT SMITH 9414 / 9914 /– $16.66 $2.2 0.1 -3.3 0.1 21.7 N/A N/A N/A 20.9 (OCT.’08)<br />
SWE FRANKLIN TEMPLETON QUOTENTIAL GLOBAL GROWTH STEVE LINGARD / BRENT SMITH 9415 / 9915 /– $12.20 $0.2 -0.2 -2.3 -0.2 12.8 N/A N/A N/A 7.7 (OCT.’08)<br />
SWE FRANKLIN TEMPLETON QUOTENTIAL MAXIMUM GROWTH STEVE LINGARD / BRENT SMITH 9416 / 9916 /– $12.83 $0.6 -0.3 -2.7 -0.3 15.8 N/A N/A N/A 9.7 (OCT.’08)<br />
SUNWISE ELITE MACKENZIE CUNDILL CANADIAN BALANCED D. SLATER / L. CHIN 7175 / 7025 /– $12.06 $20.5 2.6 -2.0 2.6 16.0 6.4 3.5 N/A 3.4 (OCT.’05)<br />
SUNWISE ELITE MACKENZIE CUNDILL CANADIAN SECURITY D. SLATER / L. CHIN 7171 / 7021 /– $12.18 $11.3 4.3 -2.7 4.3 25.3 7.6 2.7 N/A 3.5 (OCT.’05)<br />
SUNWISE ELITE MACKENZIE CUNDILL VALUE A. MASSIE / D. TILEY 7192 / 7042 /– $8.26 $22.9 -0.2 -2.7 -0.2 17.3 0.4 N/A N/A -4.4 (APR.’07)<br />
SUNWISE ELITE MANULIFE GLOBAL MONTHLY INCOME DANNY TOMKA 7703 / 7753 /– $9.33 $0.8 -4.1 -3.8 -4.1 3.6 -1.4 N/A N/A -2.1 (MAR.’08)<br />
SUNWISE ELITE MANULIFE GLOBAL OPPORTUNITIES CHRISTOPHER ARBUTHNOT 7704 / 7754 /– $10.26 $2.7 -9.6 -4.1 -9.6 12.1 2.1 N/A N/A 0.8 (MAR.’08)<br />
SUNWISE ELITE NORTHWEST GROWTH AND INCOME MULTI-MANAGER 7702 / 7752 /– $9.95 $1.1 3.8 -2.3 3.8 14.8 1.1 N/A N/A -0.2 (MAR.’08)<br />
SUNWISE ELITE PORTFOLIO SERIES BALANCED <strong>CI</strong> INVESTMENT CONSULTING 7178 / 7028 /– $11.50 $167.8 0.9 -1.8 0.9 12.4 0.9 1.4 N/A 2.5 (OCT.’05)<br />
SUNWISE ELITE PORTFOLIO SERIES BALANCED GROWTH <strong>CI</strong> INVESTMENT CONSULTING 7181 / 7031 /– $10.97 $73.6 0.5 -2.0 0.5 13.6 0.5 1.1 N/A 1.6 (OCT.’05)<br />
SUNWISE ELITE PORTFOLIO SERIES CONSERVATIVE <strong>CI</strong> INVESTMENT CONSULTING 7179 / 7029 /– $11.68 $73.8 1.4 -1.4 1.4 10.8 2.2 2.3 N/A 2.8 (OCT.’05)<br />
SUNWISE ELITE PORTFOLIO SERIES CONSERVATIVE BALANCED <strong>CI</strong> INVESTMENT CONSULTING 7182 / 7032 /– $11.38 $54.1 1.2 -1.6 1.2 11.5 1.7 1.8 N/A 2.3 (OCT.’05)<br />
SUNWISE ELITE PORTFOLIO SERIES GROWTH <strong>CI</strong> INVESTMENT CONSULTING 7183 / 7033 /– $10.52 $30.3 0.1 -2.1 0.1 14.2 -0.8 0.1 N/A 0.9 (OCT.’05)<br />
SUNWISE ELITE PORTFOLIO SERIES INCOME <strong>CI</strong> INVESTMENT CONSULTING 7180 / 7030 /– $12.51 $46.3 2.6 -1.1 2.6 10.0 4.9 4.0 N/A 4.0 (OCT.’05)<br />
SUNWISE ELITE PORTFOLIO SERIES MAXIMUM GROWTH <strong>CI</strong> INVESTMENT CONSULTING 7184 / 7034 /– $10.14 $12.0 -0.3 -2.5 -0.3 16.4 -2.3 -0.8 N/A 0.2 (OCT.’05)<br />
SUNWISE ELITE RBC CANADIAN DIVIDEND S. KEDWELL / D. RAYMOND 7198 / 7048 /– $9.86 $40.7 2.5 -2.2 2.5 15.2 0.6 N/A N/A -0.3 (APR.’07)<br />
SUNWISE ELITE RBC O.’SHAUGHNESSY INTERNATIONAL EQUITY JIM O.’SHAUGHNESSY 7197 / 7047 /– $5.90 $3.5 2.8 -1.7 2.8 25.0 -6.9 N/A N/A -11.8 (APR.’07)<br />
SUNWISE ELITE TD CANADIAN BOND S. RAI / G. WILSON 7196 / 7046 /– $11.70 $37.2 1.3 -0.1 1.3 2.6 4.8 N/A N/A 3.8 (APR.’07)<br />
NAV<br />
(CDN)<br />
FUND<br />
ASSETS<br />
($MM)<br />
Y–T–D<br />
(%)<br />
1<br />
MTH<br />
(%)*<br />
6<br />
MTH<br />
(%)*<br />
1 YR<br />
(%)<br />
3 YR<br />
(%)<br />
5 YR<br />
(%)<br />
10 YR<br />
(%)<br />
SINCE<br />
INCEPTION<br />
(%)<br />
*simple rates of return<br />
1<br />
formerly SunWise Elite Trimark Income Growth<br />
2<br />
formerly SunWise Elite Trimark Global Balanced<br />
†For the SunWise Elite Plus (the Guaranteed Minimum Withdrawal Benefit) fund code, add a “P” to the end of the SunWise Elite fund code.<br />
FOR DEALER USE ONLY<br />
MONTHLY PERFORMANCE SCORECARD AS AT JUNE 30, 2011 95
SunWise<br />
®<br />
Income Class<br />
Essential<br />
Series<br />
Issued by Sun Life Assurance Company of Canada<br />
LEAD MANAGER<br />
CDN $<br />
FUND CODE: <strong>CI</strong>G<br />
ISC / DSC / LSC<br />
SUNWISE ESSENTIAL <strong>CI</strong> MONEY MARKET PAUL SIMON 12776 / 12876 /– $10.02 $12.4 0.2 0.0 0.2 N/A N/A N/A N/A 0.2 (SEPT.’10)<br />
SUNWISE ESSENTIAL <strong>CI</strong> SIGNATURE DIVERSIFIED YIELD ERIC BUSHELL 12773 / 12873 /– $10.41 $16.9 2.7 -1.3 2.7 N/A N/A N/A N/A 4.1 (SEPT.’10)<br />
SUNWISE ESSENTIAL <strong>CI</strong> SIGNATURE HIGH INCOME ERIC BUSHELL 12774 / 12874 /– $10.81 $37.1 3.9 -1.5 3.9 N/A N/A N/A N/A 8.1 (SEPT.’10)<br />
SUNWISE ESSENTIAL <strong>CI</strong> CAMBRIDGE CDN. ASSET ALLOCATION ALAN RADLO 12727 / 12827 /– $11.35 $7.1 5.2 -0.3 5.2 N/A N/A N/A N/A 13.5 (SEPT.’10)<br />
SUNWISE ESSENTIAL <strong>CI</strong> HARBOUR FOREIGN GROWTH & INCOME S. JENKINS / G. COLEMAN 12710 / 12810 /– $10.88 $3.8 0.5 -2.1 0.5 N/A N/A N/A N/A 8.8 (SEPT.’10)<br />
SUNWISE ESSENTIAL <strong>CI</strong> HARBOUR GROWTH & INCOME G. COLEMAN / S. JENKINS 12728 / 12828 /– $10.83 $22.6 -0.2 -1.4 -0.2 N/A N/A N/A N/A 8.3 (SEPT.’10)<br />
SUNWISE ESSENTIAL <strong>CI</strong> INTERNATIONAL BALANCED E. BUSHELL / J. DUTKIEWICZ 12711 / 12811 /– $9.97 $0.2 -0.4 -1.5 -0.4 N/A N/A N/A N/A -0.3 (SEPT.’10)<br />
SUNWISE ESSENTIAL <strong>CI</strong> SIGNATURE CANADIAN BALANCED E. BUSHELL / J. DUTKIEWICZ 12729 / 12829 /– $10.75 $9.3 1.1 -1.6 1.1 N/A N/A N/A N/A 7.5 (SEPT.’10)<br />
SUNWISE ESSENTIAL <strong>CI</strong> SIGNATURE GLOBAL INCOME & GROWTH ERIC BUSHELL 12712 / 12812 /– $10.40 $2.3 -0.8 -2.7 -0.8 N/A N/A N/A N/A 4.0 (SEPT.’10)<br />
SUNWISE ESSENTIAL <strong>CI</strong> SIGNATURE INCOME & GROWTH E. BUSHELL / J. DUTKIEWICZ 12730 / 12830 /– $10.76 $25.5 1.5 -1.7 1.5 N/A N/A N/A N/A 7.6 (SEPT.’10)<br />
SUNWISE ESSENTIAL FIDELITY CANADIAN ASSET ALLOCATION MULTI-MANAGER 12731 / 12831 /– $10.49 $14.2 -1.7 -2.1 -1.7 N/A N/A N/A N/A 4.9 (SEPT.’10)<br />
SUNWISE ESSENTIAL FIDELITY GLOBAL ASSET ALLOCATION MULTI-MANAGER 12714 / 12814 /– $9.85 $0.8 -1.2 -2.2 -1.2 N/A N/A N/A N/A -1.5 (SEPT.’10)<br />
SUNWISE ESSENTIAL <strong>CI</strong> AMERICAN VALUE BUNDLE MULTI-MANAGER 12739 / 12839 /– $10.57 $1.7 3.1 -1.9 3.1 N/A N/A N/A N/A 5.7 (SEPT.’10)<br />
SUNWISE ESSENTIAL <strong>CI</strong> CAMBRIDGE CANADIAN EQUITY BUNDLE MULTI-MANAGER 12740 / 12840 /– $11.24 $4.3 3.6 -1.3 3.6 N/A N/A N/A N/A 12.4 (SEPT.’10)<br />
SUNWISE ESSENTIAL <strong>CI</strong> CAMBRIDGE GLOBAL EQUITY BUNDLE MULTI-MANAGER 12741 / 12841 /– $10.50 $3.5 0.9 -1.1 0.9 N/A N/A N/A N/A 5.0 (SEPT.’10)<br />
SUNWISE ESSENTIAL <strong>CI</strong> CAMBRIDGE DIVERSIFIED BUNDLE MULTI-MANAGER 12742 / 12842 /– $10.84 $5.4 3.7 -1.5 3.7 N/A N/A N/A N/A 8.4 (SEPT.’10)<br />
SUNWISE ESSENTIAL <strong>CI</strong> CANADIAN INVESTMENT BUNDLE MULTI-MANAGER 12743 / 12843 /– $10.79 $11.6 1.5 -1.9 1.5 N/A N/A N/A N/A 7.9 (SEPT.’10)<br />
SUNWISE ESSENTIAL <strong>CI</strong> GLOBAL BUNDLE MULTI-MANAGER 12744 / 12844 /– $10.21 $0.3 -0.3 -2.4 -0.3 N/A N/A N/A N/A 2.1 (SEPT.’10)<br />
SUNWISE ESSENTIAL <strong>CI</strong> GLOBAL VALUE BUNDLE MULTI-MANAGER 12745 / 12845 /– $10.33 $0.4 1.0 -2.2 1.0 N/A N/A N/A N/A 3.3 (SEPT.’10)<br />
SUNWISE ESSENTIAL <strong>CI</strong> HARBOUR BUNDLE MULTI-MANAGER 12747 / 12847 /– $10.94 $30.0 1.1 -1.4 1.1 N/A N/A N/A N/A 9.4 (SEPT.’10)<br />
SUNWISE ESSENTIAL <strong>CI</strong> HARBOUR DIVERSIFIED BUNDLE MULTI-MANAGER 12748 / 12848 /– $10.97 $31.3 2.1 -1.4 2.1 N/A N/A N/A N/A 9.7 (SEPT.’10)<br />
SUNWISE ESSENTIAL <strong>CI</strong> INTERNATIONAL VALUE BUNDLE MULTI-MANAGER 12749 / 12849 /– $10.29 $0.4 1.3 -1.4 1.3 N/A N/A N/A N/A 2.9 (SEPT.’10)<br />
SUNWISE ESSENTIAL <strong>CI</strong> SIGNATURE SELECT CANADIAN BUNDLE MULTI-MANAGER 12750 / 12850 /– $10.84 $25.6 1.3 -1.8 1.3 N/A N/A N/A N/A 8.4 (SEPT.’10)<br />
SUNWISE ESSENTIAL <strong>CI</strong> SIGNATURE DIVIDEND BUNDLE MULTI-MANAGER 12751 / 12851 /– $10.66 $10.0 3.1 -1.7 3.1 N/A N/A N/A N/A 6.6 (SEPT.’10)<br />
SUNWISE ESSENTIAL <strong>CI</strong> SYNERGY AMERICAN BUNDLE MULTI-MANAGER 12752 / 12852 /– $10.83 $0.7 2.7 -2.1 2.7 N/A N/A N/A N/A 8.3 (SEPT.’10)<br />
SUNWISE ESSENTIAL <strong>CI</strong> SYNERGY CANADIAN BUNDLE MULTI-MANAGER 12753 / 12853 /– $10.63 $1.1 1.0 -1.9 1.0 N/A N/A N/A N/A 6.3 (SEPT.’10)<br />
SUNWISE ESSENTIAL <strong>CI</strong> SYNERGY GLOBAL BUNDLE MULTI-MANAGER 12754 / 12854 /– $10.53 $0.5 2.2 -1.8 2.2 N/A N/A N/A N/A 5.3 (SEPT.’10)<br />
SUNWISE ESSENTIAL DYNAMIC CANADIAN VALUE BUNDLE MULTI-MANAGER 12755 / 12855 /– $10.34 $11.9 -1.1 -1.9 -1.1 N/A N/A N/A N/A 3.4 (SEPT.’10)<br />
SUNWISE ESSENTIAL DYNAMIC GLOBAL VALUE BUNDLE MULTI-MANAGER 12756 / 12856 /– $10.11 $5.3 -0.5 -1.5 -0.5 N/A N/A N/A N/A 1.1 (SEPT.’10)<br />
SW ESSENTIAL FIDELITY AMERICAN DIS<strong>CI</strong>PLINED EQUITY BUNDLE MULTI-MANAGER 12757 / 12857 /– $10.32 $1.3 -0.3 -2.2 -0.3 N/A N/A N/A N/A 3.2 (SEPT.’10)<br />
SUNWISE ESSENTIAL FIDELITY DIS<strong>CI</strong>PLINED BUNDLE MULTI-MANAGER 12758 / 12858 /– $10.40 $3.5 -0.9 -2.3 -0.9 N/A N/A N/A N/A 4.0 (SEPT.’10)<br />
SUNWISE ESSENTIAL FIDELITY NORTHSTAR ® BUNDLE MULTI-MANAGER 12759 / 12859 /– $10.34 $3.0 0.0 -1.2 0.0 N/A N/A N/A N/A 3.4 (SEPT.’10)<br />
SUNWISE ESSENTIAL FIDELITY TRUE NORTH ® BUNDLE MULTI-MANAGER 12760 / 12860 /– $10.48 $5.1 -0.4 -2.1 -0.4 N/A N/A N/A N/A 4.8 (SEPT.’10)<br />
SUNWISE ESSENTIAL RBC CANADIAN DIVIDEND BUNDLE MULTI-MANAGER 12761 / 12861 /– $10.62 $9.2 2.6 -1.6 2.6 N/A N/A N/A N/A 6.2 (SEPT.’10)<br />
SUNWISE ESSENTIAL RBC O.’SHAUGHNESSY INT.’L. EQUITY BUNDLE MULTI-MANAGER 12762 / 12862 /– $10.46 $0.4 3.2 -0.9 3.2 N/A N/A N/A N/A 4.6 (SEPT.’10)<br />
SUNWISE ESSENTIAL PORTFOLIO SERIES INCOME MULTI-MANAGER 12732 / 12832 /– $10.40 $11.5 2.7 -1.0 2.7 N/A N/A N/A N/A 4.0 (SEPT.’10)<br />
SUNWISE ESSENTIAL PORTFOLIO SERIES CONSERVATIVE MULTI-MANAGER 12733 / 12833 /– $10.60 $5.9 1.7 -1.0 1.7 N/A N/A N/A N/A 6.0 (SEPT.’10)<br />
SWESS PORTFOLIO SERIES CONSERVATIVE BALANCED MULTI-MANAGER 12734 / 12834 /– $10.56 $8.4 1.5 -1.2 1.5 N/A N/A N/A N/A 5.6 (SEPT.’10)<br />
SUNWISE ESSENTIAL PORTFOLIO SERIES BALANCED MULTI-MANAGER 12735 / 12835 /– $10.57 $17.4 1.5 -1.6 1.5 N/A N/A N/A N/A 5.7 (SEPT.’10)<br />
SUNWISE ESSENTIAL PORTFOLIO SERIES BALANCED GROWTH MULTI-MANAGER 12736 / 12836 /– $10.82 $38.6 1.1 -1.8 1.1 N/A N/A N/A N/A 8.2 (SEPT.’10)<br />
SWESS FRANKLIN TEMPLETON QUOTENTIAL DIVERSIFIED INCOME STEVE LINGARD / BRENT SMITH 12763 / 12863 /– $10.18 $2.1 1.8 -1.0 1.8 N/A N/A N/A N/A 1.8 (SEPT.’10)<br />
SWESS FRANKLIN TEMPLETON QUOTENTIAL BALANCED INCOME STEVE LINGARD / BRENT SMITH 12764 / 12864 /– $10.21 $1.7 0.9 -1.4 0.9 N/A N/A N/A N/A 2.1 (SEPT.’10)<br />
SWESS FRANKLIN TEMPLETON QUOTENTIAL BALANCED GROWTH STEVE LINGARD / BRENT SMITH 12765 / 12865 /– $10.32 $5.0 0.4 -1.9 0.4 N/A N/A N/A N/A 3.2 (SEPT.’10)<br />
SWESS FRANKLIN TEMPLETON QUOTENTIAL GLOBAL BALANCED STEVE LINGARD / BRENT SMITH 12766 / 12866 /– $10.12 $1.3 0.0 -1.7 0.0 N/A N/A N/A N/A 1.2 (SEPT.’10)<br />
NAV<br />
(CDN)<br />
FUND<br />
ASSETS<br />
($MM)<br />
Y–T–D<br />
(%)<br />
1<br />
MTH<br />
(%)*<br />
6<br />
MTH<br />
(%)*<br />
1 YR<br />
(%)<br />
3 YR<br />
(%)<br />
5 YR<br />
(%)<br />
10 YR<br />
(%)<br />
SINCE<br />
INCEPTION<br />
(%)<br />
FOR DEALER USE ONLY<br />
MONTHLY PERFORMANCE SCORECARD AS AT JUNE 30, 2011 96
SunWise<br />
®<br />
Investment Class<br />
Essential<br />
Series<br />
Issued by Sun Life Assurance Company of Canada<br />
LEAD MANAGER<br />
CDN $<br />
FUND CODE: <strong>CI</strong>G<br />
ISC / DSC / LSC<br />
NAV<br />
(CDN)<br />
FUND<br />
ASSETS<br />
($MM)<br />
Y–T–D<br />
(%)<br />
1<br />
MTH<br />
(%)*<br />
6<br />
MTH<br />
(%)*<br />
1 YR<br />
(%)<br />
3 YR<br />
(%)<br />
5 YR<br />
(%)<br />
10 YR<br />
(%)<br />
SINCE<br />
INCEPTION<br />
(%)<br />
SUNWISE ESSENTIAL <strong>CI</strong> MONEY MARKET PAUL SIMON 12176 / 12276 /– $10.02 $16.9 0.2 0.1 0.2 N/A N/A N/A N/A 0.2 (SEPT.’10)<br />
SUNWISE ESSENTIAL <strong>CI</strong> SIGNATURE CANADIAN BOND JAMES DUTKIEWICZ 12171 / 12271 /– $10.10 $4.8 1.4 -0.3 1.4 N/A N/A N/A N/A 1.0 (SEPT.’10)<br />
SUNWISE ESSENTIAL <strong>CI</strong> SIGNATURE CORPORATE BOND G. MARSHALL / J. SHAW / J. DUTKIEWICZ 12172 / 12272 /– $10.40 $4.3 2.4 -1.0 2.4 N/A N/A N/A N/A 4.0 (SEPT.’10)<br />
SUNWISE ESSENTIAL <strong>CI</strong> SIGNATURE DIVERSIFIED YIELD ERIC BUSHELL 12173 / 12273 /– $10.39 $13.5 2.5 -1.4 2.5 N/A N/A N/A N/A 3.9 (SEPT.’10)<br />
SUNWISE ESSENTIAL <strong>CI</strong> SIGNATURE HIGH INCOME ERIC BUSHELL 12174 / 12274 /– $10.73 $39.8 3.8 -1.6 3.8 N/A N/A N/A N/A 7.3 (SEPT.’10)<br />
SUNWISE ESSENTIAL TD CANADIAN BOND S. RAI / G. WILSON 12175 / 12275 /– $10.06 $9.6 1.4 -0.1 1.4 N/A N/A N/A N/A 0.6 (SEPT.’10)<br />
SUNWISE ESSENTIAL <strong>CI</strong> CAMBRIDGE CDN. ASSET ALLOCATION ALAN RADLO 12127 / 12227 /– $11.50 $6.2 5.0 -0.3 5.0 N/A N/A N/A N/A 15.0 (SEPT.’10)<br />
SUNWISE ESSENTIAL <strong>CI</strong> HARBOUR FOREIGN GROWTH & INCOME S. JENKINS / G. COLEMAN 12110 / 12210 /– $10.79 $2.8 0.4 -2.2 0.4 N/A N/A N/A N/A 7.9 (SEPT.’10)<br />
SUNWISE ESSENTIAL <strong>CI</strong> HARBOUR GROWTH & INCOME G. COLEMAN / S. JENKINS 12128 / 12228 /– $10.93 $20.4 -0.4 -1.4 -0.4 N/A N/A N/A N/A 9.3 (SEPT.’10)<br />
SUNWISE ESSENTIAL <strong>CI</strong> INTERNATIONAL BALANCED E. BUSHELL / J. DUTKIEWICZ 12111 / 12211 /– $10.04 $0.2 -0.6 -1.6 -0.6 N/A N/A N/A N/A 0.4 (SEPT.’10)<br />
SUNWISE ESSENTIAL <strong>CI</strong> SIGNATURE CANADIAN BALANCED E. BUSHELL / J. DUTKIEWICZ 12129 / 12229 /– $10.72 $7.2 0.8 -1.7 0.8 N/A N/A N/A N/A 7.2 (SEPT.’10)<br />
SUNWISE ESSENTIAL <strong>CI</strong> SIGNATURE GLOBAL INCOME & GROWTH ERIC BUSHELL 12112 / 12212 /– $10.29 $1.1 -0.9 -2.6 -0.9 N/A N/A N/A N/A 2.9 (SEPT.’10)<br />
SUNWISE ESSENTIAL <strong>CI</strong> SIGNATURE INCOME & GROWTH E. BUSHELL / J. DUTKIEWICZ 12130 / 12230 /– $10.88 $18.4 1.4 -1.8 1.4 N/A N/A N/A N/A 8.8 (SEPT.’10)<br />
SUNWISE ESSENTIAL FIDELITY CANADIAN ASSET ALLOCATION MULTI-MANAGER 12131 / 12231 /– $10.49 $11.1 -2.0 -2.2 -2.0 N/A N/A N/A N/A 4.9 (SEPT.’10)<br />
SUNWISE ESSENTIAL FIDELITY GLOBAL ASSET ALLOCATION MULTI-MANAGER 12114 / 12214 /– $9.75 $0.4 -1.5 -2.3 -1.5 N/A N/A N/A N/A -2.5 (SEPT.’10)<br />
SUNWISE ESSENTIAL <strong>CI</strong> CAMBRIDGE CANADIAN EQUITY ALAN RADLO 12118 / 12218 /– $11.03 $0.3 3.7 -1.5 3.7 N/A N/A N/A N/A 10.3 (SEPT.’10)<br />
SUNWISE ESSENTIAL <strong>CI</strong> CANADIAN INVESTMENT DANIEL DUBIS 12119 / 12219 /– $10.81 $4.8 0.8 -2.3 0.8 N/A N/A N/A N/A 8.1 (SEPT.’10)<br />
SUNWISE ESSENTIAL <strong>CI</strong> HARBOUR G. COLEMAN / S. JENKINS 12120 / 12220 /– $11.03 $7.0 0.5 -1.6 0.5 N/A N/A N/A N/A 10.3 (SEPT.’10)<br />
SUNWISE ESSENTIAL <strong>CI</strong> SIGNATURE DIVIDEND ERIC BUSHELL 12121 / 12221 /– $10.64 $2.4 3.2 -1.8 3.2 N/A N/A N/A N/A 6.4 (SEPT.’10)<br />
SUNWISE ESSENTIAL <strong>CI</strong> SIGNATURE SELECT CANADIAN ERIC BUSHELL 12122 / 12222 /– $10.79 $5.2 0.7 -2.2 0.7 N/A N/A N/A N/A 7.9 (SEPT.’10)<br />
SUNWISE ESSENTIAL <strong>CI</strong> SYNERGY CANADIAN DAVID PICTON 12123 / 12223 /– $10.68 $0.5 0.3 -2.3 0.3 N/A N/A N/A N/A 6.8 (SEPT.’10)<br />
SUNWISE ESSENTIAL DYNAMIC CANADIAN VALUE DAVID TAYLOR 12124 / 12224 /– $10.01 $1.9 -6.5 -3.8 -6.5 N/A N/A N/A N/A 0.1 (SEPT.’10)<br />
SUNWISE ESSENTIAL FIDELITY TRUE NORTH ® MAXIME LEMIEUX 12125 / 12225 /– $10.50 $1.4 -1.5 -2.6 -1.5 N/A N/A N/A N/A 5.0 (SEPT.’10)<br />
SUNWISE ESSENTIAL RBC CANADIAN DIVIDEND D. RAYMOND / S. KEDWELL 12126 / 12226 /– $10.68 $2.1 2.7 -2.1 2.7 N/A N/A N/A N/A 6.8 (SEPT.’10)<br />
SUNWISE ESSENTIAL <strong>CI</strong> AMERICAN VALUE W. PRIEST / D. PEARL 12115 / 12215 /– $10.65 $0.4 3.2 -2.3 3.2 N/A N/A N/A N/A 6.5 (SEPT.’10)<br />
SUNWISE ESSENTIAL <strong>CI</strong> SYNERGY AMERICAN DAVID PICTON 12116 / 12216 /– $10.69 $0.7 2.3 -2.5 2.3 N/A N/A N/A N/A 6.9 (SEPT.’10)<br />
SW ESSENTIAL FIDELITY AMERICAN DIS<strong>CI</strong>PLINED EQUITY ® JOHN POWER 12117 / 12217 /– $10.49 $0.8 -0.4 -2.2 -0.4 N/A N/A N/A N/A 4.9 (SEPT.’10)<br />
SUNWISE ESSENTIAL <strong>CI</strong> CAMBRIDGE GLOBAL EQUITY ALAN RADLO 12101 / 12201 /– $10.85 $0.6 0.0 -1.1 0.0 N/A N/A N/A N/A 8.5 (SEPT.’10)<br />
SUNWISE ESSENTIAL <strong>CI</strong> GLOBAL E. BUSHELL / S. VALI 12102 / 12202 /– $10.28 $0.1 -1.7 -2.9 -1.7 N/A N/A N/A N/A 2.8 (SEPT.’10)<br />
SUNWISE ESSENTIAL <strong>CI</strong> GLOBAL VALUE JOHN HOCK 12103 / 12203 /– $10.48 $0.1 0.0 -2.6 0.0 N/A N/A N/A N/A 4.8 (SEPT.’10)<br />
SUNWISE ESSENTIAL <strong>CI</strong> HARBOUR FOREIGN EQUITY S. JENKINS / G. COLEMAN 12104 / 12204 /– $10.58 $0.8 1.8 -1.8 1.8 N/A N/A N/A N/A 5.8 (SEPT.’10)<br />
SUNWISE ESSENTIAL <strong>CI</strong> INTERNATIONAL VALUE JOHN HOCK 12105 / 12205 /– $10.58 $0.1 0.5 -1.8 0.5 N/A N/A N/A N/A 5.8 (SEPT.’10)<br />
SUNWISE ESSENTIAL <strong>CI</strong> SYNERGY GLOBAL MICHAEL MAHONEY 12106 / 12206 /– $10.69 $0.1 1.7 -2.1 1.7 N/A N/A N/A N/A 6.9 (SEPT.’10)<br />
SUNWISE ESSENTIAL DYNAMIC GLOBAL VALUE CHUK WONG 12107 / 12207 /– $9.13 $0.7 -5.9 -2.8 -5.9 N/A N/A N/A N/A -8.7 (SEPT.’10)<br />
SUNWISE ESSENTIAL FIDELITY NORTHSTAR ® C. MO / J. TILLINGHAST 12108 / 12208 /– $10.51 $0.3 -0.7 -1.7 -0.7 N/A N/A N/A N/A 5.1 (SEPT.’10)<br />
SUNWISE ESSENTIAL RBC O.’SHAUGHNESSY INT.’L. EQUITY J. P. O.’SHAUGHNESSY 12109 / 12209 /– $10.30 $0.1 3.3 -1.4 3.3 N/A N/A N/A N/A 3.0 (SEPT.’10)<br />
SUNWISE ESSENTIAL <strong>CI</strong> AMERICAN VALUE BUNDLE MULTI-MANAGER 12139 / 12239 /– $10.52 $0.5 2.8 -2.0 2.8 N/A N/A N/A N/A 5.2 (SEPT.’10)<br />
SUNWISE ESSENTIAL <strong>CI</strong> CAMBRIDGE CANADIAN EQUITY BUNDLE MULTI-MANAGER 12140 / 12240 /– $11.10 $2.1 3.4 -1.3 3.4 N/A N/A N/A N/A 11.0 (SEPT.’10)<br />
SUNWISE ESSENTIAL <strong>CI</strong> CAMBRIDGE GLOBAL EQUITY BUNDLE MULTI-MANAGER 12141 / 12241 /– $10.63 $1.4 0.8 -1.1 0.8 N/A N/A N/A N/A 6.3 (SEPT.’10)<br />
SUNWISE ESSENTIAL <strong>CI</strong> CAMBRIDGE DIVERSIFIED BUNDLE MULTI-MANAGER 12142 / 12242 /– $10.79 $2.2 3.7 -1.5 3.7 N/A N/A N/A N/A 7.9 (SEPT.’10)<br />
SUNWISE ESSENTIAL <strong>CI</strong> CANADIAN INVESTMENT BUNDLE MULTI-MANAGER 12143 / 12243 /– $10.76 $5.3 1.3 -1.9 1.3 N/A N/A N/A N/A 7.6 (SEPT.’10)<br />
SUNWISE ESSENTIAL <strong>CI</strong> GLOBAL BUNDLE MULTI-MANAGER 12144 / 12244 /– $10.20 $0.1 -0.5 -2.4 -0.5 N/A N/A N/A N/A 2.0 (SEPT.’10)<br />
SUNWISE ESSENTIAL <strong>CI</strong> GLOBAL VALUE BUNDLE MULTI-MANAGER 12145 / 12245 /– $10.31 $0.0 0.8 -2.2 0.8 N/A N/A N/A N/A 3.1 (SEPT.’10)<br />
FOR DEALER USE ONLY<br />
MONTHLY PERFORMANCE SCORECARD AS AT JUNE 30, 2011 97
SunWise<br />
®<br />
Investment Class cont’d<br />
Essential<br />
Series<br />
Issued by Sun Life Assurance Company of Canada<br />
LEAD MANAGER<br />
CDN $<br />
FUND CODE: <strong>CI</strong>G<br />
ISC / DSC / LSC<br />
SUNWISE ESSENTIAL <strong>CI</strong> HARBOUR BUNDLE MULTI-MANAGER 12147 / 12247 /– $10.90 $11.4 0.8 -1.5 0.8 N/A N/A N/A N/A 9.0 (SEPT.’10)<br />
SUNWISE ESSENTIAL <strong>CI</strong> HARBOUR DIVERSIFIED BUNDLE MULTI-MANAGER 12148 / 12248 /– $10.87 $9.2 1.9 -1.5 1.9 N/A N/A N/A N/A 8.7 (SEPT.’10)<br />
SUNWISE ESSENTIAL <strong>CI</strong> INTERNATIONAL VALUE BUNDLE MULTI-MANAGER 12149 / 12249 /– $10.52 $0.1 1.1 -1.5 1.1 N/A N/A N/A N/A 5.2 (SEPT.’10)<br />
SUNWISE ESSENTIAL <strong>CI</strong> SIGNATURE SELECT CANADIAN BUNDLE MULTI-MANAGER 12150 / 12250 /– $10.78 $9.2 1.1 -1.9 1.1 N/A N/A N/A N/A 7.8 (SEPT.’10)<br />
SUNWISE ESSENTIAL <strong>CI</strong> SIGNATURE DIVIDEND BUNDLE MULTI-MANAGER 12151 / 12251 /– $10.62 $4.0 2.9 -1.8 2.9 N/A N/A N/A N/A 6.2 (SEPT.’10)<br />
SUNWISE ESSENTIAL <strong>CI</strong> SYNERGY AMERICAN BUNDLE MULTI-MANAGER 12152 / 12252 /– $10.53 $0.2 2.4 -2.0 2.4 N/A N/A N/A N/A 5.3 (SEPT.’10)<br />
SUNWISE ESSENTIAL <strong>CI</strong> SYNERGY CANADIAN BUNDLE MULTI-MANAGER 12153 / 12253 /– $10.57 $0.8 0.9 -1.9 0.9 N/A N/A N/A N/A 5.7 (SEPT.’10)<br />
SUNWISE ESSENTIAL <strong>CI</strong> SYNERGY GLOBAL BUNDLE MULTI-MANAGER 12154 / 12254 /– $10.58 $0.1 1.9 -1.8 1.9 N/A N/A N/A N/A 5.8 (SEPT.’10)<br />
SUNWISE ESSENTIAL DYNAMIC CANADIAN VALUE BUNDLE MULTI-MANAGER 12155 / 12255 /– $10.28 $2.8 -1.2 -2.0 -1.2 N/A N/A N/A N/A 2.8 (SEPT.’10)<br />
SUNWISE ESSENTIAL DYNAMIC GLOBAL VALUE BUNDLE MULTI-MANAGER 12156 / 12256 /– $9.97 $1.4 -0.8 -1.5 -0.8 N/A N/A N/A N/A -0.3 (SEPT.’10)<br />
SUNWISE ESS FIDELITY AMERICAN DIS<strong>CI</strong>PLINED EQUITY BUNDLE MULTI-MANAGER 12157 / 12257 /– $10.16 $0.2 -0.4 -2.1 -0.4 N/A N/A N/A N/A 1.6 (SEPT.’10)<br />
SUNWISE ESSENTIAL FIDELITY DIS<strong>CI</strong>PLINED BUNDLE MULTI-MANAGER 12158 / 12258 /– $10.34 $2.3 -1.0 -2.4 -1.0 N/A N/A N/A N/A 3.4 (SEPT.’10)<br />
SUNWISE ESSENTIAL FIDELITY NORTHSTAR ® BUNDLE MULTI-MANAGER 12159 / 12259 /– $10.34 $0.3 -0.2 -1.3 -0.2 N/A N/A N/A N/A 3.4 (SEPT.’10)<br />
SUNWISE ESSENTIAL FIDELITY TRUE NORTH ® BUNDLE MULTI-MANAGER 12160 / 12260 /– $10.45 $1.4 -0.6 -2.1 -0.6 N/A N/A N/A N/A 4.5 (SEPT.’10)<br />
SUNWISE ESSENTIAL RBC CANADIAN DIVIDEND BUNDLE MULTI-MANAGER 12161 / 12261 /– $10.45 $3.3 2.5 -1.5 2.5 N/A N/A N/A N/A 4.5 (SEPT.’10)<br />
SUNWISE ESSENTIAL RBC O.’SHAUGHNESSY INT.’L. EQUITY BUNDLE MULTI-MANAGER 12162 / 12262 /– $10.67 $0.2 3.0 -1.0 3.0 N/A N/A N/A N/A 6.7 (SEPT.’10)<br />
SUNWISE ESSENTIAL PORTFOLIO SERIES INCOME MULTI-MANAGER 12132 / 12232 /– $10.47 $14.1 2.5 -1.0 2.5 N/A N/A N/A N/A 4.7 (SEPT.’10)<br />
SUNWISE ESSENTIAL PORTFOLIO SERIES CONSERVATIVE MULTI-MANAGER 12133 / 12233 /– $10.60 $7.6 1.6 -1.0 1.6 N/A N/A N/A N/A 6.0 (SEPT.’10)<br />
SWESS PORTFOLIO SERIES CONSERVATIVE BALANCED MULTI-MANAGER 12134 / 12234 /– $10.31 $6.5 1.3 -1.2 1.3 N/A N/A N/A N/A 3.1 (SEPT.’10)<br />
SUNWISE ESSENTIAL PORTFOLIO SERIES BALANCED MULTI-MANAGER 12135 / 12235 /– $10.63 $11.1 1.3 -1.7 1.3 N/A N/A N/A N/A 6.3 (SEPT.’10)<br />
SUNWISE ESSENTIAL PORTFOLIO SERIES BALANCED GROWTH MULTI-MANAGER 12136 / 12236 /– $10.51 $5.3 1.0 -1.8 1.0 N/A N/A N/A N/A 5.1 (SEPT.’10)<br />
SUNWISE ESSENTIAL PORTFOLIO SERIES GROWTH MULTI-MANAGER 12137 / 12237 /– $10.29 $1.8 0.7 -2.0 0.7 N/A N/A N/A N/A 2.9 (SEPT.’10)<br />
SUNWISE ESSENTIAL PORTFOLIO SERIES MAXIMUM GROWTH MULTI-MANAGER 12138 / 12238 /– $10.45 $0.5 0.2 -2.3 0.2 N/A N/A N/A N/A 4.5 (SEPT.’10)<br />
SWESS FRANKLIN TEMPLETON QUOTENTIAL DIVERSIFIED INCOME STEVE LINGARD / BRENT SMITH 12163 / 12263 /– $10.17 $1.8 1.7 -1.1 1.7 N/A N/A N/A N/A 1.7 (SEPT.’10)<br />
SWESS FRANKLIN TEMPLETON QUOTENTIAL BALANCED INCOME STEVE LINGARD / BRENT SMITH 12164 / 12264 /– $10.30 $1.6 0.6 -1.5 0.6 N/A N/A N/A N/A 3.0 (SEPT.’10)<br />
SWESS FRANKLIN TEMPLETON QUOTENTIAL BALANCED GROWTH STEVE LINGARD / BRENT SMITH 12165 / 12265 /– $10.24 $1.2 0.1 -1.9 0.1 N/A N/A N/A N/A 2.4 (SEPT.’10)<br />
SWESS FRANKLIN TEMPLETON QUOTENTIAL GLOBAL BALANCED STEVE LINGARD / BRENT SMITH 12166 / 12266 /– $10.10 $0.2 -0.2 -1.7 -0.2 N/A N/A N/A N/A 1.0 (SEPT.’10)<br />
SWESS FRANKLIN TEMPLETON QUOTENTIAL GROWTH STEVE LINGARD / BRENT SMITH 12167 / 12267 /– $10.23 $0.1 -0.2 -2.3 -0.2 N/A N/A N/A N/A 2.3 (SEPT.’10)<br />
SWESS FRANKLIN TEMPLETON QUOTENTIAL CANADIAN GROWTH STEVE LINGARD / BRENT SMITH 12168 / 12268 /– $10.29 $0.1 -0.8 -3.2 -0.8 N/A N/A N/A N/A 2.9 (SEPT.’10)<br />
SWESS FRANKLIN TEMPLETON QUOTENTIAL GLOBAL GROWTH STEVE LINGARD / BRENT SMITH 12169 / 12269 /– $10.19 $0.0 -0.1 -2.4 -0.1 N/A N/A N/A N/A 1.9 (SEPT.’10)<br />
SWESS FRANKLIN TEMPLETON QUOTENTIAL MAXIMUM GROWTH STEVE LINGARD / BRENT SMITH 12170 / 12270 /– $10.28 $0.2 0.0 -2.7 0.0 N/A N/A N/A N/A 2.8 (SEPT.’10)<br />
SunWise<br />
®<br />
Estate Class<br />
Essential<br />
Series<br />
Issued by Sun Life Assurance Company of Canada<br />
NAV<br />
(CDN)<br />
FUND<br />
ASSETS<br />
($MM)<br />
Y–T–D<br />
(%)<br />
1<br />
MTH<br />
(%)*<br />
6<br />
MTH<br />
(%)*<br />
1 YR<br />
(%)<br />
3 YR<br />
(%)<br />
5 YR<br />
(%)<br />
10 YR<br />
(%)<br />
SINCE<br />
INCEPTION<br />
(%)<br />
SUNWISE ESSENTIAL <strong>CI</strong> MONEY MARKET PAUL SIMON 12476 / 12576 /–<br />
SUNWISE ESSENTIAL <strong>CI</strong> SIGNATURE CANADIAN BOND JAMES DUTKIEWICZ 12471 / 12571 /–<br />
SUNWISE ESSENTIAL <strong>CI</strong> SIGNATURE CORPORATE BOND G. MARSHALL / J. SHAW / J. DUTKIEWICZ 12472 / 12572 /–<br />
SUNWISE ESSENTIAL <strong>CI</strong> SIGNATURE DIVERSIFIED YIELD ERIC BUSHELL 12473 / 12573 /–<br />
SUNWISE ESSENTIAL <strong>CI</strong> SIGNATURE HIGH INCOME ERIC BUSHELL 12474 / 12574 /–<br />
SUNWISE ESSENTIAL TD CANADIAN BOND S. RAI / G. WILSON 12475 / 12575 /–<br />
SUNWISE ESSENTIAL <strong>CI</strong> CAMBRIDGE CDN. ASSET ALLOCATION ALAN RADLO 12427 / 12527 /–<br />
$10.02 $16.9 0.2 0.1 0.2 N/A N/A N/A N/A 0.2 (SEPT.’10)<br />
$10.10 $4.8 1.4 -0.3 1.4 N/A N/A N/A N/A 1.0 (SEPT.’10)<br />
$10.40 $4.3 2.4 -1.0 2.4 N/A N/A N/A N/A 4.0 (SEPT.’10)<br />
$10.39 $13.5 2.5 -1.4 2.5 N/A N/A N/A N/A 3.9 (SEPT.’10)<br />
$10.73 $39.8 3.8 -1.6 3.8 N/A N/A N/A N/A 7.3 (SEPT.’10)<br />
$10.06 $9.6 1.4 -0.1 1.4 N/A N/A N/A N/A 0.6 (SEPT.’10)<br />
$11.50 $6.2 5.0 -0.3 5.0 N/A N/A N/A N/A 15.0 (SEPT.’10)<br />
FOR DEALER USE ONLY<br />
MONTHLY PERFORMANCE SCORECARD AS AT JUNE 30, 2011 9 8
SunWise<br />
®<br />
Estate Class cont’d<br />
Essential<br />
Series<br />
Issued by Sun Life Assurance Company of Canada<br />
LEAD MANAGER<br />
CDN $<br />
FUND CODE: <strong>CI</strong>G<br />
ISC / DSC / LSC<br />
SUNWISE ESSENTIAL <strong>CI</strong> HARBOUR FOREIGN GROWTH & INCOME S. JENKINS / G. COLEMAN 12410 / 12510 /–<br />
SUNWISE ESSENTIAL <strong>CI</strong> HARBOUR GROWTH & INCOME G. COLEMAN / S. JENKINS 12428 / 12528 /–<br />
SUNWISE ESSENTIAL <strong>CI</strong> INTERNATIONAL BALANCED E. BUSHELL / J. DUTKIEWICZ 12411 / 12511 /–<br />
SUNWISE ESSENTIAL <strong>CI</strong> SIGNATURE CANADIAN BALANCED E. BUSHELL / J. DUTKIEWICZ 12429 / 12529 /–<br />
SUNWISE ESSENTIAL <strong>CI</strong> SIGNATURE GLOBAL INCOME & GROWTH ERIC BUSHELL 12412 / 12512 /–<br />
SUNWISE ESSENTIAL <strong>CI</strong> SIGNATURE INCOME & GROWTH E. BUSHELL / J. DUTKIEWICZ 12430 / 12530 /–<br />
SUNWISE ESSENTIAL FIDELITY CANADIAN ASSET ALLOCATION MULTI-MANAGER 12431 / 12531 /–<br />
SUNWISE ESSENTIAL FIDELITY GLOBAL ASSET ALLOCATION MULTI-MANAGER 12414 / 12514 /–<br />
SUNWISE ESSENTIAL <strong>CI</strong> AMERICAN VALUE BUNDLE MULTI-MANAGER 12439 / 12539 /–<br />
SUNWISE ESSENTIAL <strong>CI</strong> CAMBRIDGE CANADIAN EQUITY BUNDLE MULTI-MANAGER 12440 / 12540 /–<br />
SUNWISE ESSENTIAL <strong>CI</strong> CAMBRIDGE GLOBAL EQUITY BUNDLE MULTI-MANAGER 12441 / 12541 /–<br />
SUNWISE ESSENTIAL <strong>CI</strong> CAMBRIDGE DIVERSIFIED BUNDLE MULTI-MANAGER 12442 / 12542 /–<br />
SUNWISE ESSENTIAL <strong>CI</strong> CANADIAN INVESTMENT BUNDLE MULTI-MANAGER 12443 / 12543 /–<br />
SUNWISE ESSENTIAL <strong>CI</strong> GLOBAL BUNDLE MULTI-MANAGER 12444 / 12544 /–<br />
SUNWISE ESSENTIAL <strong>CI</strong> GLOBAL VALUE BUNDLE MULTI-MANAGER 12445 / 12545 /–<br />
SUNWISE ESSENTIAL <strong>CI</strong> HARBOUR BUNDLE MULTI-MANAGER 12447 / 12547 /–<br />
SUNWISE ESSENTIAL <strong>CI</strong> HARBOUR DIVERSIFIED BUNDLE MULTI-MANAGER 12448 / 12548 /–<br />
SUNWISE ESSENTIAL <strong>CI</strong> INTERNATIONAL VALUE BUNDLE MULTI-MANAGER 12449 / 12549 /–<br />
SUNWISE ESSENTIAL <strong>CI</strong> SIGNATURE SELECT CANADIAN BUNDLE MULTI-MANAGER 12450 / 12550 /–<br />
SUNWISE ESSENTIAL <strong>CI</strong> SIGNATURE DIVIDEND BUNDLE MULTI-MANAGER 12451 / 12551 /–<br />
SUNWISE ESSENTIAL <strong>CI</strong> SYNERGY AMERICAN BUNDLE MULTI-MANAGER 12452 / 12552 /–<br />
SUNWISE ESSENTIAL <strong>CI</strong> SYNERGY CANADIAN BUNDLE MULTI-MANAGER 12453 / 12553 /–<br />
SUNWISE ESSENTIAL <strong>CI</strong> SYNERGY GLOBAL BUNDLE MULTI-MANAGER 12454 / 12554 /–<br />
SUNWISE ESSENTIAL DYNAMIC CANADIAN VALUE BUNDLE MULTI-MANAGER 12455 / 12555 /–<br />
SUNWISE ESSENTIAL DYNAMIC GLOBAL VALUE BUNDLE MULTI-MANAGER 12456 / 12556 /–<br />
SUNWISE ESS FIDELITY AMERICAN DIS<strong>CI</strong>PLINED EQUITY BUNDLE MULTI-MANAGER 12457 / 12557 /–<br />
SUNWISE ESSENTIAL FIDELITY DIS<strong>CI</strong>PLINED BUNDLE MULTI-MANAGER 12458 / 12558 /–<br />
SUNWISE ESSENTIAL FIDELITY NORTHSTAR BUNDLE MULTI-MANAGER 12459 / 12559 /–<br />
SUNWISE ESSENTIAL FIDELITY TRUE NORTH BUNDLE MULTI-MANAGER 12460 / 12560 /–<br />
SUNWISE ESSENTIAL RBC CANADIAN DIVIDEND BUNDLE MULTI-MANAGER 12461 / 12561 /–<br />
SUNWISE ESSENTIAL RBC O.’SHAUGHNESSY INT.’L. EQUITY BUNDLE MULTI-MANAGER 12462 / 12562 /–<br />
SUNWISE ESSENTIAL PORTFOLIO SERIES INCOME MULTI-MANAGER 12432 / 12532 /–<br />
SUNWISE ESSENTIAL PORTFOLIO SERIES CONSERVATIVE MULTI-MANAGER 12433 / 12533 /–<br />
SWESS PORTFOLIO SERIES CONSERVATIVE BALANCED MULTI-MANAGER 12434 / 12534 /–<br />
SUNWISE ESSENTIAL PORTFOLIO SERIES BALANCED MULTI-MANAGER 12435 / 12535 /–<br />
SUNWISE ESSENTIAL PORTFOLIO SERIES BALANCED GROWTH MULTI-MANAGER 12436 / 12536 /–<br />
SWESS FRANKLIN TEMPLETON QUOTENTIAL DIVERSIFIED INCOME STEVE LINGARD / BRENT SMITH 12463 / 12563 /–<br />
SWESS FRANKLIN TEMPLETON QUOTENTIAL BALANCED INCOME STEVE LINGARD / BRENT SMITH 12464 / 12564 /–<br />
SWESS FRANKLIN TEMPLETON QUOTENTIAL BALANCED GROWTH STEVE LINGARD / BRENT SMITH 12465 / 12565 /–<br />
SWESS FRANKLIN TEMPLETON QUOTENTIAL GLOBAL BALANCED STEVE LINGARD / BRENT SMITH 12466 / 12566 /–<br />
FOR DEALER USE ONLY<br />
NAV<br />
(CDN)<br />
FUND<br />
ASSETS<br />
($MM)<br />
Y–T–D<br />
(%)<br />
1<br />
MTH<br />
(%)*<br />
6<br />
MTH<br />
(%)*<br />
1 YR<br />
(%)<br />
3 YR<br />
(%)<br />
5 YR<br />
(%)<br />
10 YR<br />
(%)<br />
SINCE<br />
INCEPTION<br />
(%)<br />
$10.79 $2.8 0.4 -2.2 0.4 N/A N/A N/A N/A 7.9 (SEPT.’10)<br />
$10.93 $20.4 -0.4 -1.4 -0.4 N/A N/A N/A N/A 9.3 (SEPT.’10)<br />
$10.04 $0.2 -0.6 -1.6 -0.6 N/A N/A N/A N/A 0.4 (SEPT.’10)<br />
$10.72 $7.2 0.8 -1.7 0.8 N/A N/A N/A N/A 7.2 (SEPT.’10)<br />
$10.29 $1.1 -0.9 -2.6 -0.9 N/A N/A N/A N/A 2.9 (SEPT.’10)<br />
$10.88 $18.4 1.4 -1.8 1.4 N/A N/A N/A N/A 8.8 (SEPT.’10)<br />
$10.49 $11.1 -2.0 -2.2 -2.0 N/A N/A N/A N/A 4.9 (SEPT.’10)<br />
$9.75 $0.4 -1.5 -2.3 -1.5 N/A N/A N/A N/A -2.5 (SEPT.’10)<br />
$10.52 $0.5 2.8 -2.0 2.8 N/A N/A N/A N/A 5.2 (SEPT.’10)<br />
$11.10 $2.1 3.4 -1.3 3.4 N/A N/A N/A N/A 11.0 (SEPT.’10)<br />
$10.63 $1.4 0.8 -1.1 0.8 N/A N/A N/A N/A 6.3 (SEPT.’10)<br />
$10.79 $2.2 3.7 -1.5 3.7 N/A N/A N/A N/A 7.9 (SEPT.’10)<br />
$10.76 $5.3 1.3 -1.9 1.3 N/A N/A N/A N/A 7.6 (SEPT.’10)<br />
$10.20 $0.1 -0.5 -2.4 -0.5 N/A N/A N/A N/A 2.0 (SEPT.’10)<br />
$10.31 $0.0 0.8 -2.2 0.8 N/A N/A N/A N/A 3.1 (SEPT.’10)<br />
$10.90 $11.4 0.8 -1.5 0.8 N/A N/A N/A N/A 9.0 (SEPT.’10)<br />
$10.87 $9.2 1.9 -1.5 1.9 N/A N/A N/A N/A 8.7 (SEPT.’10)<br />
$10.52 $0.1 1.1 -1.5 1.1 N/A N/A N/A N/A 5.2 (SEPT.’10)<br />
$10.78 $9.2 1.1 -1.9 1.1 N/A N/A N/A N/A 7.8 (SEPT.’10)<br />
$10.62 $4.0 2.9 -1.8 2.9 N/A N/A N/A N/A 6.2 (SEPT.’10)<br />
$10.53 $0.2 2.4 -2.0 2.4 N/A N/A N/A N/A 5.3 (SEPT.’10)<br />
$10.57 $0.8 0.9 -1.9 0.9 N/A N/A N/A N/A 5.7 (SEPT.’10)<br />
$10.58 $0.1 1.9 -1.8 1.9 N/A N/A N/A N/A 5.8 (SEPT.’10)<br />
$10.28 $2.8 -1.2 -2.0 -1.2 N/A N/A N/A N/A 2.8 (SEPT.’10)<br />
$9.97 $1.4 -0.8 -1.5 -0.8 N/A N/A N/A N/A -0.3 (SEPT.’10)<br />
$10.16 $0.2 -0.4 -2.1 -0.4 N/A N/A N/A N/A 1.6 (SEPT.’10)<br />
$10.34 $2.3 -1.0 -2.4 -1.0 N/A N/A N/A N/A 3.4 (SEPT.’10)<br />
$10.34 $0.3 -0.2 -1.3 -0.2 N/A N/A N/A N/A 3.4 (SEPT.’10)<br />
$10.45 $1.4 -0.6 -2.1 -0.6 N/A N/A N/A N/A 4.5 (SEPT.’10)<br />
$10.45 $3.3 2.5 -1.5 2.5 N/A N/A N/A N/A 4.5 (SEPT.’10)<br />
$10.67 $0.2 3.0 -1.0 3.0 N/A N/A N/A N/A 6.7 (SEPT.’10)<br />
$10.47 $14.1 2.5 -1.0 2.5 N/A N/A N/A N/A 4.7 (SEPT.’10)<br />
$10.60 $7.6 1.6 -1.0 1.6 N/A N/A N/A N/A 6.0 (SEPT.’10)<br />
$10.31 $6.5 1.3 -1.2 1.3 N/A N/A N/A N/A 3.1 (SEPT.’10)<br />
$10.63 $11.1 1.3 -1.7 1.3 N/A N/A N/A N/A 6.3 (SEPT.’10)<br />
$10.51 $5.3 1.0 -1.8 1.0 N/A N/A N/A N/A 5.1 (SEPT.’10)<br />
$10.17 $1.8 1.7 -1.1 1.7 N/A N/A N/A N/A 1.7 (SEPT.’10)<br />
$10.30 $1.6 0.6 -1.5 0.6 N/A N/A N/A N/A 3.0 (SEPT.’10)<br />
$10.24 $1.2 0.1 -1.9 0.1 N/A N/A N/A N/A 2.4 (SEPT.’10)<br />
$10.10 $0.2 -0.2 -1.7 -0.2 N/A N/A N/A N/A 1.0 (SEPT.’10)<br />
MONTHLY PERFORMANCE SCORECARD AS AT JUNE 30, 2011 99
<strong>CI</strong> Sales Team<br />
Mike Warus<br />
Senior Vice-President<br />
Patrick Lefrançois<br />
Senior Vice-President<br />
Roy Ratnavel<br />
Senior Vice-President<br />
Ontario<br />
TEL: 416-364-1145 TOLL-FREE: 1-800-268-9374<br />
Mike Warus Senior Vice-President mwarus@ci.com<br />
Kevin Bonello Vice-President kbonello@ci.com<br />
Ron Bowes Vice-President rbowes@ci.com<br />
Erick Boucher Vice-President eboucher@ci.com<br />
Jason Capobianco Vice-President jcapobianco@ci.com<br />
Sean Etherington Vice-President setherington@ci.com<br />
Jeff Hobson Vice-President jhobson@ci.com<br />
Ryan Keefe Vice-President rkeefe@ci.com<br />
Craig Koenig Vice-President ckoenig@ci.com<br />
Pierre Lalonde Vice-President plalonde@ci.com<br />
Andrew McBain Vice-President amcbain@ci.com<br />
Peter Perri Vice-President pperri@ci.com<br />
Matthew Rose Vice-President mrose@ci.com<br />
Nathan Rothwell Vice-President nrothwell@ci.com<br />
Jennifer Sinopoli Vice-President jsinopoli@ci.com<br />
Tim Skoubouris Vice-President tskoubouris@ci.com<br />
Alex Steele Vice-President asteele@ci.com<br />
Damon Sutherland Vice-President dsutherland@ci.com<br />
David Vigilanti Vice-President dvigilanti@ci.com<br />
Sharad Appadoo Inside Sales sappadoo@ci.com<br />
Dean Chong Inside Sales dechong@ci.com<br />
Saer Diop Inside Sales sdiop@ci.com<br />
Philip Douglas Inside Sales pdouglas@ci.com<br />
Amin Fernandez Inside Sales afernandez@ci.com<br />
Anet Gesualdi Inside Sales agesualdi@ci.com<br />
Bobby Greenberg Inside Sales bgreenberg@ci.com<br />
Perry Kekropidis Inside Sales pkekropi@ci.com<br />
Ian Maclean Inside Sales imaclean@ci.com<br />
Devendra Maharajh Inside Sales dmaharajh@ci.com<br />
Reza Manoucheri Inside Sales rmanoucheri@ci.com<br />
Taylor Michaud Inside Sales tmichaud@ci.com<br />
Jay Taylor Inside Sales jtaylor@ci.com<br />
Ryan Waller Inside Sales rwaller@ci.com<br />
Cheryl Bemister Sales Assistant cbemister@ci.com<br />
Teresa Hasiuk Sales Assistant thasiuk@ci.com<br />
Michelle Kang Sales Assistant mkang@ci.com<br />
Lindsay Muscat Sales Assistant lmuscat@ci.com<br />
Katie Newton Sales Assistant knewton@ci.com<br />
Alison Njie Sales Assistant anjie@ci.com<br />
Gabriella Sokacova Sales Assistant gsokacova@ci.com<br />
Halifax TOLL-FREE: 1-800-268-9374<br />
Patrick Lefrançois Senior Vice-President plefrancois@ci.com<br />
Gordon Baker Vice-President gbaker@ci.com<br />
Greg Giffin Vice-President ggiffin@ci.com<br />
Andrew Lacas Vice-President alacas@ci.com<br />
Richard Belding Inside Sales rbelding@ci.com<br />
Taylor Michaud Inside Sales tmichaud@ci.com<br />
Heather Kennedy Sales Assistant hkennedy@ci.com<br />
National Accounts<br />
TEL: 416-364-1145 TOLL-FREE: 1-800-268-9374<br />
Peter Glaab Senior Vice-President pglaab@ci.com<br />
Karl Siksna Vice-President ksiksna@ci.com<br />
Leah Graham Sales Assistant lgraham@ci.com<br />
Debra MacPhail Sales Assistant dmacphail@ci.com<br />
Vancouver<br />
TEL: 604-681-3346 TOLL-FREE: 1-800-665-6994<br />
Roy Ratnavel Senior Vice-President rratnavel@ci.com<br />
Sean Hirtle Vice-President shirtle@ci.com<br />
Vincent Nijjar Vice-President vnijjar@ci.com<br />
Neil Rawal Vice-President nrawal@ci.com<br />
Tim Shrigley Vice-President tshrigley@ci.com<br />
Jim Tsiakos Vice-President jtsiakos@ci.com<br />
Victor Young Vice-President vyoung@ci.com<br />
Eric Mooney Inside Sales emooney@ci.com<br />
Rosalind Salter Inside Sales rsalter@ci.com<br />
Michael Ramos Inside Sales mramos@ci.com<br />
Laura Anderson Sales Assistant landerson@ci.com<br />
Jenny Obermeier Sales Assistant jobermeier@ci.com<br />
Ricki Thal Sales Assistant rthal@ci.com<br />
Calgary<br />
TEL: 403-205-4396 TOLL-FREE: 1-800-776-9027<br />
Roy Ratnavel Senior Vice-President rratnavel@ci.com<br />
Scott Brown Vice-President sbrown@ci.com<br />
Elijah Clare Vice-President eclare@ci.com<br />
Jodie deMunnik Vice-President jdemunnik@ci.com<br />
Wayne Grant Vice-President wgrant@ci.com<br />
Bill Johnstone Vice-President bjohnstone@ci.com<br />
Christopher Matugas Vice-President cmatugas@ci.com<br />
Glenn Pesclovitch Vice-President gpesclovitch@ci.com<br />
James Sturdy Vice-President jsturdy@ci.com<br />
Jay Brisley Inside Sales jbrisley@ci.com<br />
Hassan Chauhan Inside Sales hchauhan@ci.com<br />
Jonathan Marusiak Inside Sales jmarusiak@ci.com<br />
Melissa Ho Sales Assistant mho@ci.com<br />
Karla Piper Sales Assistant kpiper@ci.com<br />
Eileen Soby Sales Assistant esoby@ci.com<br />
Montreal<br />
TEL: 514-875-0090 TOLL-FREE: 1-800-268-1602<br />
Patrick Lefrançois Senior Vice-President plefrancois@ci.com<br />
Jacen Campbell Vice-President jcampbell@ci.com<br />
Joseph Gagliano Vice-President jgagliano@ci.com<br />
Jeremy Gould Vice-President jgould@ci.com<br />
Olivier Liard Vice-President oliard@ci.com<br />
Peter Papamichalopoulos Vice-President ppapamic@ci.com<br />
Jacques Prévost Vice-President jprevost@ci.com<br />
Roberto Katigbak Inside Sales rkatigbak@ci.com<br />
Louis-Philippe Proulx Inside Sales lproulx@ci.com<br />
Diane Tremblay Inside Sales dtremblay@ci.com<br />
Carine Coursol Sales Assistant ccoursol@ci.com<br />
Maritza Paredes Sales Assistant mparedes@ci.com<br />
Neshat Vafi Sales Assistant nvafi@ci.com<br />
Head Office<br />
2 Queen Street East, 20th Floor, Toronto, Ontario M5C 3G7<br />
Client Services: E-1-800-563-5181 F-1-800-668-3528<br />
www.ci.com<br />
100 SUMMER 2011 PERSPECTIVE AS AT JUNE 30, 2011
All commentaries are published by <strong>CI</strong> <strong>Investments</strong> Inc., the manager of<br />
all the funds described herein. They are provided as a general source of<br />
information and should not be considered personal investment advice<br />
or an offer or solicitation to buy or sell securities. Every effort has been<br />
made to ensure that the material contained in the commentaries is<br />
accurate at the time of publication. However, <strong>CI</strong> <strong>Investments</strong> Inc. cannot<br />
guarantee their accuracy or completeness and accepts no responsibility<br />
for any loss arising from any use of or reliance on the information<br />
contained herein.<br />
Commissions, trailing commissions, management fees and expenses<br />
all may be associated with mutual fund investments. Please read the<br />
prospectus before investing. Unless otherwise indicated and except<br />
for returns for periods less than one year, the indicated rates of<br />
return are the historical annual compounded total returns including<br />
changes in security value. All performance data assume reinvestment<br />
of all distributions or dividends and do not take into account sales,<br />
redemption, distribution or optional charges or income taxes payable<br />
by any securityholder that would have reduced returns. Returns are for<br />
Class A securities, unless otherwise indicated. Mutual funds are not<br />
guaranteed, their values change frequently and past performance may<br />
not be repeated. Mutual fund securities are not covered by the Canada<br />
Deposit Insurance Corporation or by any other government deposit<br />
insurer and there can be no assurances that the <strong>CI</strong> Money Market Funds<br />
will maintain its net asset value per security at a constant amount or that<br />
the full amount of your investment in these funds will be returned to you.<br />
The offering of units of the <strong>CI</strong> Global Opportunities Fund and Trident<br />
Global Opportunities Fund are made pursuant to their respective<br />
Offering Memorandum only to those investors in jurisdictions of Canada<br />
who meet certain eligibility or minimum purchase requirements.<br />
Transamerica Life Canada is the sole issuer of the individual<br />
variable annuity contracts providing for investment in <strong>CI</strong><br />
Guaranteed Investment Funds and Legacy Funds. A description<br />
of the key features of the applicable individual variable annuity contract<br />
is contained in the <strong>CI</strong> Guaranteed Investment Funds or Legacy Funds<br />
Information Folder.<br />
Unity Life of Canada has entered into an agreement with<br />
<strong>CI</strong> <strong>Investments</strong> Inc. pursuant to which <strong>CI</strong> is responsible<br />
for certain marketing and administrative services in relation to<br />
the <strong>CI</strong> Segregated Funds. Unity Life of Canada established the<br />
individual variable annuity contract providing for investment in<br />
the <strong>CI</strong> Segregated Funds. A description of the key features of<br />
the individual variable annuity contract is contained in the <strong>CI</strong> Segregated<br />
Funds Information Folder.<br />
Sun Life Assurance Company of Canada, a member of the Sun Life Financial<br />
group of companies, is the sole issuer of the individual variable annuity contracts<br />
providing for investment in SunWise, SunWise Elite and Clarica segregated<br />
funds. A description of the key features of the applicable individual variable<br />
annuity contract is contained in the SunWise or Clarica Information Folder.<br />
®<strong>CI</strong> <strong>Investments</strong>, the <strong>CI</strong> <strong>Investments</strong> design, Perspective, Synergy<br />
Mutual Funds, Harbour Advisors, Harbour Funds, Cambridge Global<br />
Managers, American Managers, Insight and Insight Program, Legacy<br />
Funds and <strong>CI</strong> Guaranteed Investment Funds are registered trademarks<br />
of <strong>CI</strong> <strong>Investments</strong> Inc. Cambridge Advisors is the business name of <strong>CI</strong><br />
Global Holdings Inc. Certain portfolio managers of Cambridge Advisors<br />
are registered with <strong>CI</strong> <strong>Investments</strong> Inc.<br />
Cambridge, Portfolio Select Series, Portfolio Series, Signature Funds<br />
and Signature Global Advisors are trademarks of <strong>CI</strong> <strong>Investments</strong> Inc.<br />
®TRANSAMERICA is a registered trademark of Transamerica<br />
Corporation. Transamerica Life Canada is licensed to use such marks.<br />
Transamerica Life Canada is registered to carry on business under the<br />
name “Transamerica Life Canada”.<br />
®SunWise and Clarica are registered trademarks of Sun Life Assurance<br />
Company of Canada.<br />
®True North and Fidelity NorthStar are registered trademarks of FMR Corp.<br />
Franklin Templeton <strong>Investments</strong>, Franklin Templeton <strong>Investments</strong><br />
Quotential Program and/or Franklin Templeton <strong>Investments</strong> and design are<br />
registered trademarks of Franklin Templeton Investment corp.<br />
®Fidelity <strong>Investments</strong> and the Fidelity design are registered trademarks<br />
of FMR Corp.<br />
Nothing herein should be read to constitute an offer or solicitation<br />
by Trident Investment Management, LLC or its principal to provide<br />
investment advisory services to any person or entity.<br />
For Advisor Use Only
Coming this fall ...<br />
Stay connected with<br />
the new <strong>CI</strong> <strong>Investments</strong><br />
iPad ® App<br />
•Customize content to get<br />
the information that matters<br />
to you<br />
•Stay up to date with<br />
commentaries, webcasts<br />
and podcasts from <strong>CI</strong>’s<br />
leading portfolio managers<br />
•Enjoy increased search<br />
capabilities with our<br />
new fund code finder<br />
And much more ...<br />
For Advisor Use Only<br />
1107-0862_E (08/11)