July - Summer Edition - CI Investments
July - Summer Edition - CI Investments
July - Summer Edition - CI Investments

You also want an ePaper? Increase the reach of your titles
YUMPU automatically turns print PDFs into web optimized ePapers that Google loves.
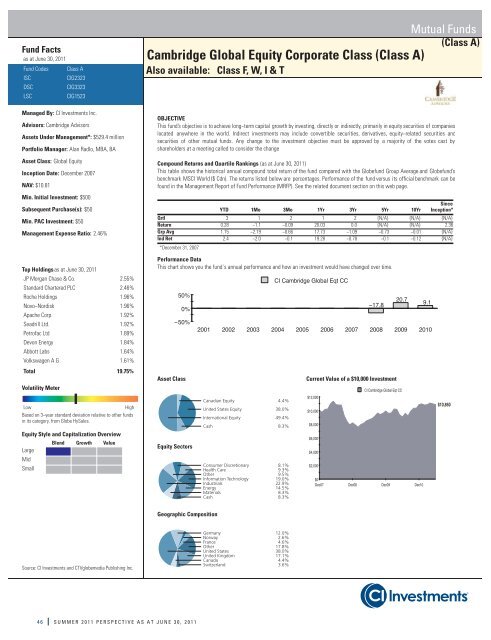
Fund Facts<br />
as at June 30, 2011<br />
Fund Codes<br />
ISC<br />
DSC<br />
LSC<br />
Class A<br />
<strong>CI</strong>G2323<br />
<strong>CI</strong>G3323<br />
<strong>CI</strong>G1523<br />
Managed By: <strong>CI</strong> <strong>Investments</strong> Inc.<br />
Advisors: Cambridge Advisors<br />
Assets Under Management*: $529.4 million<br />
Portfolio Manager: Alan Radlo, MBA, BA<br />
Asset Class: Global Equity<br />
Inception Date: December 2007<br />
NAV: $10.81<br />
Min. Initial Investment: $500<br />
Subsequent Purchase(s): $50<br />
Min. PAC Investment: $50<br />
Management Expense Ratio: 2.46%<br />
Mutual Funds<br />
(Class A)<br />
Cambridge Global Equity Corporate Class (Class A)<br />
Also available: Class F, W, I & T<br />
OBJECTIVE<br />
This fund’s objective is to achieve long−term capital growth by investing, directly or indirectly, primarily in equity securities of companies<br />
located anywhere in the world. Indirect investments may include convertible securities, derivatives, equity−related securities and<br />
securities of other mutual funds. Any change to the investment objective must be approved by a majority of the votes cast by<br />
shareholders at a meeting called to consider the change<br />
Compound Returns and Quartile Rankings (as at June 30, 2011)<br />
This table shows the historical annual compound total return of the fund compared with the Globefund Group Average and Globefund’s<br />
benchmark MS<strong>CI</strong> World ($ Cdn). The returns listed below are percentages. Performance of the fund versus its official benchmark can be<br />
found in the Management Report of Fund Performance (MRFP). See the related document section on this web page.<br />
Since<br />
YTD 1Mo 3Mo 1Yr 3Yr 5Yr 10Yr Inception*<br />
Qrtl 3 1 2 1 2 {N/A} {N/A} {N/A}<br />
Return 0.28 −1.1 −0.09 20.03 0.0 {N/A} {N/A} 2.36<br />
Grp Avg 1.15 −2.19 −0.66 17.73 −1.09 −0.73 −0.01 {N/A}<br />
Ind Ret 2.4 −2.0 −0.1 19.28 −0.78 −0.1 −0.12 {N/A}<br />
*December 31, 2007<br />
Top Holdingsas at June 30, 2011<br />
JP Morgan Chase & Co. 2.55%<br />
Standard Chartered PLC 2.46%<br />
Roche Holdings 1.96%<br />
Novo−Nordisk 1.96%<br />
Apache Corp. 1.92%<br />
Seadrill Ltd. 1.92%<br />
Petrofac Ltd 1.89%<br />
Devon Energy 1.84%<br />
Abbott Labs 1.64%<br />
Volkswagen A G 1.61%<br />
Total 19.75%<br />
Volatility Meter<br />
Low<br />
High<br />
Based on 3−year standard deviation relative to other funds<br />
in its category, from Globe HySales.<br />
Equity Style and Capitalization Overview<br />
Blend Growth Value<br />
Large<br />
Mid<br />
Small<br />
Performance Data<br />
This chart shows you the fund´s annual performance and how an investment would have changed over time.<br />
50%<br />
0%<br />
−50%<br />
Asset Class<br />
Equity Sectors<br />
<strong>CI</strong> Cambridge Global Eqt CC<br />
−17.8<br />
2001 2002 2003 2004 2005 2006 2007 2008 2009 2010<br />
Canadian Equity 4.4%<br />
United States Equity 38.0%<br />
International Equity 49.4%<br />
Cash 8.3%<br />
Consumer Discretionary 8.1%<br />
Health Care 9.3%<br />
Other 9.5%<br />
Information Technology 19.0%<br />
Industrials 22.9%<br />
Energy 14.5%<br />
Materials 8.3%<br />
Cash 8.3%<br />
Current Value of a $10,000 Investment<br />
$12,000<br />
$10,000<br />
$8,000<br />
$6,000<br />
$4,000<br />
$2,000<br />
20.7<br />
<strong>CI</strong> Cambridge Global Eqt CC<br />
$0<br />
Dec07 Dec08 Dec09 Dec10<br />
9.1<br />
$10,850<br />
Geographic Composition<br />
Source: <strong>CI</strong> <strong>Investments</strong> and CTVglobemedia Publishing Inc.<br />
Germany 12.0%<br />
Norway 2.6%<br />
France 4.6%<br />
Other 17.8%<br />
United States 38.0%<br />
United Kingdom 17.1%<br />
Canada 4.4%<br />
Switzerland 3.6%<br />
46 SUMMER 2011 PERSPECTIVE AS AT JUNE 30, 2011