July - Summer Edition - CI Investments
July - Summer Edition - CI Investments
July - Summer Edition - CI Investments

Create successful ePaper yourself
Turn your PDF publications into a flip-book with our unique Google optimized e-Paper software.
Fund Facts<br />
as at June 30, 2011<br />
Fund Codes Class A Corporate Class<br />
ISC <strong>CI</strong>G690 <strong>CI</strong>G290<br />
DSC <strong>CI</strong>G890 <strong>CI</strong>G790<br />
LSC <strong>CI</strong>G1890 <strong>CI</strong>G1790<br />
Harbour Fund (Class A)<br />
Also available: Class F & I<br />
Mutual Funds<br />
(Class A)<br />
Managed By: <strong>CI</strong> <strong>Investments</strong> Inc.<br />
Advisors: Harbour Advisors<br />
Assets Under Management*: $4,382.1 million<br />
Portfolio Manager: Gerald Coleman and Stephen<br />
Jenkins<br />
Asset Class: Canadian Equity<br />
Inception Date: June 1997<br />
NAV: $21.54<br />
Min. Initial Investment: $500<br />
Subsequent Purchase(s): $50<br />
Min. PAC Investment: $50<br />
Management Expense Ratio: 2.43%<br />
OBJECTIVE<br />
This fund’s objective is to obtain maximum long−term capital growth. It invests primarily in equity and equity−related securities of high<br />
quality, large and mid−capitalization Canadian companies that the portfolio adviser believes have good potential for future growth. Any<br />
change to the investment objective must be approved by a majority of votes cast at a meeting of unitholders held for that reason.<br />
Compound Returns and Quartile Rankings (as at June 30, 2011)<br />
This table shows the historical annual compound total return of the fund compared with the Globefund Group Average and Globefund’s<br />
benchmark S&P/TSX Total Return. The returns listed below are percentages. Performance of the fund versus its official benchmark can<br />
be found in the Management Report of Fund Performance (MRFP). See the related document section on this web page.<br />
Since<br />
YTD 1Mo 3Mo 1Yr 3Yr 5Yr 10Yr Inception*<br />
Qrtl 2 1 2 2 2 1 1 {N/A}<br />
Return 0.75 −1.73 −3.06 17.83 0.87 4.09 7.74 7.92<br />
Grp Avg 0.09 −2.62 −4.1 17.52 −0.79 1.97 4.74 {N/A}<br />
Ind Ret 0.16 −3.33 −5.15 20.87 0.19 5.67 8.05 {N/A}<br />
*June 27, 1997<br />
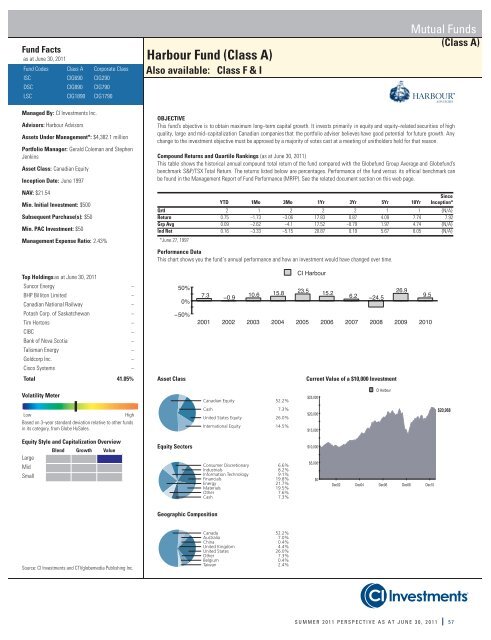
Performance Data<br />
This chart shows you the fund´s annual performance and how an investment would have changed over time.<br />
Top Holdings as at June 30, 2011<br />
Suncor Energy<br />
−<br />
BHP Billiton Limited<br />
−<br />
Canadian National Railway<br />
−<br />
Potash Corp. of Saskatchewan<br />
−<br />
Tim Hortons<br />
−<br />
<strong>CI</strong>BC<br />
−<br />
Bank of Nova Scotia<br />
−<br />
Talisman Energy<br />
−<br />
Goldcorp Inc.<br />
−<br />
Cisco Systems<br />
−<br />
Total 41.05%<br />
50%<br />
0%<br />
−50%<br />
Asset Class<br />
7.3<br />
<strong>CI</strong> Harbour<br />
15.8 23.5 15.2<br />
26.9<br />
−0.9<br />
10.6<br />
6.2 −24.5<br />
9.5<br />
2001 2002 2003 2004 2005 2006 2007 2008 2009 2010<br />
Current Value of a $10,000 Investment<br />
Volatility Meter<br />
Canadian Equity 52.2%<br />
$25,000<br />
<strong>CI</strong> Harbour<br />
Low<br />
High<br />
Based on 3−year standard deviation relative to other funds<br />
in its category, from Globe HySales.<br />
Cash 7.3%<br />
United States Equity 26.0%<br />
International Equity 14.5%<br />
$20,000<br />
$15,000<br />
$20,968<br />
Equity Style and Capitalization Overview<br />
Blend Growth Value<br />
Large<br />
Mid<br />
Small<br />
Equity Sectors<br />
Consumer Discretionary 6.6%<br />
Industrials 8.2%<br />
Information Technology 9.1%<br />
Financials 19.8%<br />
Energy 21.7%<br />
Materials 19.5%<br />
Other 7.6%<br />
Cash 7.3%<br />
$10,000<br />
$5,000<br />
$0<br />
Dec02 Dec04 Dec06 Dec08 Dec10<br />
Geographic Composition<br />
Source: <strong>CI</strong> <strong>Investments</strong> and CTVglobemedia Publishing Inc.<br />
Canada 52.2%<br />
Australia 7.0%<br />
China 0.4%<br />
United Kingdom 4.4%<br />
United States 26.0%<br />
Other 7.3%<br />
Belgium 0.4%<br />
Taiwan 2.4%<br />
SUMMER 2011 PERSPECTIVE AS AT JUNE 30, 2011 57