July - Summer Edition - CI Investments
July - Summer Edition - CI Investments
July - Summer Edition - CI Investments

You also want an ePaper? Increase the reach of your titles
YUMPU automatically turns print PDFs into web optimized ePapers that Google loves.
Fund Facts<br />
as at June 30, 2011<br />
Fund Codes Class A Corporate Class<br />
ISC <strong>CI</strong>G691 <strong>CI</strong>G2310<br />
DSC <strong>CI</strong>G891 <strong>CI</strong>G3310<br />
LSC <strong>CI</strong>G1891 <strong>CI</strong>G1310<br />
Harbour Growth & Income Fund (Class A)<br />
Also available: Class F & I<br />
Mutual Funds<br />
(Class A)<br />
Managed By: <strong>CI</strong> <strong>Investments</strong> Inc.<br />
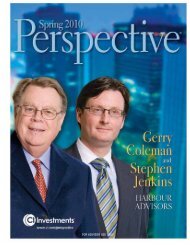
Advisors: Harbour Advisors<br />
Assets Under Management*: $3,944.3 million<br />
Portfolio Manager: Gerald Coleman and Stephen<br />
Jenkins<br />
Asset Class: Canadian Balanced<br />
Inception Date: June 1997<br />
NAV: $18.68<br />
Min. Initial Investment: $500<br />
Subsequent Purchase(s): $50<br />
Min. PAC Investment: $50<br />
Management Expense Ratio: 2.43%<br />
Top Holdings as at June 30, 2011<br />
Suncor Energy<br />
−<br />
Tim Hortons<br />
−<br />
BHP Billiton Limited<br />
−<br />
Canadian National Railway<br />
−<br />
Intact Financial<br />
−<br />
Manulife Financial<br />
−<br />
TD Bank<br />
−<br />
Potash Corp. of Saskatchewan<br />
−<br />
Bank of Nova Scotia<br />
−<br />
Talisman Energy<br />
−<br />
Total 35.60%<br />
OBJECTIVE<br />
This fund’s objective is to obtain long−term total return through a prudent balance of income and capital appreciation. It invests primarily<br />
in equity and equity−related securities of mid− to large−capitalization Canadian companies and fixed income securities issued by<br />
Canadian governments and companies. The proportion of the fund’s assets invested in equity and fixed income securities may vary<br />
according to market conditions. Any change to the investment objective must be approved by a majority of votes cast at a meeting of<br />
unitholders held for that reason.<br />
Compound Returns and Quartile Rankings (as at June 30, 2011)<br />
This table shows the historical annual compound total return of the fund compared with the Globefund Group Average and Globefund’s<br />
benchmark Blend: 50% S&P/TSX, 50% DEX Universe. The returns listed below are percentages. Performance of the fund versus its<br />
official benchmark can be found in the Management Report of Fund Performance (MRFP). See the related document section on this web<br />
page.<br />
Since<br />
YTD 1Mo 3Mo 1Yr 3Yr 5Yr 10Yr Inception*<br />
Qrtl 3 2 3 2 2 1 1 {N/A}<br />
Return −0.16 −1.37 −2.81 13.9 0.69 3.0 6.2 5.85<br />
Grp Avg 0.33 −1.73 −2.29 13.0 0.59 2.73 4.58 {N/A}<br />
Ind Ret 1.23 −1.63 −1.38 12.61 3.66 6.24 7.56 {N/A}<br />
*June 27, 1997<br />
Performance Data<br />
This chart shows you the fund´s annual performance and how an investment would have changed over time.<br />
50%<br />
0%<br />
−50%<br />
Asset Class<br />
8.9<br />
1.3<br />
8.1<br />
<strong>CI</strong> Harbour Growth & Income<br />
12.3<br />
17.3<br />
−19.7<br />
2001 2002 2003 2004 2005 2006 2007 2008 2009 2010<br />
11.2<br />
3.8<br />
Current Value of a $10,000 Investment<br />
21.2<br />
8.0<br />
Volatility Meter<br />
Low<br />
High<br />
Based on 3−year standard deviation relative to other funds<br />
in its category, from Globe HySales.<br />
International Equity 10.2%<br />
Bond 4.8%<br />
Cash 18.1%<br />
Canadian Equity 50.2%<br />
United States Equity 16.4%<br />
Other 0.2%<br />
$20,000<br />
$18,000<br />
$16,000<br />
$14,000<br />
$12,000<br />
<strong>CI</strong> Harbour Growth & Income<br />
$18,139<br />
Equity Style and Capitalization Overview<br />
Blend Growth Value<br />
Large<br />
Mid<br />
Small<br />
Equity Sectors<br />
Consumer Staples 4.6%<br />
Materials 15.1%<br />
Other 11.3%<br />
Cash 18.1%<br />
Financials 20.8%<br />
Information Technology 7.3%<br />
Energy 16.0%<br />
Industrials 6.8%<br />
$10,000<br />
$8,000<br />
$6,000<br />
$4,000<br />
$2,000<br />
$0<br />
Dec02 Dec04 Dec06 Dec08 Dec10<br />
Geographic Composition<br />
Source: <strong>CI</strong> <strong>Investments</strong> and CTVglobemedia Publishing Inc.<br />
Canada 55.1%<br />
United Kingdom 3.9%<br />
China 0.2%<br />
Australia 3.6%<br />
Other 18.3%<br />
United States 16.4%<br />
Belgium 0.5%<br />
Taiwan 1.9%<br />
SUMMER 2011 PERSPECTIVE AS AT JUNE 30, 2011 61