July - Summer Edition - CI Investments
July - Summer Edition - CI Investments
July - Summer Edition - CI Investments

You also want an ePaper? Increase the reach of your titles
YUMPU automatically turns print PDFs into web optimized ePapers that Google loves.
Fund Facts<br />
as at June 30, 2011<br />
Fund Codes Class A Corporate Class<br />
ISC <strong>CI</strong>G2810 <strong>CI</strong>G2311<br />
DSC <strong>CI</strong>G3810 <strong>CI</strong>G3311<br />
LSC <strong>CI</strong>G1610 <strong>CI</strong>G1311<br />
Managed By: <strong>CI</strong> <strong>Investments</strong> Inc.<br />
Advisors: Epoch Investment Partners, Inc.<br />
Assets Under Management*: $240.9 million<br />
Portfolio Manager: William Priest<br />
Asset Class: Global Equity<br />
Inception Date: January 2006<br />
NAV: $6.66<br />
Min. Initial Investment: $5,000<br />
Subsequent Purchase(s): $50<br />
Min. PAC Investment: $50<br />
Management Expense Ratio: 2.48%<br />
Mutual Funds<br />
(Class A)<br />
<strong>CI</strong> Global High Dividend Advantage Fund (Class A)<br />
Also available: Class F & I<br />
OBJECTIVE<br />
This fund’s objective is to achieve tax−efficient returns through exposure primarily to dividend−paying common and preferred shares,<br />
debentures, income trusts, equity−related securities and convertible securities of issuers anywhere in the world that are expected to<br />
generate a consistently high level of dividends and interest income. The fund may achieve such exposure through the use of derivatives<br />
and investments in other mutual funds. Any change to the investment objective must be approved by a majority of the votes cast by<br />
shareholders at a meeting called to consider the change.<br />
Compound Returns and Quartile Rankings (as at June 30, 2011)<br />
This table shows the historical annual compound total return of the fund compared with the Globefund Group Average and Globefund’s<br />
benchmark MS<strong>CI</strong> World ($ Cdn). The returns listed below are percentages. Performance of the fund versus its official benchmark can be<br />
found in the Management Report of Fund Performance (MRFP). See the related document section on this web page.<br />
Since<br />
YTD 1Mo 3Mo 1Yr 3Yr 5Yr 10Yr Inception*<br />
Qrtl 1 2 1 1 1 2 {N/A} {N/A}<br />
Return 5.75 −1.82 2.65 21.04 1.11 0.99 {N/A} −0.06<br />
Grp Avg 1.15 −2.19 −0.66 17.73 −1.09 −0.73 −0.01 {N/A}<br />
Ind Ret 2.4 −2.0 −0.1 19.28 −0.78 −0.1 −0.12 {N/A}<br />
*February 28, 2006<br />
Top Holdingsas at June 30, 2011<br />
BCE Inc. 2.04%<br />
Swisscom Ag Adr 1.94%<br />
Vodafone Group PLC 1.78%<br />
Pearson PLC 1.75%<br />
Imperial Tobacco Group PLC 1.71%<br />
BASF AG 1.71%<br />
Total SA 1.65%<br />
Nestle S.A. 1.65%<br />
CenturyLink, Inc. 1.64%<br />
Vivendi SA 1.63%<br />
Total 17.50%<br />
Volatility Meter<br />
Low<br />
High<br />
Based on 3−year standard deviation relative to other funds<br />
in its category, from Globe HySales.<br />
Equity Style and Capitalization Overview<br />
Blend Growth Value<br />
Large<br />
Mid<br />
Small<br />
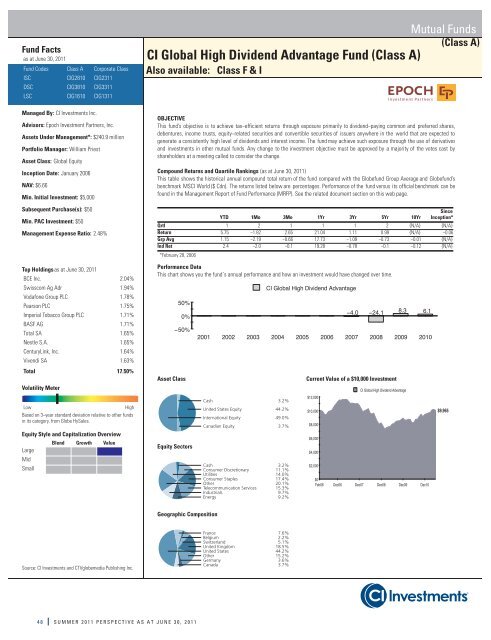
Performance Data<br />
This chart shows you the fund´s annual performance and how an investment would have changed over time.<br />
50%<br />
0%<br />
−50%<br />
Asset Class<br />
Equity Sectors<br />
<strong>CI</strong> Global High Dividend Advantage<br />
−4.0<br />
−24.1<br />
2001 2002 2003 2004 2005 2006 2007 2008 2009 2010<br />
Cash 3.2%<br />
United States Equity 44.2%<br />
International Equity 49.0%<br />
Canadian Equity 3.7%<br />
Cash 3.2%<br />
Consumer Discretionary 11.1%<br />
Utilities 14.0%<br />
Consumer Staples 17.4%<br />
Other 20.1%<br />
Telecommunication Services 15.3%<br />
Industrials 9.7%<br />
Energy 9.2%<br />
Current Value of a $10,000 Investment<br />
$12,000<br />
$10,000<br />
$8,000<br />
$6,000<br />
$4,000<br />
$2,000<br />
8.3<br />
<strong>CI</strong> Global High Dividend Advantage<br />
6.1<br />
$0<br />
Feb06 Dec06 Dec07 Dec08 Dec09 Dec10<br />
$9,965<br />
Geographic Composition<br />
Source: <strong>CI</strong> <strong>Investments</strong> and CTVglobemedia Publishing Inc.<br />
France 7.6%<br />
Belgium 2.2%<br />
Switzerland 5.1%<br />
United Kingdom 18.5%<br />
United States 44.2%<br />
Other 15.2%<br />
Germany 3.6%<br />
Canada 3.7%<br />
48 SUMMER 2011 PERSPECTIVE AS AT JUNE 30, 2011