July - Summer Edition - CI Investments
July - Summer Edition - CI Investments
July - Summer Edition - CI Investments

Create successful ePaper yourself
Turn your PDF publications into a flip-book with our unique Google optimized e-Paper software.
Fund Facts<br />
as at June 30, 2011<br />
Fund Codes<br />
ISC<br />
DSC<br />
LSC<br />
Class A<br />
<strong>CI</strong>G7740<br />
<strong>CI</strong>G7745<br />
<strong>CI</strong>G1745<br />
Portfolio Series Income Fund (Class A)<br />
Also available: Class F & I<br />
Managed Solutions<br />
(Class A)<br />
Managed By: <strong>CI</strong> <strong>Investments</strong> Inc.<br />
Advisors: <strong>CI</strong> Investment Consulting<br />
Assets Under Management*: $473.8 million<br />
Portfolio Manager: Multi−manager<br />
Asset Class: Asset Allocation<br />
Inception Date: November 1997<br />
NAV: $11.11<br />
Min. Initial Investment: $500<br />
Subsequent Purchase(s): $50<br />
Min. PAC Investment: $50<br />
Management Expense Ratio: 2.00%<br />
ÿ<br />
Top Holdingsas at June 30, 2011<br />
<strong>CI</strong> Global Bond 19.49%<br />
<strong>CI</strong> Signature Canadian Bond Class I 18.92%<br />
<strong>CI</strong> Signature High Income 16.88%<br />
<strong>CI</strong> Signature Corporate Bond 12.97%<br />
<strong>CI</strong> Signature Income & Growth 10.45%<br />
<strong>CI</strong> Glb High Dividend Adv. Corp Cl 9.34%<br />
<strong>CI</strong> Signature Div Yield Corp Class 6.14%<br />
<strong>CI</strong> Signature Div Corporate Class 5.20%<br />
Total 99.39%<br />
OBJECTIVE<br />
This portfolio’s objective is to emphasize income by investing primarily in income−oriented mutual funds. The portfolio may also invest in<br />
equity mutual funds to achieve modest capital appreciation. Any change to the investment objective must be approved by a majority of<br />
votes cast at a meeting of unitholders held for that reason.<br />
Compound Returns and Quartile Rankings (as at June 30, 2011)<br />
This table shows the historical annual compound total return of the fund compared with the Globefund Group Average and Globefund’s<br />
benchmark Blend: 40% MS<strong>CI</strong> World, 60% Barclays Cap. The returns listed below are percentages. Performance of the fund versus its<br />
official benchmark can be found in the Management Report of Fund Performance (MRFP). See the related document section on this web<br />
page.<br />
Since<br />
YTD 1Mo 3Mo 1Yr 3Yr 5Yr 10Yr Inception*<br />
Qrtl 1 2 1 1 1 1 1 {N/A}<br />
Return 2.92 −1.06 1.17 10.94 5.63 4.68 5.44 5.05<br />
Grp Avg 1.86 −1.11 0.37 9.78 3.98 3.37 3.23 {N/A}<br />
Ind Ret 0.69 −1.36 0.9 3.92 2.83 2.39 0.95 {N/A}<br />
*November 17, 1997<br />
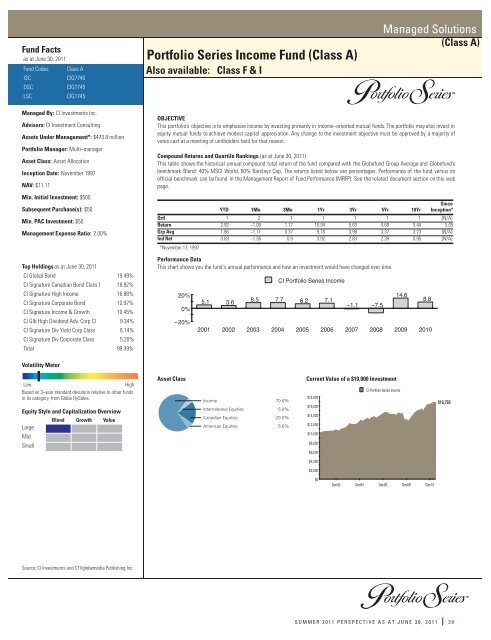
Performance Data<br />
This chart shows you the fund´s annual performance and how an investment would have changed over time.<br />
20%<br />
0%<br />
−20%<br />
5.1<br />
3.6<br />
8.5<br />
<strong>CI</strong> Portfolio Series Income<br />
7.7<br />
6.2<br />
−1.1<br />
−7.5<br />
2001 2002 2003 2004 2005 2006 2007 2008 2009 2010<br />
7.1<br />
14.6<br />
8.8<br />
Volatility Meter<br />
Low<br />
High<br />
Based on 3−year standard deviation relative to other funds<br />
in its category, from Globe HySales.<br />
Equity Style and Capitalization Overview<br />
Blend Growth Value<br />
Large<br />
Mid<br />
Small<br />
Asset Class<br />
Income 70.0%<br />
International Equities 5.0%<br />
Canadian Equities 20.0%<br />
American Equities 5.0%<br />
Current Value of a $10,000 Investment<br />
<strong>CI</strong> Portfolio Series Income<br />
$18,000<br />
$16,000<br />
$14,000<br />
$12,000<br />
$10,000<br />
$8,000<br />
$6,000<br />
$16,793<br />
$4,000<br />
$2,000<br />
$0<br />
Dec02 Dec04 Dec06 Dec08 Dec10<br />
Source: <strong>CI</strong> <strong>Investments</strong> and CTVglobemedia Publishing Inc.<br />
SUMMER 2011 PERSPECTIVE AS AT JUNE 30, 2011 39