You also want an ePaper? Increase the reach of your titles
YUMPU automatically turns print PDFs into web optimized ePapers that Google loves.
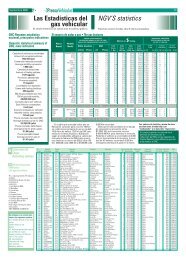
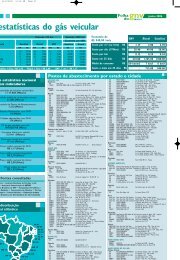
7May 2010Gas Vehicles ReportWorldwide NGV statisticsNatural Gas Vehicles NGV Refuelling stationsMonthly gas consumption (M Nm3)33CountryTotalCars/LDVsMD/HDBusesMD/HDTrucks% of totalOthers NGVs inthe worldTotal Public Private Planned% of totalfuelling stationsin theVRAworldAverage consumption(actual report)The consumptionin theoryReportedconsumptionLast updatePakistan 2.250.100 2.200.000 100 50.000 19,91% 3.145 3.145 18,12% 398,80 0,0% March 2010Argentina 1.826.845 1.826.845 16,16% 1.858 1.858 10,71% 32 213,52 328,83 64,9% January 2010Iran 1.734.431 1.728.909 5.522 15,35% 1.079 1.058 21 840 6,22% 189,00 327,77 57,7% December 2009Brazil 1.631.173 1.631.173 14,43% 1.782 1.782 10,27% 7 143,59 293,61 48,9% February 2010India 700.000 680.380 12.000 715 6.905 6,19% 500 181 319 2,88% 52,00 159,39 32,6% April 2009Italy 676.850 673.350 2.300 1.200 5,99% 770 725 45 70 4,44% 199 62,03 129,06 48,1% December 2009China 500.000 320.000 150.000 30.000 4,42% 1.652 1.453 199 232 9,52% 9 531,60 0,0% January 2010Colombia 303.549 280.089 13.800 9.660 2,69% 601 601 3,46% 3 45,00 99,54 45,2% January 2010Ukraine 200.019 10.000 120.000 70.000 19 1,77% 283 91 192 40 1,63% 8 83,00 417,80 19,9% November 2009Bangladesh 200.000 168.412 3.233 8.355 20.000 1,77% 500 500 2,88% 13 91,55 47,70 191,9% January 2010Thailand 173.480 140.050 11.720 20.030 1.680 1,53% 404 379 25 36 2,33% 0 95,60 76,48 125,0% March 2010Bolivia 122.812 122.812 1,09% 128 128 0,74% 46 26,28 22,11 118,9% May 2009Egypt 122.271 119.598 1.217 711 745 1,08% 119 115 4 16 0,69% 36,00 25,78 139,6% December 2009Russia 100.020 57.000 8.000 35.000 20 0,88% 249 202 47 1,43% 12 27,71 62,26 44,5% December 2009Armenia 101.352 69.971 9.831 19.626 1.924 0,90% 275 9 266 14 1,58% 28,50 57,88 49,2% September 2009USA 100.000 86.500 11.000 2.500 0,88% 816 816 4,70% 4.747 55,00 50,57 108,8% September 2008Germany 85.000 79650 1550 3650 150 0,75% 863 776 87 150 4,97% 804 14,60 21,91 66,6% December 2009Peru 84.035 84.024 11 0,74% 95 95 0,55% 10,04 15,16 66,3% Peru 2010Bulgaria 60.236 60.000 216 20 0,53% 76 75 1 13 0,44% 13,00 11,46 113,4% September 2009Uzbekistan 47.000 47.000 0,42% 63 63 0,36% 8,83 8,46 104,3% September 2009Malaysia 42.631 42.105 466 14 46 0,38% 137 135 2 0,79% 10 8,99 0,0% January 2010Japan 38.042 14.587 1.467 20.566 1.422 0,34% 344 293 51 1,98% 672 23,55 0,0% September 2009Myanmar 22.821 4.527 18.290 4 0,20% 37 37 0,21% 55,69 0,0% October 2008Korea 25.744 1.470 23.475 798 1 0,23% 157 157 5 0,90% 13 81,68 71,33 114,5% March 2010Sweden 23.125 21.749 963 412 1 0,20% 134 104 30 55 0,77% 21 6,77 7,13 94,8% December 2009Venezuela 20.000 20.000 0,18% 143 143 0,82% 8,15 3,60 226,4% December 2009France 12.450 9.500 2.100 850 0,11% 125 15 110 0,72% 1.290 8,69 0,0% December 2008Canada 12.140 9.500 240 0 2.400 0,11% 101 85 16 0,58% 3.789 2,55 0,0% December 2007Tajikistan 10.600 10.600 0,09% 53 53 0,31% 4,13 1,91 216,5% December 2007Chile 8.064 8.055 9 0,07% 15 15 0,09% 1 3,20 1,48 216,7% December 2007Switzerland 8.599 8.348 135 56 60 0,08% 122 119 3 7 0,70% 117 1,14 1,96 58,0% December 2009Kyrgyzstan 6.000 6.000 0,05% 6 6 0,03% 0,60 1,08 55,6% December 2007Belarus 5.500 5.500 0,05% 25 25 0,14% 3,00 0,99 303,0% December 2007Moldova 5.000 5.000 0,04% 14 14 0,08% 1,00 0,90 111,1% December 2007Austria 4.983 4.936 41 6 0,04% 208 160 48 15 1,20% 12 0,50 1,02 49,2% January 2010Singapore 4.578 4.533 30 15 0,04% 5 5 0,03% 0,92 0,0% December 2009Trinidad & Tobago 3.500 3.500 0,03% 13 12 1 0,07% 0,80 0,63 127,0% December 2006Turkey 3.339 1.850 1.489 0,03% 14 8 6 0,08% 35 0,40 4,80 8,3% April 2010Mexico 3.037 3.037 0,03% 8 8 0,05% 22 0,02 0,55 3,7% November 2008Georgia 3.000 3.000 0,03% 42 42 0,24% 0,54 0,0% January 2008Indonesia 2.550 1.755 335 210 250 0,02% 9 9 0,05% 1,50 0,0% December 2009Australia 2.825 100 1.700 275 750 0,02% 47 4 43 39 0,27% 130 5,38 0,0% November 2009Netherlands 2.032 1.350 542 140 0,02% 51 35 16 32 0,29% 558 1,98 0,0% November 2009Poland 2.106 1.502 300 4 300 0,02% 33 32 1 0,19% 49 1,19 0,0% August 2009Spain 1.863 213 847 760 43 0,02% 42 1 41 0,24% 21 3,52 3,19 110,5% December 2008Czech Republic 2.000 1.665 270 20 45 0,02% 38 25 13 0,22% 4 0,67 1,13 59,7% March 2010Slovakia 622 287 308 27 0,01% 8 6 2 4 0,05% 0,91 1,00 91,1% February 2010Latvia 500 30 10 187 273 0,00% 4 4 0,02% 11 0,23 0,0% December 2007Greece 520 0 414 106 0,00% 2 2 1 0,01% 1,33 0,0% August 2009Portugal 504 46 354 54 50 0,00% 5 1 4 3 0,03% 1,11 1,12 99,6% December 2009Finland 769 650 95 8 16 0,01% 18 17 1 5 0,10% 10 0,45 0,41 110,0% February 2010Serbia 326 320 6 0,00% 5 4 1 0,03% 0,015 0,08 19,8% April 2009United Arab Emirates 305 305 0 0 0,00% 2 1 1 0,01% 1 0,05 0,0% March 2007United Kingdom 294 4 217 73 0,00% 33 12 21 0,19% 115 0,40 0,18 224,8% December 2008New Zealand 283 180 66 37 0,00% 14 14 0,08% 0,23 0,0% March 2007Norway 376 212 138 10 16 0,00% 10 6 4 2 0,06% 4,55 0,46 987,1% January 2010Luxembourg 215 174 41 0,00% 7 5 2 0,04% 2 0,06 0,15 35,9% December 2009Belgium 143 143 0,00% 9 4 5 0,05% 60 0,03 0,0% December 2008Lithuania 150 50 100 0,00% 3 1 2 3 0,02% 1 0,200 0,31 64,7% January 2010Croatia 130 92 30 8 0,00% 1 1 0,01% 0,013 0,04 31,7% April 2009Algeria 125 125 0,00% 3 3 0,02% 0,02 0,0% October 2004Iceland 120 101 2 17 0,00% 2 2 1 0,01% 0,04 0,04 103,2% September 2009Lichtenstein 104 72 31 1 0,00% 3 3 0,02% 0,11 0,0% December 2009Hungary 72 30 42 0,00% 4 1 3 0,02% 12 0,13 0,13 95,1% December 2008Nigeria 60 60 0,00% 2 2 0,01% 0,01 0,0% May 2005Macedonia 50 7 43 0,00% 1 1 0,01% 0,02 0,13 15,4% March 2007Philippines 36 11 25 0,00% 3 1 2 0,02% 0,08 0,0% February 2006Tunesia 34 32 2 0,00% 1 1 0,01% 0,01 0,0% October 2007Ecuador 40 40 0,00% 1 1 0,01 0,0% May 2009Panama 15 15 0,00% 0,00% November 2008Bosnia & Herzegovina 7 7 0,00% 3 0 3 0,02% 2 0,00 0,0% December 2007Montenegro 0,00% 1 1 0,01% 0,00 0,0% March 2006Estonia 4 4 0,00% 1 1 0,01% 0,00 0,0% December 2008Taiwan 4 4 0,00% 1 1 0,01% 0,01 0,0% April 2005Mozambique 4 4 0,00% 1 1 0,01% 0,01 0,0% May 2007Tanzania 10 10 0,00% 3 0,00% 0,00 0,0% January 2010Vietnam 1.002 1.000 2 0,01% 12 11 1 0,07% December 2009Ireland 2 2 0,00% 1 1 0,01% 1 0,00 0,0% October 2008Kazakhstan 10 10 0,06% September 2009Dominican Republic 1 1 0,00% 2 2 0,01% 0,00 0,0% November 2009Turkmenistan 1 1 0,01% November 2009Total 11.302.529 10.584.155 404.886 226.254 87.234 17.355 15.696 1.659 1.586 12.839 1.318,70 3.305,02 39,9% April 2010