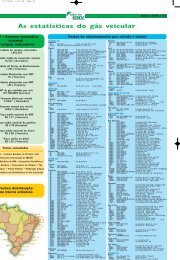
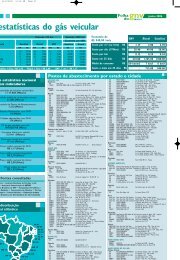
34May 2010Gas Vehicles Reportwww.ngvgroup.com • Visit the biggest NGV portal in the worldCities with CNG refuelling stationsCountry Number of cities Last updateArgentina 330 Jan. '10Armenia 37 Mar. '08Australia 3 Nov. '09Austria 118 Jan. '10Bangladesh 8 Nov. '05Bolivia 6 May '09Brazil 295 Feb. '10Bulgaria 36 Sep. '09Chile 5 Dec. '07China 74 Sept. '04Colombia 79 Dec. '09Croatia 1 Jan. '09Czech Republic 19 Mar. '10Egypt 16 Apr '06Finland 14 Feb. '10France 26 Aug. '02Germany 735 Dec. '09Greeece 1 Sept. 08Hungary 2 Aug. '02Iceland 2 Sept. '09India 8 Oct.' 06Indonesia 2 Sept. '08Iran 611 Dec. '09Ireland 1 Oct. '08Italy 150 Dec. '06Korea 34 May. '05Liechtenstein 1 Sept. '04Lithuania 2 Jan. '10Luxembourg 2 Jan. '06Macedonia 1 Jan. '05Malaysia 6 Oct. '06Mexico 2 Jun. '05Netherlands 16 Dec. '08Norway 4 Jan. '10Pakistan 50 Apr. '08Peru 2 Oct. '09Philippines 1 Oct.'05Portugal 5 Dec. '09Russia 172 Aug. '07Serbia 5 Dec. '07Singapore 1 Jul. '05Slovakia 8 Feb. '10Spain 13 Jan. '06Sweden 63 Jun. '09Switzerland 21 Dec. '09Taiwan 1 Apr'. 05Thailand 39 Aug '08Trinidad & Tobago 11 Dec. '07Turkey 2 Aug. '04United Arab Emirates 2 Oct. '06United Kingdom 5 Nov. '04Venezuela 26 Nov. '081.4232.704Europe WorlwideCountry's share of the world's total NGVs and fuelling stationsNatural Gas Vehicles Refuelling stationsCountry% of total NGVs % of total fuelling Last updateTotalTotalin the world stations in the worldPakistan 2.250.100 19,91% 3.145 18,12% March 2010Argentina 1.826.845 16,16% 1.858 10,71% January 2010Iran 1.734.431 15,35% 1.079 6,22% December 2009Brazil 1.631.173 14,43% 1.782 10,27% February 2010India 700.000 6,19% 500 2,88% April 2009Italy 676.850 5,99% 770 4,44% December 2009China 500.000 4,42% 1.652 9,52% January 2010Colombia 303.549 2,69% 601 3,46% January 2010Ukraine 200.019 1,77% 283 1,63% November 2009Bangladesh 200.000 1,77% 500 2,88% January 2010Thailand 173.480 1,53% 404 2,33% March 2010Bolivia 122.812 1,09% 128 0,74% May 2009Egypt 122.271 1,08% 119 0,69% December 2009Russia 100.020 0,88% 249 1,43% December 2009Armenia 101.352 0,90% 275 1,58% September 2009USA 100.000 0,88% 816 4,70% September 2008Germany 85.000 0,75% 863 4,97% December 2009Peru 84.035 0,74% 95 0,55% Peru 2010Bulgaria 60.236 0,53% 76 0,44% September 2009Uzbekistan 47.000 0,42% 63 0,36% September 2009Malaysia 42.631 0,38% 137 0,79% January 2010Japan 38.042 0,34% 344 1,98% September 2009Myanmar 22.821 0,20% 37 0,21% October 2008Korea 25.744 0,23% 157 0,90% March 2010Sweden 23.125 0,20% 134 0,77% December 2009Venezuela 20.000 0,18% 143 0,82% December 2009France 12.450 0,11% 125 0,72% December 2008Canada 12.140 0,11% 101 0,58% December 2007Tajikistan 10.600 0,09% 53 0,31% December 2007Chile 8.064 0,07% 15 0,09% December 2007Switzerland 8.599 0,08% 122 0,70% December 2009Kyrgyzstan 6.000 0,05% 6 0,03% December 2007Belarus 5.500 0,05% 25 0,14% December 2007Moldova 5.000 0,04% 14 0,08% December 2007Austria 4.983 0,04% 208 1,20% January 2010Singapore 4.578 0,04% 5 0,03% December 2009Trinidad & Tobago 3.500 0,03% 13 0,07% December 2006Turkey 3.339 0,03% 14 0,08% April 2010Mexico 3.037 0,03% 8 0,05% November 2008Georgia 3.000 0,03% 42 0,24% January 2008Indonesia 2.550 0,02% 9 0,05% December 2009Australia 2.825 0,02% 47 0,27% November 2009Netherlands 2.032 0,02% 51 0,29% November 2009Poland 2.106 0,02% 33 0,19% August 2009Spain 1.863 0,02% 42 0,24% December 2008Czech Republic 2.000 0,02% 38 0,22% March 2010Slovakia 622 0,01% 8 0,05% February 2010Latvia 500 0,00% 4 0,02% December 2007Greece 520 0,00% 2 0,01% August 2009Portugal 504 0,00% 5 0,03% December 2009Finland 769 0,01% 18 0,10% February 2010Serbia 326 0,00% 5 0,03% April 2009United Arab Emirates 305 0,00% 2 0,01% March 2007United Kingdom 294 0,00% 33 0,19% December 2008New Zealand 283 0,00% 14 0,08% March 2007Norway 376 0,00% 10 0,06% January 2010Luxembourg 215 0,00% 7 0,04% December 2009Belgium 143 0,00% 9 0,05% December 2008Lithuania 150 0,00% 3 0,02% January 2010Croatia 130 0,00% 1 0,01% April 2009Algeria 125 0,00% 3 0,02% October 2004Iceland 120 0,00% 2 0,01% September 2009Lichtenstein 104 0,00% 3 0,02% December 2009Hungary 72 0,00% 4 0,02% December 2008Nigeria 60 0,00% 2 0,01% May 2005Macedonia 50 0,00% 1 0,01% March 2007Philippines 36 0,00% 3 0,02% February 2006Tunesia 34 0,00% 1 0,01% October 2007Ecuador 40 0,00% 1 May 2009Panama 15 0,00% 0,00% November 2008Bosnia & Herzegovina 7 0,00% 3 0,02% December 2007Montenegro 0,00% 1 0,01% March 2006Estonia 4 0,00% 1 0,01% December 2008Taiwan 4 0,00% 1 0,01% April 2005Mozambique 4 0,00% 1 0,01% May 2007Tanzania 10 0,00% 0,00% January 2010Vietnam 1.002 0,01% 12 0,07% December 2009Ireland 2 0,00% 1 0,01% October 2008Kazakhstan 10 0,06% September 2009Dominican Republic 1 0,00% 2 0,01% November 2009Turkmenistan 1 0,01% November 2009Total 11.302.529 17.355 April 2010
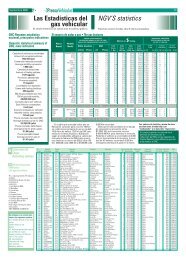
May 2010Gas Vehicles Report35www.ngvgroup.com • Visit the biggest NGV portal in the worldNGV’s statistics balanceBest growth in NGV population by numberWorld’s top 10 NGV countriesNGV x 1.000Round up figuresBest growth in fuelling station population by numberBest growth in NGV population by % Best growth in fuelling station population by %Last twelve years evolutionArgentina 1997 1998 1999 2000 2001 2002 2003 2004 2005 2006 2007 2008NGVs 418.916 480.764 544.748 630.548 755.671 879.587 1.164.839 1.348.126 1.459.236 1.429.973 1.678.230 1745677Stations 570 646 770 871 982 1.049 1.152 1.330 1.494 1.636 1.744 1.806CNG sold (MNm3) 1.270 1.412 1.508 1.681 1.851 2.041 2.649 3.062 3.186 3.061 2.940 2.659Brazil 1997 1998 1999 2000 2001 2002 2003 2004 2005 2006 2007 2008NGVs ... ... ... ... 284.751 380.515 642.844 826.364 1.052.295 1.325.823 1.467.219 1.588.331Stations ... ... ... ... 265 506 667 905 1.206 1.411 1.575 1688CNG sold (MNm3) ... ... ... 251 635 959 1.340 1.573 1.937 2.305 2.580 2.341Germany 1997 1998 1999 2000 2001 2002 2003 2004 2005 2006 2007 2008NGV 1.059 2.040 3.245 (*) 6.829 10.509 14.420 19.105 27.175 38.933 54.772 77.191Stations 30 50 120 130 250 350 400 500 630 720 804CNG sold in MWh 132.472 165.127 239.871 325.546 424.697 527.314 685.836 963.204 1.400.000Italy 1997 1998 1999 2000 2001 2002 2003 2004 2005 2006 2007 2008NGV (LDVs) 260.000 260.000 263.119 296.358 327.643 344.306 335.205 326.104 358.488 410.000 432.900 523.100Stations 276 281 298 323 344 402 456 498 535 589 609 700CNG sold (MNm3) 330 335 340 400 448 448 442 442 468 520 588 588Sweden 1997 1998 1999 2000 2001 2002 2003 2004 2005 2006 2007 2008NGVs 657 1.079 1.374 1.725 2.000 3.309 4.248 5.298 7.897 12.119 14.536 16.900Stations 14 19 22 26 31 39 48 65 85 97 115 122CNG and CBG sold (Nm3x1000) 7.137 9.862 11.335 13.950 16.678 20.125 25.434 28.872 35.450 43.856 53.636 58.126Switzerland 1997 1998 1999 2000 2001 2002 2003 2004 2005 2006 2007 2008NGVs 30 60 80 100 150 350 650 1.250 1.965 3.313 5.830 7.122Stations 3 7 13 14 20 26 37 50 64 78 97 112CNG and CBG sold (Nm3x1000) 220 451 840 994 1.575 1.859 2.281 3.054 4.422 658 10.200