Peace and Myakka River Water Quality Summary 2002 - Southwest ...
Peace and Myakka River Water Quality Summary 2002 - Southwest ...
Peace and Myakka River Water Quality Summary 2002 - Southwest ...

Create successful ePaper yourself
Turn your PDF publications into a flip-book with our unique Google optimized e-Paper software.
<strong>Peace</strong> <strong>and</strong> <strong>Myakka</strong> <strong>River</strong><strong>Water</strong> <strong>Quality</strong> <strong>Summary</strong>Prepared For:• <strong>Southwest</strong> Florida <strong>Water</strong> Management District• <strong>Peace</strong> <strong>River</strong>/Manasota Regional <strong>Water</strong> SupplyAuthorityPrepared By:Charlotte Harbor Environmental CenterOctober <strong>2002</strong>
<strong>Water</strong> <strong>Quality</strong> Conditions<strong>and</strong> Pollutant Loads <strong>and</strong> Yieldsin the <strong>Peace</strong> <strong>and</strong> <strong>Myakka</strong> <strong>River</strong> BasinsPrepared for the<strong>Peace</strong> <strong>River</strong>/Manasota Regional <strong>Water</strong> Supply Authority<strong>and</strong> the<strong>Southwest</strong> Florida <strong>Water</strong> Management DistrictPrepared by:Charlotte HarborEnvironmental Center, Inc.10941 Burnt Store RoadPunta Gorda, FloridaOctober <strong>2002</strong>
CONTENTSExecutive <strong>Summary</strong> ...........................................................................................................iiAcknowledgments............................................................................................................xiiList of Figures ................................................................................................................ xiiiList of Tables ................................................................................................................xiv1.0 Introduction1.1 Background ..................................................................................................... 11.2 <strong>Water</strong> quality management issues .................................................................. 21.3 Report objectives <strong>and</strong> structure....................................................................... 32.0 <strong>Water</strong> <strong>Quality</strong> at Non-Tidal Stations2.1 Methods........................................................................................................... 42.2 Rainfall <strong>and</strong> streamflow ................................................................................... 82.3 Constituent concentrations <strong>and</strong> WQI values ................................................. 102.4 Exceedances of State <strong>Water</strong> <strong>Quality</strong> St<strong>and</strong>ards ............................................ 113.0 Constituent Loads <strong>and</strong> Yields3.1 Annual loads................................................................................................... 233.2 Annual yields .................................................................................................. 323.3 Annual flow-adjusted loads............................................................................. 424.0 <strong>Water</strong> <strong>Quality</strong> at Tidal Stations4.1 Physical parameters ....................................................................................... 524.2 Macronutrients – dissolved inorganic N <strong>and</strong> P ............................................... 554.3 Chlorophyll-a .................................................................................................. 565.0 References............................................................................................................... 57AppendicesAppendix A. Constituent concentration summaries, non-tidal stationsAppendix B. Constituent concentration summaries, tidal stationsi
EXECUTIVE SUMMARYBACKGROUNDDuring the 1980’s <strong>and</strong> 1990’s a number of federal, state <strong>and</strong> regional resourcemanagement programs designated the Charlotte Harbor watershed as a prioritymanagement area. Protection <strong>and</strong> enhancement of water quality for use by people <strong>and</strong>wildlife are fundamental goals of these watershed management efforts.In 1996 a watershed assessment report funded by the <strong>Southwest</strong> Florida <strong>Water</strong>Management District emphasized the important role that monitoring data play insupporting sound watershed management decisions, <strong>and</strong> recommended that morefrequent (e.g., biweekly or monthly) water quality monitoring be initiated at selectedsites in the <strong>Peace</strong> <strong>and</strong> <strong>Myakka</strong> <strong>River</strong> basins (Squires et al. 1996). Thatrecommendation, <strong>and</strong> concerns about the sufficiency of the information currentlyavailable on water quality conditions in the Charlotte Harbor watershed, motivated anumber of organizations to work cooperatively to implement the water quality monitoring<strong>and</strong> assessment project covered in this report.Using funds provided by the District <strong>and</strong> the <strong>Peace</strong> <strong>River</strong>/Manasota Regional <strong>Water</strong>Supply Authority, <strong>and</strong> in-kind services provided by the Charlotte Harbor EnvironmentalCenter, the District, the Florida Department of Environmental Protection, <strong>and</strong> the City ofPunta Gorda, the cooperating organizations initiated a monthly water quality monitoringprogram at a number of stations in the <strong>Peace</strong> <strong>River</strong> watershed in October 1997. InOctober 1998 the program was exp<strong>and</strong>ed to include an additional station in the <strong>Peace</strong><strong>River</strong> watershed <strong>and</strong> a number of stations in the <strong>Myakka</strong> <strong>River</strong> basin. (Station locationsare shown in Fig. 1 <strong>and</strong> summarized in Table 1 of the report text.)To encourage timely analysis <strong>and</strong> dissemination of the water quality data collectedduring the initial years of the cooperative monitoring program, the Charlotte HarborNational Estuary Program provided funding for the preparation of three annual projectreports (CHEC 1999, 2000, 2001). To help readers interpret this information in thecontext of regional water quality trends, the initial reports also included analyses ofwater quality <strong>and</strong> streamflow trends occurring at selected stations in the <strong>Peace</strong> <strong>and</strong><strong>Myakka</strong> <strong>River</strong> basins during the years 1970 through 1998.In addition to the watershed monitoring program, the District, as part of its Surface<strong>Water</strong> Improvement <strong>and</strong> Management (SWIM) program, also carried out a monitoringproject in Charlotte Harbor that included portions of the most downstream, tidallyinfluencedreaches of the <strong>Peace</strong> <strong>and</strong> <strong>Myakka</strong> rivers. (The locations of these stationsare shown in Fig. 18, below). The SWIM monitoring project began in January 1993 <strong>and</strong>was ended in December 2000, in preparation for a multi-agency monitoring programbased on a fundamentally different sampling design that was scheduled to begin during2001.ii
REPORT ORGANIZATION AND SCOPEThe present report is the fourth in a series of annual summaries, <strong>and</strong> contains thefollowing elements:• A summary of water quality conditions in freshwater (non-tidal) portions of the<strong>Peace</strong> <strong>and</strong> <strong>Myakka</strong> rivers during the years 1998-2001, based on monitoring datacollected in the initial four years of the cooperative monitoring program;• Estimates of annual loads, yields, <strong>and</strong> flow-adjusted loads of selected waterquality constituents; <strong>and</strong>• A summary of water quality conditions in the tidal (estuarine) portions of bothrivers, based on monitoring data collected in those areas by the District’s SWIMprogram during the years 1994 - 2000.CALENDAR YEARS AND WATER YEARSData summaries in this report include two types of years: the familiar calendar year thatbegins on January 1 <strong>and</strong> ends on December 31, <strong>and</strong> the “water year” which begins onOctober 1 <strong>and</strong> ends on September 30. The “water year” is equivalent to the federalfiscal year, <strong>and</strong> is used in many water-resource applications because it is the reportingunit that federal agencies — such as the U.S. Geological Survey — use whensummarizing annual climatological <strong>and</strong> hydrologic data.RAINFALL AND STREAMFLOWThe amount of rain that falls on a watershed in a given year can have important effectson streamflow <strong>and</strong> water quality.In the <strong>Peace</strong> <strong>and</strong> <strong>Myakka</strong> <strong>River</strong> watersheds, annual rainfall <strong>and</strong> streamflow levels varieddramatically during water years 1998-2001. A strong El Niño event occurred during the1998 water year, <strong>and</strong> total annual rainfall in that year was substantially higher than thelong-term (1950–2001) mean value at each monitoring station. Annual meanstreamflow was also quite high during the 1998 water year, exceeding 200% of thelong-term (1950-2001) values at each station.Rainfall returned to near-average or below-average levels during water years 1999-2001, <strong>and</strong> annual mean streamflow declined in response. Annual mean flows at severalstations in the upper <strong>Peace</strong> <strong>River</strong> basin remained below their long-term values duringwater years 1999-2001. In the <strong>Myakka</strong> <strong>River</strong> basin <strong>and</strong> other portions of the <strong>Peace</strong><strong>River</strong> watershed, annual mean flows fell during water year 2000, but rebounded in 2001to levels close to or above their long-term means.Detailed analyses of rainfall <strong>and</strong> streamflow trends are beyond the scope of this project,but are currently being conducted by the Charlotte Harbor National Estuary Program.iii
The Estuary Program plans to release a report summarizing the results of thoseanalyses during <strong>2002</strong>.WATER QUALITY IN NON-TIDAL (FRESHWATER) AREASA water quality index (WQI) developed for Florida streams by FDEP was used tosummarize existing water quality conditions at the non-tidal stations monitored by thecooperative program during water years 1998-2001.The WQI was developed using sampling data collected in 1987 from 2,000 streammonitoring sites throughout the state. Based on those data, percentile distributions ofseveral groups of water quality indicators — including nutrients, water clarity, dissolvedoxygen <strong>and</strong> oxygen-dem<strong>and</strong>ing substances — were determined on a statewide basis.WQI values are calculated using those percentile distributions: for example, a stationwith an average annual total nitrogen concentration of 1.2 mg/L — the median valueobserved in the 1987 data set — would receive a WQI score of 50 (denoting the 50 thpercentile) for that indicator.Overall WQI scores can be averaged across indicator categories to obtain an averageindex value for each monitoring site. FDEP guidelines suggest that average indexvalues of 0-44 indicate “good,” 45-60 indicate “fair,” <strong>and</strong> >60 indicate “poor” waterquality conditions in Florida streams.For this study, annual average WQI values were calculated using five water qualityconstituents (turbidity, total suspended solids, total organic carbon, nitrate+nitritenitrogen, <strong>and</strong> total nitrogen). A total of 58 annual average WQI values were calculatedfor the 16 stations sampled during water years 1998 - 2001.The Saddle Creek at Structure P-11 station, which is located immediately downstreamfrom Lake Hancock in the upper <strong>Peace</strong> <strong>River</strong> basin, exhibited the poorest water qualityamong the sites sampled, falling in the 75th to 95th percentiles of Florida streams formost parameters in each year.Other monitoring sites at which “poor” water quality conditions were observed included:• <strong>Peace</strong> Creek Canal near Wahneta (in water years 1998 <strong>and</strong> 1999),• <strong>Peace</strong> <strong>River</strong> at Bartow (1998, 1999)• <strong>Peace</strong> <strong>River</strong> at Ft. Meade (1998)• <strong>Peace</strong> <strong>River</strong> at Zolfo Springs (1998)• <strong>Peace</strong> <strong>River</strong> at Arcadia (1998)• Big Slough Canal near <strong>Myakka</strong> City (2000).Two sites exhibited consistently “good” water quality based on the WQI:• Shell Creek near Punta Gorda (1998-2001)• <strong>Myakka</strong> <strong>River</strong> at <strong>Myakka</strong> City (1999-2001).iv
“Good” water quality conditions were also found during one or more years at thefollowing stations:• <strong>Myakka</strong> <strong>River</strong> near Sarasota (1999, 2000)• Deer Prairie Slough near North Port (1999)• <strong>Peace</strong> <strong>River</strong> at Ft. Meade (2000)• <strong>Peace</strong> <strong>River</strong> at Arcadia (2000)• Charlie Creek near Gardner (2000)• Horse Creek near <strong>Myakka</strong> Head (1999)• Horse Creek near Arcadia (1999).The remaining stations <strong>and</strong> years were characterized as “fair” based on the WQI.EXCEEDANCES OF STATE WATER QUALITY STANDARDSAlthough WQI values are helpful in providing an easily-underst<strong>and</strong>able summary ofgeneral water quality conditions, they are calculated using a limited number ofparameters <strong>and</strong> must be interpreted with care. A more detailed examination ofmonitoring data, focusing on additional parameters, can also be helpful to identify waterquality issues that may go unnoticed in an analysis based on WQI values alone.The State of Florida has adopted water quality st<strong>and</strong>ards (summarized in Ch. 62-302,Florida Administrative Code) for a number of water quality constituents, in order tomaintain productive populations of fish <strong>and</strong> wildlife <strong>and</strong> protect human health. In somecases these st<strong>and</strong>ards may be exceeded due to natural factors, <strong>and</strong> exceedances ofthis type should not be interpreted as evidence of degraded water quality. In manycases, however, exceedances of state st<strong>and</strong>ards can be linked to specific pollutantdischarges or other human activities that are causing negative water quality impacts.Information on the frequency <strong>and</strong> magnitude of exceedances can thus be helpful inidentifying sites where water quality may be declining or degraded. Once such sites areidentified, more detailed follow-up studies can be designed <strong>and</strong> implemented to identifythe cause(s) of the observed exceedances.Specific ConductanceSpecific conductance measures the ability of a water sample to carry an electric current,which depends on the presence of ions in the sample, their total concentration, <strong>and</strong>other physical <strong>and</strong> chemical characteristics. Freshly distilled water has a conductivity ofbetween 0.5 <strong>and</strong> 2 µmhos/cm. The Florida st<strong>and</strong>ard for specific conductance in freshsurface waters is 1,275 µmhos/cm, a level set to protect populations of native fish <strong>and</strong>other aquatic organisms.Exceedances of this st<strong>and</strong>ard were observed at four stations during water years 1998-2001:• Joshua Creek at Nocatee (during 1999, 2000 <strong>and</strong> 2001)• Shell Creek near Punta Gorda (during 2001)• Big Slough Canal near <strong>Myakka</strong> City (during 1999)• Big Slough Canal near North Port (during 1999).v
In Florida, the presence of elevated specific conductance levels in fresh surface watersoften indicate that substantial discharges of groundwater — usually from theIntermediate or Floridan aquifers — are occurring at locations upstream of the samplingpoint. Agricultural <strong>and</strong> industrial operations are the most common sources of suchgroundwater discharges.Un-Ionized AmmoniaThe un-ionized form of ammonia is highly toxic to fish <strong>and</strong> other aquatic organisms. Inwater, ionized (NH 4 + ) <strong>and</strong> un-ionized (NH 3 ) ammonia exist in a dynamic chemicalequilibrium, with the un-ionized form becoming increasingly common at highertemperature <strong>and</strong> pH levels.The Florida water quality st<strong>and</strong>ard for un-ionized ammonia is 0.02 mg NH 3 /L. Levelsexceeding the st<strong>and</strong>ard were observed at two stations during water years 1998 – 2001:• Saddle Creek at Structure P-11 (in water years 2000 <strong>and</strong> 2001)• Horse Creek near <strong>Myakka</strong> Head (2000).Levels of un-ionized ammonia that were relatively high (>0.01 mg NH 3 /L) but did notexceed the water quality st<strong>and</strong>ard were also observed at several other stations,including:• <strong>Peace</strong> <strong>River</strong> at Zolfo Springs (2000, 2001)• Shell Creek near Punta Gorda (2001)• <strong>Myakka</strong> <strong>River</strong> at <strong>Myakka</strong> City (1999)• Big Slough Canal near <strong>Myakka</strong> City (1999)• Big Slough Canal near North Port (1999)The ammonia nitrogen found in rivers <strong>and</strong> streams can come from a variety of natural<strong>and</strong> manmade sources. Exceedances of the un-ionized ammonia water qualityst<strong>and</strong>ard are often associated with discharges from anthropogenic activities, includingfeedlots <strong>and</strong> other concentrated animal feeding operations, sewage treatment systems,<strong>and</strong> industrial facilities that make or use ammonia-based chemical products.Dissolved OxygenDissolved oxygen (DO) is a critical water quality parameter, due to the importance ofDO to the metabolic processes of all multi-celled aquatic organisms.DO concentrations fluctuate as a result of a number of natural <strong>and</strong> man-made factors.Important natural factors include seasonal <strong>and</strong> daily temperature cycles (because thesolubility of oxygen in water is higher at lower water temperatures), photosynthesis(because photosynthesizing organisms release DO into the water column, increasing itsavailability) <strong>and</strong> respiration/decomposition processes (which consume oxygen <strong>and</strong> thuscause DO concentrations in the water column to decline).vi
The primary manmade influences include the discharge of nutrients <strong>and</strong> organic wastesinto waterbodies, which can lead to increased eutrophication, higher rates ofphotosynthesis, respiration <strong>and</strong> decomposition, <strong>and</strong> larger daily <strong>and</strong> seasonalfluctuations in DO concentrations.The Florida st<strong>and</strong>ard for DO in fresh surface waters is 5 mg/L. For brackish <strong>and</strong> marinewaters, DO should not average less than 5 mg/L in a 24-hour period <strong>and</strong> should neverbe less than 4 mg/L. Laboratory studies have shown that DO concentrations below 4mg/L are stressful for most fish <strong>and</strong> many shellfish species, <strong>and</strong> concentrations below 2mg/L are highly stressful <strong>and</strong> potentially fatal for many organisms.During water years 1998 through 2001, DO concentrations below the 5 mg/L st<strong>and</strong>ardwere observed at least once at each monitoring station in the freshwater portions of the<strong>Peace</strong> <strong>and</strong> <strong>Myakka</strong> <strong>River</strong> watersheds. Many of these instances may have beenassociated with natural factors, such as high water temperatures. At several stations,however, low DO levels were a frequent occurrence, observed on 25% or more of thesampling dates. And for some stations the median annual DO concentration (the valuemeasured on at least half the sampling dates during a year) was less than the 5 mg/Lst<strong>and</strong>ard. This latter group of stations included:• <strong>Peace</strong> Creek Canal near Wahneta (water years 1998, 1999, 2000, <strong>and</strong> 2001)• Saddle Creek at Structure P-11 (1999, 2001)• <strong>Peace</strong> <strong>River</strong> at Bartow (1998, 1999, 2000, 2001)• Shell Creek near Punta Gorda (1998)• Deer Prairie Slough near North Port (2000, 2001)• Big Slough Canal near North Port (2001).Chlorophyll-aChlorophyll-a concentrations, which are used to estimate the biomass of algae <strong>and</strong>other phytoplankton in the water column, are among the best indicators of awaterbody’s trophic state. Annual mean chlorophyll-a concentrations in Florida streamsare usually at or below 5.5 µg/L. FDEP considers stream water quality to be “impaired”if the annual mean is above 20 µg/L.Annual mean chlorophyll-a concentrations greater than 20 µg/L were observed at twomonitoring stations during the 1998-2001 water years:• Saddle Creek at Structure P-11 (all years)• <strong>Peace</strong> <strong>River</strong> at Bartow (1998, 1999).The elevated chlorophyll concentrations at these stations were apparently caused bydischarges from Lake Hancock, a hypereutrophic lake that experiences chronic, yearroundblooms of planktonic algae <strong>and</strong> cyanobacteria.Individual observations of chlorophyll-a concentrations greater than 20 µg/L, whichindicated the presence of occasional phytoplankton blooms but did not represent aviolation of state water quality st<strong>and</strong>ards, were observed at a number of additionalvii
stations:• <strong>Peace</strong> Creek Canal near Wahneta (1999)• <strong>Peace</strong> <strong>River</strong> at Fort Meade (1998, 1999, 2000)• <strong>Peace</strong> <strong>River</strong> at Zolfo Springs (1998, 1999, 2000)• <strong>Peace</strong> <strong>River</strong> at Arcadia (1998)• Horse Creek near <strong>Myakka</strong> Head (2000)• Horse Creek near Arcadia (1998)• <strong>Myakka</strong> <strong>River</strong> near Sarasota (1999, 2000, 2001).CONSTITUENT LOADS AND YIELDSEstimation of loads <strong>and</strong> yields of water <strong>and</strong> water quality constituents is a basiccomponent of most watershed assessment programs. ‘Load’ represents the mass of aconstituent (e.g., tons of nitrogen) passing a given point in a stream during a specifiedtime interval (e.g., month, day or year). The ‘yield’ of a constituent is the load divided bythe surface area of the contributing drainage basin, allowing loads produced by basinsof different size to be compared on a consistent, per-unit-area basis.In the present study the largest estimated yields of total nitrogen were observed at theSaddle Creek station during the 1998 water year, <strong>and</strong> at the Joshua Creek, Shell Creek<strong>and</strong> Big Slough-<strong>Myakka</strong> City stations during water year 2001. (It is likely that largeconstituent yields occurred at every station during the 1998 El Niño event, but monthlywater quality sampling was not conducted at many sites in that year.)Relatively large estimated yields of dissolved inorganic nitrogen (DIN) <strong>and</strong> nitrate-plusnitrite(NO 2+3 -N ) nitrogen occurred at the Joshua Creek-Nocatee site in all years. Avisible spike occurred at this site in water year 2001, when DIN <strong>and</strong> NO 2+3 -N yieldsexceeded 5 kg N/ha/yr. Other stations with estimated inorganic nitrogen yields greaterthan 1 kg N/ha/yr included:• <strong>Peace</strong> <strong>River</strong> at Zolfo Springs (1998)• <strong>Peace</strong> <strong>River</strong> at Arcadia (1998)• Big Slough Canal near <strong>Myakka</strong> City (2000, 2001)• <strong>Peace</strong> <strong>River</strong> at Fort Meade (1998).Substantial increases in the estimated yields of DIN (<strong>and</strong> PO 4 -P) occurred between theupstream <strong>and</strong> downstream stations located on Horse Creek, suggesting the potentialpresence of anthropogenic sources of those constituents at one or more locationsbetween the two stations.Estimated yields of inorganic <strong>and</strong> total phosphorus followed similar temporal <strong>and</strong> spatialpatterns, with the largest values occurring at gages on the main stem of the <strong>Peace</strong><strong>River</strong> (e.g., Fort Meade, Zolfo Springs, <strong>and</strong> Arcadia) during 1998. Relatively largeyields also occurred on the main stem of the <strong>Myakka</strong> <strong>River</strong> <strong>and</strong> at the Big Slough Canal-<strong>Myakka</strong> City station during 2001.viii
Yields of total suspended solids (TSS) showed a pronounced spike at the Saddle Creekgaging station during water year 1998, presumably due to episodic discharges fromLake Hancock during El Niño-related storm events. Other stations <strong>and</strong> years thatproduced relatively high TSS yields (in comparison to other stations <strong>and</strong> years)included:• Shell Creek near Punta Gorda (2001)• <strong>Myakka</strong> <strong>River</strong> at <strong>Myakka</strong> City (2001)• <strong>Peace</strong> <strong>River</strong> at Bartow (1998)• Saddle Creek at Structure P-11 (1999, 2000)• <strong>Peace</strong> <strong>River</strong> at Fort Meade (1998)• Big Slough Canal near <strong>Myakka</strong> City (2001).<strong>Water</strong>shed managers can gain additional insights into spatial <strong>and</strong> temporal pollutantdischarge patterns by examining the annual ‘flow-adjusted’ loads of important waterquality constituents that are discharged from gaged sub-basins. These values arecalculated by dividing a sub-basin’s estimated annual constituent load (in milligrams) byits measured annual discharge (in liters). The result, expressed in units of mg/L, givesan estimate of the annual average mass of the constituent that was discharged from asub-basin per unit water flow.In cases where managers wish to reduce the loads of a particular constituent to areceiving water body, the most cost-effective approach is often to focus on areas thatexhibit the highest flow-adjusted loads of that constituent. If effective load reductionmethods are available, projects implemented in those areas should tend to produce thelargest load reductions per volume of water treated.For dissolved inorganic nitrogen forms, the largest estimated flow-adjusted loadsobserved in the <strong>Peace</strong>-<strong>Myakka</strong> monitoring program during water years 1998 – 2001occurred at the following stations:• Joshua Creek at Nocatee (water years 1999, 2000, <strong>and</strong> 2001)• <strong>Peace</strong> <strong>River</strong> at Zolfo Springs (1998-2001)• Big Slough Canal near <strong>Myakka</strong> City (2000)• <strong>Peace</strong> <strong>River</strong> at Arcadia (1998-2001)• <strong>Peace</strong> Creek Canal near Wahneta (2000).The largest estimated flow-adjusted loads of dissolved inorganic phosphorus wereobserved at the following stations:• <strong>Peace</strong> <strong>River</strong> at Bartow (1999, 2001)• <strong>Peace</strong> <strong>River</strong> at Fort Meade (1998 – 2000)• <strong>Peace</strong> <strong>River</strong> at Zolfo Springs (1998 – 2001)• Charlie Creek near Gardner (1999)• <strong>Peace</strong> <strong>River</strong> at Arcadia (1998, 1999, 2001)• <strong>Myakka</strong> <strong>River</strong> near Sarasota (2001)• Big Slough Canal near <strong>Myakka</strong> City (2001).ix
The largest estimated flow-adjusted loads of TSS were observed at the followingstations:• Saddle Creek at Structure P-11 (1998, 1999, 2000)• <strong>Peace</strong> <strong>River</strong> at Bartow (1999, 2000)WATER QUALITY IN TIDAL (ESTUARINE) AREASBetween January 1993 <strong>and</strong> December 2000, as part of a larger Charlotte Harbormonitoring program, the District conducted monthly water quality monitoring at sevensites in the tidal reaches of the <strong>Peace</strong> <strong>and</strong> <strong>Myakka</strong> rivers. The sites were located atgeographic coordinates which were at or near locations that had been sampled by theU.S. Geological Survey (USGS) in an earlier monitoring program conducted during the1980s.Near-Surface SalinityThe most upstream stations in both river systems (CH-001 in the tidal <strong>Myakka</strong> <strong>and</strong> CH-029 in the tidal <strong>Peace</strong>) were located in oligohaline areas, with median salinities 20 ppt).Median near-surface salinities at the remaining stations were generally mesohaline,ranging between 10 <strong>and</strong> 25 ppt. Stations CH-002 (<strong>Myakka</strong>) <strong>and</strong> CH-004 (<strong>Peace</strong>)exhibited similar median values, of between 10 <strong>and</strong> 22 ppt. Stations CH-02B (<strong>Myakka</strong>)<strong>and</strong> CH-05B also exhibited similar median values, between 13 <strong>and</strong> 24 ppt. Highestmedian salinities (18–26 ppt) occurred at station CH-005, near the mouth of the <strong>Peace</strong><strong>River</strong>.Near-Surface ColorNatural water color, produced as a result of decomposition of leaf litter <strong>and</strong> otherrefractory organic matter, is known to be an important source of light attenuation in the<strong>Peace</strong> <strong>and</strong> <strong>Myakka</strong> river systems <strong>and</strong> portions of Charlotte Harbor.Among the stations sampled during water years 1994-2000, median near-surface colorlevels varied inversely with median near-surface salinities. Color levels were quite highat the most upstream stations, fell by about 50% between those stations <strong>and</strong> the nextdownstream sampling locations, <strong>and</strong> declined another 20-40% at the highest-salinitystations.Color levels in estuaries are affected by a variety of physical <strong>and</strong> chemical processes.The simplest physical process is dilution, which occurs when highly colored river watermixes with sea water containing much lower concentrations of the dissolved <strong>and</strong>colloidal humic acids <strong>and</strong> other compounds that contribute to water color. Humicmaterials are also removed from the water column through two physical-chemicalprocesses — flocculation <strong>and</strong> adsorption — whose rates increase when the materialsx
are transported from fresh to more saline waters. In estuaries, flocculation of humicacid colloids reportedly occurs preferentially at salinities between 0 <strong>and</strong> 5 ppt.Median color values for Florida rivers <strong>and</strong> estuaries, as reported by Friedemann <strong>and</strong>H<strong>and</strong> (1989) based on a survey of several thous<strong>and</strong> records retrieved from the U.S.EPA STORET database, are 70.0 <strong>and</strong> 20.0 pcu, respectively. Values observed in thetidal reaches of the <strong>Peace</strong> <strong>and</strong> <strong>Myakka</strong> river systems during water years 1994-2000were substantially higher than these statewide medians.Dissolved OxygenAnnual median dissolved oxygen concentrations varied over a relatively narrow range,between about 5.7 <strong>and</strong> 7.7 mg/L. Concentrations in the “stressful” (< 4 mg/L) rangewere recorded at least once during most years at every site. Concentrations in the“hypoxic” (< 2 mg/L) range, which are potentially fatal to organisms that cannot move toareas of higher oxygen availability, were observed at the following stations:• CH-02B (water years 1995, 1999, 2000)• CH-004 (all years)• CH-05B (1994, 1995, 1998, 1999)• CH-005 (all years)Chlorophyll-aChlorophyll-a concentrations, which provide estimates of phytoplankton biomass in thewater column, are helpful indicators of a waterbody’s trophic state. Annual medianconcentrations ranged between1.0 µg/L <strong>and</strong> 13 µg/L at the tidal <strong>Myakka</strong> <strong>River</strong> stations<strong>and</strong> between 2.3 <strong>and</strong> 10.6 µg/L in the tidal <strong>Peace</strong> <strong>River</strong>. The statewide medianchlorophyll-a concentration for Florida estuaries, as reported by an FDEP surveyconducted in the mid-1980’s, is 8.5 µg/L.Algal blooms (indicated by chlorophyll-a concentrations > 20 µg/L) occurred at every<strong>Peace</strong> <strong>and</strong> <strong>Myakka</strong> <strong>River</strong> station at some time during the monitoring period.Pronounced blooms, with chlorophyll concentrations > 50 µg/L, were observed at threesites.Annual mean chlorophyll-a concentrations observed at several stations during wateryears 1994-2000 exceeded 11 µg/L, a value that has been adopted by the State ofFlorida as indicating potentially impaired water quality conditions in the State’s estuarinewaters. Stations <strong>and</strong> years where the annual mean exceeded the 11 µg/L ‘impairment’level included:• <strong>Myakka</strong> <strong>River</strong> site CH-002 (water years 1995, 1999)• <strong>Myakka</strong> <strong>River</strong> site CH-02B (1995, 1998, 1999)• <strong>Peace</strong> <strong>River</strong> site CH-029 (1995, 1996)• <strong>Peace</strong> <strong>River</strong> site CH-004 (1994, 1995, 1996, 1999)• <strong>Peace</strong> <strong>River</strong> site CH-05B (1999)• <strong>Peace</strong> <strong>River</strong> site CH-005 (1994).xi
ACKNOWLEDGMENTSMany organizations <strong>and</strong> individuals contributed to this report. Funding was provided bythe <strong>Peace</strong> <strong>River</strong> Basin Board <strong>and</strong> the Manasota Basin Board of the <strong>Southwest</strong> Florida<strong>Water</strong> Management District, <strong>and</strong> by the <strong>Peace</strong> <strong>River</strong>/Manasota Regional <strong>Water</strong> SupplyAuthority. In-kind services were provided by the Charlotte Harbor EnvironmentalCenter, City of Punta Gorda, Florida Department of Environmental Protection, <strong>and</strong><strong>Southwest</strong> Florida <strong>Water</strong> Management District. Al Cheatham <strong>and</strong> Betty Staugler(CHEC), Bill Harper <strong>and</strong> Cindy Mick (City of Punta Gorda), <strong>and</strong> Sam Stone(PR/MRWSA) provided logistical support <strong>and</strong> technical information on the project area.Chris Anastasiou , Fran Flores, Ian Geraldi, Pam Green, Jill Hood, Jason Hood, GarrettJabaut, Ralph Meder, Keith Morrison, Nita Ostermann, Kelly Permenter, Br<strong>and</strong>y Steed,Chris Tomlinson, Brian Vanaeist <strong>and</strong> Chris Zajac (SWFWMD) collected the watersamples <strong>and</strong> in situ hydrographic data. Roberta Starks (SWFWMD) coordinated themonthly monitoring effort, supervised data entry <strong>and</strong> data management, <strong>and</strong> served asthe project’s quality assurance officer. Chemical analyses were performed bylaboratory staff at FDEP, SWFWMD, <strong>and</strong> the Environmental <strong>Quality</strong> Laboratory, Inc.Sam Stone (PR/MRWSA), <strong>and</strong> Chris Anastasiou, Roberta Starks, <strong>and</strong> Dave Tomasko(SWFWMD), coordinated data transfers <strong>and</strong> provided technical support <strong>and</strong>recommendations. The report was prepared by Gerold Morrison (CHEC).xii
LIST OF FIGURESFigure 1. Map showing locations of USGS gaging stations in the <strong>Peace</strong> <strong>and</strong><strong>Myakka</strong> <strong>River</strong> basins .............................................................................6Figure 2. Annual rainfall <strong>and</strong> stream discharge at three monitoring locationsin the <strong>Peace</strong> <strong>and</strong> <strong>Myakka</strong> <strong>River</strong> watersheds .........................................9Figure 3. Measured water yields at USGS gaging stations, water years1998 – 2001. .......................................................................................34Figure 4. Estimated TN yields, water years 1998 – 2001...................................35Figure 5. Estimated DIN yields, water years 1998 – 2001..................................36Figure 6. Estimated NO 2+3 - N yields, water years 1998 – 2001.........................37Figure 7. Estimated NH 4 - N yields, water years 1998 – 2001 ...........................38Figure 8. Estimated TP yields, water years 1998 – 2001 ...................................39Figure 9. Estimated PO 4 - P yields, water years 1998 – 2001............................40Figure 10. Estimated TSS yields, water years 1998 – 2001...............................41Figure 11. Estimated flow-adjusted TN loads.....................................................43Figure 12. Estimated flow-adjusted DIN loads ...................................................44Figure 13. Estimated flow-adjusted NO 2+3 - N loads ..........................................45Figure 14. Estimated flow-adjusted NH 4 - N loads .............................................46Figure 15. Estimated flow-adjusted TP loads .....................................................47Figure 16. Estimated flow-adjusted PO 4 - P loads..............................................48Figure 17. Estimated flow-adjusted TSS loads...................................................49Figure 18. Map showing locations of District monitoring stationsin tidal reaches of the <strong>Peace</strong> <strong>and</strong> <strong>Myakka</strong> rivers ...............................51xiii
LIST OF TABLESTable 1. Stations where monthly water quality monitoring was conducted,by water year............................................................................................................ 6Table 2. Florida stream <strong>Water</strong> <strong>Quality</strong> Index (WQI)values, water years1998 - 2001 .......................................................................................15Table 3. Estimated annual TN loads (metric tons N/yr).....................................25Table 4. Estimated annual DIN loads (metric tons N/yr) ...................................26Table 5. Estimated annual NO 2+3 - N loads (metric tons N/yr) ..........................27Table 6. Estimated annual NH 4 - N loads (metric tons N/yr) .............................28Table 7. Estimated annual TP loads (metric tons P/yr) .....................................29Table 8. Estimated annual PO 4 - P loads (metric tons P/yr)..............................30Table 9. Estimated annual TSS loads (metric tons/yr) ......................................31xiv
1.0 INTRODUCTION1.1 BACKGROUNDDuring the 1980’s <strong>and</strong> 1990’s a number of federal, state <strong>and</strong> regional resourcemanagement programs designated the Charlotte Harbor watershed as a prioritymanagement area. Protection <strong>and</strong> enhancement of water quality for use by people <strong>and</strong>wildlife are fundamental goals of these watershed management efforts.In 1996 a watershed assessment report funded by the <strong>Southwest</strong> Florida <strong>Water</strong>Management District emphasized the important role that monitoring data play insupporting sound watershed management decisions, <strong>and</strong> recommended that morefrequent (e.g., biweekly or monthly) water quality monitoring be initiated at selectedsites in the <strong>Peace</strong> <strong>and</strong> <strong>Myakka</strong> <strong>River</strong> basins (Squires et al. 1996). Thatrecommendation, <strong>and</strong> concerns about the sufficiency of the information currentlyavailable on water quality conditions in the Charlotte Harbor watershed, motivated anumber of organizations to work cooperatively to implement the water quality monitoring<strong>and</strong> assessment project covered in this report.Using funds provided by the District <strong>and</strong> the <strong>Peace</strong> <strong>River</strong>/Manasota Regional <strong>Water</strong>Supply Authority, <strong>and</strong> in-kind services provided by the Charlotte Harbor EnvironmentalCenter, the District, the Florida Department of Environmental Protection, <strong>and</strong> the City ofPunta Gorda, the cooperating organizations initiated a monthly water quality monitoringprogram at a number of stations in the <strong>Peace</strong> <strong>River</strong> watershed in October 1997. InOctober 1998 the program was exp<strong>and</strong>ed to include an additional station in the <strong>Peace</strong><strong>River</strong> watershed <strong>and</strong> a number of stations in the <strong>Myakka</strong> <strong>River</strong> basin. In order toprovide information on annual mass loadings of priority water quality constituents eachof these stations was co-located with an existing stream gaging station, wheremeasurements of stream flow are recorded on a continuous basis by the U.S.Geological Survey. (The locations of these USGS gaging stations, which for technicalreasons must be sited in the freshwater, non-tidal portions of a watershed, are shown inFig. 1 <strong>and</strong> summarized in Table 1 below.)To encourage timely analysis <strong>and</strong> dissemination of the water quality data collectedduring the initial years of the cooperative monitoring program, the Charlotte HarborNational Estuary Program provided funding for the preparation of three annual projectreports (CHEC 1999, 2000, 2001). To help readers interpret this information in thecontext of regional water quality trends, the initial reports also included analyses ofwater quality <strong>and</strong> streamflow trends occurring at selected stations in the <strong>Peace</strong> <strong>and</strong><strong>Myakka</strong> <strong>River</strong> basins during the years 1970 through 1998.In addition to the watershed monitoring program, the District, as part of its Surface<strong>Water</strong> Improvement <strong>and</strong> Management (SWIM) program, also carried out a monitoringproject in Charlotte Harbor that included portions of the most downstream, tidallyinfluencedreaches of the <strong>Peace</strong> <strong>and</strong> <strong>Myakka</strong> rivers. (The locations of these stationsare shown in Fig. 18, below). The SWIM monitoring project began in January 1993 <strong>and</strong>was ended in December 2000, in preparation for a multi-agency monitoring program1
ased on a fundamentally different sampling design that was scheduled to begin during2001.1.2 WATER QUALITY MANAGEMENT ISSUESThe <strong>Peace</strong> <strong>and</strong> <strong>Myakka</strong> <strong>River</strong> basins lie in a naturally fertile area that contains extensivephosphate-bearing geological deposits (the Bone Valley formation of the Hawthorngroup) <strong>and</strong> experiences abundant seasonal rainfall <strong>and</strong> a humid subtropical climate.Phosphate is an important nutrient supporting the growth of terrestrial <strong>and</strong> aquaticorganisms, <strong>and</strong> many lakes <strong>and</strong> streams that drain the Bone Valley region are“eutrophic” (exhibit high rates of biological productivity) as a result of naturally elevatedphosphate inputs (Odum 1953, Canfield <strong>and</strong> Hoyer 1988). These naturally eutrophicwaterbodies have the potential to become hypereutrophic — exhibiting undesirably highlevels of biological productivity — if human activities cause nutrient loads to increase toexcessive levels. Several historically-eutrophic lakes located in the headwaters regionof the <strong>Peace</strong> <strong>River</strong> basin (e.g., Lake Parker, Lake Hancock, Banana Lake) appear tohave shifted to hypereutrophic productivity levels in recent decades as a result ofadditional, manmade nutrient loads.Eutrophication is a process in which increasing nutrient loads cause changes in thewater chemistry <strong>and</strong> ecological structure of surface water bodies (Day et al. 1989).These changes, which are currently affecting many Florida waters, often include:• increasing rates of biological production, <strong>and</strong> increasing biomass of algae orrooted aquatic plants;• increasing deposition of unutilized organic material to the sediment zone (withassociated increases in sediment oxygen dem<strong>and</strong>);• reduced water clarity, due to increased algal densities <strong>and</strong> resuspension ofunconsolidated bottom sediments; <strong>and</strong>• shifts in the composition of plant <strong>and</strong> animal communities, with increasingabundance of species more highly adapted to nutrient-enriched conditionsIn addition to ecological <strong>and</strong> esthetic impacts, excessive nutrient loads can also affecthuman uses of surface waters by increasing the frequency of nuisance algal blooms,causing taste <strong>and</strong> odor problems in potable water sources <strong>and</strong> contributing to oxygenrelatedstress or mortality in economically important fish <strong>and</strong> shellfish species.From a regulatory perspective the Federal <strong>Water</strong> Pollution Control Act (“Clean <strong>Water</strong>Act”), as amended, provides the underlying legal framework for water qualitymanagement throughout the United States. The Clean <strong>Water</strong> Act requires that thechemical, physical <strong>and</strong> biological integrity of the Nation’s waters be maintained at levelsthat provide “fishable <strong>and</strong> swimmable” conditions for all citizens. Regulations developedby the U.S. EPA <strong>and</strong> other agencies to implement the Act have therefore focused on2
maintaining water quality at levels necessary to support viable populations of fish <strong>and</strong>wildlife <strong>and</strong> protect human health.<strong>Water</strong> quality st<strong>and</strong>ards — which include designated uses, numeric <strong>and</strong> narrative waterquality criteria, <strong>and</strong> an anti-degradation policy — have been the primary tools used inthe national management effort. Designated uses, such as potable water supply,shellfish harvesting, wildlife propagation <strong>and</strong> recreational contact, are identified by eachstate through its rulemaking process <strong>and</strong> are established for all waterbodies within astate’s jurisdiction (e.g., Ch. 62-302.400, Florida Administrative Code). <strong>Water</strong> qualitycriteria, which describe the specific water quality conditions needed to achievedesignated uses, are also established by rulemaking at the state level (e.g., Ch. 62-302.530, F.A.C.). Anti-degradation policy, which is implemented through the permittingprocess, holds that all existing uses of a waterbody (including those that may exceedthe designated uses) should also be maintained. If existing water quality is higher thanis strictly necessary to support designated uses, for example, regulatory agencies willseek to maintain that quality unless important economic <strong>and</strong> social goals requireotherwise.In order to prevent or correct water quality degradation caused by manmade nutrientdischarges, state criteria typically include provisions intended to prevent excessiveloads from anthropogenic sources (e.g., stormwater runoff; wastewater discharges frommunicipal, industrial, <strong>and</strong> agricultural facilities). State policies <strong>and</strong> programs alsosupport the restoration of water bodies degraded by historical anthropogenicdischarges. Like many states, however, Florida has not established numerical criteriafor regulating nutrient loads <strong>and</strong> eutrophication, relying instead on a narrative guidelinewhich states that “in no case shall nutrient concentrations of a body of water be alteredso as to cause an imbalance in natural populations of aquatic flora or fauna” (Chap. 62-302.530, F.A.C.).In areas such as the <strong>Peace</strong> <strong>and</strong> <strong>Myakka</strong> <strong>River</strong> basins, where many surface waterbodies receive naturally-elevated phosphorus loads as well as manmade nutrientdischarges from a variety of point <strong>and</strong> nonpoint sources, regular monitoring <strong>and</strong>reporting of water quality conditions are helpful to ensure that watershed stakeholders<strong>and</strong> managers have access to the information needed to assess progress toward theachievement of these state <strong>and</strong> national water quality goals.1.3 REPORT OBJECTIVES AND STRUCTUREThis report provides a summary of water quality conditions, <strong>and</strong> estimated loads <strong>and</strong>yields of selected water quality constituents, at a number of monitoring stations locatedin the non-tidal <strong>and</strong> tidal reaches of <strong>Peace</strong> <strong>and</strong> <strong>Myakka</strong> rivers. The report is organizedas follows:• Sect. 2 <strong>Water</strong> <strong>Quality</strong> at Non-Tidal Stations – summarizes the monthly waterquality monitoring data collected by the multi-agency monitoring program in nontidalportions of both rivers during water years 1998-2001;3
• Sect. 3 Constituent Loads <strong>and</strong> Yields – provides estimates of annual loads(metric tons/year), yields (kg/ha/yr), <strong>and</strong> flow-adjusted loads (kg/L) of selectedwater quality constituents using data collected at the non-tidal monitoring stationsduring water years 1998 – 2001;• Sect. 4 <strong>Water</strong> <strong>Quality</strong> at Tidal Stations – summarizes monthly water qualitydata collected by the District in the tidal reaches of the <strong>Peace</strong> <strong>and</strong> <strong>Myakka</strong> riversduring water years 1994 – 2000.2.0 WATER QUALITY AT NON-TIDAL STATIONS2.1 METHODSIn order to characterize current water quality conditions, monthly monitoring wasconducted at a number of sites in the <strong>Peace</strong> <strong>and</strong> <strong>Myakka</strong> <strong>River</strong> basins during wateryears 1998, 1999, 2000, 2001 (Table 1).The water quality monitoring stations were co-located with long-term USGS streamgaging stations (Fig. 1). At each gaging station the USGS collects continuous recordsof stream stage, makes periodic measurements of stream discharge throughout a rangeof stages, <strong>and</strong> computes an estimate of daily mean stream discharge based on thecontinuous stage records <strong>and</strong> the measured stage-discharge relationship.Co-location of water quality monitoring <strong>and</strong> stream gaging stations is important for atleast three reasons (NRC 1999):• Concentrations of water quality constituents often vary with stream stage, <strong>and</strong>adequate information on both concentration <strong>and</strong> stage is needed to allow thesedynamic relationships to be documented <strong>and</strong> understood;• Records of stream discharge (volume/time) <strong>and</strong> constituent concentrations(mass/volume) are necessary for the calculation of constituent loads (mass/time),which are important indicators of the effectiveness of water quality managementefforts; <strong>and</strong>• <strong>Water</strong>shed management efforts are more likely to succeed if managers have anadequate underst<strong>and</strong>ing of relationships between the quantity <strong>and</strong> quality ofsurface water flows within the watershed, <strong>and</strong> relationships between thesevariables <strong>and</strong> other ecosystem components.Monthly water quality monitoring began in the <strong>Peace</strong> <strong>River</strong> watershed in October 1997,<strong>and</strong> in the <strong>Myakka</strong> <strong>River</strong> basin in October 1998. <strong>Water</strong> samples were collected bySWFWMD field staff over a three-day period during the first week of each month.Stations located in the northern portion of the <strong>Peace</strong> <strong>River</strong> basin were normally sampled4
on the initial day of field work; the remaining stations were sampled over the followingtwo days.<strong>Water</strong> quality parameters monitored included: specific conductance, pH, temperature,dissolved oxygen (DO), total organic carbon (TOC), nitrate+nitrite nitrogen, ammonianitrogen, total ammonia+organic nitrogen (TKN), dissolved ortho-phosphate (PO 4 ), totalphosphorus (TP), chlorophyll a, color (PCU), total suspended solids (TSS), <strong>and</strong> turbidity(NTU).Hydrographic parameters (specific conductance, salinity, pH, temperature, <strong>and</strong> DO)were measured in the field using multi-probe Hydrolab or YSI instruments that werecalibrated at the beginning <strong>and</strong> end of each field day.<strong>Water</strong> samples were collected at a depth of 0.5m at each gaging station <strong>and</strong>transported on ice to the analytical laboratory. Concentrations of dissolved orthophosphatewere determined using samples that were field-filtered, immediately followingcollection, through 0.45 µm membrane filters <strong>and</strong> stored on ice until analysis. Samplesused for chlorophyll analysis were filtered in the laboratory immediately followingsample delivery, using Gellman A/E (1 µm) glass fiber filters, <strong>and</strong> the filters <strong>and</strong>attached algal cells were stored frozen prior to chlorophyll extraction. All sampling,sample preservation <strong>and</strong> transport, <strong>and</strong> chain of custody procedures were performed inaccordance with an EPA-approved quality assurance plan <strong>and</strong> with existing state(FDEP) <strong>and</strong> regional (SWFWMD) quality assurance requirements. Chemical analyseswere performed by three laboratories (SWFWMD, FDEP, <strong>and</strong> EQL, Inc.), using EPAapprovedanalytical methods.Data quality was assessed <strong>and</strong> reported on a quarterly basis by SWFWMD staff (e.g.,CHEC 2000, 2001). The most significant issues involved the accuracy <strong>and</strong> precision ofa number of total nitrogen determinations made by the SWFWMD laboratory, using anew analytical method, during 1999. Data points affected by these QA concerns havebeen omitted from the analyses performed for this report. The greatest impact of theseomissions has been the creation of data gaps in the estimates of TN loads <strong>and</strong> yields(Table 3 <strong>and</strong> Fig. 4) for the 1999 water year.5
Table 1. Stations where monthly water quality monitoring was conducted, by wateryear.Station nameUSGSIDDrainageArea(mi 2 )WY1998WY1999through2001<strong>Peace</strong> Creek Canal near Wahneta 02293987 162 Saddle Creek at Structure P-11 02294491 135 <strong>Peace</strong> <strong>River</strong> at Bartow 02294650 390 <strong>Peace</strong> <strong>River</strong> at Ft. Meade 02294898 480 <strong>Peace</strong> <strong>River</strong> at Zolfo Springs 02295637 826 <strong>Peace</strong> <strong>River</strong> at Arcadia 02296750 1,367 Charlie Creek near Gardner 02296500 330 Joshua Creek at Nocatee 02297100 132 -- Horse Creek near <strong>Myakka</strong> Head 02297155 42 Horse Creek near Arcadia 02297310 218 Shell Creek near Punta Gorda 02298202 373 <strong>Myakka</strong> <strong>River</strong> at <strong>Myakka</strong> City 02298608 125 -- <strong>Myakka</strong> <strong>River</strong> near Sarasota 02298830 229 -- Deer Prairie Slough near North Port a 02299120 -- -- Big Slough Canal near <strong>Myakka</strong> City 02299410 36.5 -- Big Slough Canal near North Port b 02299455 86.2 -- a Lack of drainage area information prevented calculation of constituent yield estimates forthis stationb Incomplete discharge records prevented calculation of loading estimates for this station6
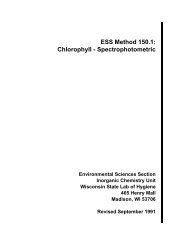
Figure 1. Locations of USGS gaging stations used as non-tidal monitoring sites during water years 1998-2001 (see Table 1).7
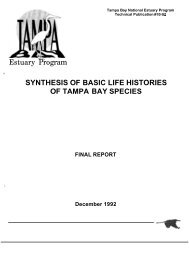
2.2 RAINFALL AND STREAMFLOWThe amount of rain that falls on a watershed in a given year can have important effectson streamflow <strong>and</strong> water quality. In the <strong>Peace</strong> <strong>and</strong> <strong>Myakka</strong> <strong>River</strong> watersheds, annualrainfall <strong>and</strong> streamflow levels varied dramatically during water years 1998-2001. Totalannual rainfall <strong>and</strong> average annual streamflow at three monitoring stations are shown inFig. 2.A strong El Niño event occurred during the 1998 water year, <strong>and</strong> total annual rainfall inthat year was substantially higher than the long-term (1950–2001) mean value at eachstation. Annual mean streamflows were also quite high during the 1998 water year,exceeding 200% of the long-term (1950-2001) values at each station (Fig. 2).Rainfall returned to near-average or below-average levels in water years 1999-2001,<strong>and</strong> annual mean streamflow declined in response to the lower rainfall (Fig. 2). Annualstreamflow at the <strong>Peace</strong> <strong>River</strong>-Bartow station remained far below its long-term me<strong>and</strong>uring water years 1999-2001, falling to less than 25% of its long-term value in 2001.Annual flows at the other stations — the <strong>Peace</strong> <strong>River</strong> at Arcadia <strong>and</strong> <strong>Myakka</strong> <strong>River</strong> nearSarasota — fell to between 30% <strong>and</strong> 60% of their long-term means during water year2000, but rebounded in 2001 to levels near or above the long-term means.8
ANNUAL RAINFALLANNUAL STREAMFLOW% OF LONG-TERM MEAN300%200%100%0%<strong>Peace</strong> <strong>River</strong> at Bartow1998 1999 2000 2001% OF LONG-TERM MEAN300%200%100%0%<strong>Peace</strong> <strong>River</strong> at Arcadia1998 1999 2000 2001% OF LONG-TERM MEAN300%200%100%0%<strong>Myakka</strong> <strong>River</strong> near Sarasota1998 1999 2000 2001Fig. 2. Annual rainfall <strong>and</strong> stream discharge at three monitoring locationsin the <strong>Peace</strong> <strong>and</strong> <strong>Myakka</strong> <strong>River</strong> watersheds9
2.3 CONSTITUENT CONCENTRATIONS AND WATER QUALITY INDEX (WQI) VALUESConcentrations of major water quality constituents observed during water years 1998 -2001 are listed in Appendix A. In comparison to median values observed in a largesample of Florida streams (H<strong>and</strong> et al. 1994), concentrations of several constituentsappeared elevated at a number of the <strong>Peace</strong> <strong>and</strong> <strong>Myakka</strong> <strong>River</strong> stations. Theseparameters included:• phosphorus forms• nitrogen forms• total organic carbon• turbidity• TSS• color• chlorophyll-a.The State of Florida has developed a stream water quality index (WQI) — based onobserved concentrations of nutrients, water clarity, DO, <strong>and</strong> oxygen dem<strong>and</strong>ingsubstances — that is helpful for summarizing water quality monitoring data (H<strong>and</strong> et al.1994, 1996). Sampling data collected in 1987 from 2,000 Florida stream reaches wereused to determine percentile distributions for each indicator on a statewide basis (H<strong>and</strong>et al. 1994, 1996). Index scores are calculated based on these percentile distributions.For example, a site exhibiting an average TN concentration of 1.2 mg N/L (the medianvalue observed in the 1987 data set) would receive an index score of 50 for thatindicator. Scores are averaged across indicator categories to obtain an average WQIvalue per site (H<strong>and</strong> et al. 1994, 1996). State guidelines suggest that average indexvalues of 0-44 indicate “good,” 45-60 indicate “fair,” <strong>and</strong> >60 indicate “poor” waterquality conditions in Florida streams.H<strong>and</strong> et al. (1996) provides the following summary of the WQI:“The Florida <strong>Water</strong> <strong>Quality</strong> Index has several advantages over previousmeasures. First, since it is based on the percentile distribution of Floridastream data, it is tailored to Florida. Second, the index uses the mostimportant measures of water quality in Florida: clarity, dissolved oxygen,oxygen-dem<strong>and</strong>ing substances, nutrients, bacteria, <strong>and</strong> biologicaldiversity. Third, it is simple to underst<strong>and</strong> <strong>and</strong> calculate <strong>and</strong> does notrequire a mainframe computer or any complex data transformations oraveraging schemes. Finally, the index nicely identifies areas of good, fair,<strong>and</strong> poor water quality that correspond to professional <strong>and</strong> public opinion.”An application of the WQI to the water year 1998 - 2001 <strong>Peace</strong> <strong>and</strong> <strong>Myakka</strong> <strong>River</strong>sampling data is shown in Table 2. (In recognition of the naturally-elevated phosphateconcentrations that can occur in these basins, TP concentrations were omitted from theaverage WQI values shown in Table 2.)10
For this study, annual average WQI values were calculated using five parameters(turbidity, total suspended solids, total organic carbon, nitrate+nitrite nitrogen, <strong>and</strong> totalnitrogen). A total of 58 annual average WQI values were calculated for the 16 stationssampled during water years 1998 - 2001 (Table 2).The Saddle Creek at Structure P-11 station, which is located immediately downstreamfrom Lake Hancock in the upper <strong>Peace</strong> <strong>River</strong> basin, exhibited the poorest water qualityamong the sites sampled, falling in the 75th to 95th percentiles of Florida streams formost parameters in each year of monitoring (Table 2).Other sites at which “poor” water quality conditions were observed included:• <strong>Peace</strong> Creek Canal near Wahneta (in water years 1998 <strong>and</strong> 1999),• <strong>Peace</strong> <strong>River</strong> at Bartow (1998, 1999)• <strong>Peace</strong> <strong>River</strong> at Ft. Meade (1998)• <strong>Peace</strong> <strong>River</strong> at Zolfo Springs (1998)• <strong>Peace</strong> <strong>River</strong> at Arcadia (1998)• Big Slough Canal near <strong>Myakka</strong> City (2000).Two sites exhibited consistently “good” water quality based on the WQI:• Shell Creek near Punta Gorda (1998-2001)• <strong>Myakka</strong> <strong>River</strong> at <strong>Myakka</strong> City (1999-2001).“Good” water quality conditions were also found during one or more years at thefollowing stations:• <strong>Myakka</strong> <strong>River</strong> near Sarasota (1999, 2000)• Deer Prairie Slough near North Port (1999)• <strong>Peace</strong> <strong>River</strong> at Ft. Meade (2000)• <strong>Peace</strong> <strong>River</strong> at Arcadia (2000)• Charlie Creek near Gardner (2000)• Horse Creek near <strong>Myakka</strong> Head (1999)• Horse Creek near Arcadia (1999).The remaining stations <strong>and</strong> years would be characterized as “fair” based on the WQI.2.4 EXCEEDANCES OF STATE WATER QUALITY STANDARDSAlthough WQI values are helpful in providing an easily-underst<strong>and</strong>able summary ofgeneral water quality conditions, they are calculated using a limited number ofparameters <strong>and</strong> must be interpreted with care. A more detailed examination ofmonitoring data, focusing on additional parameters, can also be helpful to identify waterquality issues that may go unnoticed in an analysis based on WQI values alone.The State of Florida has adopted water quality st<strong>and</strong>ards (summarized in Ch. 62-302,Florida Administrative Code) for a number of water quality constituents, in order tomaintain productive populations of fish <strong>and</strong> wildlife <strong>and</strong> protect human health. In somecases these st<strong>and</strong>ards may be exceeded due to natural factors, <strong>and</strong> exceedances of11
this type should not be interpreted as evidence of degraded water quality. In manycases, however, exceedances of state st<strong>and</strong>ards can be linked to specific pollutantdischarges or other human activities that are causing negative water quality impacts.Information on the frequency <strong>and</strong> magnitude of exceedances can thus be helpful inidentifying sites where water quality may be declining or degraded. Once such sites areidentified, more detailed follow-up studies can be designed <strong>and</strong> implemented to identifythe cause(s) of the observed exceedances.Specific ConductanceSpecific conductance measures the ability of a water sample to carry an electric current,which depends on the presence of ions in the sample, their total concentration, <strong>and</strong>other physical <strong>and</strong> chemical characteristics. Freshly distilled water has a conductivity ofbetween 0.5 <strong>and</strong> 2 µmhos/cm. The Florida st<strong>and</strong>ard for specific conductance in freshsurface waters is 1,275 µmhos/cm, a level set to protect native fish <strong>and</strong> other aquaticorganisms.Exceedances of this st<strong>and</strong>ard were observed at four stations during water years 1998-2001:• Joshua Creek at Nocatee (during 1999, 2000 <strong>and</strong> 2001)• Shell Creek near Punta Gorda (during 2001)• Big Slough Canal near <strong>Myakka</strong> City (during 1999)• Big Slough Canal near North Port (during 1999).In Florida the presence of elevated specific conductance levels in fresh surface watersoften indicate that substantial discharges of groundwater — from the Intermediate orFloridan aquifers — are occurring at locations upstream of the sampling point.Agricultural <strong>and</strong> industrial operations are the most common sources of such discharges.Un-Ionized AmmoniaThe un-ionized form of ammonia is highly toxic to fish <strong>and</strong> other aquatic organisms. Inwater, ionized (NH 4 + ) <strong>and</strong> un-ionized (NH 3 ) ammonia exist together in equilibrium, withthe un-ionized form becoming more common at higher temperature <strong>and</strong> pH levels.The Florida water quality st<strong>and</strong>ard for un-ionized ammonia is 0.02 mg NH 3 /L. Levelsexceeding the st<strong>and</strong>ard were observed at two stations during water years 1998 – 2001:• Saddle Creek at Structure P-11 (in water years 2000 <strong>and</strong> 2001)• Horse Creek near <strong>Myakka</strong> Head (2000).Levels of un-ionized ammonia that were relatively high (>0.01 mg NH 3 /L) but did notexceed the water quality st<strong>and</strong>ard were also observed at several other stations,including:• <strong>Peace</strong> <strong>River</strong> at Zolfo Springs (2000, 2001)• Shell Creek near Punta Gorda (2001)• <strong>Myakka</strong> <strong>River</strong> at <strong>Myakka</strong> City (1999)12
• Big Slough Canal near <strong>Myakka</strong> City (1999)• Big Slough Canal near North Port (1999).The ammonia nitrogen found in rivers <strong>and</strong> streams can come from a variety of natural<strong>and</strong> manmade sources. Exceedances of the un-ionized ammonia water qualityst<strong>and</strong>ard are often associated with anthropogenic activities, such as feedlots <strong>and</strong> otherconcentrated animal feeding operations, sewage treatment systems <strong>and</strong> industrialfacilities that make or use ammonia-based chemical products.Dissolved OxygenDissolved oxygen (DO) is a critical water quality parameter, due to the importance ofDO to the metabolic processes of all multi-celled aquatic organisms.DO concentrations are affected by a number of natural <strong>and</strong> man-made factors.Important natural factors include daily <strong>and</strong> seasonal temperature cycles (because thesolubility of oxygen in water is higher at lower water temperatures), photosynthesis(because photosynthesizing organisms release DO into the water column, increasing itsavailability) <strong>and</strong> respiration/decomposition processes (which cause DO concentrationsin the water column to decline).The primary manmade influences include the discharge of nutrients <strong>and</strong> organic wastesinto waterbodies, which can lead to increased eutrophication, higher rates ofphotosynthesis, respiration <strong>and</strong> decomposition, <strong>and</strong> larger daily <strong>and</strong> seasonalfluctuations in DO concentrations.The Florida st<strong>and</strong>ard for DO in fresh surface waters is 5 mgL/. Concentrations below 4mg/L are known to be stressful for most fish <strong>and</strong> many shellfish species.Concentrations below 2 mg/L are highly stressful <strong>and</strong> potentially lethal.During water years 1998 through 2001, DO concentrations below the 5 mg/L st<strong>and</strong>ardwere observed at least once at each station. Many of these instances were probablyassociated with natural factors, such as elevated water temperature. At severalstations, however, low DO levels were a frequent occurrence, observed on 25% or moreof the sampling dates. And for some stations the median annual DO concentration (thevalue measured on at least half the sampling dates in a given year) was less than the 5mg/L st<strong>and</strong>ard. The latter group of stations included:• <strong>Peace</strong> Creek Canal near Wahneta (water years 1998, 1999, 2000, <strong>and</strong> 2001)• Saddle Creek at Structure P-11 (1999, 2001)• <strong>Peace</strong> <strong>River</strong> at Bartow (1998, 1999, 2000, 2001)• Shell Creek near Punta Gorda (1998)• Deer Prairie Slough near North Port (2000, 2001)• Big Slough Canal near North Port (2001).The frequent periods of low DO availability occurring at these stations presumably hadnegative impacts on local populations of fish <strong>and</strong> other aquatic organisms.13
Chlorophyll-aChlorophyll-a concentrations, which are used to estimate the biomass of algae in thewater column, are among the best indicators of a waterbody’s trophic state. Annualmean chlorophyll-a concentrations in Florida streams are usually at or below 5.5 µg/L.FDEP considers stream water quality to be “impaired” if the annual mean is above 20µg/L.Annual mean chlorophyll-a concentrations greater than 20 µg/L were observed at twostations during the 1998-2001 water years:• Saddle Creek at Structure P-11 (all years)• <strong>Peace</strong> <strong>River</strong> at Bartow (1998, 1999).The elevated concentrations at these stations were apparently caused by dischargesfrom Lake Hancock, a hypereutrophic lake that experiences chronic, year-round bloomsof algae <strong>and</strong> cyanobacteria.Individual observations of chlorophyll-a concentrations greater than 20 µg/L, whichindicated the presence of occasional algal blooms but did not represent a violation ofstate water quality st<strong>and</strong>ards, were observed at a number of additional stations:• <strong>Peace</strong> Creek Canal near Wahneta (1999)• <strong>Peace</strong> <strong>River</strong> at Fort Meade (1998, 1999, 2000)• <strong>Peace</strong> <strong>River</strong> at Zolfo Springs (1998, 1999, 2000)• <strong>Peace</strong> <strong>River</strong> at Arcadia (1998)• Horse Creek near <strong>Myakka</strong> Head (2000)• Horse Creek near Arcadia (1998)• <strong>Myakka</strong> <strong>River</strong> near Sarasota (1999, 2000, 2001).14
Table 2. Annual WQI values for non-tidal stations, water years 1998 – 2001.<strong>Peace</strong> Creek Canal near Wahneta (USGS gage no. 02293987) .<strong>Water</strong>YearTSS Turbidity TOC NO 2+3 TPMeanWQI(w/out TP)<strong>Water</strong> <strong>Quality</strong>Characterization1998 39 54 71 80 73 61 “poor”1999 53 59 73 82 80 67 “poor”2000 55 33 70 72 81 57 “fair”2001 48 36 78 76 81 60 “fair”Saddle Creek at Structure P-11 (USGS gage no. 02294491).<strong>Water</strong>Year TSS Turbidity TOC NO 2+3 TPMeanWQI(w/out TP)<strong>Water</strong> <strong>Quality</strong>Characterization1998 >90 >90 69 12 79 68 “poor”1999 >90 >90 83 26 71 75 “poor”2000 >90 >90 75 12 84 69 “poor”2001 >90 >90 39 24 >90 77 “poor”15
<strong>Peace</strong> <strong>River</strong> at Bartow (USGS gage no. 02294650).<strong>Water</strong>YearTSS Turbidity TOC NO 2+3 TPMeanWQI(w/out TP)<strong>Water</strong> <strong>Quality</strong>Characterization1998 80 72 62 71 86 71 “poor”1999 86 75 72 80 >90 78 “poor”2000 47 19 67 62 83 49 “fair”2001 30 24 72 73 >90 50 “fair”<strong>Peace</strong> <strong>River</strong> at Ft. Meade (USGS gage no. 02294898).<strong>Water</strong>YearTSS Turbidity TOC NO 2+3 TPMeanWQI(w/out TP)<strong>Water</strong> <strong>Quality</strong>Characterization1998 77 67 54 81 >90 70 “poor”1999 51 52 53 85 89 60 “fair”2000 39 5 37 85 90 42 “good”2001 32 13 43 >90 88 46 “fair”16
<strong>Peace</strong> <strong>River</strong> at Zolfo Springs (USGS gage no. 02295637).<strong>Water</strong>YearTSS Turbidity TOC NO 2+3 TPMeanWQI(w/out TP)<strong>Water</strong> <strong>Quality</strong>Characterization1998 59 55 54 88 >90 64 “poor”1999 40 43 53 >90 >90 58 “fair”2000 25 44 48 >90 >90 53 “fair”2001 33 15 57 >90 >90 50 “fair”<strong>Peace</strong> <strong>River</strong> at Arcadia (USGS gage no. 02296750).<strong>Water</strong>YearTSS Turbidity TOC NO 2+3 TPMeanWQI(w/out TP)<strong>Water</strong> <strong>Quality</strong>Characterization1998 54 52 54 89 >90 62 “poor”1999 43 39 56 90 90 57 “fair”2000 5 5 51 85 >90 36 “good”2001 5 -- 61 >90 >90 54 “fair”17
Joshua Creek at Nocatee (USGS gage no. 02297100).<strong>Water</strong>YearTSS Turbidity TOC NO 2+3 TPMeanWQI(w/out TP)<strong>Water</strong> <strong>Quality</strong>Characterization1998 -- -- -- -- -- -- --1999 14 20 59 >90 50 47 “fair”2000 41 14 46 >90 57 49 “fair”2001 47 15 55 >90 63 53 “fair”Charlie Creek near Gardner (USGS gage no. 02296500).<strong>Water</strong>YearTSS Turbidity TOC NO 2+3 TPMeanWQI(w/out TP)<strong>Water</strong> <strong>Quality</strong>Characterization1998 28 39 74 80 84 55 “fair”1999 24 18 70 70 82 45 “fair”2000 5 5 69 79 82 39 “good”2001 5 -- 72 >90 82 57 “fair”18
Horse Creek near <strong>Myakka</strong> Head (USGS gage no. 02297155).<strong>Water</strong>YearTSS Turbidity TOC NO 2+3 TPMeanWQI(w/out TP)<strong>Water</strong> <strong>Quality</strong>Characterization1998 12 16 68 49 77 45 “fair”1999 11 16 61 36 80 31 “good”2000 59 20 54 73 84 52 “fair”2001 14 16 70 86 84 47 “fair”Horse Creek near Arcadia (USGS gage no. 02297310).<strong>Water</strong>YearTSS Turbidity TOC NO 2+3 TPMeanWQI(w/out TP)<strong>Water</strong> <strong>Quality</strong>Characterization1998 16 20 63 84 81 46 “fair”1999 5 12 58 84 77 38 “good”2000 32 16 55 >90 83 49 “fair”2001 38 11 60 >90 79 51 “fair”19
Shell Creek near Punta Gorda (USGS gage no. 02298202).<strong>Water</strong>YearTSS Turbidity TOC NO 2+3 TPMeanWQI(w/out TP)<strong>Water</strong> <strong>Quality</strong>Characterization1998 18 18 56 47 62 35 “good”1999 14 13 -- 45 57 24 “good”2000 19 5 62 22 53 27 “good”2001 38 12 55 42 59 37 “good”<strong>Myakka</strong> <strong>River</strong> at <strong>Myakka</strong> City (USGS gage no. 02298608).<strong>Water</strong>YearTSS Turbidity TOC NO 2+3 TPMeanWQI(w/out TP)<strong>Water</strong> <strong>Quality</strong>Characterization1998 -- -- -- -- -- -- --1999 5 14 69 35 75 31 “good”2000 30 12 60 43 69 36 “good”2001 69 17 19 22 71 43 “good”20
<strong>Myakka</strong> <strong>River</strong> near Sarasota (USGS gage no. 02298830).<strong>Water</strong>YearTSS Turbidity TOC NO 2+3 TPMeanWQI(w/out TP)<strong>Water</strong> <strong>Quality</strong>Characterization1998 -- -- -- -- -- -- --1999 5 13 73 12 77 26 “good”2000 38 18 70 16 77 36 “good”2001 55 51 70 56 76 58 “fair”Deer Prairie Slough near North Port (USGS gage no. 02299120).<strong>Water</strong>YearTSS Turbidity TOC NO 2+3 TPMeanWQI(w/out TP)<strong>Water</strong> <strong>Quality</strong>Characterization1998 -- -- -- -- -- -- --1999 25 57 72 19 73 43 “good”2000 71 53 72 20 86 54 “fair”2001 60 58 63 26 81 52 “fair”21
Big Slough Canal near <strong>Myakka</strong> City (USGS gage no. 02299410).<strong>Water</strong>YearTSS Turbidity TOC NO 2+3 TPMeanWQI(w/out TP)<strong>Water</strong> <strong>Quality</strong>Characterization1998 -- -- -- -- -- -- --1999 51 55 70 64 74 60 “fair”2000 72 58 62 78 78 67 “poor”2001 50 21 68 73 76 53 “fair”Big Slough Canal near North Port (USGS gage no. 02299455).<strong>Water</strong>YearTSS Turbidity TOC NO 2+3 TPMeanWQI(w/out TP)<strong>Water</strong> <strong>Quality</strong>Characterization1998 -- -- -- -- -- -- --1999 34 42 67 42 74 46 “fair”2000 49 24 64 65 72 50 “fair”2001 48 23 56 61 71 47 “fair”22
3.0 CONSTITUENT LOADS AND YIELDSEstimation of loads <strong>and</strong> yields of water <strong>and</strong> water quality constituents is a basiccomponent of most watershed assessment programs. ‘Load’ represents the mass of aconstituent (e.g., tons of nitrogen) passing a given point in a stream during a specifiedtime interval (e.g., month, day or year). The ‘yield’ of a constituent is the load divided bythe surface area of the contributing drainage basin, allowing loads produced by basinsof different size to be compared on a consistent, per-unit-area basis.3.1 ANNUAL LOADSLoading rates are estimated by measuring streamflow <strong>and</strong> constituent concentrations atthe locations of interest, <strong>and</strong> computing load as the product of the flow <strong>and</strong>concentration values. Due to cost constraints, however, flow <strong>and</strong> concentrationmeasurements are often collected at very different frequencies. In many monitoringstudies, flows are measured continuously while constituent concentrations aremeasured less frequently <strong>and</strong> at discrete time intervals (e.g., biweekly or monthly). Thedifferent frequency of collection of flow <strong>and</strong> concentration values introduces significantcomplications into the load estimation problem.Three general types of estimators have been proposed to address these complications(Preston et al. 1989):• Averaging estimators use averages or other values to represent constituentconcentrations on days when sampling was not performed, producing a synthetictime series of concentration values that can be used when computing estimateddaily, weekly, monthly <strong>and</strong> annual loads. This is the simplest method, but issubjective <strong>and</strong> based on a number of implicit assumptions which, if violated, maylead to estimation bias;• Regression estimators typically use log-log regression to describe therelationship between constituent concentration <strong>and</strong> flow. The regressionequation is then used to create a synthetic time series of estimated concentrationvalues, based on measured flows. This approach works best for constituentswhose concentrations are highly correlated with flow.• Ratio estimators are derived from survey sampling statistics, <strong>and</strong> use themeasured flow values as an ‘auxiliary variable’ <strong>and</strong> load as the dependentvariable. The ratio estimator is a ‘best linear unbiased estimator’ (Cochran 1977)if two conditions are met:o the relationship between load <strong>and</strong> flow is a straight line through the origin;<strong>and</strong>o the variance of the load values is an increasing function of flow.After examining flow <strong>and</strong> concentration records from the 1998 – 2001 <strong>Peace</strong>-<strong>Myakka</strong>monitoring program, the ratio estimator approach was chosen to estimate constituent23
loads for this period. The averaging approach, although simple <strong>and</strong> flexible, issubjective <strong>and</strong> prone to bias. The regression approach does not appear applicable tothis data set, because concentrations of most constituents do not show strongrelationships with flow. The two primary assumptions of the ratio estimator — that ascatterplot of load vs. flow approximates a straight line through the origin, whosevariance increases with increasing flow — appear reasonable for most constituentsincluded in the monitoring program. Also, in comparison to the other methods, ratioestimators are considered to be more robust to sources of potential estimation bias(Preston et al. 1989).As a working rule, ratio estimators are best applied in cases where the sample size isgreater than 30 for each time period of interest (Cochran 1977). For typical watershedassessment applications this implies that, for best accuracy <strong>and</strong> precision in theestimation of constituent loads <strong>and</strong> yields, a minimum of 30 water quality samplesshould be collected during each time period (e.g., year) for which loading estimates willbe calculated.Using the ratio estimator described by Cochran (1977) <strong>and</strong> Preston et al. (1989), annualloads of selected water quality constituents (nitrogen forms, phosphorus forms, <strong>and</strong>TSS) were calculated at each monitoring station for water years 1998 through <strong>2002</strong>.The estimator takes the form:)L = ( l / q)Qwhere:L )lqQis the estimated annual loadis the average load on days when both discharge <strong>and</strong> concentration weremeasuredis the average discharge on days when both flow <strong>and</strong> concentration weremeasuredis total annual discharge.Estimated annual loads of TN, DIN, NH 4 -N , NO 2+3 -N, TP, PO 4 -P, <strong>and</strong> TSS calculatedusing this method are shown in Tables 3-9.24
Table 3. Estimated annual TN loads (metric tons/year), water years 1998 – 2001.Station nameUSGS IDWY1998Estimated Annual Load (metric tons)WYWY19992000WY2001<strong>Peace</strong> Creek Canal near Wahneta 02293987 253.5 -- 63.1 38.0Saddle Creek at Structure P-11 02294491 586.4 -- 0.3 1.3<strong>Peace</strong> <strong>River</strong> at Bartow 02294650 785.6 -- 56.5 37.5<strong>Peace</strong> <strong>River</strong> at Ft. Meade 02294898 932.2 -- 59.2 29.9<strong>Peace</strong> <strong>River</strong> at Zolfo Springs 02295637 1,343.3 -- 165.8 464.2Charlie Creek near Gardner 02296500 437.1 249.9 48.9 255.7<strong>Peace</strong> <strong>River</strong> at Arcadia 02296750 1,923.5 790.1 266.1 1,023.3Joshua Creek at Nocatee 02297100 -- -- 68.6 352.8Horse Creek near <strong>Myakka</strong> Head 02297155 27.3 -- 2.0 32.5Horse Creek near Arcadia 02297310 264.6 -- 23.7 439.6Shell Creek near Punta Gorda 02298202 487.8 406.2 172.9 944.7<strong>Myakka</strong> <strong>River</strong> at <strong>Myakka</strong> City 02298608 -- -- 44.3 236.9<strong>Myakka</strong> <strong>River</strong> near Sarasota 02298830 -- -- 111.0 359.6Deer Prairie Slough near North Port 02299120 -- -- 51.1 53.0Big Slough Canal near <strong>Myakka</strong> City 02299410 -- -- 45.7 98.425
Table 4. Estimated annual DIN loads (metric tons N/year), water years 1998 – 2001.Station nameUSGS IDWY1998Estimated Annual Load (metric tons)WYWY19992000WY2001<strong>Peace</strong> Creek Canal near Wahneta 02293987 30.5 9.6 10.9 4.8Saddle Creek at Structure P-11 02294491 5.1 1.6 1.1 0.1<strong>Peace</strong> <strong>River</strong> at Bartow 02294650 74.5 17.1 8.1 6.0<strong>Peace</strong> <strong>River</strong> at Ft. Meade 02294898 174.5 25.9 13.4 6.6<strong>Peace</strong> <strong>River</strong> at Zolfo Springs 02295637 388.6 115.4 87.4 153.4Charlie Creek near Gardner 02296500 95.2 45.4 10.2 65.2<strong>Peace</strong> <strong>River</strong> at Arcadia 02296750 647.5 240.3 111.4 347.2Joshua Creek at Nocatee 02297100 -- 63.0 40.6 185.2Horse Creek near <strong>Myakka</strong> Head 02297155 2.3 0.8 0.4 2.9Horse Creek near Arcadia 02297310 62.8 13.7 8.0 56.2Shell Creek near Punta Gorda 02298202 57.7 39.7 18.6 81.8<strong>Myakka</strong> <strong>River</strong> at <strong>Myakka</strong> City 02298608 -- 12.3 21.8 12.5<strong>Myakka</strong> <strong>River</strong> near Sarasota 02298830 -- 8.4 10.2 37.0Deer Prairie Slough near North Port 02299120 -- 1.1 1.9 2.6Big Slough Canal near <strong>Myakka</strong> City 02299410 -- 4.7 15.2 13.826
Table 5. Estimated annual NO 2+3 -N loads (metric tons N/year), water years 1998 – 2001.Station nameUSGS IDWY1998Estimated Annual Load (metric tons)WYWY19992000WY2001<strong>Peace</strong> Creek Canal near Wahneta 02293987 21.3 7.4 7.6 3.4Saddle Creek at Structure P-11 02294491 2.7 0.7 0.6
Table 6. Estimated annual NH 4 -N loads (metric tons N/year), water years 1998 – 2001.Station nameUSGS IDWY1998Estimated Annual Load (metric tons)WYWY19992000WY2001<strong>Peace</strong> Creek Canal near Wahneta 02293987 9.1 2.3 3.3 1.4Saddle Creek at Structure P-11 02294491 2.4 0.9 0.5
Table 7. Estimated annual TP loads (metric tons P/year), water years 1998 – 2001.Station nameUSGS IDWY1998Estimated Annual Load (metric tons)WYWY19992000WY2001<strong>Peace</strong> Creek Canal near Wahneta 02293987 30.4 13.6 10.9 7.4Saddle Creek at Structure P-11 02294491 93.3 15.9 1.9 2.5<strong>Peace</strong> <strong>River</strong> at Bartow 02294650 174.2 66.5 17.0 22.9<strong>Peace</strong> <strong>River</strong> at Ft. Meade 02294898 540.0 148.5 54.0 20.4<strong>Peace</strong> <strong>River</strong> at Zolfo Springs 02295637 802.4 346.4 142.9 241.4Charlie Creek near Gardner 02296500 159.3 91.5 13.9 81.0<strong>Peace</strong> <strong>River</strong> at Arcadia 02296750 1,072.8 506.9 134.8 479.1Joshua Creek at Nocatee 02297100 -- 16.6 6.9 26.3Horse Creek near <strong>Myakka</strong> Head 02297155 7.8 4.6 1.8 11.8Horse Creek near Arcadia 02297310 107.6 41.0 8.1 101.0Shell Creek near Punta Gorda 02298202 59.7 64.1 18.1 147.6<strong>Myakka</strong> <strong>River</strong> at <strong>Myakka</strong> City 02298608 -- 41.8 45.4 85.0<strong>Myakka</strong> <strong>River</strong> near Sarasota 02298830 -- 99.1 50.8 150.3Deer Prairie Slough near North Port 02299120 -- 1.7 5.6 6.0Big Slough Canal near <strong>Myakka</strong> City 02299410 -- 5.5 9.6 29.429
Table 8. Estimated annual PO 4 -P loads (metric tons P/year), water years 1998 – 2001.Station nameUSGS IDWY1998Estimated Annual Load (metric tons)WYWY19992000WY2001<strong>Peace</strong> Creek Canal near Wahneta 02293987 18.7 10.5 6.8 6.2Saddle Creek at Structure P-11 02294491 26.8 5.0 0.1 0.3<strong>Peace</strong> <strong>River</strong> at Bartow 02294650 84.4 38.7 11.9 20.9<strong>Peace</strong> <strong>River</strong> at Ft. Meade 02294898 361.2 115.7 44.5 17.5<strong>Peace</strong> <strong>River</strong> at Zolfo Springs 02295637 616.8 284.5 122.0 194.7Charlie Creek near Gardner 02296500 146.6 75.0 10.2 63.9<strong>Peace</strong> <strong>River</strong> at Arcadia 02296750 857.9 490.3 114.1 346.8Joshua Creek at Nocatee 02297100 -- 13.1 4.7 21.6Horse Creek near <strong>Myakka</strong> Head 02297155 6.8 4.0 1.5 9.0Horse Creek near Arcadia 02297310 95.8 33.0 7.0 81.7Shell Creek near Punta Gorda 02298202 36.0 50.0 12.1 108.4<strong>Myakka</strong> <strong>River</strong> at <strong>Myakka</strong> City 02298608 -- 39.1 39.9 76.3<strong>Myakka</strong> <strong>River</strong> near Sarasota 02298830 -- 85.5 44.0 132.5Deer Prairie Slough near North Port 02299120 -- 1.1 4.2 4.9Big Slough Canal near <strong>Myakka</strong> City 02299410 -- 4.0 7.3 23.630
Table 9. Estimated annual TSS loads (metric tons/year), water years 1998 – 2001.Station nameUSGS IDWY1998Estimated Annual Load (metric tons)WYWY19992000WY2001<strong>Peace</strong> Creek Canal near Wahneta 02293987 465.4 217.7 392.4 125.0Saddle Creek at Structure P-11 02294491 7,998.4 2,193.1 2,229.8 60.4<strong>Peace</strong> <strong>River</strong> at Bartow 02294650 7,062.1 3,792.5 1,523.6 99.6<strong>Peace</strong> <strong>River</strong> at Ft. Meade 02294898 6,627.8 1,739.2 807.1 126.2<strong>Peace</strong> <strong>River</strong> at Zolfo Springs 02295637 6,374.2 2,285.4 1,491.7 2,268.4Charlie Creek near Gardner 02296500 1,630.4 862.6 145.1 556.1<strong>Peace</strong> <strong>River</strong> at Arcadia 02296750 7,838.4 3,489.9 1,083.2 2,668.1Joshua Creek at Nocatee 02297100 -- 351.3 208.5 996.3Horse Creek near <strong>Myakka</strong> Head 02297155 81.5 51.7 29.2 66.2Horse Creek near Arcadia 02297310 1,126.8 150.2 55.5 1,457.6Shell Creek near Punta Gorda 02298202 1,049.2 964.9 255.4 9,285.4<strong>Myakka</strong> <strong>River</strong> at <strong>Myakka</strong> City 02298608 -- 78.5 398.0 3,170.0<strong>Myakka</strong> <strong>River</strong> near Sarasota 02298830 -- 316.9 171.5 1,525.4Deer Prairie Slough near North Port 02299120 -- 91.6 99.2 312.8Big Slough Canal near <strong>Myakka</strong> City 02299410 -- 69.5 202.4 496.131
3.2 ANNUAL YIELDSEstimated annual yields (in kilograms per hectare per year) were calculated by dividingthe estimated annual loads by the surface area of the gaged sub-basins. Spatial <strong>and</strong>temporal patterns in the estimated yields during water years 1998 – 2001 aresummarized in Figs. 4-10.The highest water yields were observed in the <strong>Myakka</strong> <strong>River</strong> watershed during the 1998water year (Fig. 4), as a result of the high rainfall <strong>and</strong> runoff associated with the El Niñoweather pattern that occurred in that year. At most stations in both watersheds, wateryields showed progressive declines in water years 1999 <strong>and</strong> 2000 in response to lowerrainfall levels, <strong>and</strong> then rebounded somewhat in 2001. Yields at three stations in theupper <strong>Peace</strong> <strong>River</strong> watershed (Saddle Creek at Structure P-11, <strong>Peace</strong> <strong>River</strong> at Bartow,<strong>and</strong> <strong>Peace</strong> <strong>River</strong> at Fort Meade) followed a somewhat different pattern, showing acontinuing decline through water years 1999, 2000 <strong>and</strong> 2001 (Fig. 4).The highest estimated TN yields were observed at the Saddle Creek station during the1998 water year, <strong>and</strong> at the Joshua Creek, Shell Creek <strong>and</strong> Big Slough-<strong>Myakka</strong> Citystations during water year 2001 (Fig. 5). (It is likely that high yields occurred at everystation during the 1998 El Niño event, but monthly water quality sampling was notconducted at many sites in that year.)Relatively high estimated yields of DIN <strong>and</strong> NO 2+3 -N — greater than 1 kg N/ha/yr —occurred at the Joshua Creek site in all years (Fig. 6). A visible spike occurred at thissite in water year 2001, when DIN <strong>and</strong> NO 2+3 -N yields exceeded 5 kg N/ha/yr. Otherstations with estimated yields greater than 1 kg N/ha/yr included:• <strong>Peace</strong> <strong>River</strong> at Zolfo Springs (1998)• <strong>Peace</strong> <strong>River</strong> at Arcadia (1998)• Big Slough Canal near <strong>Myakka</strong> City (2000, 2001)• <strong>Peace</strong> <strong>River</strong> at Fort Meade (1998).Interestingly, estimated DIN yields at the Saddle Creek gage were low relative to othersites in the <strong>Peace</strong> <strong>River</strong> basin. Concentrations of inorganic N were frequently belowdetection limits at the Saddle Creek gage, suggesting that the abundant phytoplanktonpopulations in Lake Hancock had effectively stripped much of the inorganic N from thewater column <strong>and</strong> converted it to organic forms. (Nitrogen fixation by cyanobacteria inLake Hancock may also provide a significant proportion of the organic N measured atthe Saddle Creek gage.)Substantial increases in the estimated yields of DIN (<strong>and</strong> PO 4 -P) occurred between theupstream <strong>and</strong> downstream stations located on Horse Creek, suggesting the potentialpresence of anthropogenic sources of those constituents at one or more locationsbetween the two stations.NH 4 -N contributed a much smaller portion of the overall DIN yield, typically < 0.2 kgN/ha/yr (Fig. 7). The highest estimated yields of NH 4 -N occurred at the <strong>Myakka</strong> <strong>River</strong>-32
<strong>Myakka</strong> City gaging station (in water years 1999 <strong>and</strong> 2000), <strong>and</strong> at the Big SloughCanal (2001), Shell Creek (2001), <strong>Myakka</strong> <strong>River</strong>-Sarasota (2001) <strong>and</strong> <strong>Peace</strong> <strong>River</strong>-Bartow (1998) stations.Estimated yields of PO 4 -P <strong>and</strong> total phosphorus followed similar temporal <strong>and</strong> spatialpatterns, with the largest values occurring at gages on the main stem of the <strong>Peace</strong><strong>River</strong> (e.g., Fort Meade, Zolfo Springs, <strong>and</strong> Arcadia) during 1998 (Figs. 8, 9).Relatively large yields also occurred on the main stem of the <strong>Myakka</strong> <strong>River</strong> <strong>and</strong> at theBig Slough Canal-<strong>Myakka</strong> City station during 2001.TSS yield showed a pronounced spike at the Saddle Creek gaging station during wateryear 1998 (Fig. 10), presumably due to episodic discharges from Lake Hancock duringEl Niño-related storm events. Other stations <strong>and</strong> years that produced relatively highTSS yields (in comparison to other stations <strong>and</strong> years) included:• Shell Creek near Punta Gorda (2001)• <strong>Myakka</strong> <strong>River</strong> at <strong>Myakka</strong> City (2001)• <strong>Peace</strong> <strong>River</strong> at Bartow (1998)• Saddle Cree at Structure P-11 (1999, 2000)• <strong>Peace</strong> <strong>River</strong> at Fort Meade (1998)• Big Slough Canal near <strong>Myakka</strong> City (2001).33
PEACE CREEK CANAL nr WAHNETASADDLE CREEK at STRUCTURE P-11PEACE RIVER at BARTOWPEACE RIVER at FORT MEADEPEACE RIVER at ZOLFO SPRINGSCHARLIE CREEK nr GARDNERPEACE RIVER at ARCADIAJOSHUA CREEK at NOCATEEWY98WY99WY00WY01HORSE CREEK nr MYAKKA HEADHORSE CREEK nr ARCADIASHELL CREEK nr PUNTA GORDAMYAKKA RIVER at MYAKKA CITYMYAKKA RIVER nr SARASOTABIG SLOUGH CANAL nr MYAKKA CITY0.0E+00 2.0E+06 4.0E+06 6.0E+06 8.0E+06 1.0E+07 1.2E+07ANNUAL H2O YIELD (L/HA)Fig. 3. Measured water yields, water years 1998 – 2001.34
PEA CE CREEK CANAL nr WAHNETASADDLE CREEK at STRUCTURE P-11PEACE RIVER at BARTOWPEA CE RIVER at FORT MEADEPEACE RIVER at ZOLFO SPRINGSCHARLIE CREEK nr GARDNERPEACE RIVER at ARCADIAJOSHUA CREEK at NOCATEEWY98WY99WY00WY01HORSE CREEK nr MYAKKA HEADHORSE CREEK nr ARCADIASHELL CREEK nr PUNTA GORDAMYAKKA RIVER at MYAKKA CITYMYAKKA RIVER nr SARASOTABIG SLOUGH CANAL nr MYAKKA CITY0 3 6 9 12 15 18ANNUAL TN YIELD (KG N/HA/YEAR)Fig. 4. Estimated TN yields, water years 1998 – 2001.35
PEACE CREEK CANAL nr WAHNETASADDLE CREEK at STRUCTURE P-11PEACE RIVER at BARTOWPEACE RIVER at FORT MEADEPEACE RIVER at ZOLFO SPRINGSCHARLIE CREEK nr GARDNERPEACE RIVER at ARCADIAJOSHUA CREEK at NOCATEEWY98WY99WY00WY01HORSE CREEK nr MYAKKA HEADHORSE CREEK nr ARCADIASHELL CREEK nr PUNTA GORDAMYAKKA RIVER at MYAKKA CITYMYAKKA RIVER nr SARASOTABIG SLOUGH CANAL nr MYAKKA CITY0 1 2 3 4 5 6ANNUAL DIN YIELD (KG N/HA)Fig. 5. Estimated DIN yields, water years 1998 – 2001.36
PEACE CREEK CANAL nr WAHNETASADDLE CREEK at STRUCTURE P-11PEACE RIVER at BARTOWPEACE RIVER at FORT MEADEPEACE RIVER at ZOLFO SPRINGSCHARLIE CREEK nr GARDNERPEACE RIVER at ARCADIAJOSHUA CREEK at NOCATEEWY98WY99WY00WY01HORSE CREEK nr MYAKKA HEADHORSE CREEK nr ARCADIASHELL CREEK nr PUNTA GORDAMYAKKA RIVER at MYAKKA CITYMYAKKA RIVER nr SARASOTABIG SLOUGH CANAL nr MYAKKA CITY0 1 2 3 4 5 6ANNUAL NOx-N YIELD (KG N/HA)Fig. 6. Estimated NO 2+3 -N yields, water years 1998 – 2001.37
PEACE CREEK CANAL nr WAHNETASADDLE CREEK at STRUCTURE P-11PEACE RIVER at BARTOWPEACE RIVER at FORT MEADEPEACE RIVER at ZOLFO SPRINGSCHARLIE CREEK nr GARDNERPEACE RIVER at ARCADIAJOSHUA CREEK at NOCATEEWY98WY99WY00WY01HORSE CREEK nr MYAKKA HEADHORSE CREEK nr ARCADIASHELL CREEK nr PUNTA GORDAMYAKKA RIVER at MYAKKA CITYMYAKKA RIVER nr SARASOTABIG SLOUGH CANAL nr MYAKKA CITY0.0 0.2 0.4 0.6ANNUAL NH4-N YIELD (KG N/HA)Fig. 7. Estimated NH 4 -N yields, water years 1998 – 2001.38
PEACE CREEK CANAL nr WAHNETASADDLE CREEK at STRUCTURE P-11PEACE RIVER at BARTOWPEACE RIVER at FORT MEADEPEACE RIVER at ZOLFO SPRINGSCHARLIE CREEK nr GARDNERPEACE RIVER at ARCADIAJOSHUA CREEK at NOCATEEWY98WY99WY00WY01HORSE CREEK nr MYAKKA HEADHORSE CREEK nr ARCADIASHELL CREEK nr PUNTA GORDAMYAKKA RIVER at MYAKKA CITYMYAKKA RIVER nr SARASOTABIG SLOUGH CANAL nr MYAKKA CITY0 1 2 3 4 5ANNUAL TP YIELD (KG P/HA)Fig. 8. Estimated TP yields, water years 1998 – 2001.39
PEACE CREEK CANAL nr WAHNETASADDLE CREEK at STRUCTURE P-11PEACE RIVER at BARTOWPEACE RIVER at FORT MEADEPEACE RIVER at ZOLFO SPRINGSCHARLIE CREEK nr GARDNERPEACE RIVER at ARCADIAJOSHUA CREEK at NOCATEEWY98WY99WY00WY01HORSE CREEK nr MYAKKA HEADHORSE CREEK nr ARCADIASHELL CREEK nr PUNTA GORDAMYAKKA RIVER at MYAKKA CITYMYAKKA RIVER nr SARASOTABIG SLOUGH CANAL nr MYAKKA CITY0 1 2 3ANNUAL PO4-P YIELD (KG P/HA)Fig. 9. Estimated PO 4 -P yields, water years 1998 – 2001.40
PEACE CREEK CANAL nr WAHNETASADDLE CREEK at STRUCTURE P-11PEACE RIVER at BARTOWPEACE RIVER at FORT MEADEPEACE RIVER at ZOLFO SPRINGSCHARLIE CREEK nr GARDNERPEACE RIVER at ARCADIAJOSHUA CREEK at NOCATEEWY98WY99WY00WY01HORSE CREEK nr MYAKKA HEADHORSE CREEK nr ARCADIASHELL CREEK nr PUNTA GORDAMYAKKA RIVER at MYAKKA CITYMYAKKA RIVER nr SARASOTABIG SLOUGH CANAL nr MYAKKA CITY0 50 100 150 200 250ANNUAL TSS YIELD (KG/HA)Fig. 10. Estimated TSS yields, water years 1998 – 2001.41
3.3 ANNUAL FLOW-ADJUSTED LOADS<strong>Water</strong>shed managers can gain additional insights into spatial <strong>and</strong> temporal pollutantdischarge patterns by examining the annual ‘flow-adjusted’ loads of important waterquality constituents that are discharged from gaged sub-basins.These values are calculated by dividing a sub-basin’s estimated annual constituent load(in milligrams) by its measured annual discharge (in liters). The result, expressed inunits of mg/L, gives an estimate of the mass of the constituent that was discharged fromthe sub-basin per unit water flow.In cases where managers wish to reduce loadings of a particular constituent to areceiving waterbody, the most cost-effective approach is often to focus on areas thatexhibit the highest flow-adjusted loads of that constituent. If effective load reductionmethods are available, projects implemented in those areas should tend to produce thelargest load reductions per volume of water treated.Estimated annual flow-adjusted loads of nutrient forms <strong>and</strong> TSS from gaged sub-basinsin the <strong>Peace</strong> <strong>and</strong> <strong>Myakka</strong> <strong>River</strong> watersheds are summarized, for water years 1998 –2001, in Figs. 11-17.For dissolved inorganic nitrogen forms, the largest estimated flow-adjusted loads (>0.3mg N/L) occurred at the following monitoring stations:• Joshua Creek at Nocatee (water years 1999, 2000, <strong>and</strong> 2001)• <strong>Peace</strong> <strong>River</strong> at Zolfo Springs (1998-2001)• Big Slough Canal near <strong>Myakka</strong> City (2000)• <strong>Peace</strong> <strong>River</strong> at Arcadia (1998-2001)• <strong>Peace</strong> Creek Canal near Wahneta (2000).For dissolved inorganic phosphorus, the largest estimated flow-adjusted loads (> 0.4 mgP/L) were observed at the following stations:• <strong>Peace</strong> <strong>River</strong> at Bartow (1999, 2001)• <strong>Peace</strong> <strong>River</strong> at Fort Meade (1998 – 2000)• <strong>Peace</strong> <strong>River</strong> at Zolfo Springs (1998 – 2001)• Charlie Creek near Gardner (1999)• <strong>Peace</strong> <strong>River</strong> at Arcadia (1998, 1999, 2001)• <strong>Myakka</strong> <strong>River</strong> near Sarasota (2001)• Big Slough Canal near <strong>Myakka</strong> City (2001).For TSS, the largest estimated flow-adjusted loads (> 25 mg/L) were observed at thefollowing stations:• Saddle Creek at Structure P-11 (1998, 1999, 2000)• <strong>Peace</strong> <strong>River</strong> at Bartow (1999, 2000)42
PEACE CREEK CANAL nr WAHNETASADDLE CREEK at STRUCTURE P-11PEACE RIVER at BARTOWPEACE RIVER at FORT MEADEPEACE RIVER at ZOLFO SPRINGSCHARLIE CREEK nr GARDNERPEACE RIVER at ARCADIAJOSHUA CREEK at NOCATEEHORSE CREEK nr MYAKKA HEADWY98WY99WY00WY01HORSE CREEK nr ARCADIASHELL CREEK nr PUNTA GORDAMYAKKA RIVER at MYAKKA CITYMYAKKA RIVER nr SARASOTADEER PRAIRIE SLOUGH nr NORTH PORTBIG SLOUGH CANAL nr MYAKKA CITY0 1 2 3 4ANNUAL FLOW-ADJUSTED TN LOAD (MG/L)Fig. 11. Estimated flow-adjusted TN loads, water years 1998 – 2001.43
PEACE CREEK CANAL nr WAHNETASADDLE CREEK at STRUCTURE P-11PEACE RIVER at BARTOWPEACE RIVER at FORT MEADEPEACE RIVER at ZOLFO SPRINGSCHARLIE CREEK nr GARDNERPEACE RIVER at ARCADIAJOSHUA CREEK at NOCATEEHORSE CREEK nr MYAKKA HEADWY98WY99WY00WY01HORSE CREEK nr ARCADIASHELL CREEK nr PUNTA GORDAMYAKKA RIVER at MYAKKA CITYMYAKKA RIVER nr SARASOTADEER PRAIRIE SLOUGH nr NORTH PORTBIG SLOUGH CANAL nr MYAKKA CITY0.0 0.3 0.6 0.9 1.2 1.5 1.8ANNUAL FLOW-ADJUSTED DIN LOAD (MG/L)Fig. 12. Estimated flow-adjusted DIN loads, water years 1998 – 2001.44
PEACE CREEK CANAL nr WAHNETASADDLE CREEK at STRUCTURE P-11PEACE RIVER at BARTOWPEACE RIVER at FORT MEADEPEACE RIVER at ZOLFO SPRINGSCHARLIE CREEK nr GARDNERPEACE RIVER at ARCADIAJOSHUA CREEK at NOCATEEHORSE CREEK nr MYAKKA HEADWY98WY99WY00WY01HORSE CREEK nr ARCADIASHELL CREEK nr PUNTA GORDAMYAKKA RIVER at MYAKKA CITYMYAKKA RIVER nr SARASOTADEER PRAIRIE SLOUGH nr NORTH PORTBIG SLOUGH CANAL nr MYAKKA CITY0.0 0.2 0.4 0.6 0.8 1.0 1.2 1.4 1.6 1.8ANNUAL FLOW-ADJUSTED NO2+3-N LOAD (MG/L)Fig. 13. Estimated flow-adjusted NO 2+3 - N loads, water years 1998 – 2001.45
PEACE CREEK CANAL nr WAHNETASADDLE CREEK at STRUCTURE P-11PEACE RIVER at BARTOWPEACE RIVER at FORT MEADEPEACE RIVER at ZOLFO SPRINGSCHARLIE CREEK nr GARDNERPEACE RIVER at ARCADIAJOSHUA CREEK at NOCATEEHORSE CREEK nr MYAKKA HEADWY98WY99WY00WY01HORSE CREEK nr ARCADIASHELL CREEK nr PUNTA GORDAMYAKKA RIVER at MYAKKA CITYMYAKKA RIVER nr SARASOTADEER PRAIRIE SLOUGH nr NORTH PORTBIG SLOUGH CANAL nr MYAKKA CITY0.00 0.04 0.08 0.12 0.16ANNUAL FLOW-ADJUSTED NH4-N LOAD (MG/L)Fig. 14. Estimated flow-adjusted NH 4 - N loads, water years 1998 – 2001.46
PEACE CREEK CANAL nr WAHNETASADDLE CREEK at STRUCTURE P-11PEACE RIVER at BARTOWPEACE RIVER at FORT MEADEPEACE RIVER at ZOLFO SPRINGSCHARLIE CREEK nr GARDNERPEACE RIVER at ARCADIAJOSHUA CREEK at NOCATEEHORSE CREEK nr MYAKKA HEADWY98WY99WY00WY01HORSE CREEK nr ARCADIASHELL CREEK nr PUNTA GORDAMYAKKA RIVER at MYAKKA CITYMYAKKA RIVER nr SARASOTADEER PRAIRIE SLOUGH nr NORTH PORTBIG SLOUGH CANAL nr MYAKKA CITY0.0 0.2 0.4 0.6 0.8 1.0 1.2 1.4ANNUAL FLOW-ADJUSTED TP LOAD (MG/L)Fig. 15. Estimated flow-adjusted TP loads, water years 1998 – 2001.47
PEACE CREEK CANAL nr WAHNETASADDLE CREEK at STRUCTURE P-11PEACE RIVER at BARTOWPEACE RIVER at FORT MEADEPEACE RIVER at ZOLFO SPRINGSCHARLIE CREEK nr GARDNERPEACE RIVER at ARCADIAJOSHUA CREEK at NOCATEEHORSE CREEK nr MYAKKA HEADWY98WY99WY00WY01HORSE CREEK nr ARCADIASHELL CREEK nr PUNTA GORDAMYAKKA RIVER at MYAKKA CITYMYAKKA RIVER nr SARASOTADEER PRAIRIE SLOUGH nr NORTH PORTBIG SLOUGH CANAL nr MYAKKA CITY0.0 0.2 0.4 0.6 0.8 1.0 1.2ANNUAL FLOW-ADJUSTED PO4-P LOAD (MG/L)Fig. 16. Estimated flow-adjusted PO 4 - P loads, water years 1998 – 2001.48
PEACE CREEK CANAL nr WAHNETASADDLE CREEK at STRUCTURE P-11PEACE RIVER at BARTOWPEACE RIVER at FORT MEADEPEA CE RIVER at ZOLFO SPRINGSCHARLIE CREEK nr GARDNERPEACE RIVER at ARCADIAJOSHUA CREEK at NOCATEEHORSE CREEK nr MYAKKA HEADWY98WY99WY00WY01HORSE CREEK nr ARCADIASHELL CREEK nr PUNTA GORDAMYAKKA RIVER at MYAKKA CITYMYAKKA RIVER nr SARASOTADEER PRAIRIE SLOUGH nr NORTH PORTBIG SLOUGH CANAL nr MYAKKA CITY0 25 50 75 100 125 150 175 200 225ANNUAL FLOW-ADJUSTED TSS LOAD (MG/L)Fig. 17. Estimated flow-adjusted TSS loads, water years 1998 – 2001.49
4.0 WATER QUALITY AT TIDAL STATIONSBetween January 1993 <strong>and</strong> December 2000, as part of a larger Charlotte Harbormonitoring program, the District conducted monthly water quality monitoring at sevensites in the tidal reaches of the <strong>Peace</strong> <strong>and</strong> <strong>Myakka</strong> rivers. The sites were located atfixed geographic coordinates (shown in Fig. 18), which were at or near locations thathad been sampled by the U.S. Geological Survey (USGS) in an earlier monitoringprogram conducted during the 1980s.The 1993-2000 monitoring program used a synoptic, tidally-based sampling design.During each monthly sampling event all sites were sampled within a single 24-hourperiod. At each site sampling was performed within one hour of (predicted) slack lowtide. The objective of this design was to provide synoptic water quality information froma set of fixed monitoring locations. To provide a clearer picture of watershed impacts,the data were collected during the portion of the tidal cycle when water quality would bemost influenced by hydrologic <strong>and</strong> pollutant loadings from the <strong>Peace</strong> <strong>and</strong> <strong>Myakka</strong> <strong>River</strong>watersheds <strong>and</strong> least influenced by estuarine <strong>and</strong> marine water masses from CharlotteHarbor <strong>and</strong> the Gulf of Mexico.The monitoring stations were generally shallow-water sites, with water depths typicallyranging between 1-3 m . Only two stations — CH-002 on the <strong>Myakka</strong> <strong>River</strong> <strong>and</strong> CH-005 on the <strong>Peace</strong> — had depths exceeding 3m on most sampling dates.During each monthly sampling event the monitoring design, based on U.S. EPAguidance (EPA 1991), called for near-surface water chemistry samples to be collectedat a depth of 0.5 m at each station. At the two deeper-water sites an additional (nearbottom)sample was collected at a depth 0.5 m above the bottom. Vertical hydrographicprofiles were recorded during each sampling event, with measurements taken at depthintervals of 0.5 m (shallow-water stations) or 1 m (deeper-water stations), beginning atthe top of the water column <strong>and</strong> extending to the bottom.Summaries of selected water quality constituents are shown in Appendix B. In addition,detailed analyses of water quality status <strong>and</strong> trends in Charlotte Harbor <strong>and</strong> the tidalreaches of its tributaries— based on data collected by the District <strong>and</strong> a number of otheragencies — is currently being performed by the Charlotte Harbor National EstuaryProgram. A report summarizing those analyses will be published by the EstuaryProgram during <strong>2002</strong>.50
###Tidal<strong>Myakka</strong><strong>River</strong>Tidal<strong>Peace</strong><strong>River</strong>Sarasota Co.DeSoto Co.#CH-001CH-029##CH-002#CH-02BCH-05B##CH-005#CH-004NCharlotte Co.Charlotte Harbor5 0 5 10 MilesFigure 18. Location of the SWFWMD fixed-station monitoring locations in the tidalreaches of the <strong>Peace</strong> <strong>and</strong> <strong>Myakka</strong> river systems.51
4.1 PHYSICAL PARAMETERSNear-Surface SalinityAnnual near-surface salinity patterns at the seven monitoring stations during wateryears 1994 – 2000 are summarized, in percentile form, in Appendix B.The most upstream stations in both river systems (CH-001 in the tidal <strong>Myakka</strong> <strong>and</strong> CH-029 in the tidal <strong>Peace</strong>) were located in oligohaline areas, with median salinities 20 ppt).Median near-surface salinities at the remaining stations were generally mesohaline,ranging between 10 <strong>and</strong> 25 ppt. Stations CH-002 (<strong>Myakka</strong>) <strong>and</strong> CH-004 (<strong>Peace</strong>)exhibited similar median values, of between 10 <strong>and</strong> 22 ppt. Stations CH-02B (<strong>Myakka</strong>)<strong>and</strong> CH-05B also exhibited similar median values, between 13 <strong>and</strong> 24 ppt. Highestmedian salinities (18–26 ppt) occurred at station CH-005, near the mouth of the <strong>Peace</strong><strong>River</strong>.The maximum salinity value shown in Appendix B (44.95 ppt), a near-surface valuereported from station CH-005, apparently reflects an instrument malfunction ortypographic error, <strong>and</strong> has been removed from the District database (C. Anastasiou,personal communication).Near-Surface ColorNatural water color, produced as a result of decomposition of leaf litter <strong>and</strong> otherrefractory organic matter, has been shown to be an important source of light attenuationin the <strong>Peace</strong> <strong>and</strong> <strong>Myakka</strong> river systems <strong>and</strong> portions of Charlotte Harbor (McPherson<strong>and</strong> Miller 1987).Among the stations sampled during water years 1994-2000, median near-surface colorlevels varied inversely with median near-surface salinities. Color levels were quite highat the most upstream stations (CH-001 <strong>and</strong> CH-029), fell by about 50% between thosestations <strong>and</strong> the next downstream sampling locations (CH-002 <strong>and</strong> CH-004), <strong>and</strong>declined another 20-40% at the highest-salinity stations (CH-02B, CH-05B, <strong>and</strong> CH-005) (Appendix B).Color levels in estuaries are affected by a variety of physical <strong>and</strong> chemical processes.The simplest physical process is dilution, which occurs when highly colored river watermixes with sea water containing much lower concentrations of the dissolved <strong>and</strong>colloidal humic acids <strong>and</strong> other compounds that contribute to water color. Humicmaterials are also removed from the water column through two physical-chemicalprocesses — flocculation <strong>and</strong> adsorption — whose rates increase when the materialsare transported from fresh to more saline waters. In estuaries, flocculation of humicacid colloids reportedly occurs preferentially at salinities between 0 <strong>and</strong> 5 ppt (Day et al.1989).52
Median color values for Florida rivers <strong>and</strong> estuaries, as reported by Friedemann <strong>and</strong>H<strong>and</strong> (1989) based on a survey of several thous<strong>and</strong> records retrieved from the U.S.EPA STORET database, are 70.0 <strong>and</strong> 20.0 pcu, respectively. Values observed in thetidal reaches of the <strong>Peace</strong> <strong>and</strong> <strong>Myakka</strong> river systems during water years 1994-2000(Appendix B) were substantially higher than these statewide medians.Near-Surface TSSConcentrations of total suspended solids (TSS) reflect levels of organic <strong>and</strong> inorganicparticulate matter present in the water column. High levels of TSS can impact thequality of aquatic habitats by reducing water clarity <strong>and</strong> light penetration, thus affectingthe growth of algae <strong>and</strong> rooted aquatic plants. Areas of high TSS deposition <strong>and</strong>resuspension are often sub-optimal habitats for many aquatic organisms, due to fouling<strong>and</strong> smothering effects <strong>and</strong> reductions in dissolved oxygen availability that can occur asa result of elevated sediment oxygen dem<strong>and</strong>.Annual median near-surface TSS values in the tidal <strong>Peace</strong> <strong>and</strong> <strong>Myakka</strong> river samplesranged between 3 <strong>and</strong> 36 mg/L, with the higher values occurring at the moredownstream stations (Appendix B). Median values for Florida rivers <strong>and</strong> estuariesreported by Friedemann <strong>and</strong> H<strong>and</strong> (1989) are 7.0 <strong>and</strong> 17.5 mg/L, respectively. With theexception of relatively high values observed at several stations during the 2000 wateryear, TSS concentrations at the tidal <strong>Peace</strong> <strong>and</strong> <strong>Myakka</strong> <strong>River</strong> monitoring sites do notappear to be elevated with respect to other Florida water bodies.Near-Surface TurbidityTurbidity is an expression of the optical property that causes light to be scattered <strong>and</strong>absorbed rather than transmitted in straight lines through a water sample. It is primarilycaused by suspended matter (e.g., clay, silt, <strong>and</strong> finely-divided organic <strong>and</strong> inorganicmaterials), soluble colored organic compounds, <strong>and</strong> plankton <strong>and</strong> other microscopicorganisms (APHA 1989).Annual median values measured at the tidal <strong>Peace</strong>-<strong>Myakka</strong> monitoring stations duringwater years 1994 - 2000 ranged between 1.7 <strong>and</strong> 7.3 NTU, with the highest valuesoccurring at the most upstream stations on both rivers (Appendix B).Turbidity measurements can be affected by high levels of water color, apparently due tolight absorption by the dissolved substances that are also responsible for color (APHA1989). Because the tidal <strong>Peace</strong> <strong>and</strong> <strong>Myakka</strong> are highly colored river systems,comparisons of turbidity measurements from these areas with measurements fromother rivers, with different color characteristics, should be done with caution.53
Secchi DepthSecchi depth — the average depth at which a st<strong>and</strong>ardized (20 cm diameter) white orblack-<strong>and</strong>-white disk disappears <strong>and</strong> reappears when lowered into the water columnfrom the deck of a boat or dock — is a simple measure of water transparency. Becausetransparency is affected by a number of factors, including water color, TSS <strong>and</strong>turbidity, Secchi depths can exhibit substantial temporal <strong>and</strong> spatial variability within <strong>and</strong>between water bodies. Median statewide Secchi depth values for Florida rivers <strong>and</strong>estuaries, reported by Friedemann <strong>and</strong> H<strong>and</strong> (1989), are 0.8 m <strong>and</strong> 1.1 m, respectively.Median Secchi depth values for the tidal <strong>Peace</strong> <strong>and</strong> <strong>Myakka</strong> <strong>River</strong> stations are shown inAppendix B. The lowest median values were recorded at the most upstream stations(CH-001 <strong>and</strong> CH-029) in both river systems, presumably reflecting the high color <strong>and</strong>turbidity levels that occurred at those sites. In general median Secchi depths appearedto increase along the salinity gradient in both rivers, although reductions occurred atstations CH-02B <strong>and</strong> CH-05B. Both of these stations were located in shallow shorelineembayments away from the rivers’ main stems, where water transparency may havebeen affected by site-specific factors.Near-Surface pHpH is a measurement of the acidity of a water sample. Values 7 are considered basic or “alkaline.” Due to theirchemical characteristics, marine <strong>and</strong> estuarine waters tend to be more highly bufferedthan fresh water systems, usually exhibiting pH values in the range of 7.8 to 8.3(marine) or 7.5 to 8.8 (estuarine) st<strong>and</strong>ard units (Day et al. 1989).Highly acidic (ph < 4.5) or basic (pH > 9.5) conditions, which can occur due to a varietyof natural or man-made factors, can be harmful or fatal to aquatic organisms, eitherdirectly or due to increased mobilization or toxicity of other substances in theenvironment.pH values varied over a relatively narrow range at the tidal <strong>Peace</strong>-<strong>Myakka</strong> stations(Appendix B), with annual median values at each station ranging between 6.8 <strong>and</strong> 7.9units. Among the individual monthly readings the most acidic value (5.5) occurred atthe most upstream of the tidal <strong>Peace</strong> <strong>River</strong> stations, perhaps reflecting the high colorlevels (caused in part by humic acids) that occurred at that site. The most basic value(8.9) occurred at station CH-004, a site that experienced relatively frequent algal bloomswhich may have led to increased pH levels as a result of CO 2 uptake by algal cellsduring photosynthesis.Dissolved OxygenAnnual median dissolved oxygen concentrations observed at the tidal <strong>Peace</strong>-<strong>Myakka</strong>stations during water years 1994-2000 varied between 5.7 <strong>and</strong> 7.7 mg/L mg/L(Appendix B). During the period, concentrations in the “stressful” (< 4 mg/L) range were54
ecorded at least once during most years at every site. Concentrations in the “hypoxic”(< 2 mg/L) range were observed at the following stations:• CH-02B (water years 1995, 1999, 2000)• CH-004 (all years)• CH-05B (1994, 1995, 1998, 1999)• CH-005 (all years)4.2 MACRONUTRIENTS – DISSOLVED INORGANIC N AND PThe availability of dissolved inorganic nitrogen <strong>and</strong> phosphorus are importantdeterminants of algal productivity, which in turn has major effects on oxygen dynamics<strong>and</strong> other aspects of a water body’s trophic state.As a general rule of thumb, laboratory studies indicate that the availability of DIP <strong>and</strong>DIN begin to limit phytoplankton growth when their concentrations fall below 0.001 –0.005 mg P/L <strong>and</strong> 0.005 – 0.020 mg N/L, respectively (Chapra 1997). By comparingobserved DIP <strong>and</strong> DIN concentrations to these values — which are “half saturationconstants” measured for a variety of phytoplankton species in Michaelis-Menton nutrientuptake experiments — the likelihood <strong>and</strong> potential frequency of P or N limitation in agiven waterbody can be assessed (Chapra 1997).NEAR-SURFACE DIPGiven the phosphate-rich geology of the <strong>Peace</strong> <strong>and</strong> <strong>Myakka</strong> <strong>River</strong> watersheds, whichsupport a large phosphate mining <strong>and</strong> processing industry, it would be surprising to findevidence of frequent or pronounced phosphorus limitation in the tidal reaches of eitherriver (e.g., Odum 1953, Hammett 1987, Fraser 1991, Montgomery et al. 1991).Based on the water year 1994-2000 monitoring data, P limitation does not appear to bean important factor affecting phytoplankton productivity in either area. Median DIPconcentrations ranged from 0.06 to 0.6 mg P/L at all sites, with the highest medianvalue observed at the most upstream station (CH-029) in the tidal <strong>Peace</strong> <strong>River</strong>(Appendix B). The lowest concentrations observed during individual sampling eventsranged from below 0.01 (the laboratory detection limit) to about 0.4 mg DIP/L.It is possible that some or all of the values that were below the laboratory detection limitmay have fallen within the potential nutrient limitation range (0.001 – 0.005 mg P/L) asdefined by Chapra (1997). By definition, however, it is not possible to quantify valuesthat fall below the detection limit, so the available data cannot resolve this question. Onthe other h<strong>and</strong>, the 25 th percentile concentrations observed at each station weresubstantially higher (>0.03 mg DIP/L) than the upper-bound value for potential Plimitation (0.005 mg DIP/L) provided by Chapra (1997), suggesting that P limitation, if itoccurred, was not a frequent event during the study period.55
NEAR-SURFACE DINAnnual median near-surface DIN concentrations ranged between 0.02 <strong>and</strong> 0.52 mg N/Lat the tidal <strong>Myakka</strong> <strong>River</strong> stations, <strong>and</strong> between 0.03 <strong>and</strong> 0.40 mg N/L at the tidal <strong>Peace</strong><strong>River</strong> stations (Appendix B). Median concentrations appear to vary inversely withsalinity in both river systems.If 0.01 mg DIN/L — which was the effective detection limit for DIN forms in the Districtmonitoring program for DIN forms, <strong>and</strong> the mid-range of potential N limitation valuesdiscussed by Chapra 1997 — is used to estimate the threshold for N limitation inphytoplankton, it appears that N availability may have limited phytoplankton productivityat several of the tidal river stations sampled during 1993-2000. DIN concentrationsbelow the laboratory detection limit were observed during at least one sampling event ateach station. The 25 th percentile value was equal to the detection limit in one or morewater years at each station, indicating that DIN concentrations equal to or less than thedetection limit were observed on 25% of the sampling dates at the station during thatyear.4.3 CHLOROPHYLL-aChlorophyll-a concentrations, which provide estimates of phytoplankton biomass in thewater column, are helpful indicators of a waterbody’s trophic state. A summary of nearsurfacechlorophyll-a concentrations observed at the tidal <strong>Peace</strong> <strong>and</strong> <strong>Myakka</strong> <strong>River</strong>monitoring stations is shown in Appendix B. Annual median values ranged between thelaboratory detection limit (1.0 µg/L) <strong>and</strong> 13 µg/L at the tidal <strong>Myakka</strong> stations <strong>and</strong>between 2.3 <strong>and</strong> 10.6 µg/L in the tidal <strong>Peace</strong>. The statewide median chlorophyll-aconcentration for Florida estuaries, as reported by Freidemann <strong>and</strong> H<strong>and</strong> (1989), is 8.5µg/L.Algal blooms (indicated by chlorophyll-a concentrations > 20 µg/L) occurred at everystation at some time during the monitoring period. Pronounced blooms, with chlorophyllconcentrations > 50 µg/L, were observed at three sites (CH-002, CH-02B, <strong>and</strong> CH-004).Annual mean chlorophyll-a concentrations observed at several stations during wateryears 1994-2000 exceeded 11 µg/L, a value that has been proposed by the State ofFlorida as representative of potentially impaired water quality conditions in the State’sestuarine waters. Stations <strong>and</strong> years where the proposed impairment level wereexceeded include:• CH-002 (water years 1995, 1999)• CH-02B (1995, 1998, 1999)• CH-029 (1995, 1996)• CH-004 (1994, 1995, 1996, 1999)• CH-05B (1999)• CH-005 (1994).56
5.0 REFERENCESCanfield, D., <strong>and</strong> M. Hoyer. 1988. Regional geology <strong>and</strong> the chemical <strong>and</strong> trophic statecharacteristics of Florida lakes. Lake <strong>and</strong> Reservoir Management 4:21-31.Charlotte Harbor Environmental Center (CHEC). 1999. Annual report on water qualitystatus <strong>and</strong> trends in the <strong>Peace</strong> <strong>and</strong> <strong>Myakka</strong> <strong>River</strong> basins. Charlotte Harbor NationalEstuary Program. North Ft. Myers, FLCharlotte Harbor Environmental Center (CHEC). 2000. Annual report on water qualitystatus <strong>and</strong> trends in the <strong>Peace</strong> <strong>and</strong> <strong>Myakka</strong> <strong>River</strong> basins. Charlotte Harbor NationalEstuary Program. North Ft. Myers, FLCharlotte Harbor Environmental Center (CHEC). 2001. Annual report on water qualitystatus <strong>and</strong> trends in the <strong>Peace</strong> <strong>and</strong> <strong>Myakka</strong> <strong>River</strong> basins. Charlotte Harbor NationalEstuary Program. North Ft. Myers, FLCoastal Environmental, Inc. 1995. Estimates of total nitrogen, total phosphorus, <strong>and</strong>total suspended solids loadings to Charlotte Harbor, Florida. <strong>Southwest</strong> Florida <strong>Water</strong>Management District. Tampa, FLCoastal Environmental/PBS&J, Inc. 1998. Tree mortality assessment of the upper<strong>Myakka</strong> <strong>River</strong> watershed. <strong>Southwest</strong> Florida <strong>Water</strong> Management District. Tampa, FLCochran, W.G. 1977. Sampling Techniques (3 rd Ed). Wiley. New York, NYFraser, T.H. 1991. The lower <strong>Peace</strong> <strong>River</strong> <strong>and</strong> Horse Creek: flow <strong>and</strong> water qualitycharacteristics, 1976-1986. pp 143-185 in R. Livingston (ed.) The <strong>River</strong>s of Florida.Springer-Verlag. NY, NYHammett, K. M. 1987. L<strong>and</strong> use, water use, streamflow, <strong>and</strong> water-qualitycharacteristics of the Charlotte Harbor inflow area, Florida. U.S. Geological SurveyOpen-File Report 87-472. Tallahassee, FLH<strong>and</strong>, J., J. Col, <strong>and</strong> E. Grimison. 1994. <strong>Southwest</strong> Florida district water quality: 1994305(b) technical appendix. Florida Department of Environmental Protection,Tallahassee, FLH<strong>and</strong>, J., J. Col, <strong>and</strong> L. Lord. 1996. <strong>Southwest</strong> Florida district water quality: 1996305(b) technical appendix. FDEP, Bureau of Surface <strong>Water</strong> Management.Tallahassee, FLLowrey, S.S., K.J. Babbitt, J.L. Lincer, S.J. Schropp, F.D. Calder, H.L. Windom, R.B.Taylor, <strong>and</strong> T. Hull. 1990. <strong>Myakka</strong> <strong>River</strong> Basin project: A report on physical <strong>and</strong>chemical processes affecting the management of the <strong>Myakka</strong> <strong>River</strong> Basin. FDER,Office of Coastal Management. Tallahassee, FL57
National Research Council (NRC). 1999. New Strategies for America’s <strong>Water</strong>sheds.National Academy Press. Washington, DCOdum, H.T. 1953. Dissolved phosphorus in Florida waters. Fla. Bureau of GeologyReport of Investigations, No. 9. Tallahassee, FLPBS&J, Inc. 1999. Trend analysis of tree mortality in the upper <strong>Myakka</strong> <strong>River</strong>watershed. <strong>Southwest</strong> Florida <strong>Water</strong> Management District. Tampa, FLPreston, S.D., V.J. Bierman, Jr., <strong>and</strong> S.E. Silliman. 1989. An evaluation of methods forthe estimation of tributary mass loads. <strong>Water</strong> Resources Research 25:1379-1389.Squires, A., D. Heimbuch, <strong>and</strong> H. Wilson. 1996. A long-term water quality monitoringdesign for Charlotte Harbor, Florida. <strong>Southwest</strong> Florida <strong>Water</strong> Management District.Tampa, FLU.S. Geological Survey. 1997. <strong>Water</strong> Resources Data, Florida. Vol. 3A. <strong>Southwest</strong>Florida Surface <strong>Water</strong>. USGS. Tallahassee, FL58
<strong>Water</strong> <strong>Quality</strong> Conditions<strong>and</strong> Pollutant Loads <strong>and</strong> Yieldsin the <strong>Peace</strong> <strong>and</strong> <strong>Myakka</strong> <strong>River</strong> BasinsAppendicesPrepared for the<strong>Peace</strong> <strong>River</strong>/Manasota Regional <strong>Water</strong> Supply Authority<strong>and</strong> the<strong>Southwest</strong> Florida <strong>Water</strong> Management DistrictPrepared by:Charlotte HarborEnvironmental Center, Inc.10941 Burnt Store RoadPunta Gorda, FloridaOctober <strong>2002</strong>
APPENDIX ACONSTITUENT SUMMARIES FOR NON-TIDAL STATIONSA-1
TURBIDITY (NTU), BY STATION AND WATER YEARGAGE_NUM WY N Minimum 25th Pctl 50th Pctl Mean 75th Pctl Maximumƒƒƒƒƒƒƒƒƒƒƒƒƒƒƒƒƒƒƒƒƒƒƒƒƒƒƒƒƒƒƒƒƒƒƒƒƒƒƒƒƒƒƒƒƒƒƒƒƒƒƒƒƒƒƒƒƒƒƒƒƒƒƒƒƒƒƒƒƒƒƒƒƒƒƒƒƒƒƒƒƒƒƒƒƒƒƒƒƒƒƒƒƒƒƒƒƒƒƒƒƒƒƒƒƒƒƒƒƒƒƒƒƒƒƒ2293987 1998 9 3.8000 4.1000 4.6000 6.0667 5.3000 14.90001999 12 4.7000 6.3000 8.5000 9.6000 10.8500 25.00002000 11 1.8000 3.6000 5.1000 4.6136 5.8000 6.05002001 12 1.9000 2.6500 3.4500 3.6833 4.4500 6.80002294491 1998 8 20.0000 25.0000 31.5000 32.5000 38.5000 50.00001999 12 14.7000 20.7500 29.5000 32.8083 44.7500 59.00002000 11 8.6000 12.3000 13.8000 19.1273 19.1000 61.00002001 10 7.5000 18.5000 29.5000 57.1200 68.0000 240.00002294650 1998 9 8.0000 8.1000 10.3000 12.9111 11.2000 30.00001999 12 5.8000 8.4000 10.2500 15.4000 16.5000 55.00002000 11 1.3000 2.8000 3.6000 5.0273 5.0000 21.00002001 12 1.3000 2.2500 2.6500 2.7333 3.1000 5.00002294898 1998 9 4.0000 7.1000 8.2000 11.6444 11.0000 29.00001999 12 2.8500 3.1750 4.8500 6.6167 9.0500 16.00002000 11 0.8000 1.2000 1.7000 3.4091 2.7000 12.10002001 12 0.6600 0.9500 1.5000 1.7883 2.3000 5.10002295637 1998 9 2.0000 4.6000 6.0000 7.0222 7.7000 15.30001999 12 1.2000 1.7000 4.1500 4.8875 7.4500 12.50002000 11 0.7000 0.8000 1.3000 2.7818 3.3000 9.20002001 12 0.5000 0.7000 1.4000 4.9650 3.7500 38.0000A-2
TURBIDITY, BY STATION AND WATER YEARGAGE_NUM WY N Minimum 25th Pctl 50th Pctl Mean 75th Pctl Maximumƒƒƒƒƒƒƒƒƒƒƒƒƒƒƒƒƒƒƒƒƒƒƒƒƒƒƒƒƒƒƒƒƒƒƒƒƒƒƒƒƒƒƒƒƒƒƒƒƒƒƒƒƒƒƒƒƒƒƒƒƒƒƒƒƒƒƒƒƒƒƒƒƒƒƒƒƒƒƒƒƒƒƒƒƒƒƒƒƒƒƒƒƒƒƒƒƒƒƒƒƒƒƒƒƒƒƒƒƒƒƒƒƒƒƒ2296500 1998 9 1.0000 3.0000 3.2000 4.4333 4.1000 14.10001999 12 1.3000 2.2500 2.8500 3.1250 3.7000 6.80002000 11 0.3500 0.8000 1.1000 1.3727 1.6000 3.80002001 3 0.3000 0.3000 0.8000 1.0667 2.1000 2.10002296750 1998 9 2.9500 4.0000 5.0000 6.1778 6.2000 15.80001999 12 2.3000 2.6500 3.6500 5.0000 7.0000 11.00002000 11 0.5000 0.7500 0.8500 1.7000 1.7000 7.60002001 3 0.8000 0.8000 1.3000 1.4333 2.2000 2.20002297100 1998 3 1.5000 1.5000 3.4000 3.0000 4.1000 4.10001999 12 0.8000 1.5500 2.7000 3.1000 4.2500 7.50002000 11 0.6500 0.9000 1.3000 2.3091 4.8000 5.00002001 12 0.8000 1.1500 1.9000 2.2083 3.0500 5.20002297155 1998 9 1.0000 1.6000 2.5000 2.3889 3.3000 3.80001999 12 0.8000 1.1500 1.8500 2.4000 2.5500 8.40002000 11 0.8000 0.9000 1.2000 3.4273 3.1000 18.60002001 12 0.7600 0.9500 1.6500 2.1383 3.1000 5.30002297310 1998 9 1.2000 2.5000 2.9000 3.2833 3.2000 7.50001999 11 0.5000 0.9000 1.8000 2.1000 3.0000 4.00002000 10 0.4000 1.0000 1.0500 2.2350 3.0500 7.40002001 12 0.5500 0.8400 1.3000 1.9650 3.0000 4.7000A-3
TURBIDITY, BY STATION AND WATER YEARGAGE_NUM WY N Minimum 25th Pctl 50th Pctl Mean 75th Pctl Maximumƒƒƒƒƒƒƒƒƒƒƒƒƒƒƒƒƒƒƒƒƒƒƒƒƒƒƒƒƒƒƒƒƒƒƒƒƒƒƒƒƒƒƒƒƒƒƒƒƒƒƒƒƒƒƒƒƒƒƒƒƒƒƒƒƒƒƒƒƒƒƒƒƒƒƒƒƒƒƒƒƒƒƒƒƒƒƒƒƒƒƒƒƒƒƒƒƒƒƒƒƒƒƒƒƒƒƒƒƒƒƒƒƒƒƒ2298202 1998 9 1.9000 2.4500 3.2000 3.0722 3.7000 4.70001999 12 1.2800 1.7750 2.0000 1.9025 2.0500 2.20002000 12 1.0000 1.2000 1.4000 1.5750 1.9000 2.80002001 12 0.7000 0.9500 1.2000 1.5250 1.4000 4.60002298608 1999 12 0.2000 0.7500 1.1000 1.1083 1.5000 2.10002000 10 0.6000 0.7000 2.0500 2.7200 3.4500 7.60002001 12 0.5000 0.9000 1.3500 2.4667 2.0500 12.00002298830 1999 12 1.0000 1.4500 1.8500 2.3125 2.9000 4.80002000 10 0.8000 1.2000 1.4500 2.5900 3.4000 8.00002001 12 1.0000 1.1500 1.7500 5.0500 3.8500 33.00002299120 1999 11 2.5000 3.4000 4.3000 6.5227 7.5000 23.00002000 11 1.4000 2.2000 5.5000 5.7955 7.7500 14.70002001 12 1.4000 5.5000 7.5000 7.2750 9.9000 11.60002299410 1999 10 1.1000 2.0000 3.6500 4.9700 8.7000 10.50002000 10 2.0000 3.4000 7.8000 10.7900 15.7000 28.00002001 12 1.3000 1.3500 2.4500 2.8167 3.8500 5.80002299455 1999 11 1.8000 2.0000 3.2000 5.0818 7.8000 14.10002000 11 1.1000 2.8000 3.2000 4.1909 4.8000 10.60002001 11 0.0400 1.1500 4.1000 3.3627 5.5000 5.9000ƒƒƒƒƒƒƒƒƒƒƒƒƒƒƒƒƒƒƒƒƒƒƒƒƒƒƒƒƒƒƒƒƒƒƒƒƒƒƒƒƒƒƒƒƒƒƒƒƒƒƒƒƒƒƒƒƒƒƒƒƒƒƒƒƒƒƒƒƒƒƒƒƒƒƒƒƒƒƒƒƒƒƒƒƒƒƒƒƒƒƒƒƒƒƒƒƒƒƒƒƒƒƒƒƒƒƒƒƒƒƒƒƒƒƒA-4
TSS (MG/L), BY STATION AND WATER YEARGAGE_NUM WY N Minimum 25th Pctl 50th Pctl Mean 75th Pctl Maximumƒƒƒƒƒƒƒƒƒƒƒƒƒƒƒƒƒƒƒƒƒƒƒƒƒƒƒƒƒƒƒƒƒƒƒƒƒƒƒƒƒƒƒƒƒƒƒƒƒƒƒƒƒƒƒƒƒƒƒƒƒƒƒƒƒƒƒƒƒƒƒƒƒƒƒƒƒƒƒƒƒƒƒƒƒƒƒƒƒƒƒƒƒƒƒƒƒƒƒƒƒƒƒƒƒƒƒƒƒƒƒƒƒƒƒ2293987 1998 9 0.0025 3.0000 3.2000 5.3006 5.5000 15.00001999 12 2.8710 3.8400 5.0200 7.8262 8.2369 34.06672000 11 0.0025 3.1350 6.0000 8.5414 15.0000 27.00002001 12 0.0025 2.5000 5.5000 5.0838 6.5000 12.00002294491 1998 8 30.0000 47.5000 61.2000 63.4250 80.0000 100.00001999 12 7.2500 26.6042 45.2250 58.5238 75.7083 211.00002000 11 24.8667 28.0667 33.0000 64.9333 81.0000 206.33332001 10 12.0000 21.0000 45.0000 83.4000 129.0000 278.00002294650 1998 9 7.0000 10.5000 13.0000 19.0889 16.0000 67.10001999 12 2.7467 4.0975 11.4123 22.6795 17.8810 151.25002000 11 0.0025 3.0000 6.4815 10.7732 13.0000 48.30002001 12 0.0025 0.0025 2.0000 3.1677 4.5000 11.00002294898 1998 9 5.2000 8.5000 12.0000 19.6667 15.0000 54.00001999 12 0.4235 1.4950 2.3446 6.1232 10.2231 25.68752000 11 0.0025 2.0000 6.0000 8.6169 16.3235 23.00002001 12 0.0025 1.0013 4.5000 3.9173 6.0000 8.00002295637 1998 9 1.0000 2.4000 7.0000 10.2667 18.0000 30.00001999 12 0.3200 0.6300 2.2665 4.9243 8.2389 18.53122000 11 0.0025 0.0025 6.0000 5.5761 10.0000 13.75002001 12 0.0025 0.0025 2.0000 4.0010 6.0000 15.0000A-5
TSS, BY STATION AND WATER YEARGAGE_NUM WY N Minimum 25th Pctl 50th Pctl Mean 75th Pctl Maximumƒƒƒƒƒƒƒƒƒƒƒƒƒƒƒƒƒƒƒƒƒƒƒƒƒƒƒƒƒƒƒƒƒƒƒƒƒƒƒƒƒƒƒƒƒƒƒƒƒƒƒƒƒƒƒƒƒƒƒƒƒƒƒƒƒƒƒƒƒƒƒƒƒƒƒƒƒƒƒƒƒƒƒƒƒƒƒƒƒƒƒƒƒƒƒƒƒƒƒƒƒƒƒƒƒƒƒƒƒƒƒƒƒƒƒ2296500 1998 9 0.0025 1.2000 2.4000 3.4669 3.0000 10.00001999 12 0.0025 0.0025 4.5000 3.8342 6.0000 9.00002000 11 0.0025 0.0025 0.0025 0.4568 0.0025 5.00002001 12 0.0025 0.0025 0.0025 1.7517 4.0000 7.00002296750 1998 9 1.2500 4.8000 5.4000 8.6222 9.7500 26.00001999 12 0.0025 2.0013 5.5000 6.3340 9.5000 16.00002000 11 0.0025 0.0025 0.0025 1.5475 0.0025 13.00002001 12 0.0025 0.0025 0.0025 2.4181 4.5000 10.00002297100 1998 3 2.8000 2.8000 4.0000 5.9333 11.0000 11.00001999 12 0.0025 0.4150 1.3950 2.1711 3.3800 8.04002000 11 0.0025 1.2800 5.5000 5.2659 10.0000 11.00002001 12 0.0025 0.0025 4.0000 5.5842 10.5000 17.00002297155 1998 9 0.0025 0.0025 1.5000 2.5900 2.8000 10.00001999 12 0.0208 0.1545 0.4673 1.6751 1.7092 10.94002000 11 0.0025 0.1700 3.0000 9.7349 10.0000 51.00002001 12 0.0025 0.0025 0.0025 1.6681 3.5000 7.00002297310 1998 9 0.0025 1.0000 1.6000 3.1228 4.0000 10.00001999 11 0.1122 0.4141 0.7400 1.1676 1.8367 3.24492000 10 0.0025 0.0025 3.3000 4.3298 8.0000 15.00002001 12 0.0025 0.0025 4.5000 5.0844 9.0000 18.0000A-6
TSS, BY STATION AND WATER YEARGAGE_NUM WY N Minimum 25th Pctl 50th Pctl Mean 75th Pctl Maximumƒƒƒƒƒƒƒƒƒƒƒƒƒƒƒƒƒƒƒƒƒƒƒƒƒƒƒƒƒƒƒƒƒƒƒƒƒƒƒƒƒƒƒƒƒƒƒƒƒƒƒƒƒƒƒƒƒƒƒƒƒƒƒƒƒƒƒƒƒƒƒƒƒƒƒƒƒƒƒƒƒƒƒƒƒƒƒƒƒƒƒƒƒƒƒƒƒƒƒƒƒƒƒƒƒƒƒƒƒƒƒƒƒƒƒ2298202 1998 9 1.0000 1.5000 3.0000 2.7111 3.6000 4.40001999 12 1.6000 2.0000 2.6500 2.8750 3.5500 5.30002000 12 0.8000 1.8500 2.6500 2.9667 3.2000 10.00002001 12 0.0025 1.4000 1.8500 4.0002 4.2000 20.00002298608 1999 12 0.0025 0.3100 0.5350 1.0044 1.5017 3.86872000 10 0.0025 3.0000 5.2950 4.9468 6.0000 10.00002001 12 0.0025 0.0025 3.0000 11.5010 9.0000 90.00002298830 1999 12 0.9000 1.0889 1.2575 2.2142 3.0450 6.74512000 10 0.0025 1.0000 1.6150 4.9207 3.0000 24.00002001 12 0.0025 0.0025 4.5000 5.9175 9.0000 25.00002299120 1999 11 0.6400 1.7800 2.7400 3.3084 4.6723 7.28852000 11 0.0025 2.3100 6.1010 13.0149 17.0000 53.00002001 12 1.0000 2.0000 6.0000 8.2083 11.2500 24.00002299410 1999 10 0.1900 0.9800 4.1086 4.1586 5.3939 13.77552000 10 3.7800 6.0000 9.8027 15.2280 20.8947 47.00002001 12 0.0025 1.0000 2.5000 5.2504 11.5000 14.00002299455 1999 11 0.0025 0.1500 3.0000 4.4974 8.6824 12.06152000 11 0.0025 2.0000 6.3047 7.0852 11.0000 18.50002001 11 0.0025 0.0025 0.0025 6.0014 14.0000 26.0000ƒƒƒƒƒƒƒƒƒƒƒƒƒƒƒƒƒƒƒƒƒƒƒƒƒƒƒƒƒƒƒƒƒƒƒƒƒƒƒƒƒƒƒƒƒƒƒƒƒƒƒƒƒƒƒƒƒƒƒƒƒƒƒƒƒƒƒƒƒƒƒƒƒƒƒƒƒƒƒƒƒƒƒƒƒƒƒƒƒƒƒƒƒƒƒƒƒƒƒƒƒƒƒƒƒƒƒƒƒƒƒƒƒƒƒA-7
COLOR (PCU), BY STATION AND WATERGAGE_NUM WY N Minimum 25th Pctl 50th Pctl Mean 75th Pctl Maximumƒƒƒƒƒƒƒƒƒƒƒƒƒƒƒƒƒƒƒƒƒƒƒƒƒƒƒƒƒƒƒƒƒƒƒƒƒƒƒƒƒƒƒƒƒƒƒƒƒƒƒƒƒƒƒƒƒƒƒƒƒƒƒƒƒƒƒƒƒƒƒƒƒƒƒƒƒƒƒƒƒƒƒƒƒƒƒƒƒƒƒƒƒƒƒƒƒƒƒƒƒƒƒƒƒƒƒƒƒƒƒƒƒƒƒ2293987 1998 9 140.0000 223.0000 264.0000 252.8889 303.0000 350.00001999 12 125.0000 162.5000 225.0000 208.3333 250.0000 300.00002000 11 2.5000 70.0000 150.0000 159.7727 255.0000 325.00002001 12 80.0000 80.0000 120.0000 138.7500 170.0000 300.00002294491 1998 8 55.0000 66.5000 85.5000 91.8750 112.0000 152.00001999 12 35.0000 40.0000 45.0000 52.0833 60.0000 100.00002000 11 35.0000 40.0000 50.0000 56.3636 75.0000 90.00002001 10 50.0000 65.0000 77.5000 81.0000 80.0000 140.00002294650 1998 9 143.0000 158.0000 195.0000 198.9444 221.0000 320.00001999 12 85.0000 137.5000 162.5000 171.6667 212.5000 300.00002000 11 35.0000 65.0000 175.0000 156.3636 250.0000 300.00002001 12 40.0000 62.5000 80.0000 107.9167 145.0000 275.00002294898 1998 9 50.0000 130.0000 150.0000 140.2222 178.0000 187.00001999 12 30.0000 40.0000 67.5000 87.0833 112.5000 225.00002000 11 20.0000 30.0000 70.0000 86.3636 150.0000 225.00002001 12 15.0000 22.5000 37.5000 53.7500 47.5000 250.00002295637 1998 9 60.0000 92.0000 158.0000 134.8889 180.0000 197.00001999 12 30.0000 40.0000 92.5000 85.4167 112.5000 200.00002000 11 15.0000 20.0000 60.0000 86.3636 165.0000 200.00002001 12 15.0000 22.5000 32.5000 78.3333 140.0000 225.0000A-8
COLOR, BY STATION AND WATERGAGE_NUM WY N Minimum 25th Pctl 50th Pctl Mean 75th Pctl Maximumƒƒƒƒƒƒƒƒƒƒƒƒƒƒƒƒƒƒƒƒƒƒƒƒƒƒƒƒƒƒƒƒƒƒƒƒƒƒƒƒƒƒƒƒƒƒƒƒƒƒƒƒƒƒƒƒƒƒƒƒƒƒƒƒƒƒƒƒƒƒƒƒƒƒƒƒƒƒƒƒƒƒƒƒƒƒƒƒƒƒƒƒƒƒƒƒƒƒƒƒƒƒƒƒƒƒƒƒƒƒƒƒƒƒƒ2296500 1998 9 70.0000 231.0000 340.0000 274.4444 343.0000 377.00001999 12 60.0000 87.5000 175.0000 225.8333 350.0000 500.00002000 11 50.0000 60.0000 120.0000 153.6364 250.0000 400.00002001 3 40.0000 40.0000 400.0000 313.3333 500.0000 500.00002296750 1998 9 60.0000 106.0000 179.0000 157.6667 214.0000 222.50001999 12 40.0000 62.5000 90.0000 130.0000 200.0000 300.00002000 11 40.0000 50.0000 60.0000 99.0909 120.0000 300.00002001 3 50.0000 50.0000 60.0000 136.6667 300.0000 300.00002297100 1998 3 90.0000 90.0000 109.0000 123.0000 170.0000 170.00001999 12 40.0000 55.0000 77.5000 105.4167 125.0000 300.00002000 11 25.0000 30.0000 60.0000 79.7727 100.0000 250.00002001 12 30.0000 37.5000 58.7500 80.6250 115.0000 240.00002297155 1998 9 104.0000 152.0000 321.0000 295.7778 374.0000 520.00001999 12 60.0000 105.0000 212.5000 234.5833 325.0000 500.00002000 11 30.0000 45.0000 90.0000 95.0000 120.0000 250.00002001 12 45.0000 57.5000 85.0000 162.5000 312.5000 400.00002297310 1998 9 66.0000 95.0000 261.0000 213.2222 274.0000 336.00001999 11 30.0000 70.0000 150.0000 190.9091 250.0000 500.00002000 10 25.0000 35.0000 107.5000 100.0000 150.0000 200.00002001 12 15.0000 42.5000 65.0000 136.8750 267.5000 350.0000A-9
COLOR, BY STATION AND WATER YEARGAGE_NUM WY N Minimum 25th Pctl 50th Pctl Mean 75th Pctl Maximumƒƒƒƒƒƒƒƒƒƒƒƒƒƒƒƒƒƒƒƒƒƒƒƒƒƒƒƒƒƒƒƒƒƒƒƒƒƒƒƒƒƒƒƒƒƒƒƒƒƒƒƒƒƒƒƒƒƒƒƒƒƒƒƒƒƒƒƒƒƒƒƒƒƒƒƒƒƒƒƒƒƒƒƒƒƒƒƒƒƒƒƒƒƒƒƒƒƒƒƒƒƒƒƒƒƒƒƒƒƒƒƒƒƒƒ2298202 1998 9 56.5000 73.0000 173.0000 144.4444 194.0000 210.00001999 12 45.0000 65.0000 129.0000 128.3333 185.0000 218.00002000 8 40.0000 43.0000 58.5000 95.3750 150.0000 220.00002001 12 49.0000 52.0000 85.0000 108.1667 115.0000 340.00002298608 1999 12 70.0000 92.5000 112.5000 140.8333 200.0000 250.00002000 10 40.0000 65.0000 100.0000 120.0000 150.0000 300.00002001 12 40.0000 75.0000 95.0000 108.3333 142.5000 195.00002298830 1999 12 70.0000 85.0000 137.5000 166.0417 237.5000 300.00002000 10 42.5000 55.0000 117.5000 126.2500 200.0000 225.00002001 12 10.0000 62.5000 90.0000 124.5833 202.5000 260.00002299120 1999 11 25.0000 150.0000 200.0000 198.6364 300.0000 325.00002000 11 20.0000 110.0000 220.0000 193.1818 270.0000 350.00002001 12 30.0000 42.5000 113.7500 131.0417 200.0000 300.00002299410 1999 10 30.0000 50.0000 100.0000 180.5000 300.0000 500.00002000 10 30.0000 70.0000 132.5000 148.5000 200.0000 325.00002001 12 25.0000 47.5000 80.0000 120.8333 210.0000 280.00002299455 1999 11 30.0000 60.0000 125.0000 169.3182 300.0000 350.00002000 11 30.0000 45.0000 100.0000 140.0000 240.0000 350.00002001 11 30.0000 40.0000 80.0000 106.5909 200.0000 210.0000ƒƒƒƒƒƒƒƒƒƒƒƒƒƒƒƒƒƒƒƒƒƒƒƒƒƒƒƒƒƒƒƒƒƒƒƒƒƒƒƒƒƒƒƒƒƒƒƒƒƒƒƒƒƒƒƒƒƒƒƒƒƒƒƒƒƒƒƒƒƒƒƒƒƒƒƒƒƒƒƒƒƒƒƒƒƒƒƒƒƒƒƒƒƒƒƒƒƒƒƒƒƒƒƒƒƒƒƒƒƒƒƒƒƒƒA-10
pH, BY STATION AND WATER YEARGAGE_NUM WY N Minimum 25th Pctl 50th Pctl Mean 75th Pctl Maximumƒƒƒƒƒƒƒƒƒƒƒƒƒƒƒƒƒƒƒƒƒƒƒƒƒƒƒƒƒƒƒƒƒƒƒƒƒƒƒƒƒƒƒƒƒƒƒƒƒƒƒƒƒƒƒƒƒƒƒƒƒƒƒƒƒƒƒƒƒƒƒƒƒƒƒƒƒƒƒƒƒƒƒƒƒƒƒƒƒƒƒƒƒƒƒƒƒƒƒƒƒƒƒƒƒƒƒƒƒƒƒƒƒƒƒ2293987 1998 9 5.9200 6.4800 6.5300 6.6800 6.8800 7.48001999 12 5.9000 6.7050 6.9850 6.8525 7.0350 7.37002000 11 6.0300 6.6000 6.9200 6.8636 7.1500 7.40002001 12 6.5900 6.7500 6.9950 7.0417 7.3200 7.5<strong>2002</strong>294491 1998 8 6.9100 7.4550 8.6100 8.2900 9.0600 9.16001999 12 7.4300 7.9600 8.1800 8.3642 8.8100 9.61002000 11 6.5100 7.4100 8.3200 8.0327 8.7000 9.16002001 10 6.7600 7.2100 7.3500 7.6260 8.4000 8.95002294650 1998 9 6.2000 6.8100 6.9300 6.8667 7.0300 7.27001999 12 6.4500 7.0350 7.0550 7.1008 7.2400 7.56002000 11 6.1000 6.6400 7.0200 6.8845 7.2100 7.29002001 12 6.3400 6.8650 7.2400 7.1983 7.5450 7.89002294898 1998 8 6.6800 7.0400 7.1750 7.1900 7.4350 7.54001999 12 6.7300 7.3600 7.4850 7.4300 7.5950 7.84002000 11 7.0400 7.3300 7.4200 7.4936 7.6200 8.07002001 12 7.1900 7.3050 7.6250 7.7525 7.9850 9.13002295637 1998 9 6.7500 7.2700 7.3800 7.4133 7.4800 8.00001999 12 6.9200 7.5600 7.7100 7.6358 7.8100 7.87002000 11 7.1700 7.3400 7.5800 7.8509 8.1900 8.98002001 12 6.6000 7.4950 7.9250 7.9158 8.6350 9.0700A-11
pH, BY STATION AND WATER YEARGAGE_NUM WY N Minimum 25th Pctl 50th Pctl Mean 75th Pctl Maximumƒƒƒƒƒƒƒƒƒƒƒƒƒƒƒƒƒƒƒƒƒƒƒƒƒƒƒƒƒƒƒƒƒƒƒƒƒƒƒƒƒƒƒƒƒƒƒƒƒƒƒƒƒƒƒƒƒƒƒƒƒƒƒƒƒƒƒƒƒƒƒƒƒƒƒƒƒƒƒƒƒƒƒƒƒƒƒƒƒƒƒƒƒƒƒƒƒƒƒƒƒƒƒƒƒƒƒƒƒƒƒƒƒƒƒ2296500 1998 9 6.4800 6.5300 6.7800 6.7622 6.9800 7.08001999 12 6.4300 6.6800 7.0850 6.9217 7.1500 7.24002000 11 6.7000 6.8700 7.1800 7.1173 7.3500 7.48002001 12 5.9800 6.7050 7.0900 7.0808 7.5600 7.85002296750 1998 9 6.8100 7.1000 7.1700 7.2644 7.3400 8.00001999 12 6.8100 7.3000 7.5700 7.5092 7.7200 8.18002000 11 7.1000 7.4300 7.7800 7.7500 8.1100 8.18002001 12 6.2900 6.9700 8.1850 7.8458 8.7050 8.97002297100 1998 3 7.0000 7.0000 7.2300 7.3033 7.6800 7.68001999 12 6.9400 7.3500 7.4350 7.4033 7.5800 7.64002000 11 6.5400 7.4000 7.6300 7.5464 7.7400 8.05002001 12 6.6400 7.3850 7.6550 7.5925 7.9400 8.1<strong>2002</strong>297155 1998 9 6.0000 6.5500 6.6800 6.8244 7.3700 7.52001999 12 6.3000 6.7700 6.9450 6.9900 7.3200 7.61002000 11 6.5800 7.1300 7.3100 7.3355 7.5800 8.27002001 12 5.6000 6.7550 7.1400 6.9375 7.4000 7.53002297310 1998 9 6.5500 6.5700 6.9600 6.8744 7.0600 7.32001999 11 6.2900 6.8000 7.0500 7.0673 7.3700 7.79002000 10 6.6600 6.9900 7.3200 7.2360 7.4700 7.66002001 12 5.4800 6.6400 7.3550 7.0717 7.5800 7.8100A-12
pH, BY STATION AND WATER YEARGAGE_NUM WY N Minimum 25th Pctl 50th Pctl Mean 75th Pctl Maximumƒƒƒƒƒƒƒƒƒƒƒƒƒƒƒƒƒƒƒƒƒƒƒƒƒƒƒƒƒƒƒƒƒƒƒƒƒƒƒƒƒƒƒƒƒƒƒƒƒƒƒƒƒƒƒƒƒƒƒƒƒƒƒƒƒƒƒƒƒƒƒƒƒƒƒƒƒƒƒƒƒƒƒƒƒƒƒƒƒƒƒƒƒƒƒƒƒƒƒƒƒƒƒƒƒƒƒƒƒƒƒƒƒƒƒ2298202 1998 9 6.9100 7.1200 7.2500 7.2789 7.5000 7.57001999 12 7.1000 7.2450 7.5450 7.5075 7.7000 7.95002000 12 7.0300 7.4100 7.7600 7.7017 8.0100 8.11002001 12 6.8700 7.7300 7.7900 7.7958 8.0400 8.41002298608 1999 12 6.4200 6.6050 6.8700 6.9600 7.1100 7.85002000 10 6.3000 6.8000 7.1450 7.0380 7.2800 7.51002001 12 5.9900 6.5150 7.1800 7.0208 7.3550 8.4<strong>2002</strong>298830 1999 12 6.2300 6.5900 7.0100 7.0125 7.3000 8.06002000 10 6.3000 7.0200 7.2950 7.1340 7.3600 7.64002001 12 5.6200 6.4000 6.8850 6.8150 7.3300 7.5<strong>2002</strong>299120 1999 11 6.0600 6.4800 7.0000 6.9345 7.3200 8.03002000 11 5.9500 6.7100 7.0200 6.9591 7.3400 7.60002001 12 5.4400 6.3000 7.0350 6.7450 7.2450 7.30002299410 1999 10 6.5100 6.7200 7.3450 7.2140 7.5400 7.80002000 10 6.4600 6.7300 7.0850 7.0570 7.3900 7.5<strong>2002</strong>001 12 5.9200 6.9950 7.2750 7.1800 7.6050 7.99002299455 1999 11 6.9100 7.0000 7.3200 7.2955 7.4300 7.94002000 10 6.6600 6.8800 7.3300 7.2390 7.5600 7.8<strong>2002</strong>001 11 5.8300 6.6900 7.0700 6.9927 7.3700 7.7600A-13
SPEC. COND. (uS/CM), BY STATION AND WATER YEARGAGE_NUM WY N Minimum 25th Pctl 50th Pctl Mean 75th Pctl Maximumƒƒƒƒƒƒƒƒƒƒƒƒƒƒƒƒƒƒƒƒƒƒƒƒƒƒƒƒƒƒƒƒƒƒƒƒƒƒƒƒƒƒƒƒƒƒƒƒƒƒƒƒƒƒƒƒƒƒƒƒƒƒƒƒƒƒƒƒƒƒƒƒƒƒƒƒƒƒƒƒƒƒƒƒƒƒƒƒƒƒƒƒƒƒƒƒƒƒƒƒƒƒƒƒƒƒƒƒƒƒƒƒƒƒƒ2293987 1998 9 126.7000 159.0000 209.0000 221.9667 270.0000 405.00001999 12 125.0000 228.5000 297.5000 316.7500 408.5000 563.00002000 11 132.3000 228.0000 268.0000 347.7545 514.0000 646.00002001 12 238.0000 383.0000 484.5000 453.4167 545.0000 601.00002294491 1998 8 147.8000 156.5000 173.0000 173.3500 191.0000 198.00001999 12 147.0000 178.0000 202.0000 196.4167 216.0000 246.00002000 11 173.0000 201.0000 221.0000 228.5455 244.0000 324.00002001 10 125.0000 236.0000 291.5000 314.0000 413.0000 456.00002294650 1998 9 129.3000 157.0000 191.0000 216.1444 264.0000 350.00001999 12 131.0000 212.0000 304.5000 313.0000 359.5000 683.00002000 11 151.0000 219.0000 244.0000 326.6364 426.0000 669.00002001 12 255.0000 341.5000 433.0000 425.5833 500.0000 645.00002294898 1998 8 182.0000 194.0000 263.5000 307.2500 405.5000 550.00001999 12 172.0000 324.5000 404.5000 398.4167 483.5000 570.00002000 11 241.0000 293.0000 403.0000 426.0909 574.0000 685.00002001 12 242.0000 308.0000 365.0000 383.5000 471.5000 585.00002295637 1998 9 194.0000 219.0000 339.0000 316.0000 390.0000 450.00001999 12 215.0000 339.5000 400.5000 404.5833 476.5000 555.00002000 11 278.0000 363.0000 478.0000 479.0909 636.0000 733.00002001 12 257.0000 422.0000 522.0000 481.5000 550.0000 677.0000A-14
SPEC. COND., BY STATION AND WATER YEARGAGE_NUM WY N Minimum 25th Pctl 50th Pctl Mean 75th Pctl Maximumƒƒƒƒƒƒƒƒƒƒƒƒƒƒƒƒƒƒƒƒƒƒƒƒƒƒƒƒƒƒƒƒƒƒƒƒƒƒƒƒƒƒƒƒƒƒƒƒƒƒƒƒƒƒƒƒƒƒƒƒƒƒƒƒƒƒƒƒƒƒƒƒƒƒƒƒƒƒƒƒƒƒƒƒƒƒƒƒƒƒƒƒƒƒƒƒƒƒƒƒƒƒƒƒƒƒƒƒƒƒƒƒƒƒƒ2296500 1998 9 122.0000 127.9000 149.7000 192.9667 282.0000 333.00001999 12 117.0000 163.5000 215.5000 240.5000 308.5000 409.00002000 10 119.0000 229.0000 310.5000 315.7000 434.0000 464.00002001 12 193.0000 294.5000 461.5000 426.5000 548.0000 654.00002296750 1998 9 194.0000 210.0000 335.0000 302.3333 379.0000 436.00001999 12 182.0000 301.5000 351.5000 377.0000 479.5000 599.00002000 11 230.0000 410.0000 472.0000 476.3636 560.0000 650.00002001 12 232.0000 339.5000 593.5000 503.6667 625.0000 648.00002297100 1998 3 683.0000 683.0000 893.0000 845.3333 960.0000 960.00001999 12 389.0000 779.0000 830.5000 896.4167 1054.5000 1495.00002000 11 456.0000 1020.0000 1116.0000 1243.0909 1773.0000 1989.00002001 12 761.0000 1017.5000 1394.0000 1484.0833 1906.5000 2468.00002297155 1998 9 72.7000 96.0000 119.0000 139.9000 171.0000 248.00001999 12 76.0000 109.0000 140.5000 145.0833 181.0000 218.00002000 11 98.0000 180.0000 226.0000 225.0909 286.0000 372.00002001 12 84.0000 158.0000 241.0000 233.8333 307.5000 401.00002297310 1998 9 130.7000 141.7000 245.0000 328.9889 469.0000 739.00001999 11 86.0000 290.0000 352.0000 426.6364 611.0000 817.00002000 10 379.0000 475.0000 544.0000 606.0000 772.0000 907.00002001 12 146.0000 318.0000 687.0000 587.6667 827.0000 872.0000A-15
SPEC. COND., BY STATION AND WATER YEARGAGE_NUM WY N Minimum 25th Pctl 50th Pctl Mean 75th Pctl Maximumƒƒƒƒƒƒƒƒƒƒƒƒƒƒƒƒƒƒƒƒƒƒƒƒƒƒƒƒƒƒƒƒƒƒƒƒƒƒƒƒƒƒƒƒƒƒƒƒƒƒƒƒƒƒƒƒƒƒƒƒƒƒƒƒƒƒƒƒƒƒƒƒƒƒƒƒƒƒƒƒƒƒƒƒƒƒƒƒƒƒƒƒƒƒƒƒƒƒƒƒƒƒƒƒƒƒƒƒƒƒƒƒƒƒƒ2298202 1998 9 418.0000 483.0000 595.0000 682.7778 866.0000 993.00001999 12 484.0000 546.5000 626.0000 669.7500 799.0000 941.00002000 12 484.0000 749.0000 894.0000 880.0833 1029.5000 1204.00002001 12 442.0000 863.0000 1152.0000 1151.5833 1432.5000 2010.00002298608 1999 12 164.0000 233.5000 296.5000 353.0000 499.0000 595.00002000 10 119.0000 344.0000 429.5000 462.2000 578.0000 859.00002001 12 227.0000 293.5000 456.0000 440.6667 520.5000 763.00002298830 1999 12 133.0000 218.5000 262.0000 339.3750 442.5000 695.00002000 10 200.0000 370.0000 417.0000 464.5000 624.0000 809.00002001 12 149.0000 245.0000 397.0000 415.4167 571.0000 710.00002299120 1999 11 58.0000 91.2000 129.0000 222.7364 423.0000 533.00002000 11 70.0000 97.0000 290.0000 271.6091 405.0000 480.00002001 12 78.0000 96.5000 391.0000 330.9167 521.0000 538.00002299410 1999 10 324.0000 356.0000 609.5000 701.0000 849.0000 1419.00002000 10 298.0000 358.0000 433.0000 514.8000 642.0000 914.00002001 12 166.0000 345.5000 690.5000 683.9167 1031.5000 1237.00002299455 1999 11 255.0000 294.0000 554.0000 620.9091 925.0000 1276.00002000 10 203.0000 356.0000 776.5000 712.1000 1116.0000 1236.00002001 11 138.0000 289.0000 626.0000 634.0000 1105.0000 1265.0000A-16
DO (MG/L), BY STATION AND WATER YEARGAGE_NUM WY N Minimum 25th Pctl 50th Pctl Mean 75th Pctl Maximumƒƒƒƒƒƒƒƒƒƒƒƒƒƒƒƒƒƒƒƒƒƒƒƒƒƒƒƒƒƒƒƒƒƒƒƒƒƒƒƒƒƒƒƒƒƒƒƒƒƒƒƒƒƒƒƒƒƒƒƒƒƒƒƒƒƒƒƒƒƒƒƒƒƒƒƒƒƒƒƒƒƒƒƒƒƒƒƒƒƒƒƒƒƒƒƒƒƒƒƒƒƒƒƒƒƒƒƒƒƒƒƒƒƒƒ2293987 1998 9 2.0000 2.9000 3.8800 4.1633 4.8600 7.47001999 12 0.8000 3.3900 4.0650 4.7542 6.6250 8.0<strong>2002</strong>000 11 0.2400 0.7000 1.7600 3.1782 6.1000 8.34002001 12 0.3200 1.7700 3.3100 3.4783 5.3350 6.54002294491 1998 8 1.7000 3.0950 6.3650 5.5350 7.3600 8.94001999 12 2.9200 4.5150 5.4100 6.1133 7.8200 10.86002000 11 1.7500 4.4400 6.8100 6.3082 7.9700 11.61002001 10 0.3100 2.1200 4.1200 4.7190 5.4900 15.56002294650 1998 9 1.9700 2.8600 3.4100 3.9900 4.7500 6.71001999 12 2.7100 2.8750 3.7000 4.7142 6.7300 8.53002000 11 0.0500 1.1100 2.5000 3.2045 5.6100 8.13002001 12 1.0000 2.4300 4.2600 4.3233 6.2100 7.88002294898 1998 8 5.0000 5.1100 5.4850 5.6938 5.9800 7.40001999 12 4.4500 5.2850 6.6700 6.6200 7.8050 8.7<strong>2002</strong>000 11 4.3100 5.0800 7.8000 7.1727 8.5900 12.23002001 12 3.0900 5.7550 8.8550 8.3458 10.6550 13.24002295637 1998 9 6.1200 6.4100 7.0000 7.0956 7.4000 8.74001999 12 4.8500 6.6800 7.5900 7.4258 8.2000 9.69002000 11 5.7500 6.7700 8.3100 8.5109 9.6800 11.58002001 12 5.4800 6.4050 9.5250 9.0725 11.2350 12.6000A-17
DO, BY STATION AND WATER YEARGAGE_NUM WY N Minimum 25th Pctl 50th Pctl Mean 75th Pctl Maximumƒƒƒƒƒƒƒƒƒƒƒƒƒƒƒƒƒƒƒƒƒƒƒƒƒƒƒƒƒƒƒƒƒƒƒƒƒƒƒƒƒƒƒƒƒƒƒƒƒƒƒƒƒƒƒƒƒƒƒƒƒƒƒƒƒƒƒƒƒƒƒƒƒƒƒƒƒƒƒƒƒƒƒƒƒƒƒƒƒƒƒƒƒƒƒƒƒƒƒƒƒƒƒƒƒƒƒƒƒƒƒƒƒƒƒ2296500 1998 9 4.4600 5.8700 6.0000 6.2389 6.7900 7.72001999 12 3.8600 5.7100 6.8950 6.6167 7.7900 8.66002000 10 5.1900 5.3400 7.2400 7.1130 7.9900 10.84002001 11 3.0400 4.9700 5.9500 6.8764 9.6700 11.28002296750 1998 9 6.0900 6.2900 6.4400 6.8889 7.5800 8.24001999 12 4.1400 6.8400 7.2350 7.2617 8.1200 8.98002000 11 5.3200 7.5000 8.3300 8.3582 9.1400 12.40002001 11 3.8800 4.9600 9.6500 8.6264 11.7100 14.56002297100 1998 3 5.9000 5.9000 7.0000 6.7000 7.2000 7.20001999 11 5.5400 6.8200 7.4600 7.3573 8.0600 8.4<strong>2002</strong>000 11 5.3800 6.5100 7.5100 8.9845 9.7600 20.21002001 11 4.5600 6.0200 8.8100 8.5045 11.1500 11.35002297155 1998 9 4.7700 6.5100 7.5800 7.3011 8.0700 9.12001999 12 4.7200 6.6600 7.8750 7.6167 8.5650 9.40002000 11 4.4200 5.9300 7.4600 7.3464 8.7200 10.69002001 12 5.2500 5.7550 6.5550 6.8483 7.3500 10.91002297310 1998 9 5.8200 6.1500 6.8200 6.6967 7.0100 7.50001999 11 4.8200 6.4400 7.3500 7.1027 8.0500 8.27002000 10 3.9400 5.7700 7.8650 7.6570 9.2900 11.25002001 12 4.1100 5.2700 8.0550 8.0258 10.6450 11.9200A-18
DO, BY STATION AND WATER YEARGAGE_NUM WY N Minimum 25th Pctl 50th Pctl Mean 75th Pctl Maximumƒƒƒƒƒƒƒƒƒƒƒƒƒƒƒƒƒƒƒƒƒƒƒƒƒƒƒƒƒƒƒƒƒƒƒƒƒƒƒƒƒƒƒƒƒƒƒƒƒƒƒƒƒƒƒƒƒƒƒƒƒƒƒƒƒƒƒƒƒƒƒƒƒƒƒƒƒƒƒƒƒƒƒƒƒƒƒƒƒƒƒƒƒƒƒƒƒƒƒƒƒƒƒƒƒƒƒƒƒƒƒƒƒƒƒ2298202 1998 9 2.0000 3.4800 4.5100 4.5567 4.9900 8.02001999 12 1.4000 2.9150 5.1200 5.0158 6.9450 8.79002000 12 1.3800 5.4950 6.6450 6.3142 7.7050 8.9<strong>2002</strong>001 11 5.3300 7.5000 8.3000 8.0200 8.7700 9.55002298608 1999 12 3.3100 4.1200 5.9750 5.8392 6.8700 8.85002000 10 3.4700 4.2600 6.0150 6.3490 7.9600 10.06002001 12 2.1000 3.5650 7.7100 7.0367 9.5400 12.5<strong>2002</strong>298830 1999 12 0.2200 0.5900 5.1600 3.9433 5.7750 7.43002000 10 0.0500 1.1600 6.1500 5.1830 7.1100 11.33002001 12 1.2300 1.9550 5.1050 4.9600 8.2150 9.8<strong>2002</strong>299120 1999 11 3.7600 4.0600 7.4200 6.6191 8.2500 10.07002000 11 1.0800 3.2500 4.8000 5.2664 6.2300 11.64002001 12 1.1900 3.3500 4.1050 4.2533 5.4300 7.51002299410 1999 10 3.2300 5.3300 6.0000 6.1060 6.7500 8.74002000 10 2.3100 4.5800 5.4050 5.9060 7.7600 9.63002001 12 2.3600 3.5100 5.5300 6.0183 8.0500 12.31002299455 1999 10 3.4500 5.3700 6.5100 6.6280 8.6200 9.21002000 10 1.7600 4.3300 5.8500 6.8000 8.1100 16.75002001 11 0.5900 3.3000 4.9900 4.9373 6.3200 10.2900ƒƒƒƒƒƒƒƒƒƒƒƒƒƒƒƒƒƒƒƒƒƒƒƒƒƒƒƒƒƒƒƒƒƒƒƒƒƒƒƒƒƒƒƒƒƒƒƒƒƒƒƒƒƒƒƒƒƒƒƒƒƒƒƒƒƒƒƒƒƒƒƒƒƒƒƒƒƒƒƒƒƒƒƒƒƒƒƒƒƒƒƒƒƒƒƒƒƒƒƒƒƒƒƒƒƒƒƒƒƒƒƒƒƒƒA-19
CHLA [MONOCHROMATIC, uG/L], BY STATION AND WATER YEARGAGE_NUM WY N Minimum 25th Pctl 50th Pctl Mean 75th Pctl Maximumƒƒƒƒƒƒƒƒƒƒƒƒƒƒƒƒƒƒƒƒƒƒƒƒƒƒƒƒƒƒƒƒƒƒƒƒƒƒƒƒƒƒƒƒƒƒƒƒƒƒƒƒƒƒƒƒƒƒƒƒƒƒƒƒƒƒƒƒƒƒƒƒƒƒƒƒƒƒƒƒƒƒƒƒƒƒƒƒƒƒƒƒƒƒƒƒƒƒƒƒƒƒƒƒƒƒƒƒƒƒƒƒƒƒƒ2293987 1998 9 0.5000 0.5000 0.5000 1.4567 0.5000 8.54001999 12 0.5000 1.7950 2.8050 4.3933 4.3650 20.40002000 11 0.5000 0.5000 0.5000 3.0250 5.7150 12.30002001 12 0.5000 0.5000 0.5000 0.8142 0.5000 4.27002294491 1998 8 53.4000 88.1000 114.8000 136.8324 184.2300 266.99901999 12 82.2500 98.7500 154.0850 172.5433 226.0000 333.00002000 11 13.4000 32.0000 66.8000 128.1727 117.0000 512.00002001 10 0.5000 21.4000 151.3500 187.9000 260.0000 612.00002294650 1998 9 0.5000 6.4100 18.7000 22.7167 35.6000 69.40001999 12 1.2700 2.0900 3.9500 29.9908 36.6650 155.00002000 11 0.5000 0.5000 2.6700 18.3227 20.3000 119.00002001 12 0.5000 0.5000 0.5000 1.9758 0.5000 10.70002294898 1998 9 0.5000 0.5000 11.6000 16.5522 24.0000 64.10001999 12 0.5000 0.5000 1.6950 14.9708 23.8050 64.20002000 11 0.5000 0.5000 1.0700 8.7318 11.2000 47.70002001 12 0.5000 0.5000 0.5000 1.9750 0.5000 17.10002295637 1998 8 0.5000 0.5000 4.6750 14.0063 10.7000 79.80001999 12 1.0800 1.2800 2.4450 5.8304 8.7100 23.00002000 11 0.5000 0.5000 1.1300 5.6118 6.9400 23.50002001 12 0.5000 0.5000 0.5000 0.5000 0.5000 0.5000A-20
CHLA [MONOCHROMATIC], BY STATION AND WATER YEARGAGE_NUM WY N Minimum 25th Pctl 50th Pctl Mean 75th Pctl Maximumƒƒƒƒƒƒƒƒƒƒƒƒƒƒƒƒƒƒƒƒƒƒƒƒƒƒƒƒƒƒƒƒƒƒƒƒƒƒƒƒƒƒƒƒƒƒƒƒƒƒƒƒƒƒƒƒƒƒƒƒƒƒƒƒƒƒƒƒƒƒƒƒƒƒƒƒƒƒƒƒƒƒƒƒƒƒƒƒƒƒƒƒƒƒƒƒƒƒƒƒƒƒƒƒƒƒƒƒƒƒƒƒƒƒƒ2296500 1998 9 0.5000 0.5000 0.5000 0.5000 0.5000 0.50001999 6 0.5000 0.5000 2.0250 1.7033 2.5200 2.65002000 11 0.5000 0.5000 0.5000 0.5000 0.5000 0.50002001 12 0.5000 0.5000 0.5000 1.0333 1.0500 4.50002296750 1998 9 0.5000 0.5000 2.9350 5.8211 4.8100 26.70001999 6 1.1600 1.9000 3.1750 3.2017 4.2700 5.53002000 11 0.5000 0.5000 0.5000 0.9527 0.5000 5.48002001 12 0.5000 0.5000 0.5000 1.1750 1.7500 4.40002297100 1998 3 0.5000 0.5000 0.5000 0.5000 0.5000 0.50001999 12 0.5000 0.5000 0.5000 1.1567 1.5650 3.37002000 11 0.5000 0.5000 0.5000 1.5536 2.1400 6.14002001 12 0.5000 0.5000 0.5000 0.5000 0.5000 0.50002297155 1998 9 0.5000 0.5000 0.5000 0.9033 0.5000 3.56001999 12 0.5000 0.5000 1.0550 1.2171 1.6450 3.36002000 11 0.5000 0.5000 0.5000 12.9700 1.6000 129.00002001 12 0.5000 0.5000 0.5000 0.5700 0.5000 1.34002297310 1998 9 0.5000 0.5000 0.5000 4.0667 0.5000 31.50001999 11 0.5000 0.5000 0.5000 1.3227 1.8400 4.1<strong>2002</strong>000 10 0.5000 0.5000 0.5000 1.8420 2.1400 6.68002001 12 0.5000 0.5000 0.5000 0.9475 0.5000 5.8700A-21
CHLA [MONOCHROMATIC], BY STATION AND WATER YEARGAGE_NUM WY N Minimum 25th Pctl 50th Pctl Mean 75th Pctl Maximumƒƒƒƒƒƒƒƒƒƒƒƒƒƒƒƒƒƒƒƒƒƒƒƒƒƒƒƒƒƒƒƒƒƒƒƒƒƒƒƒƒƒƒƒƒƒƒƒƒƒƒƒƒƒƒƒƒƒƒƒƒƒƒƒƒƒƒƒƒƒƒƒƒƒƒƒƒƒƒƒƒƒƒƒƒƒƒƒƒƒƒƒƒƒƒƒƒƒƒƒƒƒƒƒƒƒƒƒƒƒƒƒƒƒƒ2298202 1998 9 0.5000 0.5000 4.9000 7.0156 11.2000 20.00002298608 1999 11 0.5000 0.5000 1.6700 1.7255 2.4400 3.85002000 10 0.5000 0.5000 0.5000 0.9870 1.3700 2.67002001 12 0.5000 0.5000 0.5000 0.6067 0.5000 1.78002298830 1999 11 0.5000 3.5300 4.3500 6.1068 6.3350 23.30002000 10 0.5000 1.8700 3.4700 6.2590 9.3700 22.90002001 12 0.5000 0.5000 3.2000 6.4825 6.6750 36.80002299120 1999 10 0.5000 1.1000 2.3550 2.6705 4.0600 5.64002000 11 0.5000 0.5000 1.5800 3.1291 2.1400 20.00002001 12 0.5000 0.5000 0.5000 1.8033 1.0500 13.40002299410 1999 9 0.5000 1.2400 2.3000 4.6356 6.1500 19.2<strong>2002</strong>000 10 0.5000 1.6000 2.4100 3.4040 3.2000 9.35002001 12 0.5000 0.5000 0.5000 0.5000 0.5000 0.50002299455 1999 10 0.5000 0.5000 2.6725 3.2285 3.9300 9.25502000 11 0.5000 0.5000 0.5000 1.3505 2.1800 4.00002001 11 0.5000 0.5000 0.5000 0.5000 0.5000 0.5000ƒƒƒƒƒƒƒƒƒƒƒƒƒƒƒƒƒƒƒƒƒƒƒƒƒƒƒƒƒƒƒƒƒƒƒƒƒƒƒƒƒƒƒƒƒƒƒƒƒƒƒƒƒƒƒƒƒƒƒƒƒƒƒƒƒƒƒƒƒƒƒƒƒƒƒƒƒƒƒƒƒƒƒƒƒƒƒƒƒƒƒƒƒƒƒƒƒƒƒƒƒƒƒƒƒƒƒƒƒƒƒƒƒƒƒA-22
NH4-N (MG N/L), BY STATION AND WATER YEARGAGE_NUM WY N Minimum 25th Pctl 50th Pctl Mean 75th Pctl Maximumƒƒƒƒƒƒƒƒƒƒƒƒƒƒƒƒƒƒƒƒƒƒƒƒƒƒƒƒƒƒƒƒƒƒƒƒƒƒƒƒƒƒƒƒƒƒƒƒƒƒƒƒƒƒƒƒƒƒƒƒƒƒƒƒƒƒƒƒƒƒƒƒƒƒƒƒƒƒƒƒƒƒƒƒƒƒƒƒƒƒƒƒƒƒƒƒƒƒƒƒƒƒƒƒƒƒƒƒƒƒƒƒƒƒƒ2293987 1998 9 0.0050 0.0500 0.0850 0.0973 0.1390 0.22201999 12 0.0280 0.0550 0.0810 0.0814 0.1100 0.14002000 11 0.0230 0.0460 0.0760 0.0986 0.1230 0.22902001 12 0.0260 0.0335 0.0500 0.0609 0.0760 0.16202294491 1998 8 0.0050 0.0050 0.0050 0.0144 0.0245 0.04101999 12 0.0050 0.0050 0.0050 0.0168 0.0243 0.07302000 11 0.0050 0.0050 0.0290 0.1989 0.2090 1.26002001 10 0.0180 0.0850 0.1490 1.6577 1.3100 8.19002294650 1998 9 0.0050 0.0110 0.0310 0.0702 0.0950 0.23601999 12 0.0210 0.0425 0.0760 0.0789 0.1160 0.14402000 10 0.0050 0.0250 0.0450 0.0487 0.0690 0.10002001 12 0.0050 0.0270 0.0535 0.0870 0.0780 0.38702294898 1998 9 0.0050 0.0260 0.0390 0.0367 0.0430 0.06901999 12 0.0050 0.0165 0.0335 0.0309 0.0400 0.06102000 11 0.0050 0.0050 0.0360 0.0295 0.0420 0.05602001 12 0.0050 0.0095 0.0200 0.0300 0.0305 0.14702295637 1998 9 0.0050 0.0120 0.0190 0.0241 0.0400 0.06001999 12 0.0050 0.0160 0.0265 0.0355 0.0403 0.12102000 10 0.0050 0.0130 0.0320 0.0295 0.0460 0.05402001 12 0.0050 0.0170 0.0265 0.0310 0.0405 0.0750A-23
NH4-N, BY STATION AND WATER YEARGAGE_NUM WY N Minimum 25th Pctl 50th Pctl Mean 75th Pctl Maximumƒƒƒƒƒƒƒƒƒƒƒƒƒƒƒƒƒƒƒƒƒƒƒƒƒƒƒƒƒƒƒƒƒƒƒƒƒƒƒƒƒƒƒƒƒƒƒƒƒƒƒƒƒƒƒƒƒƒƒƒƒƒƒƒƒƒƒƒƒƒƒƒƒƒƒƒƒƒƒƒƒƒƒƒƒƒƒƒƒƒƒƒƒƒƒƒƒƒƒƒƒƒƒƒƒƒƒƒƒƒƒƒƒƒƒ2296500 1998 9 0.0050 0.0420 0.0510 0.0443 0.0530 0.06701999 12 0.0050 0.0285 0.0360 0.0553 0.0590 0.16002000 11 0.0050 0.0230 0.0380 0.0395 0.0530 0.09702001 12 0.0110 0.0210 0.0290 0.0582 0.0685 0.25002296750 1998 9 0.0050 0.0160 0.0395 0.0417 0.0455 0.09601999 12 0.0190 0.0300 0.0495 0.0498 0.0580 0.1<strong>2002</strong>000 11 0.0200 0.0270 0.0460 0.0481 0.0570 0.11002001 12 0.0110 0.0275 0.0380 0.0563 0.0900 0.13002297100 1998 3 0.0110 0.0110 0.0150 0.0150 0.0190 0.01901999 12 0.0050 0.0115 0.0205 0.0292 0.0430 0.07702000 10 0.0050 0.0050 0.0200 0.0248 0.0390 0.06902001 12 0.0050 0.0083 0.0318 0.0360 0.0465 0.12902297155 1998 9 0.0050 0.0050 0.0170 0.0199 0.0360 0.04001999 12 0.0050 0.0050 0.0090 0.0132 0.0205 0.03402000 10 0.0050 0.0050 0.0195 0.1155 0.0530 0.84702001 12 0.0050 0.0090 0.0300 0.2694 0.0495 2.93002297310 1998 9 0.0050 0.0250 0.0380 0.0339 0.0440 0.06201999 11 0.0050 0.0050 0.0210 0.0267 0.0340 0.08502000 9 0.0050 0.0050 0.0350 0.0399 0.0680 0.08602001 12 0.0050 0.0095 0.0273 0.0397 0.0725 0.0890A-24
NH4-N, BY STATION AND WATER YEARGAGE_NUM WY N Minimum 25th Pctl 50th Pctl Mean 75th Pctl Maximumƒƒƒƒƒƒƒƒƒƒƒƒƒƒƒƒƒƒƒƒƒƒƒƒƒƒƒƒƒƒƒƒƒƒƒƒƒƒƒƒƒƒƒƒƒƒƒƒƒƒƒƒƒƒƒƒƒƒƒƒƒƒƒƒƒƒƒƒƒƒƒƒƒƒƒƒƒƒƒƒƒƒƒƒƒƒƒƒƒƒƒƒƒƒƒƒƒƒƒƒƒƒƒƒƒƒƒƒƒƒƒƒƒƒƒ2298202 1998 9 0.0050 0.0050 0.0050 0.0201 0.0240 0.06001999 12 0.0050 0.0100 0.0285 0.0386 0.0695 0.09402000 12 0.0050 0.0050 0.0180 0.0310 0.0575 0.07702001 12 0.0050 0.0105 0.0265 0.0362 0.0550 0.10302298608 1999 12 0.0050 0.0050 0.0205 0.0723 0.0955 0.30302000 10 0.0050 0.0200 0.0358 0.0714 0.1265 0.19702001 12 0.0050 0.0130 0.0235 0.0348 0.0475 0.14402298830 1999 12 0.0050 0.0118 0.0273 0.0455 0.0550 0.21702000 10 0.0050 0.0050 0.0373 0.0570 0.0760 0.20602001 12 0.0050 0.0200 0.0305 0.0488 0.0825 0.11902299120 1999 11 0.0050 0.0050 0.0320 0.0369 0.0640 0.08902000 11 0.0050 0.0300 0.0800 0.0928 0.1150 0.28402001 12 0.0050 0.0345 0.0525 0.0739 0.0840 0.26302299410 1999 10 0.0050 0.0050 0.0480 0.0876 0.2100 0.23502000 10 0.0150 0.0580 0.1140 0.2239 0.1660 0.94602001 12 0.0050 0.0195 0.0395 0.0633 0.0970 0.22802299455 1999 11 0.0050 0.0145 0.0560 0.0629 0.0890 0.20502000 11 0.0050 0.0220 0.0695 0.0709 0.1120 0.13902001 11 0.0050 0.0410 0.0810 0.0926 0.1720 0.2320ƒƒƒƒƒƒƒƒƒƒƒƒƒƒƒƒƒƒƒƒƒƒƒƒƒƒƒƒƒƒƒƒƒƒƒƒƒƒƒƒƒƒƒƒƒƒƒƒƒƒƒƒƒƒƒƒƒƒƒƒƒƒƒƒƒƒƒƒƒƒƒƒƒƒƒƒƒƒƒƒƒƒƒƒƒƒƒƒƒƒƒƒƒƒƒƒƒƒƒƒƒƒƒƒƒƒƒƒƒƒƒƒƒƒƒA-25
NO23-N (MG N/L), BY STATION AND WATER YEARGAGE_NUM WY N Minimum 25th Pctl 50th Pctl Mean 75th Pctl Maximumƒƒƒƒƒƒƒƒƒƒƒƒƒƒƒƒƒƒƒƒƒƒƒƒƒƒƒƒƒƒƒƒƒƒƒƒƒƒƒƒƒƒƒƒƒƒƒƒƒƒƒƒƒƒƒƒƒƒƒƒƒƒƒƒƒƒƒƒƒƒƒƒƒƒƒƒƒƒƒƒƒƒƒƒƒƒƒƒƒƒƒƒƒƒƒƒƒƒƒƒƒƒƒƒƒƒƒƒƒƒƒƒƒƒƒ2293987 1998 9 0.0260 0.1000 0.2360 0.2891 0.4870 0.71701999 12 0.0050 0.2110 0.3965 0.3602 0.4760 0.78902000 10 0.0050 0.0670 0.1275 0.2131 0.3360 0.59302001 12 0.0050 0.1330 0.1645 0.2717 0.4435 0.71202294491 1998 8 0.0050 0.0050 0.0050 0.0174 0.0280 0.05801999 12 0.0050 0.0050 0.0050 0.0409 0.0115 0.41002000 10 0.0050 0.0050 0.0140 0.0190 0.0330 0.05302001 10 0.0050 0.0180 0.0200 0.0377 0.0260 0.18902294650 1998 9 0.0600 0.1040 0.1370 0.1874 0.2580 0.45601999 12 0.0050 0.1110 0.2210 0.3302 0.5180 0.90002000 10 0.0050 0.0150 0.0520 0.1571 0.3520 0.52102001 12 0.0170 0.0925 0.1750 0.2021 0.2685 0.61802294898 1998 9 0.1300 0.1890 0.3020 0.3518 0.4300 0.89101999 12 0.0240 0.2900 0.5430 0.5073 0.6780 1.17002000 11 0.0050 0.1330 0.2550 0.2794 0.3780 0.73302001 12 0.0120 0.1415 0.2845 0.7716 1.4600 2.37002295637 1998 9 0.2500 0.3350 0.4780 0.5881 0.6680 1.14001999 12 0.0050 0.4695 0.6543 0.6471 0.9460 1.36002000 10 0.2050 0.4360 0.5950 0.6679 0.7740 1.43002001 12 0.4680 0.6275 0.9270 1.0192 1.3050 1.9300A-26
NO23-N, BY STATION AND WATER YEARGAGE_NUM WY N Minimum 25th Pctl 50th Pctl Mean 75th Pctl Maximumƒƒƒƒƒƒƒƒƒƒƒƒƒƒƒƒƒƒƒƒƒƒƒƒƒƒƒƒƒƒƒƒƒƒƒƒƒƒƒƒƒƒƒƒƒƒƒƒƒƒƒƒƒƒƒƒƒƒƒƒƒƒƒƒƒƒƒƒƒƒƒƒƒƒƒƒƒƒƒƒƒƒƒƒƒƒƒƒƒƒƒƒƒƒƒƒƒƒƒƒƒƒƒƒƒƒƒƒƒƒƒƒƒƒƒ2296500 1998 9 0.0840 0.1740 0.2300 0.3204 0.3990 0.78601999 12 0.0050 0.1100 0.1800 0.2256 0.3900 0.47002000 11 0.0050 0.0130 0.2000 0.2740 0.6100 0.7<strong>2002</strong>001 12 0.0050 0.0130 0.2250 1.2130 1.3500 7.90002296750 1998 9 0.3000 0.3770 0.4445 0.6234 0.7540 1.35001999 12 0.2900 0.4100 0.6050 0.6017 0.8100 0.85002000 11 0.0050 0.1600 0.5500 0.5092 0.7800 1.10002001 12 0.0050 0.2350 0.6050 0.7993 0.9350 2.90002297100 1998 3 0.9530 0.9530 1.0500 1.0443 1.1300 1.13001999 12 0.0200 0.8090 0.9725 1.0308 1.1050 2.20002000 10 0.0305 0.4940 0.9855 1.0427 1.2100 2.93002001 12 0.5370 0.7093 0.9835 1.4229 2.1000 3.5<strong>2002</strong>297155 1998 9 0.0540 0.0790 0.1080 0.1057 0.1200 0.17901999 12 0.0050 0.0245 0.0580 0.0654 0.1033 0.14802000 10 0.0050 0.0140 0.0785 0.2552 0.1480 1.95002001 12 0.0050 0.0160 0.0690 0.5021 0.1260 4.90002297310 1998 9 0.1710 0.2390 0.3320 0.4273 0.3960 1.05501999 11 0.0050 0.0930 0.4490 0.3981 0.6540 0.80202000 9 0.0190 0.4710 0.5530 0.5139 0.6400 0.81802001 12 0.1850 0.3145 0.8373 1.1329 1.7600 2.9900A-27
NO23-N, BY STATION AND WATER YEARGAGE_NUM WY N Minimum 25th Pctl 50th Pctl Mean 75th Pctl Maximumƒƒƒƒƒƒƒƒƒƒƒƒƒƒƒƒƒƒƒƒƒƒƒƒƒƒƒƒƒƒƒƒƒƒƒƒƒƒƒƒƒƒƒƒƒƒƒƒƒƒƒƒƒƒƒƒƒƒƒƒƒƒƒƒƒƒƒƒƒƒƒƒƒƒƒƒƒƒƒƒƒƒƒƒƒƒƒƒƒƒƒƒƒƒƒƒƒƒƒƒƒƒƒƒƒƒƒƒƒƒƒƒƒƒƒ2298202 1998 9 0.0050 0.0170 0.1470 0.1030 0.1670 0.21001999 12 0.0050 0.0050 0.0795 0.0694 0.1150 0.17902000 12 0.0050 0.0050 0.0200 0.0590 0.0875 0.25102001 12 0.0050 0.0050 0.0100 0.0438 0.0810 0.14902298608 1999 12 0.0050 0.0050 0.0195 0.0483 0.0810 0.15802000 10 0.0130 0.0360 0.0845 0.0808 0.1100 0.16452001 12 0.0050 0.0050 0.0170 0.0348 0.0645 0.10002298830 1999 12 0.0050 0.0050 0.0085 0.0173 0.0250 0.05202000 10 0.0050 0.0050 0.0080 0.0173 0.0300 0.04902001 12 0.0050 0.0085 0.0295 0.1207 0.1020 0.88402299120 1999 11 0.0050 0.0050 0.0180 0.0218 0.0260 0.07402000 11 0.0050 0.0050 0.0210 0.0288 0.0500 0.11052001 12 0.0050 0.0050 0.0145 0.0441 0.0365 0.27802299410 1999 10 0.0050 0.0120 0.0945 0.1242 0.1170 0.62302000 10 0.0050 0.0720 0.1845 0.3405 0.3320 1.84002001 12 0.0050 0.0190 0.0790 0.2097 0.2040 1.03002299455 1999 11 0.0050 0.0050 0.0520 0.0659 0.0990 0.24202000 11 0.0050 0.0410 0.0740 0.1459 0.1550 0.75102001 11 0.0050 0.0270 0.0560 0.1337 0.1540 0.5380A-28
TKN (MG/L), BY STATION AND WATER YEARGAGE_NUM WY N Minimum 25th Pctl 50th Pctl Mean 75th Pctl Maximumƒƒƒƒƒƒƒƒƒƒƒƒƒƒƒƒƒƒƒƒƒƒƒƒƒƒƒƒƒƒƒƒƒƒƒƒƒƒƒƒƒƒƒƒƒƒƒƒƒƒƒƒƒƒƒƒƒƒƒƒƒƒƒƒƒƒƒƒƒƒƒƒƒƒƒƒƒƒƒƒƒƒƒƒƒƒƒƒƒƒƒƒƒƒƒƒƒƒƒƒƒƒƒƒƒƒƒƒƒƒƒƒƒƒƒ2293987 1998 9 1.1700 1.2100 1.4100 1.4367 1.4800 2.1<strong>2002</strong>000 10 0.9650 1.1600 1.4350 1.7785 2.3700 3.3<strong>2002</strong>001 12 1.0300 1.2450 1.3600 1.5983 1.9550 2.59002294491 1998 8 2.8800 3.5900 4.4800 4.7313 6.1450 6.54002000 10 1.2200 2.6800 3.2500 4.2670 4.5400 12.10002001 10 1.5900 2.0800 8.7650 8.9850 14.4000 21.40002294650 1998 9 0.5360 1.4700 1.5400 1.8673 1.7500 3.58002000 10 0.9670 1.1100 1.5050 1.5307 1.7200 2.68002001 12 0.8990 0.9340 1.2550 1.4565 1.8000 2.69002294898 1998 9 0.7710 0.9030 1.4300 1.4142 1.4700 2.4<strong>2002</strong>000 10 0.5500 0.5970 0.7110 0.9140 1.1300 2.11002001 12 0.4530 0.5475 0.6430 0.7638 0.8630 1.83002295637 1998 9 0.7070 0.8330 1.1100 1.0926 1.2600 1.50002000 10 0.6140 0.7900 0.8975 0.9842 1.1500 1.7<strong>2002</strong>001 12 0.5800 0.6260 0.7625 0.9764 1.2650 1.85002296500 1998 9 0.6860 0.9910 1.3000 1.1613 1.3100 1.40001999 12 0.5600 0.7650 0.9600 1.1583 1.6000 2.00002000 11 0.6000 0.6000 0.9400 1.0036 1.3000 1.90002001 12 0.5000 0.5900 0.7150 1.1000 1.7000 2.5000A-29
TKN, BY STATION AND WATER YEARGAGE_NUM WY N Minimum 25th Pctl 50th Pctl Mean 75th Pctl Maximumƒƒƒƒƒƒƒƒƒƒƒƒƒƒƒƒƒƒƒƒƒƒƒƒƒƒƒƒƒƒƒƒƒƒƒƒƒƒƒƒƒƒƒƒƒƒƒƒƒƒƒƒƒƒƒƒƒƒƒƒƒƒƒƒƒƒƒƒƒƒƒƒƒƒƒƒƒƒƒƒƒƒƒƒƒƒƒƒƒƒƒƒƒƒƒƒƒƒƒƒƒƒƒƒƒƒƒƒƒƒƒƒƒƒƒ2296750 1998 9 0.8815 0.9060 0.9910 1.0789 1.1600 1.57001999 12 0.5500 0.6300 0.7650 0.9108 1.3000 1.40002000 11 0.5400 0.6800 0.7600 0.8300 1.0000 1.30002001 12 0.5700 0.6000 0.7050 0.9883 1.4500 2.00002297100 1998 3 0.9990 0.9990 1.1100 1.1163 1.2400 1.24002000 10 0.4800 0.7690 0.8558 0.9727 1.3000 1.66002001 12 0.7660 0.8815 1.1400 1.3148 1.4800 2.65002297155 1998 9 0.5810 0.8300 0.9440 0.9658 1.1000 1.61002000 10 0.4700 0.5810 0.7310 1.0479 1.2400 3.08002001 12 0.4210 0.5940 1.0635 1.4227 1.6750 5.08002297310 1998 9 0.3730 0.8070 0.9510 0.8921 1.1000 1.20002000 10 0.4700 0.7350 0.9955 1.0051 1.2300 1.5<strong>2002</strong>001 12 0.5620 0.6940 0.8848 1.4150 1.8450 4.49002298202 1998 9 0.9025 1.0800 1.3000 1.2425 1.3600 1.54001999 12 0.0250 0.9005 1.0510 1.1113 1.4500 1.78002000 12 0.0250 0.8650 1.1150 1.0963 1.3900 1.73002001 12 0.7400 0.9755 1.2000 1.2243 1.3900 2.04002298608 2000 9 0.6650 0.8500 0.9140 0.9504 1.0200 1.2<strong>2002</strong>001 12 0.6610 0.7983 1.0450 1.0823 1.1900 2.1100A-30
TKN, BY STATION AND WATER YEARGAGE_NUM WY N Minimum 25th Pctl 50th Pctl Mean 75th Pctl Maximumƒƒƒƒƒƒƒƒƒƒƒƒƒƒƒƒƒƒƒƒƒƒƒƒƒƒƒƒƒƒƒƒƒƒƒƒƒƒƒƒƒƒƒƒƒƒƒƒƒƒƒƒƒƒƒƒƒƒƒƒƒƒƒƒƒƒƒƒƒƒƒƒƒƒƒƒƒƒƒƒƒƒƒƒƒƒƒƒƒƒƒƒƒƒƒƒƒƒƒƒƒƒƒƒƒƒƒƒƒƒƒƒƒƒƒ2298830 2000 9 0.7400 0.9595 1.1900 1.3156 1.6400 1.85002001 12 0.9120 1.1650 1.3050 1.3277 1.4450 1.81002299120 2000 10 0.5470 1.0250 1.6550 1.6428 1.9100 3.73002001 12 0.3860 0.6335 1.1115 1.1718 1.7050 2.13002299410 2000 9 0.5900 0.7180 1.5400 1.4641 2.0500 2.35002001 12 0.6060 0.8345 1.2000 1.2239 1.6550 1.88002299455 2000 10 0.6100 0.7590 0.9745 1.1699 1.5700 2.0<strong>2002</strong>001 11 0.5005 0.6745 1.1500 1.1026 1.5300 1.6400ƒƒƒƒƒƒƒƒƒƒƒƒƒƒƒƒƒƒƒƒƒƒƒƒƒƒƒƒƒƒƒƒƒƒƒƒƒƒƒƒƒƒƒƒƒƒƒƒƒƒƒƒƒƒƒƒƒƒƒƒƒƒƒƒƒƒƒƒƒƒƒƒƒƒƒƒƒƒƒƒƒƒƒƒƒƒƒƒƒƒƒƒƒƒƒƒƒƒƒƒƒƒƒƒƒƒƒƒƒƒƒƒƒƒƒA-31
PO4-P (MG P/L), BY STATION AND WATER YEARGAGE_NUM WY N Minimum 25th Pctl 50th Pctl Mean 75th Pctl Maximumƒƒƒƒƒƒƒƒƒƒƒƒƒƒƒƒƒƒƒƒƒƒƒƒƒƒƒƒƒƒƒƒƒƒƒƒƒƒƒƒƒƒƒƒƒƒƒƒƒƒƒƒƒƒƒƒƒƒƒƒƒƒƒƒƒƒƒƒƒƒƒƒƒƒƒƒƒƒƒƒƒƒƒƒƒƒƒƒƒƒƒƒƒƒƒƒƒƒƒƒƒƒƒƒƒƒƒƒƒƒƒƒƒƒƒ2293987 1998 9 0.0670 0.0900 0.2390 0.2411 0.3240 0.62701999 12 0.1360 0.2398 0.3520 0.4667 0.5900 1.05002000 11 0.1180 0.1540 0.2160 0.3811 0.6740 1.23002001 12 0.1170 0.2375 0.3135 0.4238 0.6480 0.82102294491 1998 8 0.0050 0.0155 0.0975 0.1115 0.2115 0.23801999 12 0.0050 0.0050 0.0225 0.0348 0.0488 0.11652000 11 0.0050 0.0050 0.0180 0.0281 0.0310 0.14802001 10 0.0140 0.1230 0.4200 0.6711 0.8360 2.19002294650 1998 9 0.0940 0.1655 0.2080 0.5915 1.1000 1.30001999 12 0.0140 0.2745 0.7865 1.1694 2.0300 3.43902000 11 0.0390 0.1880 0.3450 0.4256 0.5280 1.1<strong>2002</strong>001 12 0.1440 0.3535 0.5365 0.9250 1.6550 2.16002294898 1998 9 0.2200 0.5010 0.6700 0.6522 0.8640 0.94301999 12 0.4650 0.5610 0.6525 0.6801 0.7885 0.95402000 11 0.6050 0.6540 0.6800 0.7427 0.8200 1.0<strong>2002</strong>001 12 0.3280 0.3475 0.5565 0.5783 0.7855 0.99502295637 1998 9 0.5580 0.7900 0.8410 0.8232 0.8810 1.12001999 12 0.5900 0.8723 0.9308 0.9473 1.0445 1.22602000 11 0.6410 0.7350 0.8610 0.9033 1.1100 1.18002001 12 0.8420 0.9560 1.1050 1.1333 1.2850 1.6500A-32
PO4-P, BY STATION AND WATER YEARGAGE_NUM WY N Minimum 25th Pctl 50th Pctl Mean 75th Pctl Maximumƒƒƒƒƒƒƒƒƒƒƒƒƒƒƒƒƒƒƒƒƒƒƒƒƒƒƒƒƒƒƒƒƒƒƒƒƒƒƒƒƒƒƒƒƒƒƒƒƒƒƒƒƒƒƒƒƒƒƒƒƒƒƒƒƒƒƒƒƒƒƒƒƒƒƒƒƒƒƒƒƒƒƒƒƒƒƒƒƒƒƒƒƒƒƒƒƒƒƒƒƒƒƒƒƒƒƒƒƒƒƒƒƒƒƒ2296500 1998 9 0.3140 0.4200 0.5200 0.5408 0.6440 0.90701999 12 0.2800 0.4100 0.4850 0.5067 0.6600 0.7<strong>2002</strong>000 11 0.1700 0.3200 0.4100 0.4664 0.6200 1.10002001 12 0.1300 0.2150 0.3800 0.3925 0.5000 0.80002296750 1998 9 0.5305 0.7365 0.8005 0.7799 0.8930 0.96001999 11 0.6400 0.8000 0.8500 0.8545 0.9800 1.00002000 11 0.5400 0.6300 0.8900 0.8627 1.1000 1.20002001 12 0.4600 0.6850 0.7300 0.7867 0.9050 1.20002297100 1998 3 0.1360 0.1360 0.1920 0.1770 0.2030 0.20301999 12 0.0740 0.1065 0.1315 0.1426 0.1690 0.25002000 11 0.0510 0.0870 0.1040 0.1106 0.1400 0.14902001 12 0.0415 0.0625 0.1070 0.1385 0.1915 0.35402297155 1998 9 0.1760 0.2920 0.3630 0.3573 0.3810 0.57601999 12 0.2340 0.2495 0.3490 0.3975 0.4335 0.92702000 11 0.2880 0.2980 0.3660 0.4770 0.6610 0.97802001 12 0.3000 0.3565 0.5250 0.5246 0.6220 0.91502297310 1998 9 0.3500 0.3700 0.3920 0.4010 0.4300 0.44601999 11 0.3070 0.3370 0.3510 0.3721 0.3890 0.54702000 10 0.2250 0.2920 0.3653 0.5122 0.6070 1.57002001 12 0.1550 0.2998 0.3795 0.3938 0.4650 0.6820A-33
PO4-P, BY STATION AND WATER YEARGAGE_NUM WY N Minimum 25th Pctl 50th Pctl Mean 75th Pctl Maximumƒƒƒƒƒƒƒƒƒƒƒƒƒƒƒƒƒƒƒƒƒƒƒƒƒƒƒƒƒƒƒƒƒƒƒƒƒƒƒƒƒƒƒƒƒƒƒƒƒƒƒƒƒƒƒƒƒƒƒƒƒƒƒƒƒƒƒƒƒƒƒƒƒƒƒƒƒƒƒƒƒƒƒƒƒƒƒƒƒƒƒƒƒƒƒƒƒƒƒƒƒƒƒƒƒƒƒƒƒƒƒƒƒƒƒ2298202 1998 9 0.0580 0.0900 0.1200 0.1175 0.1330 0.19501999 12 0.0340 0.0515 0.0780 0.1046 0.1135 0.29902000 12 0.0050 0.0285 0.0515 0.0612 0.0825 0.16102001 12 0.0050 0.0270 0.0820 0.0940 0.1410 0.26202298608 1999 12 0.1030 0.1705 0.3230 0.2948 0.3895 0.45902000 10 0.1260 0.1590 0.2300 0.2490 0.2650 0.45302001 12 0.0250 0.1048 0.1800 0.2220 0.3460 0.45802298830 1999 12 0.2480 0.2910 0.3493 0.3660 0.4295 0.53852000 10 0.0750 0.2250 0.2515 0.2730 0.3340 0.55202001 12 0.0620 0.1695 0.3160 0.3293 0.4690 0.59502299120 1999 11 0.0400 0.0700 0.0880 0.1405 0.2000 0.39602000 11 0.0140 0.1030 0.3800 0.3822 0.4300 1.39002001 12 0.0790 0.1225 0.1920 0.2278 0.2895 0.57202299410 1999 10 0.1030 0.2250 0.2775 0.2809 0.3450 0.51502000 10 0.0890 0.1270 0.3055 0.2919 0.4220 0.45202001 12 0.0320 0.1140 0.2805 0.2741 0.4080 0.56202299455 1999 11 0.1365 0.1815 0.2820 0.2879 0.3610 0.54202000 11 0.1040 0.1500 0.1550 0.1884 0.2235 0.39902001 11 0.0350 0.1270 0.2060 0.2071 0.2860 0.3310<strong>2002</strong> 3 0.1570 0.1570 0.2170 0.2233 0.2960 0.2960ƒƒƒƒƒƒƒƒƒƒƒƒƒƒƒƒƒƒƒƒƒƒƒƒƒƒƒƒƒƒƒƒƒƒƒƒƒƒƒƒƒƒƒƒƒƒƒƒƒƒƒƒƒƒƒƒƒƒƒƒƒƒƒƒƒƒƒƒƒƒƒƒƒƒƒƒƒƒƒƒƒƒƒƒƒƒƒƒƒƒƒƒƒƒƒƒƒƒƒƒƒƒƒƒƒƒƒƒƒƒƒƒƒƒƒA-34
TP (MG/L), BY STATION AND WATER YEARGAGE_NUM WY N Minimum 25th Pctl 50th Pctl Mean 75th Pctl Maximumƒƒƒƒƒƒƒƒƒƒƒƒƒƒƒƒƒƒƒƒƒƒƒƒƒƒƒƒƒƒƒƒƒƒƒƒƒƒƒƒƒƒƒƒƒƒƒƒƒƒƒƒƒƒƒƒƒƒƒƒƒƒƒƒƒƒƒƒƒƒƒƒƒƒƒƒƒƒƒƒƒƒƒƒƒƒƒƒƒƒƒƒƒƒƒƒƒƒƒƒƒƒƒƒƒƒƒƒƒƒƒƒƒƒƒ2293987 1998 9 0.1080 0.1300 0.3570 0.3289 0.4390 0.77101999 12 0.2020 0.2783 0.4485 0.5203 0.6630 1.06002000 11 0.1545 0.2180 0.2700 0.4772 0.7360 1.45002001 12 0.1890 0.3085 0.4095 0.4914 0.6935 0.83702294491 1998 8 0.3950 0.5295 0.5885 0.5740 0.6255 0.71001999 12 0.1520 0.2040 0.3010 0.3098 0.3860 0.55502000 11 0.0490 0.1570 0.3340 0.3527 0.5230 0.96302001 10 0.3940 1.2700 1.6900 2.6454 2.9500 10.50002294650 1998 9 0.2490 0.3275 0.6000 0.8338 1.2900 1.66001999 12 0.3940 0.4720 0.9450 1.3853 2.3200 3.52802000 11 0.1260 0.2400 0.4280 0.5189 0.5890 1.30002001 12 0.1950 0.4050 0.6170 1.0328 1.8700 2.39002294898 1998 9 0.6800 0.8300 1.0600 0.9892 1.1200 1.27001999 12 0.5830 0.6895 0.8233 0.8443 1.0050 1.15602000 11 0.6610 0.7370 0.8650 0.9219 1.0400 1.4<strong>2002</strong>001 12 0.3450 0.4485 0.7490 0.6863 0.8850 1.09002295637 1998 9 0.7720 0.9080 0.9520 1.0357 1.0800 1.78001999 12 0.8370 1.0015 1.0533 1.0863 1.1605 1.36502000 11 0.7820 0.8770 0.9600 1.0020 1.1900 1.23002001 12 0.9470 1.0750 1.2200 1.2766 1.3700 2.1600A-35
TP, BY STATION AND WATER YEARGAGE_NUM WY N Minimum 25th Pctl 50th Pctl Mean 75th Pctl Maximumƒƒƒƒƒƒƒƒƒƒƒƒƒƒƒƒƒƒƒƒƒƒƒƒƒƒƒƒƒƒƒƒƒƒƒƒƒƒƒƒƒƒƒƒƒƒƒƒƒƒƒƒƒƒƒƒƒƒƒƒƒƒƒƒƒƒƒƒƒƒƒƒƒƒƒƒƒƒƒƒƒƒƒƒƒƒƒƒƒƒƒƒƒƒƒƒƒƒƒƒƒƒƒƒƒƒƒƒƒƒƒƒƒƒƒ2296500 1998 9 0.4630 0.4900 0.6010 0.6379 0.7450 0.99801999 12 0.3600 0.4650 0.5850 0.5742 0.6500 0.80002000 11 0.2500 0.4300 0.4900 0.5555 0.6700 1.20002001 12 0.1600 0.2800 0.4900 0.4867 0.5700 1.00002296750 1998 9 0.6720 0.8510 0.9340 0.9133 0.9800 1.07001999 12 0.5900 0.8800 0.9700 0.9608 1.1000 1.20002000 11 0.6200 0.7200 0.8800 0.9582 1.1000 1.30002001 12 0.5100 0.7650 0.8450 0.8767 1.0150 1.30002297100 1998 3 0.2350 0.2350 0.2450 0.2443 0.2530 0.25301999 12 0.0930 0.1350 0.1525 0.1791 0.2090 0.34002000 11 0.0665 0.1115 0.1480 0.1504 0.1890 0.25302001 12 0.0650 0.1075 0.1335 0.1812 0.2568 0.41402297155 1998 9 0.2320 0.3480 0.3660 0.4151 0.4930 0.63501999 12 0.2630 0.2850 0.3995 0.4384 0.4640 0.98702000 11 0.3080 0.3440 0.3990 0.5767 0.9240 1.23002001 12 0.3000 0.4315 0.5705 0.6066 0.7710 1.15002297310 1998 9 0.4200 0.4610 0.4650 0.4871 0.5250 0.57501999 11 0.3430 0.3690 0.3730 0.4261 0.4670 0.67502000 10 0.2530 0.3350 0.4785 0.5874 0.6960 1.65002001 12 0.2020 0.3435 0.4108 0.4644 0.5980 0.8300A-36
TP, BY STATION AND WATER YEARGAGE_NUM WY N Minimum 25th Pctl 50th Pctl Mean 75th Pctl Maximumƒƒƒƒƒƒƒƒƒƒƒƒƒƒƒƒƒƒƒƒƒƒƒƒƒƒƒƒƒƒƒƒƒƒƒƒƒƒƒƒƒƒƒƒƒƒƒƒƒƒƒƒƒƒƒƒƒƒƒƒƒƒƒƒƒƒƒƒƒƒƒƒƒƒƒƒƒƒƒƒƒƒƒƒƒƒƒƒƒƒƒƒƒƒƒƒƒƒƒƒƒƒƒƒƒƒƒƒƒƒƒƒƒƒƒ2298202 1998 9 0.1120 0.1240 0.1700 0.1782 0.1985 0.27301999 12 0.0650 0.0760 0.1295 0.1506 0.1780 0.36502000 12 0.0390 0.0665 0.0905 0.1090 0.1375 0.25202001 12 0.0510 0.0675 0.1445 0.1460 0.1985 0.33902298608 1999 12 0.1270 0.1895 0.3485 0.3226 0.4075 0.53402000 10 0.1540 0.1980 0.2570 0.2834 0.2985 0.51802001 12 0.1040 0.1440 0.2765 0.2756 0.3845 0.48802298830 1999 12 0.2980 0.3315 0.4090 0.4246 0.4730 0.66302000 10 0.1850 0.2270 0.3048 0.3343 0.3940 0.66502001 12 0.1700 0.2280 0.4090 0.4035 0.5465 0.64202299120 1999 11 0.0730 0.0880 0.1290 0.2455 0.4030 0.85402000 11 0.0430 0.1280 0.4390 0.6634 0.9410 1.88002001 12 0.1030 0.2195 0.5293 0.4798 0.6645 0.97402299410 1999 10 0.1290 0.2390 0.3440 0.3638 0.4600 0.67502000 10 0.1280 0.1420 0.4025 0.4142 0.5730 0.74602001 12 0.0800 0.1490 0.3305 0.3548 0.5455 0.65502299455 1999 11 0.1840 0.2740 0.3205 0.3546 0.4345 0.60602000 10 0.1250 0.1730 0.2548 0.2539 0.2915 0.52902001 11 0.0710 0.2020 0.2860 0.2763 0.3745 0.4220<strong>2002</strong> 3 0.2610 0.2610 0.2720 0.2910 0.3400 0.3400ƒƒƒƒƒƒƒƒƒƒƒƒƒƒƒƒƒƒƒƒƒƒƒƒƒƒƒƒƒƒƒƒƒƒƒƒƒƒƒƒƒƒƒƒƒƒƒƒƒƒƒƒƒƒƒƒƒƒƒƒƒƒƒƒƒƒƒƒƒƒƒƒƒƒƒƒƒƒƒƒƒƒƒƒƒƒƒƒƒƒƒƒƒƒƒƒƒƒƒƒƒƒƒƒƒƒƒƒƒƒƒƒƒƒƒA-37
TOC (MG/L), BY STATION AND YEARGAGE_NUM WY N Minimum 25th Pctl 50th Pctl Mean 75th Pctl Maximumƒƒƒƒƒƒƒƒƒƒƒƒƒƒƒƒƒƒƒƒƒƒƒƒƒƒƒƒƒƒƒƒƒƒƒƒƒƒƒƒƒƒƒƒƒƒƒƒƒƒƒƒƒƒƒƒƒƒƒƒƒƒƒƒƒƒƒƒƒƒƒƒƒƒƒƒƒƒƒƒƒƒƒƒƒƒƒƒƒƒƒƒƒƒƒƒƒƒƒƒƒƒƒƒƒƒƒƒƒƒƒƒƒƒƒ2293987 1998 9 13.0000 19.9000 21.9000 20.5222 22.6000 26.80001999 12 13.7000 17.4000 23.0500 22.8750 28.4000 30.90002000 11 11.5000 13.4000 19.6000 21.4314 27.9000 37.60002001 12 12.2000 15.4000 18.9000 22.8417 30.3500 38.10002294491 1998 8 11.8000 13.0500 16.6000 16.4500 19.7000 21.10001999 12 22.4000 26.6250 30.4000 29.7292 33.2000 35.40002000 11 13.6000 18.1400 20.7000 24.4191 24.8000 46.8<strong>2002</strong>001 10 9.2600 23.4000 31.9500 38.3660 58.2000 62.10002294650 1998 9 12.6000 15.5000 18.1000 17.0000 18.4000 20.50001999 12 13.3000 17.4500 21.9000 21.2250 25.4500 27.30002000 11 11.7000 13.6000 20.3000 21.9018 28.0000 39.37002001 12 8.9700 12.3500 15.4000 19.1308 25.1000 36.00002294898 1998 9 8.2600 14.2000 15.1000 14.3844 15.8000 20.80001999 12 8.0500 10.1000 13.4000 15.4458 21.9000 25.00002000 11 3.1800 7.9200 11.4100 13.0300 20.2000 26.80002001 12 4.3700 5.3300 6.1700 9.7250 11.5500 30.90002295637 1998 9 9.1400 10.9000 13.4000 15.0933 16.7000 30.60001999 12 8.7000 10.5500 13.5500 14.8042 18.6250 24.00002000 11 9.3000 10.2000 12.7000 14.4691 19.3500 23.99002001 12 7.1500 8.0300 9.9400 15.0000 22.7000 30.8000A-38
TOC, BY STATION AND YEARGAGE_NUM WY N Minimum 25th Pctl 50th Pctl Mean 75th Pctl Maximumƒƒƒƒƒƒƒƒƒƒƒƒƒƒƒƒƒƒƒƒƒƒƒƒƒƒƒƒƒƒƒƒƒƒƒƒƒƒƒƒƒƒƒƒƒƒƒƒƒƒƒƒƒƒƒƒƒƒƒƒƒƒƒƒƒƒƒƒƒƒƒƒƒƒƒƒƒƒƒƒƒƒƒƒƒƒƒƒƒƒƒƒƒƒƒƒƒƒƒƒƒƒƒƒƒƒƒƒƒƒƒƒƒƒƒ2296500 1998 9 8.9600 19.6000 20.7000 21.2844 26.4000 30.40001999 12 10.0000 13.5000 22.5000 24.0000 33.5000 47.00002000 11 9.7000 9.8000 15.0000 18.9273 22.0000 50.00002001 12 7.4000 7.9500 13.9000 19.7000 27.5000 49.00002296750 1998 9 8.6900 12.7000 14.7000 14.6511 17.1500 20.70001999 11 9.9000 12.0000 15.0000 16.9909 23.0000 31.00002000 11 8.1000 11.0000 12.0000 13.4000 16.0000 21.00002001 12 8.0000 9.0500 10.4000 15.6583 22.0000 34.00002297100 1998 3 12.7000 12.7000 14.1000 15.1333 18.6000 18.60001999 12 10.6000 13.2000 15.3500 17.3225 22.5500 27.30002000 11 8.7550 10.4000 11.8000 14.3732 17.8000 24.17002001 12 9.3100 10.8500 12.6000 15.2675 19.8000 26.00002297155 1998 9 9.5200 11.7000 21.8000 19.4244 25.4000 32.60001999 12 9.6000 12.7750 20.0500 20.7792 29.8500 32.70002000 11 7.5200 8.7400 13.3550 14.9332 22.5300 27.30002001 12 8.8200 10.6500 14.2500 20.4350 32.2000 43.00002297310 1998 9 8.0600 14.0000 17.1000 17.0900 22.9000 25.00001999 11 9.7000 10.4000 16.4000 19.4055 28.3000 37.60002000 10 8.8900 9.7600 15.8000 15.4010 20.3000 23.60002001 12 7.1100 9.0975 13.8500 18.4417 29.4500 37.4000A-39
TOC, BY STATION AND YEARGAGE_NUM WY N Minimum 25th Pctl 50th Pctl Mean 75th Pctl Maximumƒƒƒƒƒƒƒƒƒƒƒƒƒƒƒƒƒƒƒƒƒƒƒƒƒƒƒƒƒƒƒƒƒƒƒƒƒƒƒƒƒƒƒƒƒƒƒƒƒƒƒƒƒƒƒƒƒƒƒƒƒƒƒƒƒƒƒƒƒƒƒƒƒƒƒƒƒƒƒƒƒƒƒƒƒƒƒƒƒƒƒƒƒƒƒƒƒƒƒƒƒƒƒƒƒƒƒƒƒƒƒƒƒƒƒ2298202 1998 9 11.8000 13.5000 16.7000 16.3833 18.7000 20.90001999 5 13.8000 18.7000 23.9000 22.3000 24.3000 30.80002000 12 11.7000 15.6500 18.4000 18.8667 23.1500 25.00002001 12 10.4000 12.5000 14.6000 16.1750 18.8500 29.10002298608 1999 12 16.8000 17.3500 19.6000 21.0192 25.5000 28.50002000 10 13.2000 16.0000 17.4500 17.9350 20.7000 23.25002001 12 13.6000 15.5250 18.1000 19.8292 22.7500 30.30002298830 1999 12 18.0000 18.6050 21.7500 23.4758 28.9000 32.00002000 10 14.9000 16.9000 20.4250 19.9835 21.8400 26.10002001 12 15.0000 18.7500 21.6500 21.7875 25.0750 28.80002299120 1999 11 11.6000 18.0000 22.1000 22.3682 28.1000 33.50002000 11 10.7000 19.1600 25.3000 24.3982 28.8000 49.10002001 12 6.2900 11.9250 20.4750 19.2992 25.8000 32.80002299410 1999 10 7.7500 12.9000 16.5500 21.8850 34.5000 38.20002000 10 10.2000 13.1000 17.6000 18.7500 24.4000 30.00002001 12 7.7200 10.4500 19.5000 19.8417 28.4500 36.00002299455 1999 11 9.3550 14.9500 17.7500 21.3914 33.4500 35.90002000 11 11.1000 12.8400 16.0000 18.5214 24.9500 29.80002001 11 7.8600 10.0000 18.4000 18.0641 24.4000 26.4000ƒƒƒƒƒƒƒƒƒƒƒƒƒƒƒƒƒƒƒƒƒƒƒƒƒƒƒƒƒƒƒƒƒƒƒƒƒƒƒƒƒƒƒƒƒƒƒƒƒƒƒƒƒƒƒƒƒƒƒƒƒƒƒƒƒƒƒƒƒƒƒƒƒƒƒƒƒƒƒƒƒƒƒƒƒƒƒƒƒƒƒƒƒƒƒƒƒƒƒƒƒƒƒƒƒƒƒƒƒƒƒƒƒƒƒA-40
APPENDIX BCONSTITUENT SUMMARIES FOR TIDAL STATIONSWATER YEARS 1994 - 2000B-1
Near-surface salinity (ppt)SITE WY N Minimum 25th Pctl 50th Pctl Mean 75th Pctl MaximumƒƒƒƒƒƒƒƒƒƒƒƒƒƒƒƒƒƒƒƒƒƒƒƒƒƒƒƒƒƒƒƒƒƒƒƒƒƒƒƒƒƒƒƒƒƒƒƒƒƒƒƒƒƒƒƒƒƒƒƒƒƒƒƒƒƒƒƒƒƒƒƒƒƒƒƒƒƒƒƒƒƒƒƒƒƒƒƒƒƒƒƒƒƒƒƒƒƒƒƒƒƒƒƒƒƒƒƒƒƒƒƒƒƒƒCH-001 1994 12 0.1000 1.0250 6.9250 6.1583 10.1500 13.60001995 12 0.0000 0.2500 3.0500 3.5403 4.8250 10.20001996 12 0.1000 1.5500 3.9250 4.8889 7.1500 14.06671997 11 0.0000 7.4000 11.9500 10.6500 14.8667 18.30001998 11 0.0000 0.2200 1.6000 2.2556 3.3500 10.35001999 10 0.1500 0.3200 2.0192 6.6068 15.6100 19.01002000 11 0.1700 1.6050 7.4133 8.7979 13.4050 24.8850CH-002 1994 12 0.3000 8.7893 16.9133 14.3953 20.1500 22.70001995 12 0.0000 4.0000 12.6571 10.2087 14.2214 17.67141996 12 0.1000 11.0000 13.8298 12.9170 15.9143 20.12501997 12 5.7733 14.5429 19.9567 18.1479 22.1607 25.68571998 11 0.1000 0.8883 10.2286 7.8387 12.2317 17.97171999 10 2.7114 6.7433 11.4690 12.8154 21.0629 23.72862000 11 0.3071 13.7857 19.7400 17.6164 23.6650 27.9729CH-02B 1994 12 1.9000 12.3167 21.0167 17.4299 22.6542 23.70001995 12 0.0000 8.2500 15.7500 13.1592 17.7500 19.30001996 12 0.6333 13.7083 17.1750 15.3225 18.6167 20.67001997 12 10.0333 17.7500 22.6000 20.9847 24.3333 27.10001998 11 1.1000 6.3000 13.2000 12.0679 16.7000 26.28671999 10 10.2467 12.5550 14.2492 16.5645 21.7700 24.41672000 11 8.6500 16.3950 23.2967 20.7386 25.3000 28.5600B-2
Near-surface salinity (ppt)SITE WY N Minimum 25th Pctl 50th Pctl Mean 75th Pctl MaximumƒƒƒƒƒƒƒƒƒƒƒƒƒƒƒƒƒƒƒƒƒƒƒƒƒƒƒƒƒƒƒƒƒƒƒƒƒƒƒƒƒƒƒƒƒƒƒƒƒƒƒƒƒƒƒƒƒƒƒƒƒƒƒƒƒƒƒƒƒƒƒƒƒƒƒƒƒƒƒƒƒƒƒƒƒƒƒƒƒƒƒƒƒƒƒƒƒƒƒƒƒƒƒƒƒƒƒƒƒƒƒƒƒƒƒCH-029 1994 12 0.0000 0.0000 0.1333 2.5285 3.0667 11.20001995 12 0.0000 0.0000 0.0000 0.1972 0.0000 2.26671996 12 0.0000 0.0000 0.0000 0.3329 0.2000 2.62001997 12 0.0000 0.1500 3.6733 3.3335 6.1575 7.60001998 10 0.0000 0.0300 0.1500 0.4037 0.2000 2.67501999 10 0.1000 0.1600 0.3100 3.5111 9.1600 10.40202000 10 0.1000 0.8000 4.0313 7.6822 14.3950 23.4500CH-004 1994 12 0.0000 15.4100 19.5800 18.3083 24.3325 25.78001995 12 0.1000 8.9700 15.0300 12.2556 15.8250 20.18001996 12 2.2400 12.1000 14.7700 13.9644 16.8800 19.73331997 10 10.2000 21.9500 22.7667 20.9417 24.4200 25.50001998 9 0.0400 8.5500 12.8250 11.0589 13.6400 17.60001999 10 8.8750 14.7750 18.2460 18.3463 24.1667 26.06332000 10 12.9400 20.8580 22.0733 23.0863 27.1833 31.4000CH-05B 1994 12 2.0000 16.6667 23.1917 19.9444 24.8750 25.76671995 12 0.6750 10.8333 17.0500 15.0271 19.7917 23.05001996 12 2.2000 15.2000 16.3500 15.9000 19.1833 20.16671997 10 7.1333 18.8333 24.3750 21.7933 26.0333 27.70001998 10 6.9333 10.8333 14.8333 16.7363 18.5000 40.66001999 10 12.2767 15.2733 20.2450 19.9470 24.2900 28.91672000 10 10.7000 20.1000 24.7167 23.9440 28.9333 32.2333B-3
Near-surface salinity (ppt)SITE WY N Minimum 25th Pctl 50th Pctl Mean 75th Pctl MaximumƒƒƒƒƒƒƒƒƒƒƒƒƒƒƒƒƒƒƒƒƒƒƒƒƒƒƒƒƒƒƒƒƒƒƒƒƒƒƒƒƒƒƒƒƒƒƒƒƒƒƒƒƒƒƒƒƒƒƒƒƒƒƒƒƒƒƒƒƒƒƒƒƒƒƒƒƒƒƒƒƒƒƒƒƒƒƒƒƒƒƒƒƒƒƒƒƒƒƒƒƒƒƒƒƒƒƒƒƒƒƒƒƒƒƒCH-005 1994 12 9.7143 20.1125 24.2333 22.8375 26.5929 28.02501995 12 2.4429 13.6786 19.9143 17.1465 20.8833 22.57501996 12 7.5714 18.4071 19.0429 18.6065 20.3688 22.71251997 10 14.1714 24.5000 26.3107 24.8832 28.3375 28.87141998 10 5.5471 15.3857 18.2714 19.5454 21.2429 49.95001999 11 14.5429 16.2113 20.6714 21.4640 26.0438 29.23252000 10 16.6000 23.8714 26.3164 26.1293 30.8000 32.4286B-4
Near-surface color (PCU)SITE WY N Minimum 25th Pctl 50th Pctl Mean 75th Pctl Maximumƒƒƒƒƒƒƒƒƒƒƒƒƒƒƒƒƒƒƒƒƒƒƒƒƒƒƒƒƒƒƒƒƒƒƒƒƒƒƒƒƒƒƒƒƒƒƒƒƒƒƒƒƒƒƒƒƒƒƒƒƒƒƒƒƒƒƒƒƒƒƒƒƒƒƒƒƒƒƒƒƒƒƒƒƒƒƒƒƒƒƒƒƒƒƒƒƒƒƒƒƒƒƒƒƒƒƒƒƒƒƒƒƒƒƒ1 1994 12 30.0000 50.0000 80.0000 126.2500 200.0000 350.00001995 12 60.0000 70.0000 106.2500 136.4583 200.0000 280.00001996 12 30.0000 50.0000 100.0000 103.8333 137.5000 250.00001997 12 34.0000 51.2500 73.5000 109.1250 102.5000 332.00001998 11 63.0000 120.0000 180.0000 172.4091 205.0000 311.00001999 10 30.0000 30.0000 150.0000 151.0000 250.0000 300.00002000 11 20.0000 30.0000 80.0000 104.7727 195.0000 250.0000CH-002 1994 12 12.5000 22.5000 42.5000 76.2500 101.2500 300.00001995 12 20.0000 40.0000 65.0000 110.6250 206.2500 250.00001996 12 17.5000 27.5000 51.2500 67.7778 79.1667 250.00001997 12 15.5000 34.0833 41.8333 70.7639 48.4167 259.50001998 11 45.6667 70.0000 127.5000 134.9545 176.0000 313.33331999 10 12.5000 15.0000 103.7500 112.2500 187.5000 270.00002000 11 12.5000 20.0000 40.0000 67.9545 112.5000 250.0000CH-02B 1994 12 15.0000 20.0000 25.0000 57.7083 68.7500 250.00001995 12 20.0000 30.0000 40.0000 72.9167 125.0000 175.00001996 12 2.5000 22.5000 35.0000 45.2083 50.0000 175.00001997 12 18.0000 27.0000 34.0000 52.1667 36.5000 185.00001998 11 46.0000 75.0000 80.0000 100.8182 132.0000 183.00001999 10 15.0000 20.0000 77.5000 78.5000 125.0000 175.00002000 11 10.0000 20.0000 25.0000 50.0000 80.0000 175.0000B-5
Near-surface color (PCU)SITE WY N Minimum 25th Pctl 50th Pctl Mean 75th Pctl MaximumƒƒƒƒƒƒƒƒƒƒƒƒƒƒƒƒƒƒƒƒƒƒƒƒƒƒƒƒƒƒƒƒƒƒƒƒƒƒƒƒƒƒƒƒƒƒƒƒƒƒƒƒƒƒƒƒƒƒƒƒƒƒƒƒƒƒƒƒƒƒƒƒƒƒƒƒƒƒƒƒƒƒƒƒƒƒƒƒƒƒƒƒƒƒƒƒƒƒƒƒƒƒƒƒƒƒƒƒƒƒƒƒƒƒƒCH-029 1994 12 55.0000 70.0000 150.0000 143.7500 200.0000 250.00001995 12 100.0000 125.0000 187.5000 177.5000 200.0000 280.00001996 12 50.0000 77.5000 122.5000 118.7500 150.0000 250.00001997 12 42.0000 50.0000 76.5000 115.1667 165.5000 286.00001998 10 80.0000 119.0000 160.0000 172.5000 220.0000 303.00001999 10 40.0000 40.0000 80.0000 133.0000 250.0000 300.00002000 12 25.0000 32.5000 51.2500 89.7917 112.5000 300.0000CH-004 1994 12 15.0000 20.0000 45.0000 60.4167 92.5000 175.00001995 12 50.0000 60.0000 100.0000 116.2500 150.0000 250.00001996 12 20.0000 45.0000 60.0000 79.5833 100.0000 250.00001997 12 19.0000 31.0000 40.5000 64.7083 62.5000 255.00001998 10 56.0000 80.0000 107.7500 120.1500 167.0000 210.00001999 10 10.0000 20.0000 40.0000 87.0000 175.0000 250.00002000 12 10.0000 17.5000 27.5000 50.2083 43.7500 250.0000CH-05B 1994 12 2.5000 17.5000 30.0000 53.0417 74.5000 225.00001995 12 20.0000 30.0000 42.5000 68.3333 97.5000 225.00001996 12 10.0000 17.5000 27.5000 36.7500 40.0000 150.00001997 12 10.0000 19.0000 29.5000 42.6667 43.0000 148.00001998 10 54.0000 60.0000 75.0000 84.1000 109.0000 146.00001999 10 2.5000 10.0000 30.0000 50.2500 100.0000 125.00002000 12 10.0000 12.5000 20.0000 27.9167 40.0000 85.0000B-6
Near-surface color (PCU)SITE WY N Minimum 25th Pctl 50th Pctl Mean 75th Pctl MaximumƒƒƒƒƒƒƒƒƒƒƒƒƒƒƒƒƒƒƒƒƒƒƒƒƒƒƒƒƒƒƒƒƒƒƒƒƒƒƒƒƒƒƒƒƒƒƒƒƒƒƒƒƒƒƒƒƒƒƒƒƒƒƒƒƒƒƒƒƒƒƒƒƒƒƒƒƒƒƒƒƒƒƒƒƒƒƒƒƒƒƒƒƒƒƒƒƒƒƒƒƒƒƒƒƒƒƒƒƒƒƒƒƒƒƒCH-005 1994 12 10.0000 12.5000 17.5000 44.5833 47.5000 212.50001995 12 17.5000 28.7500 40.0000 69.7222 98.3333 225.00001996 12 2.5000 17.5000 27.5000 37.5417 40.0000 150.00001997 12 8.5000 15.2500 28.5833 40.4722 32.2500 174.50001998 10 41.0000 50.0000 62.5000 77.1500 96.5000 170.00001999 11 2.5000 7.5000 36.6667 61.2121 112.5000 200.00002000 12 10.0000 12.5000 16.2500 24.7917 27.5000 82.5000B-7
Near-surface TSS (mg/L)SITE WY N Minimum 25th Pctl 50th Pctl Mean 75th Pctl MaximumƒƒƒƒƒƒƒƒƒƒƒƒƒƒƒƒƒƒƒƒƒƒƒƒƒƒƒƒƒƒƒƒƒƒƒƒƒƒƒƒƒƒƒƒƒƒƒƒƒƒƒƒƒƒƒƒƒƒƒƒƒƒƒƒƒƒƒƒƒƒƒƒƒƒƒƒƒƒƒƒƒƒƒƒƒƒƒƒƒƒƒƒƒƒƒƒƒƒƒƒƒƒƒƒƒƒƒƒƒƒƒƒƒƒƒCH-001 1994 12 2.4000 3.5395 4.6995 7.7191 11.2615 20.09501995 12 2.7420 3.3835 3.9378 5.4818 7.4735 11.63201996 12 2.0000 3.2560 4.7685 4.8003 6.4000 7.87201997 12 4.0000 5.3500 8.2750 8.4458 10.4500 17.00001998 11 1.0000 3.6000 6.0000 6.9591 8.2500 21.20001999 10 2.2500 2.7600 11.5199 11.3728 12.2059 30.44442000 11 1.0000 8.0000 11.0000 17.2803 27.0000 52.0000CH-002 1994 12 3.5405 4.4670 8.2403 9.7618 14.4955 19.35401995 12 1.9830 4.0168 6.8448 7.7068 9.9420 17.87651996 12 3.2010 4.1103 5.0178 6.3188 9.4500 11.50001997 12 3.5333 8.7417 11.2000 11.9069 14.9583 20.85001998 11 1.0000 9.3333 12.0000 11.7803 15.2500 19.33331999 10 3.7125 9.0556 12.8363 16.8481 16.8666 57.90502000 11 3.5000 8.1730 36.0000 29.3059 46.9222 53.0000CH-02B 1994 12 3.1400 4.5745 6.7940 9.1915 13.3775 20.36951995 12 4.4030 5.1460 7.2345 9.2494 12.5725 19.56001996 12 3.1350 5.6463 8.4540 8.7894 10.3805 21.00001997 12 7.8000 11.1500 13.4500 15.1833 17.3000 26.40001998 11 1.0000 9.0000 11.0000 11.7364 17.2000 21.50001999 10 4.4400 5.6900 6.9685 8.5667 10.4000 19.41502000 11 5.1200 19.7500 30.2679 33.3762 43.0000 78.0000B-8
Near-surface TSS (mg/L)SITE WY N Minimum 25th Pctl 50th Pctl Mean 75th Pctl MaximumƒƒƒƒƒƒƒƒƒƒƒƒƒƒƒƒƒƒƒƒƒƒƒƒƒƒƒƒƒƒƒƒƒƒƒƒƒƒƒƒƒƒƒƒƒƒƒƒƒƒƒƒƒƒƒƒƒƒƒƒƒƒƒƒƒƒƒƒƒƒƒƒƒƒƒƒƒƒƒƒƒƒƒƒƒƒƒƒƒƒƒƒƒƒƒƒƒƒƒƒƒƒƒƒƒƒƒƒƒƒƒƒƒƒƒCH-029 1994 12 0.9800 2.0050 2.9030 5.7511 6.8180 20.00001995 12 1.8435 2.5325 3.6215 5.8034 7.4850 19.00001996 12 2.4700 5.3540 7.7883 8.8735 10.3750 23.50001997 12 2.7000 4.0000 5.7000 6.4750 8.9500 12.20001998 10 1.0000 4.0000 6.0000 5.7450 8.0000 9.20001999 10 1.6000 2.4600 2.9470 2.9634 3.4844 4.87102000 12 1.0000 4.5100 8.1050 15.6300 25.0000 53.0000CH-004 1994 12 5.7880 7.2255 9.8978 11.6701 14.1450 28.91301995 12 2.0380 4.6615 8.5475 9.7456 9.6115 27.94401996 12 2.0000 4.7215 6.2000 6.8171 8.6110 14.00001997 12 6.5000 9.8000 13.0500 15.6375 21.5500 34.80001998 9 1.0000 7.5000 13.5000 10.4722 14.0000 15.60001999 10 3.2840 7.5474 8.5954 9.0753 9.4419 17.38852000 12 4.0000 15.8827 26.2329 29.1636 44.0000 60.5000CH-05B 1994 12 2.7250 6.3170 8.1735 9.4790 12.1020 18.78801995 12 2.2500 4.6485 5.7950 7.4628 7.6120 24.56501996 12 3.5540 4.1310 6.1575 6.7903 6.9000 19.00001997 12 6.4000 10.4000 12.9000 13.4875 16.3000 20.90001998 10 1.0000 11.0000 12.2000 11.8300 15.0000 18.40001999 10 4.0770 6.3621 7.2844 7.4286 7.6964 11.69572000 12 3.0000 17.6161 33.0000 31.0135 40.7453 59.0000B-9
Near-surface TSS (mg/L)SITE WY N Minimum 25th Pctl 50th Pctl Mean 75th Pctl MaximumƒƒƒƒƒƒƒƒƒƒƒƒƒƒƒƒƒƒƒƒƒƒƒƒƒƒƒƒƒƒƒƒƒƒƒƒƒƒƒƒƒƒƒƒƒƒƒƒƒƒƒƒƒƒƒƒƒƒƒƒƒƒƒƒƒƒƒƒƒƒƒƒƒƒƒƒƒƒƒƒƒƒƒƒƒƒƒƒƒƒƒƒƒƒƒƒƒƒƒƒƒƒƒƒƒƒƒƒƒƒƒƒƒƒƒCH-005 1994 12 4.0450 6.4620 7.8943 9.4815 12.5380 17.18101995 12 2.9115 5.5158 7.9970 10.0582 15.9183 18.38151996 12 4.1370 5.7275 7.6118 7.8578 8.8000 13.86601997 12 5.9000 9.6500 11.8500 15.1292 20.3750 38.20001998 10 1.0000 15.0000 17.0000 16.2050 20.5000 20.80001999 11 2.6230 6.7303 7.4075 7.6919 9.3525 12.42882000 12 11.6846 20.9367 35.0449 34.7057 45.5000 60.5000B-10
Near-surface turbidity (NTU)SITE WY N Minimum 25th Pctl 50th Pctl Mean 75th Pctl MaximumƒƒƒƒƒƒƒƒƒƒƒƒƒƒƒƒƒƒƒƒƒƒƒƒƒƒƒƒƒƒƒƒƒƒƒƒƒƒƒƒƒƒƒƒƒƒƒƒƒƒƒƒƒƒƒƒƒƒƒƒƒƒƒƒƒƒƒƒƒƒƒƒƒƒƒƒƒƒƒƒƒƒƒƒƒƒƒƒƒƒƒƒƒƒƒƒƒƒƒƒƒƒƒƒƒƒƒƒƒƒƒƒƒƒƒCH-001 1994 12 0.8000 1.8000 3.2000 3.3417 4.1000 8.00001995 12 1.9000 2.2500 3.0000 3.6625 4.2500 9.40001996 12 2.2000 2.5000 2.8500 3.0083 3.2000 4.80001997 12 1.9000 2.3000 2.9500 3.0833 3.4500 5.80001998 11 1.3000 2.3000 2.9000 3.1091 4.0500 5.00001999 10 2.7000 2.8000 4.5000 5.6100 7.5000 12.20002000 11 1.5000 1.9000 2.6000 2.7545 3.5000 4.5000CH-002 1994 12 0.3500 2.1000 3.2500 3.0042 3.9250 4.70001995 12 1.8500 2.1750 2.7083 3.5181 4.3250 8.50001996 12 1.5000 1.8250 2.2250 2.5028 3.4417 3.70001997 12 1.8500 2.5000 2.9500 3.1153 3.3417 5.03331998 11 1.4500 2.7000 3.3667 3.4939 4.3333 6.25001999 10 2.2000 3.0000 5.1750 4.9533 7.5000 7.80002000 11 1.1500 1.4000 1.9500 2.8455 3.5500 9.1500CH-02B 1994 12 0.4000 1.9500 2.7500 2.6292 3.7000 4.55001995 12 1.6000 2.4750 3.2000 3.6125 4.2500 8.00001996 12 1.4000 2.4000 2.5500 3.0500 3.1000 7.70001997 12 2.0000 2.7500 3.0750 3.1958 3.8000 4.70001998 11 1.8000 2.1000 3.6000 3.5000 4.0000 7.30001999 10 1.8000 2.3500 3.1000 3.9050 4.5000 10.10002000 11 0.9000 1.1000 1.7000 2.4636 3.1000 6.0000B-11
Near-surface turbidity (NTU)SITE WY N Minimum 25th Pctl 50th Pctl Mean 75th Pctl MaximumƒƒƒƒƒƒƒƒƒƒƒƒƒƒƒƒƒƒƒƒƒƒƒƒƒƒƒƒƒƒƒƒƒƒƒƒƒƒƒƒƒƒƒƒƒƒƒƒƒƒƒƒƒƒƒƒƒƒƒƒƒƒƒƒƒƒƒƒƒƒƒƒƒƒƒƒƒƒƒƒƒƒƒƒƒƒƒƒƒƒƒƒƒƒƒƒƒƒƒƒƒƒƒƒƒƒƒƒƒƒƒƒƒƒƒCH-029 1994 12 1.4000 2.4000 3.7500 3.9000 5.3500 7.10001995 12 2.9500 3.2000 4.4500 5.5625 7.0500 13.40001996 12 3.3000 4.6750 7.3000 7.4958 8.5500 16.80001997 12 1.8000 2.5000 3.2000 3.7583 4.3000 8.40001998 10 2.5000 3.0000 3.6500 3.9500 4.5000 6.90001999 10 2.2000 3.0000 3.5000 3.6600 4.2000 5.50002000 12 1.8000 2.0000 2.4000 2.9333 4.0000 4.6000CH-004 1994 12 1.5000 2.0500 2.8500 3.7208 5.4500 7.00001995 12 2.5000 2.9500 3.9000 4.7833 4.7500 11.90001996 12 1.8000 2.6000 2.9000 3.3708 3.9250 7.20001997 12 2.2000 2.4500 3.0000 3.3667 3.9000 6.90001998 10 2.1000 2.4000 2.5750 3.0950 3.1000 7.90001999 10 2.6000 3.1000 3.7000 4.2850 5.5000 7.15002000 12 0.9000 1.1000 1.9500 2.6750 4.0750 5.9000CH-05B 1994 12 1.4000 1.9000 2.5000 2.4250 2.7000 3.90001995 12 1.5000 2.3000 2.4500 2.9958 3.2500 8.00001996 12 1.6000 1.8500 2.3000 2.4917 2.5500 5.10001997 12 1.9000 2.4500 2.9000 3.6208 4.7500 8.70001998 10 1.5000 2.0000 2.3000 3.1050 4.6500 6.00001999 10 2.3000 2.5000 2.8000 2.9500 3.3000 3.90002000 12 1.0000 1.2000 1.5000 3.0083 3.9000 10.7000B-12
Near-surface turbidity (NTU)SITE WY N Minimum 25th Pctl 50th Pctl Mean 75th Pctl MaximumƒƒƒƒƒƒƒƒƒƒƒƒƒƒƒƒƒƒƒƒƒƒƒƒƒƒƒƒƒƒƒƒƒƒƒƒƒƒƒƒƒƒƒƒƒƒƒƒƒƒƒƒƒƒƒƒƒƒƒƒƒƒƒƒƒƒƒƒƒƒƒƒƒƒƒƒƒƒƒƒƒƒƒƒƒƒƒƒƒƒƒƒƒƒƒƒƒƒƒƒƒƒƒƒƒƒƒƒƒƒƒƒƒƒƒCH-005 1994 12 1.0000 1.4750 2.1750 2.3739 2.7683 5.30001995 12 1.6000 2.4000 2.7000 3.3250 4.2000 6.60001996 12 1.8500 2.0000 2.2000 2.3875 2.7000 3.90001997 12 0.9500 1.6500 2.3000 2.6417 3.3250 6.20001998 10 0.9500 2.5000 2.8500 3.3850 4.4000 6.35001999 11 2.1000 2.2000 2.9000 2.9182 3.3000 4.20002000 12 0.7500 1.1500 1.9250 3.0708 4.8750 8.3500B-13
Secchi depth (m)SITE WY N Minimum 25th Pctl 50th Pctl Mean 75th Pctl MaximumƒƒƒƒƒƒƒƒƒƒƒƒƒƒƒƒƒƒƒƒƒƒƒƒƒƒƒƒƒƒƒƒƒƒƒƒƒƒƒƒƒƒƒƒƒƒƒƒƒƒƒƒƒƒƒƒƒƒƒƒƒƒƒƒƒƒƒƒƒƒƒƒƒƒƒƒƒƒƒƒƒƒƒƒƒƒƒƒƒƒƒƒƒƒƒƒƒƒƒƒƒƒƒƒƒƒƒƒƒƒƒƒƒƒƒCH-001 1994 12 0.4000 0.5000 0.5250 0.5917 0.7500 0.85001995 12 0.3000 0.4500 0.5500 0.5667 0.6500 0.95001996 12 0.6500 0.6500 0.7750 0.7750 0.9000 0.90001997 12 0.2500 0.4000 0.7500 0.7571 1.1000 1.20001998 11 0.3500 0.5500 0.6000 0.6444 0.6500 1.25001999 10 0.3500 0.4500 0.6000 0.6500 0.7500 1.15002000 11 0.5000 0.5500 0.6000 0.6071 0.6500 0.7500CH-002 1994 12 0.3700 0.5000 1.0500 1.1382 1.5500 2.10001995 12 0.3500 0.5750 1.0000 0.9958 1.4500 1.50001996 12 1.0500 1.3000 1.4750 1.5188 1.7250 2.10001997 12 0.4500 1.0750 1.3500 1.2375 1.5000 1.80001998 11 0.3500 0.6000 0.8500 0.7864 0.9500 1.35001999 10 0.3500 0.5500 0.8250 0.9320 1.1500 1.75002000 11 0.5500 0.7500 1.0500 1.1618 1.5500 2.0500CH-02B 1994 12 0.6700 0.8500 1.0000 0.9883 1.0500 1.35001995 12 0.4500 0.6500 0.7500 0.7700 0.8700 1.10001996 12 0.3000 0.7000 1.0000 0.9000 1.1500 1.25001997 12 0.4500 0.7500 1.0500 0.9750 1.2500 1.25001998 11 0.3500 0.4500 0.7000 0.7409 1.0000 1.35001999 10 0.6500 0.6500 0.7000 0.9000 1.2000 1.45002000 11 0.5500 0.8300 0.9500 0.9471 1.2000 1.2500B-14
Secchi depth (m)SITE WY N Minimum 25th Pctl 50th Pctl Mean 75th Pctl MaximumƒƒƒƒƒƒƒƒƒƒƒƒƒƒƒƒƒƒƒƒƒƒƒƒƒƒƒƒƒƒƒƒƒƒƒƒƒƒƒƒƒƒƒƒƒƒƒƒƒƒƒƒƒƒƒƒƒƒƒƒƒƒƒƒƒƒƒƒƒƒƒƒƒƒƒƒƒƒƒƒƒƒƒƒƒƒƒƒƒƒƒƒƒƒƒƒƒƒƒƒƒƒƒƒƒƒƒƒƒƒƒƒƒƒƒCH-029 1994 12 0.4000 0.5500 0.8200 0.8908 1.1250 1.75001995 12 0.3500 0.3750 0.5250 0.6104 0.7750 1.25001996 12 0.3500 0.5500 0.5500 0.6273 0.6000 1.35001997 12 0.4000 0.6500 0.8500 0.9479 1.2250 1.65001998 10 0.4500 0.5000 0.6500 0.6800 0.8500 1.00001999 10 0.4500 0.5000 1.0315 1.1463 1.5500 2.25002000 12 0.4500 0.7250 0.8750 0.8958 1.1000 1.4000CH-004 1994 12 0.4000 0.6000 0.9750 1.0675 1.5000 1.95001995 12 0.4000 0.5250 0.8500 0.8313 1.0250 1.55001996 12 0.5000 0.7500 1.1750 1.1583 1.5500 1.75001997 12 0.5500 0.8750 1.0250 1.1583 1.5375 1.80001998 10 0.4000 0.5500 0.6500 0.7833 1.0500 1.30001999 10 0.4500 0.5500 1.3000 1.1100 1.5500 1.65002000 12 0.5500 0.6500 1.1000 1.2409 1.7500 2.0000CH-05B 1994 12 0.8000 0.8000 0.9000 1.0000 1.2000 1.40001995 12 0.5500 0.6500 0.6500 0.8700 0.9500 1.55001996 12 0.9000 1.0000 1.0000 1.0750 1.1500 1.40001997 12 0.5000 0.9500 0.9500 1.0333 1.2500 1.35001998 10 0.5000 0.6500 1.0000 0.8667 1.0500 1.30001999 10 0.6500 0.6500 0.7500 0.9000 1.0000 1.45002000 12 0.6500 0.8500 1.3500 1.2000 1.4500 1.5000B-15
Secchi depth (m)SITE WY N Minimum 25th Pctl 50th Pctl Mean 75th Pctl MaximumƒƒƒƒƒƒƒƒƒƒƒƒƒƒƒƒƒƒƒƒƒƒƒƒƒƒƒƒƒƒƒƒƒƒƒƒƒƒƒƒƒƒƒƒƒƒƒƒƒƒƒƒƒƒƒƒƒƒƒƒƒƒƒƒƒƒƒƒƒƒƒƒƒƒƒƒƒƒƒƒƒƒƒƒƒƒƒƒƒƒƒƒƒƒƒƒƒƒƒƒƒƒƒƒƒƒƒƒƒƒƒƒƒƒƒCH-005 1994 12 0.4000 1.1750 1.6250 1.5592 1.9750 2.60001995 12 0.4000 0.7500 1.0250 1.1208 1.3500 2.55001996 12 1.0000 1.3250 1.7500 1.7042 2.1250 2.35001997 12 0.3500 1.3000 1.7000 1.5471 1.8000 2.25001998 10 0.5000 0.6500 1.1000 1.1450 1.4500 2.00001999 11 0.4500 0.5500 1.5750 1.4650 2.0000 2.95002000 12 0.8500 1.2000 1.5250 1.6667 2.0250 2.7500B-16
Near-surface pHSITE WY N Minimum 25th Pctl 50th Pctl Mean 75th Pctl Maximumƒƒƒƒƒƒƒƒƒƒƒƒƒƒƒƒƒƒƒƒƒƒƒƒƒƒƒƒƒƒƒƒƒƒƒƒƒƒƒƒƒƒƒƒƒƒƒƒƒƒƒƒƒƒƒƒƒƒƒƒƒƒƒƒƒƒƒƒƒƒƒƒƒƒƒƒƒƒƒƒƒƒƒƒƒƒƒƒƒƒƒƒƒƒƒƒƒƒƒƒƒƒƒƒƒƒƒƒƒƒƒƒƒƒƒ1 1994 12 6.4750 7.1125 7.3025 7.2663 7.4950 7.67501995 12 6.6100 6.9775 7.2700 7.1663 7.3850 7.44001996 12 6.6000 7.2100 7.3633 7.3342 7.5550 7.67331997 12 7.2250 7.3450 7.4758 7.4899 7.6370 7.75001998 11 6.7300 7.1800 7.8300 7.6336 7.8950 8.48331999 10 7.2033 7.7300 7.8900 7.8292 8.0400 8.21502000 11 7.1333 7.2567 7.7200 7.6542 7.9100 8.1750CH-002 1994 12 6.8117 7.4192 7.5965 7.5402 7.7456 7.91001995 12 6.6129 7.2164 7.3625 7.3636 7.6264 7.95861996 12 6.7443 7.4651 7.5936 7.5127 7.6653 7.71711997 12 7.0867 7.5664 7.6933 7.6346 7.7648 7.82831998 11 6.8760 7.5429 7.6567 7.5675 7.7186 8.02001999 10 7.4600 7.4914 7.8967 7.8233 7.9957 8.12502000 11 7.2033 7.5886 7.6780 7.6482 7.8114 7.9557CH-02B 1994 12 6.7900 7.4242 7.6250 7.5588 7.7517 8.06331995 12 7.0467 7.1475 7.3367 7.3992 7.6071 8.00671996 12 7.0633 7.4308 7.5883 7.5890 7.7667 7.94331997 12 7.2700 7.5517 7.6425 7.6213 7.7317 7.86001998 11 7.3300 7.5800 7.7033 7.7085 7.8150 8.03671999 10 7.2433 7.7550 7.8700 7.8312 8.0433 8.27002000 11 7.1300 7.4367 7.7500 7.6742 7.8900 8.0267B-17
Near-surface pHSITE WY N Minimum 25th Pctl 50th Pctl Mean 75th Pctl MaximumƒƒƒƒƒƒƒƒƒƒƒƒƒƒƒƒƒƒƒƒƒƒƒƒƒƒƒƒƒƒƒƒƒƒƒƒƒƒƒƒƒƒƒƒƒƒƒƒƒƒƒƒƒƒƒƒƒƒƒƒƒƒƒƒƒƒƒƒƒƒƒƒƒƒƒƒƒƒƒƒƒƒƒƒƒƒƒƒƒƒƒƒƒƒƒƒƒƒƒƒƒƒƒƒƒƒƒƒƒƒƒƒƒƒƒCH-029 1994 12 5.5075 6.8271 7.0129 6.9694 7.3954 7.44751995 12 6.1475 6.4740 6.7683 6.7446 6.9392 7.42601996 12 6.3520 7.0420 7.2733 7.2304 7.6375 7.73671997 12 6.8475 7.1148 7.2123 7.2360 7.3733 7.55201998 10 6.9150 7.1325 7.2638 7.5294 7.8475 8.59001999 10 7.0020 7.1533 7.3720 7.3877 7.5200 8.23252000 12 6.9533 7.1170 7.3175 7.2786 7.3950 7.6200CH-004 1994 12 5.6875 7.4383 7.5520 7.5114 7.9545 8.20201995 12 6.5200 7.0795 7.3615 7.2766 7.5628 7.94001996 12 6.5840 7.0123 7.4350 7.3271 7.6260 7.71501997 12 6.8320 7.4450 7.6123 7.5720 7.7742 7.92001998 10 7.0625 7.3080 7.3846 7.5800 7.7260 8.91401999 10 7.2500 7.4720 7.6830 7.6541 7.8800 7.93002000 12 7.3100 7.6170 7.7230 7.6994 7.8555 7.9725CH-05B 1994 12 6.7300 7.4483 7.5617 7.5946 7.9025 8.10331995 12 6.9700 7.1567 7.3767 7.3607 7.5633 7.70001996 12 7.0033 7.2383 7.5133 7.4381 7.6200 7.73001997 12 7.2367 7.4483 7.7267 7.6324 7.8083 7.86251998 10 7.0400 7.3733 7.4400 7.4611 7.5900 7.95671999 10 7.4200 7.5300 7.8450 7.7838 7.9200 8.17672000 12 6.9400 7.5917 7.6850 7.6333 7.7767 8.0267B-18
Near-surface pHSITE WY N Minimum 25th Pctl 50th Pctl Mean 75th Pctl MaximumƒƒƒƒƒƒƒƒƒƒƒƒƒƒƒƒƒƒƒƒƒƒƒƒƒƒƒƒƒƒƒƒƒƒƒƒƒƒƒƒƒƒƒƒƒƒƒƒƒƒƒƒƒƒƒƒƒƒƒƒƒƒƒƒƒƒƒƒƒƒƒƒƒƒƒƒƒƒƒƒƒƒƒƒƒƒƒƒƒƒƒƒƒƒƒƒƒƒƒƒƒƒƒƒƒƒƒƒƒƒƒƒƒƒƒCH-005 1994 12 6.7843 7.5728 7.7489 7.7060 8.0025 8.17291995 12 6.8400 7.3394 7.5875 7.4808 7.7349 7.81501996 12 6.8629 7.4306 7.5529 7.5039 7.6571 7.78861997 12 7.3529 7.5436 7.7329 7.6777 7.7806 7.94001998 10 7.2886 7.4643 7.6164 7.6101 7.7914 7.85141999 11 7.5143 7.5675 7.8329 7.7758 7.9525 7.98132000 12 7.0786 7.6264 7.7600 7.7004 7.8392 8.0900B-19
DO (mg/L) – all depthsSITE WY N Minimum 25th Pctl 50th Pctl Mean 75th Pctl MaximumƒƒƒƒƒƒƒƒƒƒƒƒƒƒƒƒƒƒƒƒƒƒƒƒƒƒƒƒƒƒƒƒƒƒƒƒƒƒƒƒƒƒƒƒƒƒƒƒƒƒƒƒƒƒƒƒƒƒƒƒƒƒƒƒƒƒƒƒƒƒƒƒƒƒƒƒƒƒƒƒƒƒƒƒƒƒƒƒƒƒƒƒƒƒƒƒƒƒƒƒƒƒƒƒƒƒƒƒƒƒƒƒƒƒƒCH-001 1994 24 4.1400 5.5850 6.8400 6.5746 7.4800 9.18001995 24 4.1200 5.1200 6.0700 6.0588 6.7550 8.06001996 23 5.0000 5.7400 7.6500 7.0904 7.8400 9.07001997 33 4.7100 6.2500 6.6400 6.8564 7.6600 9.48001998 23 3.5100 6.6400 7.0500 7.2396 8.4400 9.71001999 22 3.6300 5.5600 6.1700 6.3582 6.4100 9.39002000 24 3.7400 5.4950 6.3800 6.5400 8.1300 9.6700CH-002 1994 77 3.6600 5.5700 6.5700 6.4001 7.5200 9.10001995 82 3.0300 5.7600 6.2350 6.1340 6.7400 10.67001996 84 2.9100 6.2050 6.8200 6.7848 7.6150 8.85001997 75 3.7000 6.0500 6.6400 6.6995 7.2300 10.70001998 66 4.3200 5.5900 7.0100 7.0365 8.3700 9.89001999 60 3.1600 5.4900 6.4600 6.2465 6.8700 9.27002000 69 3.9600 5.2000 6.9300 6.4358 7.3000 8.6400CH-02B 1994 35 2.3200 5.5700 6.5100 6.2754 7.1100 8.75001995 33 0.4900 4.9000 6.0100 5.7555 6.6400 9.70001996 34 4.8500 6.0900 6.4950 6.7812 7.4900 8.58001997 34 2.3800 5.6300 6.4300 6.4168 6.9000 9.89001998 28 2.7100 5.5500 7.2100 6.9954 8.7450 12.10001999 23 0.0500 5.4100 6.1300 5.6387 6.9000 9.98002000 29 1.1400 5.1300 6.2800 5.9624 7.3300 8.4000B-20
DO (mg/L) – all depthsSITE WY N Minimum 25th Pctl 50th Pctl Mean 75th Pctl MaximumƒƒƒƒƒƒƒƒƒƒƒƒƒƒƒƒƒƒƒƒƒƒƒƒƒƒƒƒƒƒƒƒƒƒƒƒƒƒƒƒƒƒƒƒƒƒƒƒƒƒƒƒƒƒƒƒƒƒƒƒƒƒƒƒƒƒƒƒƒƒƒƒƒƒƒƒƒƒƒƒƒƒƒƒƒƒƒƒƒƒƒƒƒƒƒƒƒƒƒƒƒƒƒƒƒƒƒƒƒƒƒƒƒƒƒCH-029 1994 45 3.1900 4.3500 5.0100 5.3893 6.7300 8.58001995 45 3.4700 4.3900 6.5500 6.2311 7.1000 10.41001996 51 3.3100 4.2800 7.3600 6.5692 8.7300 9.74001997 51 4.5700 5.3000 6.1800 6.3004 7.3000 8.54001998 41 4.3400 4.9900 6.0600 6.1115 7.2400 8.15001999 39 3.3100 4.2500 6.2500 5.9603 7.2500 9.91002000 48 3.2200 4.7300 5.9850 5.8463 6.7450 8.1500CH-004 1994 55 0.2900 4.7000 6.0500 5.5749 6.9800 8.34001995 54 1.0000 3.8800 5.5950 5.2602 6.3900 8.83001996 61 1.7500 4.3400 6.2800 6.2752 8.2800 10.59001997 64 1.1200 5.7650 6.5100 6.2597 7.7000 8.18001998 48 1.2600 4.2650 5.7450 5.1710 6.4950 8.07001999 46 1.0400 4.0400 6.0800 5.9767 8.3500 10.85002000 58 1.9900 4.4900 6.2700 5.9417 7.2400 8.6700CH-05B 1994 33 0.6300 5.0200 6.2600 5.9318 7.1400 7.92001995 30 1.4300 4.9000 5.5800 5.4080 6.0200 8.14001996 34 4.0000 4.8400 6.6050 6.4488 7.7300 9.00001997 38 3.5300 6.1800 6.7500 6.7237 7.7300 8.25001998 29 0.7100 4.6300 5.7500 5.4410 7.2500 8.13001999 24 1.0500 5.5050 6.5600 6.5988 9.6650 11.89002000 34 3.5100 5.7000 6.3600 6.1944 6.5500 8.4900B-21
DO (mg/L) – all depthsSITE WY N Minimum 25th Pctl 50th Pctl Mean 75th Pctl MaximumƒƒƒƒƒƒƒƒƒƒƒƒƒƒƒƒƒƒƒƒƒƒƒƒƒƒƒƒƒƒƒƒƒƒƒƒƒƒƒƒƒƒƒƒƒƒƒƒƒƒƒƒƒƒƒƒƒƒƒƒƒƒƒƒƒƒƒƒƒƒƒƒƒƒƒƒƒƒƒƒƒƒƒƒƒƒƒƒƒƒƒƒƒƒƒƒƒƒƒƒƒƒƒƒƒƒƒƒƒƒƒƒƒƒƒCH-005 1994 73 0.0500 4.3700 6.1400 5.4493 7.0700 8.23001995 80 0.0500 4.5050 5.7350 5.1195 6.3700 8.24001996 87 0.7700 4.8800 6.5100 5.9863 7.9800 9.71001997 88 0.7600 6.1150 6.4800 6.4924 7.2900 10.47001998 70 1.0800 3.9500 5.5000 5.0393 6.1500 8.20001999 74 0.4600 3.2200 5.8350 5.2928 7.7200 9.67002000 83 0.8300 5.0500 6.5200 6.0577 7.1300 8.2800B-22
Near-surface PO 4 —P (mg P/L)SITE WY N Minimum 25th Pctl 50th Pctl Mean 75th Pctl MaximumƒƒƒƒƒƒƒƒƒƒƒƒƒƒƒƒƒƒƒƒƒƒƒƒƒƒƒƒƒƒƒƒƒƒƒƒƒƒƒƒƒƒƒƒƒƒƒƒƒƒƒƒƒƒƒƒƒƒƒƒƒƒƒƒƒƒƒƒƒƒƒƒƒƒƒƒƒƒƒƒƒƒƒƒƒƒƒƒƒƒƒƒƒƒƒƒƒƒƒƒƒƒƒƒƒƒƒƒƒƒƒƒƒƒƒCH-001 1994 12 0.0770 0.0855 0.1135 0.1363 0.1800 0.27501995 12 0.1260 0.1988 0.2465 0.2448 0.2985 0.34101996 12 0.1270 0.1560 0.2073 0.2048 0.2293 0.32601997 12 0.1070 0.1203 0.1725 0.1979 0.2550 0.41001998 11 0.0050 0.2000 0.2300 0.2282 0.2600 0.38001999 10 0.1320 0.1330 0.1880 0.2318 0.3070 0.51502000 11 0.0360 0.0720 0.1580 0.1396 0.1960 0.2380CH-002 1994 12 0.0360 0.0438 0.0708 0.0860 0.1255 0.17401995 12 0.1210 0.1518 0.2043 0.2075 0.2548 0.32301996 12 0.1020 0.1178 0.1638 0.1711 0.1948 0.28901997 12 0.0610 0.0775 0.1052 0.1356 0.1559 0.38501998 11 0.0050 0.2000 0.2170 0.2073 0.2420 0.31001999 10 0.0835 0.1095 0.1681 0.2072 0.3015 0.43352000 11 0.0505 0.0730 0.0975 0.1025 0.1280 0.1895CH-02B 1994 12 0.0300 0.0370 0.0475 0.0708 0.1040 0.15101995 12 0.0890 0.1170 0.1755 0.1656 0.1960 0.26401996 12 0.0815 0.1145 0.1275 0.1440 0.1615 0.24301997 12 0.0420 0.0640 0.0820 0.0952 0.1005 0.26001998 11 0.0050 0.1100 0.1500 0.1501 0.2130 0.22301999 10 0.0850 0.0880 0.1350 0.1673 0.2190 0.33202000 11 0.0440 0.0540 0.0890 0.0896 0.1090 0.1670B-23
Near-surface PO 4 —P (mg P/L)SITE WY N Minimum 25th Pctl 50th Pctl Mean 75th Pctl MaximumƒƒƒƒƒƒƒƒƒƒƒƒƒƒƒƒƒƒƒƒƒƒƒƒƒƒƒƒƒƒƒƒƒƒƒƒƒƒƒƒƒƒƒƒƒƒƒƒƒƒƒƒƒƒƒƒƒƒƒƒƒƒƒƒƒƒƒƒƒƒƒƒƒƒƒƒƒƒƒƒƒƒƒƒƒƒƒƒƒƒƒƒƒƒƒƒƒƒƒƒƒƒƒƒƒƒƒƒƒƒƒƒƒƒƒCH-029 1994 12 0.4450 0.4655 0.5470 0.5574 0.6170 0.81401995 12 0.1980 0.5855 0.7515 0.7077 0.8295 1.07801996 12 0.3950 0.4620 0.5223 0.5314 0.6110 0.66751997 12 0.4060 0.4480 0.4870 0.5114 0.5750 0.66501998 10 0.4170 0.5300 0.5980 0.5964 0.6650 0.80401999 10 0.4050 0.5170 0.5675 0.6013 0.6890 0.94702000 12 0.2810 0.4510 0.4970 0.4866 0.5798 0.6050CH-004 1994 12 0.0930 0.1230 0.1650 0.1939 0.2270 0.46401995 11 0.3135 0.3820 0.4480 0.4529 0.5310 0.69901996 12 0.1790 0.2230 0.2655 0.2940 0.3630 0.45501997 12 0.0860 0.1005 0.1240 0.1669 0.2250 0.39001998 10 0.2500 0.2800 0.3380 0.3540 0.4000 0.52751999 10 0.0980 0.1860 0.2353 0.2791 0.3390 0.70002000 11 0.0240 0.0900 0.1200 0.1480 0.1390 0.4560CH-05B 1994 12 0.0535 0.0580 0.0885 0.1161 0.1740 0.24701995 12 0.1390 0.1790 0.2235 0.2480 0.3105 0.38301996 12 0.0940 0.1500 0.1885 0.1958 0.2520 0.30501997 12 0.0460 0.0655 0.0805 0.1127 0.1460 0.33001998 10 0.0050 0.1780 0.2350 0.2170 0.2840 0.34001999 10 0.0820 0.0880 0.1435 0.1620 0.2310 0.34402000 12 0.0270 0.0645 0.0770 0.0895 0.1060 0.1950B-24
Near-surface PO 4 —P (mg P/L)SITE WY N Minimum 25th Pctl 50th Pctl Mean 75th Pctl MaximumƒƒƒƒƒƒƒƒƒƒƒƒƒƒƒƒƒƒƒƒƒƒƒƒƒƒƒƒƒƒƒƒƒƒƒƒƒƒƒƒƒƒƒƒƒƒƒƒƒƒƒƒƒƒƒƒƒƒƒƒƒƒƒƒƒƒƒƒƒƒƒƒƒƒƒƒƒƒƒƒƒƒƒƒƒƒƒƒƒƒƒƒƒƒƒƒƒƒƒƒƒƒƒƒƒƒƒƒƒƒƒƒƒƒƒCH-005 1994 12 0.0180 0.0538 0.0718 0.1020 0.1278 0.33601995 12 0.1450 0.1985 0.2368 0.2573 0.3283 0.39001996 12 0.1045 0.1190 0.1588 0.1779 0.2360 0.29951997 12 0.0310 0.0433 0.0548 0.0835 0.1073 0.27001998 10 0.0050 0.1700 0.1850 0.2008 0.2425 0.36051999 11 0.0543 0.0790 0.1463 0.1793 0.2285 0.59952000 12 0.0285 0.0493 0.0600 0.0714 0.0825 0.1865B-25
Near-surface DIN (mg N/L)SITE WY N Minimum 25th Pctl 50th Pctl Mean 75th Pctl MaximumƒƒƒƒƒƒƒƒƒƒƒƒƒƒƒƒƒƒƒƒƒƒƒƒƒƒƒƒƒƒƒƒƒƒƒƒƒƒƒƒƒƒƒƒƒƒƒƒƒƒƒƒƒƒƒƒƒƒƒƒƒƒƒƒƒƒƒƒƒƒƒƒƒƒƒƒƒƒƒƒƒƒƒƒƒƒƒƒƒƒƒƒƒƒƒƒƒƒƒƒƒƒƒƒƒƒƒƒƒƒƒƒƒƒƒCH-001 1994 12 0.0100 0.0415 0.1050 0.0972 0.1390 0.18901995 12 0.0235 0.0645 0.1038 0.0951 0.1298 0.13701996 12 0.0200 0.0570 0.1045 0.0889 0.1170 0.13551997 12 0.0100 0.0175 0.0310 0.0729 0.0980 0.29401998 11 0.0100 0.0100 0.0920 0.0892 0.1390 0.22001999 10 0.0100 0.0100 0.0410 0.0562 0.0960 0.13702000 11 0.0100 0.0220 0.0780 0.1136 0.1440 0.4110CH-002 1994 12 0.0100 0.0135 0.0443 0.0536 0.0753 0.14101995 12 0.0100 0.0145 0.0688 0.0841 0.1435 0.20001996 12 0.0100 0.0178 0.0258 0.0544 0.0738 0.21001997 12 0.0100 0.0100 0.0138 0.0473 0.0293 0.32001998 11 0.0100 0.0100 0.1067 0.0919 0.1367 0.23001999 10 0.0100 0.0100 0.0150 0.0433 0.0215 0.15102000 11 0.0185 0.0260 0.0570 0.0497 0.0695 0.0785CH-02B 1994 12 0.0100 0.0100 0.0135 0.0507 0.0850 0.16201995 12 0.0100 0.0183 0.0455 0.0889 0.0885 0.34001996 12 0.0100 0.0178 0.0245 0.0616 0.0810 0.25701997 12 0.0100 0.0100 0.0160 0.0422 0.0480 0.21101998 11 0.0100 0.0100 0.0100 0.0463 0.0900 0.17001999 10 0.0100 0.0100 0.0150 0.0459 0.0230 0.24702000 11 0.0100 0.0290 0.0470 0.0533 0.0780 0.1150B-26
Near-surface DIN (mg N/L)SITE WY N Minimum 25th Pctl 50th Pctl Mean 75th Pctl MaximumƒƒƒƒƒƒƒƒƒƒƒƒƒƒƒƒƒƒƒƒƒƒƒƒƒƒƒƒƒƒƒƒƒƒƒƒƒƒƒƒƒƒƒƒƒƒƒƒƒƒƒƒƒƒƒƒƒƒƒƒƒƒƒƒƒƒƒƒƒƒƒƒƒƒƒƒƒƒƒƒƒƒƒƒƒƒƒƒƒƒƒƒƒƒƒƒƒƒƒƒƒƒƒƒƒƒƒƒƒƒƒƒƒƒƒCH-029 1994 12 0.0100 0.3565 0.5190 0.4878 0.6180 0.98001995 12 0.0250 0.2830 0.3810 0.4361 0.4715 1.37501996 12 0.0250 0.1705 0.3725 0.4731 0.6495 1.53301997 12 0.0240 0.2505 0.4490 0.4451 0.6525 0.88701998 10 0.0100 0.0100 0.4135 0.3632 0.4880 0.85001999 10 0.0210 0.0500 0.3090 0.3188 0.4390 0.75602000 12 0.0240 0.0690 0.4645 0.3577 0.5240 0.7420CH-004 1994 12 0.0250 0.0330 0.1090 0.1246 0.1833 0.29801995 12 0.0100 0.0138 0.2853 0.2011 0.3215 0.44701996 12 0.0100 0.0255 0.0605 0.1264 0.2695 0.29751997 12 0.0100 0.0100 0.0285 0.0853 0.0513 0.44201998 10 0.0100 0.0100 0.1240 0.1656 0.3150 0.43001999 10 0.0100 0.0100 0.1750 0.1487 0.2710 0.33502000 12 0.0190 0.0288 0.0420 0.0638 0.0560 0.3240CH-05B 1994 12 0.0100 0.0130 0.0350 0.0647 0.0718 0.34801995 12 0.0100 0.0295 0.0818 0.1290 0.2180 0.38901996 12 0.0100 0.0255 0.0355 0.0523 0.0600 0.21001997 12 0.0100 0.0100 0.0100 0.0225 0.0280 0.09001998 10 0.0100 0.0100 0.0435 0.0874 0.1500 0.30001999 10 0.0100 0.0100 0.0150 0.0388 0.0280 0.19802000 12 0.0100 0.0155 0.0423 0.0590 0.0615 0.2810B-27
Near-surface DIN (mg N/L)SITE WY N Minimum 25th Pctl 50th Pctl Mean 75th Pctl MaximumƒƒƒƒƒƒƒƒƒƒƒƒƒƒƒƒƒƒƒƒƒƒƒƒƒƒƒƒƒƒƒƒƒƒƒƒƒƒƒƒƒƒƒƒƒƒƒƒƒƒƒƒƒƒƒƒƒƒƒƒƒƒƒƒƒƒƒƒƒƒƒƒƒƒƒƒƒƒƒƒƒƒƒƒƒƒƒƒƒƒƒƒƒƒƒƒƒƒƒƒƒƒƒƒƒƒƒƒƒƒƒƒƒƒƒCH-005 1994 12 0.0100 0.0200 0.0245 0.0702 0.0838 0.40101995 12 0.0160 0.0253 0.0840 0.1365 0.2480 0.37051996 12 0.0200 0.0233 0.0505 0.0844 0.0850 0.28451997 12 0.0100 0.0100 0.0155 0.0576 0.0275 0.28501998 10 0.0100 0.0100 0.0410 0.1039 0.1600 0.33001999 11 0.0100 0.0150 0.0259 0.0837 0.1365 0.26802000 12 0.0100 0.0293 0.0415 0.0626 0.0513 0.2465B-28
Near-surface chlorophyll-a (µg/L)SITE WY N Minimum 25th Pctl 50th Pctl Mean 75th Pctl MaximumƒƒƒƒƒƒƒƒƒƒƒƒƒƒƒƒƒƒƒƒƒƒƒƒƒƒƒƒƒƒƒƒƒƒƒƒƒƒƒƒƒƒƒƒƒƒƒƒƒƒƒƒƒƒƒƒƒƒƒƒƒƒƒƒƒƒƒƒƒƒƒƒƒƒƒƒƒƒƒƒƒƒƒƒƒƒƒƒƒƒƒƒƒƒƒƒƒƒƒƒƒƒƒƒƒƒƒƒƒƒƒƒƒƒƒCH-001 1994 11 1.4000 1.5200 3.3800 6.9265 10.8100 24.61001995 12 1.4200 2.5050 4.5400 4.8908 6.3075 13.44001996 12 1.2300 1.6900 4.2225 5.8388 6.3900 27.50001997 12 0.5000 3.0700 4.8125 6.4292 10.0200 15.50001998 11 0.5000 0.5000 0.5000 1.8768 3.3400 5.87501999 10 2.2300 4.7600 6.0400 10.7250 11.4000 44.90002000 11 1.0700 2.6700 5.8700 6.8073 8.5400 19.1000CH-002 1994 12 1.5000 2.6955 5.7825 6.7092 9.3200 17.28501995 12 1.1900 3.1067 4.6175 13.0111 20.3650 53.46501996 12 0.5000 2.2250 6.4600 6.4218 9.8250 11.75001997 12 1.1650 5.3850 5.6875 7.5950 7.4767 28.66671998 11 0.5000 2.4800 5.0750 5.0376 7.1433 11.49501999 10 2.1850 6.0600 13.0417 16.4363 27.3000 32.35002000 11 1.4700 2.4050 5.0650 6.8400 9.5900 21.4000CH-02B 1994 12 1.3600 3.1950 5.5100 7.2855 7.4675 31.40001995 12 2.9650 3.7450 6.5625 11.5358 16.4250 41.02001996 12 0.5000 2.3000 4.6550 4.9904 6.1050 12.30001997 12 0.5000 5.0750 6.0050 7.7208 7.8900 22.30001998 11 0.5000 3.3400 6.1000 18.4700 16.6000 93.50001999 10 3.1200 5.1600 9.2000 15.6695 14.6000 48.70002000 11 1.3400 2.1400 10.1460 8.5424 13.4000 18.9000B-29
Near-surface chlorophyll-a (µg/L)SITE WY N Minimum 25th Pctl 50th Pctl Mean 75th Pctl MaximumƒƒƒƒƒƒƒƒƒƒƒƒƒƒƒƒƒƒƒƒƒƒƒƒƒƒƒƒƒƒƒƒƒƒƒƒƒƒƒƒƒƒƒƒƒƒƒƒƒƒƒƒƒƒƒƒƒƒƒƒƒƒƒƒƒƒƒƒƒƒƒƒƒƒƒƒƒƒƒƒƒƒƒƒƒƒƒƒƒƒƒƒƒƒƒƒƒƒƒƒƒƒƒƒƒƒƒƒƒƒƒƒƒƒƒCH-029 1994 12 0.5000 0.8450 2.3455 3.2015 3.6600 13.70001995 12 1.0350 1.5200 2.9800 13.2795 35.3900 40.94001996 12 0.5000 4.7900 10.1625 11.5458 17.7150 30.70001997 12 0.5000 1.0500 3.6350 7.5042 7.7800 46.50001998 10 0.5000 0.5000 5.0725 8.6195 14.7000 30.10001999 10 1.4900 1.6800 5.7700 8.0500 13.8000 21.10002000 12 1.0200 3.2500 9.5350 8.6558 12.2500 18.4500CH-004 1994 12 1.1890 3.0950 6.4465 20.0743 22.7500 126.30001995 11 1.3800 2.5200 4.7300 13.5718 22.1200 62.69001996 12 1.6100 5.9300 9.6100 18.5263 20.1400 98.70001997 12 0.5000 2.6700 5.5000 6.6946 10.5350 16.60001998 10 0.5000 0.5000 3.6350 4.5655 5.5300 15.50001999 10 6.2200 8.4300 10.6250 16.2500 21.4000 38.60002000 11 0.5000 1.0700 4.8100 9.4586 17.8000 35.4000CH-05B 1994 12 1.0100 2.7750 4.4160 6.4302 10.4050 14.88001995 12 1.3900 5.1000 6.8425 8.2354 8.7600 27.77001996 12 0.5000 2.4550 6.4250 7.4650 9.4650 23.50001997 12 0.5000 2.9400 4.5450 4.9258 6.3500 10.70001998 10 0.5000 2.0000 6.6750 7.3580 9.3400 21.40001999 10 4.6900 5.8000 10.1550 12.9450 18.7000 25.45002000 11 0.5000 2.1360 4.4500 4.7160 6.4100 11.7000B-30
Near-surface chlorophyll-a (µg/L)SITE WY N Minimum 25th Pctl 50th Pctl Mean 75th Pctl MaximumƒƒƒƒƒƒƒƒƒƒƒƒƒƒƒƒƒƒƒƒƒƒƒƒƒƒƒƒƒƒƒƒƒƒƒƒƒƒƒƒƒƒƒƒƒƒƒƒƒƒƒƒƒƒƒƒƒƒƒƒƒƒƒƒƒƒƒƒƒƒƒƒƒƒƒƒƒƒƒƒƒƒƒƒƒƒƒƒƒƒƒƒƒƒƒƒƒƒƒƒƒƒƒƒƒƒƒƒƒƒƒƒƒƒƒCH-005 1994 12 0.5000 2.5500 4.1208 11.6510 20.9625 44.79501995 12 2.3500 2.5900 7.6300 8.4311 10.5600 26.70001996 12 2.0150 4.1625 5.7875 7.5167 8.3850 23.39501997 12 1.0350 2.3325 3.6050 6.9400 6.3450 39.65501998 10 0.5000 1.0700 4.3375 4.0545 5.6050 8.82001999 11 3.4750 5.6267 6.9025 9.8687 9.4500 26.15002000 11 1.5700 2.0050 3.9150 5.8820 9.5900 15.3500B-31