Peace and Myakka River Water Quality Summary 2002 - Southwest ...
Peace and Myakka River Water Quality Summary 2002 - Southwest ...
Peace and Myakka River Water Quality Summary 2002 - Southwest ...

You also want an ePaper? Increase the reach of your titles
YUMPU automatically turns print PDFs into web optimized ePapers that Google loves.
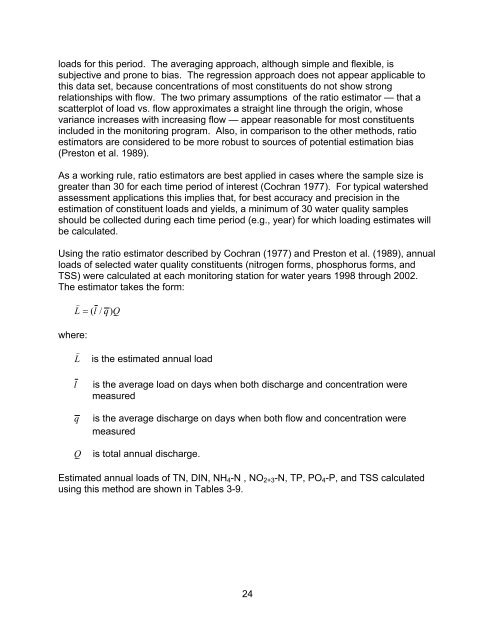
loads for this period. The averaging approach, although simple <strong>and</strong> flexible, issubjective <strong>and</strong> prone to bias. The regression approach does not appear applicable tothis data set, because concentrations of most constituents do not show strongrelationships with flow. The two primary assumptions of the ratio estimator — that ascatterplot of load vs. flow approximates a straight line through the origin, whosevariance increases with increasing flow — appear reasonable for most constituentsincluded in the monitoring program. Also, in comparison to the other methods, ratioestimators are considered to be more robust to sources of potential estimation bias(Preston et al. 1989).As a working rule, ratio estimators are best applied in cases where the sample size isgreater than 30 for each time period of interest (Cochran 1977). For typical watershedassessment applications this implies that, for best accuracy <strong>and</strong> precision in theestimation of constituent loads <strong>and</strong> yields, a minimum of 30 water quality samplesshould be collected during each time period (e.g., year) for which loading estimates willbe calculated.Using the ratio estimator described by Cochran (1977) <strong>and</strong> Preston et al. (1989), annualloads of selected water quality constituents (nitrogen forms, phosphorus forms, <strong>and</strong>TSS) were calculated at each monitoring station for water years 1998 through <strong>2002</strong>.The estimator takes the form:)L = ( l / q)Qwhere:L )lqQis the estimated annual loadis the average load on days when both discharge <strong>and</strong> concentration weremeasuredis the average discharge on days when both flow <strong>and</strong> concentration weremeasuredis total annual discharge.Estimated annual loads of TN, DIN, NH 4 -N , NO 2+3 -N, TP, PO 4 -P, <strong>and</strong> TSS calculatedusing this method are shown in Tables 3-9.24