Translation Bureau Benchmarking and Comparative Analysis - Final ...
Translation Bureau Benchmarking and Comparative Analysis - Final ...
Translation Bureau Benchmarking and Comparative Analysis - Final ...

You also want an ePaper? Increase the reach of your titles
YUMPU automatically turns print PDFs into web optimized ePapers that Google loves.
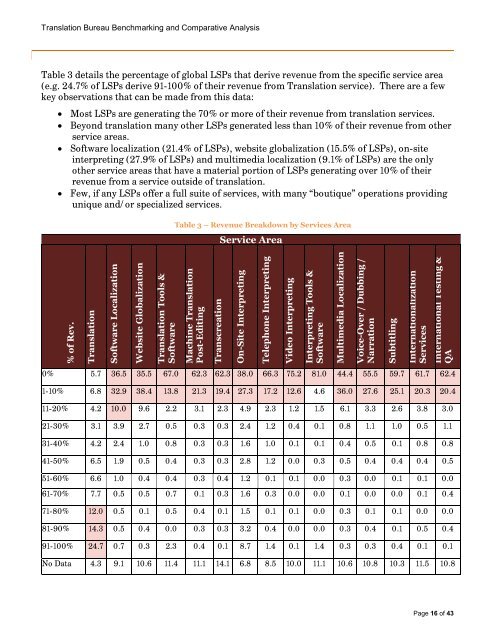
<strong>Translation</strong> <strong>Bureau</strong> <strong>Benchmarking</strong> <strong>and</strong> <strong>Comparative</strong> <strong>Analysis</strong>Table 3 details the percentage of global LSPs that derive revenue from the specific service area(e.g. 24.7% of LSPs derive 91-100% of their revenue from <strong>Translation</strong> service). There are a fewkey observations that can be made from this data:• Most LSPs are generating the 70% or more of their revenue from translation services.• Beyond translation many other LSPs generated less than 10% of their revenue from otherservice areas.• Software localization (21.4% of LSPs), website globalization (15.5% of LSPs), on-siteinterpreting (27.9% of LSPs) <strong>and</strong> multimedia localization (9.1% of LSPs) are the onlyother service areas that have a material portion of LSPs generating over 10% of theirrevenue from a service outside of translation.• Few, if any LSPs offer a full suite of services, with many “boutique” operations providingunique <strong>and</strong>/or specialized services.Table 3 – Revenue Breakdown by Services AreaService Area% of Rev.<strong>Translation</strong>Software LocalizationWebsite Globalization<strong>Translation</strong> Tools &SoftwareMachine <strong>Translation</strong>Post-EditingTranscreationOn-Site InterpretingTelephone InterpretingVideo InterpretingInterpreting Tools &SoftwareMultimedia LocalizationVoice-Over / Dubbing /NarrationSubtitlingInternationalizationServicesInternational Testing &QA0% 5.7 36.5 35.5 67.0 62.3 62.3 38.0 66.3 75.2 81.0 44.4 55.5 59.7 61.7 62.41-10% 6.8 32.9 38.4 13.8 21.3 19.4 27.3 17.2 12.6 4.6 36.0 27.6 25.1 20.3 20.411-20% 4.2 10.0 9.6 2.2 3.1 2.3 4.9 2.3 1.2 1.5 6.1 3.3 2.6 3.8 3.021-30% 3.1 3.9 2.7 0.5 0.3 0.3 2.4 1.2 0.4 0.1 0.8 1.1 1.0 0.5 1.131-40% 4.2 2.4 1.0 0.8 0.3 0.3 1.6 1.0 0.1 0.1 0.4 0.5 0.1 0.8 0.841-50% 6.5 1.9 0.5 0.4 0.3 0.3 2.8 1.2 0.0 0.3 0.5 0.4 0.4 0.4 0.551-60% 6.6 1.0 0.4 0.4 0.3 0.4 1.2 0.1 0.1 0.0 0.3 0.0 0.1 0.1 0.061-70% 7.7 0.5 0.5 0.7 0.1 0.3 1.6 0.3 0.0 0.0 0.1 0.0 0.0 0.1 0.471-80% 12.0 0.5 0.1 0.5 0.4 0.1 1.5 0.1 0.1 0.0 0.3 0.1 0.1 0.0 0.081-90% 14.3 0.5 0.4 0.0 0.3 0.3 3.2 0.4 0.0 0.0 0.3 0.4 0.1 0.5 0.491-100% 24.7 0.7 0.3 2.3 0.4 0.1 8.7 1.4 0.1 1.4 0.3 0.3 0.4 0.1 0.1No Data 4.3 9.1 10.6 11.4 11.1 14.1 6.8 8.5 10.0 11.1 10.6 10.8 10.3 11.5 10.8Page 16 of 43