Section 10.2 â Polar Equations and Graphs cos r a cos x r= sin r b 2 ...
Section 10.2 â Polar Equations and Graphs cos r a cos x r= sin r b 2 ...
Section 10.2 â Polar Equations and Graphs cos r a cos x r= sin r b 2 ...
You also want an ePaper? Increase the reach of your titles
YUMPU automatically turns print PDFs into web optimized ePapers that Google loves.
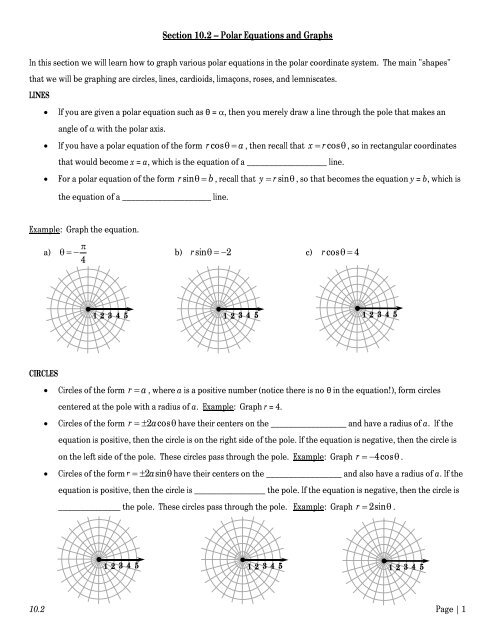
<strong>Section</strong> <strong>10.2</strong> – <strong>Polar</strong> <strong>Equations</strong> <strong>and</strong> <strong>Graphs</strong>In this section we will learn how to graph various polar equations in the polar coordinate system. The main "shapes"that we will be graphing are circles, lines, cardioids, limaçons, roses, <strong>and</strong> lemniscates.LINESIf you are given a polar equation such as θ = , then you merely draw a line through the pole that makes anangle of with the polar axis. If you have a polar equation of the form r <strong>cos</strong> a , then recall that x r <strong>cos</strong> , so in rectangular coordinatesthat would become x = a, which is the equation of a __________________ line.For a polar equation of the form r <strong>sin</strong>the equation of a ____________________ line. b , recall that y r <strong>sin</strong> , so that becomes the equation y = b, which isExample: Graph the equation.a) b) r <strong>sin</strong> 2c) r <strong>cos</strong> 441 2 3 4 5 1 2 3 4 5 1 2 3 4 5CIRCLES Circles of the form r a , where a is a positive number (notice there is no θ in the equation!), form circlescentered at the pole with a radius of a. Example: Graph r = 4. Circles of the form r 2a<strong>cos</strong> have their centers on the _________________ <strong>and</strong> have a radius of a. If theequation is positive, then the circle is on the right side of the pole. If the equation is negative, then the circle ison the left side of the pole. These circles pass through the pole. Example: Graphr 4<strong>cos</strong> . Circles of the form r 2a<strong>sin</strong> have their centers on the _________________ <strong>and</strong> also have a radius of a. If theequation is positive, then the circle is ________________ the pole. If the equation is negative, then the circle is______________ the pole. These circles pass through the pole. Example: Graphr 2<strong>sin</strong> .1 2 3 4 51 2 3 4 51 2 3 4 5<strong>10.2</strong> Page | 1
CARDIOIDSCardioids, such as the one shown in the figure on the right, got their namebecause the shape resembles a _________________. Cardioids pass throughthe pole, <strong>and</strong> the distance from the pole to the farthest point on the main axis isequal to 2a. Next to the box below, label where the main portion of thecardioid will appear (above, below, to the left, or to the right of the pole).Once you have established the general shape <strong>and</strong> orientation of a cardioid, you must plot points on the graph bychoo<strong>sin</strong>g various values of θ <strong>and</strong> finding out what r values they result in.Example: Graph the cardioid r 2 2<strong>cos</strong> .First, we note that the cardioid will be centered on the ______________ (because of the <strong>cos</strong> θ) <strong>and</strong> the main portionwill be to the _____________ of the pole (because of the negative sign). We also need to factor out the 2, resultingin the equation ___________________________________. We can see that a = 2, <strong>and</strong> thus the farthest point onthe main axis will be a distance of __________ away from the pole. At this point we know the general shape of thecardioid. Now we need to find specific points on the graph. The easiest way to do this is to change your graphingcalculator MODE from Function to POLAR. Click on Y= then insert the equation. Now go to TblSet <strong>and</strong> have theTblStart be 0 <strong>and</strong> the ΔTbl be /6. Then click on TABLE to see the r-values that correspond to each value of θ.θ r 2 2<strong>cos</strong>06322356O 1 2 3 4 5<strong>10.2</strong> Page | 2
LIMAÇONSThere are 2 types of limaçons: those with an inner loop <strong>and</strong> those without an inner loop.r = __________________r = ________________Notice in the box above the specification that a > b (the constant is bigger than the coefficient). This is precisely whatmakes this limaçon not have an inner loop. For limaçons that do have an inner loop, a < b (so the constant is smallerthan the coefficient). For instance, in the equation r 3 2<strong>cos</strong> , a = 3 <strong>and</strong> b = 2. Since a > b, this limaçon does NOThave an inner loop. But for the equation r 2 3<strong>cos</strong> , a = 2 <strong>and</strong> b = 3, so <strong>sin</strong>ce a < b, this limaçon DOES have an innerloop. What about the case where a = b, such as r 2 2<strong>cos</strong> ? We can rewrite the equation as___________________________ <strong>and</strong> we realize that it is actually a ________________________.Limaçons follow the same rules as cardioids in terms of where the main part (or bulk) of the graph will appear. For<strong>cos</strong> it will be to the _______________ of the pole. For <strong>cos</strong> it will be to the _______________ of the pole. For<strong>sin</strong> it will be _______________ the pole, <strong>and</strong> for <strong>sin</strong> it will be ________________ the pole.For limaçons that do not have an inner loop, the furthest point from the pole is a + b <strong>and</strong> the closest point to the pole isa b. So assuming each tick mark represents 1 unit in the graphing-calculator-produced graphs at the top of the page,determine the equation of each limaçon.Although the graphs of limaçons without an inner loop do NOT pass through the pole,the graphs of limaçons with an inner loop pass through the pole twice. In the graph onthe right, pick any starting point <strong>and</strong> trace the limaçon to see how this happens.For limaçons that have an inner loop, the length of the inner loop is b a from the pole<strong>and</strong> the length of the outer loop is b + a from the pole. What is the equation of thislimaçon? r = _______________________<strong>10.2</strong> Page | 3
ROSE CURVESNotice in the equations above that θ has a coefficient. If θ does not have a coefficient (so the equation looks liker 2<strong>cos</strong> , for instance), the graph is not a rose curve. We have actually already learned how to graph this kind ofequation. What will the graph ofr 2<strong>cos</strong> be? ___________________So we realize that in order to make a rose curve, θ must have a coefficient, n. If n is even, then the rose will have 2npetals. If n is odd, then the rose will n petals. Additionally, if n is odd <strong>and</strong> the equation contains <strong>cos</strong>ine, then one of thepetals will lie directly on the _______________, <strong>and</strong> if n is odd <strong>and</strong> the equation contains <strong>sin</strong>e, then one of the petalswill lie directly on the _______________. Lastly, the length of each petal will be equal to a (the coefficient).Example: Graph the polar equation r 3<strong>cos</strong>4 .First, we identify this as a ____________________. We see that one petal will lie directly on the _________________<strong>and</strong> the length of each petal will be _______. Since n is ______________, we know there will be __________ petals.θ r 3<strong>cos</strong>401264351227122334561112To get all of these valuesfrom your calculator's"Table", you need to setΔTbl to /12.O 1 2 3 4 5<strong>10.2</strong> Page | 4
LEMNISCATESLemniscates are propeller-shaped graphs, as shown in thefigures on the right.2r 4<strong>cos</strong> 22r 6<strong>sin</strong> 2Notice that the r is SQUARED in these equations. In order to put them into your calculators, you need to take the square2root of both sides <strong>and</strong> put the square root into your calculator. For instance, to get the graph of 6<strong>sin</strong>2r , I typedr 6<strong>sin</strong> 2 into my calculator. To graph the equation on the right, what would you put into your calculator?_________________________ Lastly, notice that the equations containing <strong>sin</strong>e create lemniscates in Quadrants 1 <strong>and</strong>3, whereas the ones containing <strong>cos</strong>ine create lemniscates along the x-axis.Example: Identify the type of graph <strong>and</strong> the key features of each graph. DO NOT GRAPH.r b) r 2<strong>sin</strong>5a) 2 4<strong>cos</strong>r d) r 2 9<strong>sin</strong>2c) 3 <strong>sin</strong>e) r 6<strong>cos</strong> f) r <strong>cos</strong> 2<strong>10.2</strong> Page | 5


