- Page 6 and 7:
I would like to thank all the peopl
- Page 10:
CHAPTER 6: OPTIMISATIO OF CRA ALGOR
- Page 13 and 14:
FIGURE 5.17 - SYSTEM THROUGHPUT VS.
- Page 15 and 16:
LIST OF TABLESTABLE 2.1 - NEXT GENE
- Page 17 and 18:
Chapter 1Introduction pBecause of h
- Page 19 and 20:
Chapter 1Introduction pA first step
- Page 21 and 22:
Chapter 1Introduction passumption i
- Page 23 and 24:
Chapter 1Introduction ppolynomial b
- Page 25 and 26:
Chapter 1Introduction pIn general,
- Page 27 and 28:
Chapter 1Introduction pminislots to
- Page 29 and 30:
Chapter 1Introduction pThe authors
- Page 31 and 32:
Chapter 1Introduction prate access
- Page 33 and 34:
Chapter 1Introduction p1.4 Overview
- Page 35 and 36:
Chapter 2OVERVIEW OF CURRENT CATVNE
- Page 37 and 38:
Chapter 2Overview of current CATV n
- Page 39 and 40:
Chapter 2Overview of current CATV n
- Page 41 and 42:
Chapter 2Overview of current CATV n
- Page 43 and 44:
Chapter 2Overview of current CATV n
- Page 45 and 46:
Chapter 2Overview of current CATV n
- Page 47 and 48:
Chapter 2Overview of current CATV n
- Page 49 and 50:
Chapter 2Overview of current CATV n
- Page 51 and 52:
Chapter 2Overview of current CATV n
- Page 53 and 54:
Chapter 2Overview of current CATV n
- Page 55 and 56:
Chapter 3THE DVB/DAVIC PROTOCOL3.1
- Page 57 and 58:
Chapter 3The DVB/DAVIC protocol pEu
- Page 59 and 60:
Chapter 3The DVB/DAVIC protocol pMA
- Page 61 and 62:
Chapter 3The DVB/DAVIC protocol pTh
- Page 63 and 64:
Chapter 3The DVB/DAVIC protocol pTh
- Page 65 and 66:
Chapter 3The DVB/DAVIC protocol pTh
- Page 67 and 68:
Chapter 3The DVB/DAVIC protocol p3.
- Page 69 and 70: Chapter 4Simulation and analytical
- Page 71 and 72: Chapter 4Simulation and analytical
- Page 73 and 74: Chapter 4Simulation and analytical
- Page 75 and 76: Chapter 4Simulation and analytical
- Page 77 and 78: Chapter 4Simulation and analytical
- Page 79 and 80: Chapter 4Simulation and analytical
- Page 81 and 82: Chapter 4Simulation and analytical
- Page 83 and 84: Chapter 4Simulation and analytical
- Page 85 and 86: Chapter 4Simulation and analytical
- Page 87 and 88: Chapter 4Simulation and analytical
- Page 89 and 90: Chapter 4Simulation and analytical
- Page 91 and 92: Chapter 4Simulation and analytical
- Page 93 and 94: Chapter 4Simulation and analytical
- Page 95 and 96: Chapter 4Simulation and analytical
- Page 97 and 98: Chapter 4Simulation and analytical
- Page 99 and 100: Chapter 4Simulation and analytical
- Page 101 and 102: Chapter 4Simulation and analytical
- Page 103 and 104: Chapter 4Simulation and analytical
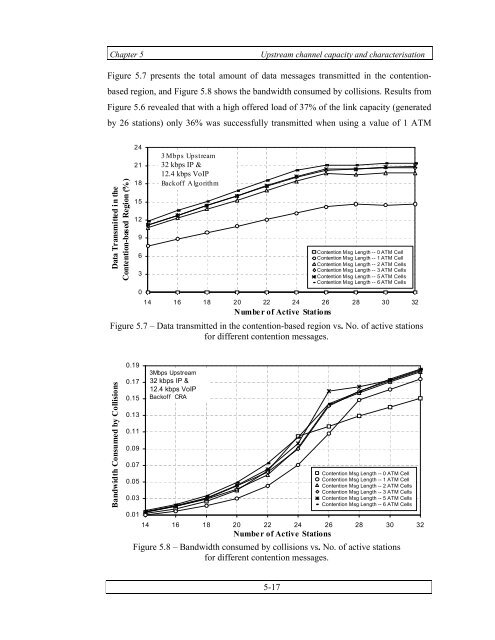
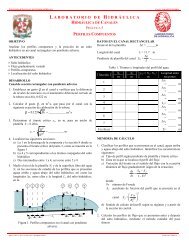
- Page 105 and 106: Chapter 5Upstream channel capacity
- Page 107 and 108: Chapter 5Upstream channel capacity
- Page 109 and 110: Chapter 5Upstream channel capacity
- Page 111 and 112: Chapter 5Upstream channel capacity
- Page 113 and 114: Chapter 5Upstream channel capacity
- Page 115 and 116: Chapter 5Upstream channel capacity
- Page 117 and 118: Chapter 5Upstream channel capacity
- Page 119: Chapter 5Upstream channel capacity
- Page 123 and 124: Chapter 5Upstream channel capacity
- Page 125 and 126: Chapter 5Upstream channel capacity
- Page 127 and 128: Chapter 5Upstream channel capacity
- Page 129 and 130: Chapter 5Upstream channel capacity
- Page 131 and 132: Chapter 5Upstream channel capacity
- Page 133 and 134: Chapter 5Upstream channel capacity
- Page 135 and 136: Chapter 5Upstream channel capacity
- Page 137 and 138: Chapter 5Upstream channel capacity
- Page 139 and 140: Chapter 5Upstream channel capacity
- Page 141 and 142: Chapter 5Upstream channel capacity
- Page 143 and 144: Chapter 6Optimisation of CRA using
- Page 145 and 146: Chapter 6Optimisation of CRA using
- Page 147 and 148: Chapter 6Optimisation of CRA using
- Page 149 and 150: Chapter 6Optimisation of CRA using
- Page 151 and 152: Chapter 6Optimisation of CRA using
- Page 153 and 154: Chapter 6Optimisation of CRA using
- Page 155 and 156: Chapter 6Optimisation of CRA using
- Page 157 and 158: Chapter 6Optimisation of CRA using
- Page 159 and 160: Chapter 6Optimisation of CRA using
- Page 161 and 162: Chapter 6Optimisation of CRA using
- Page 163 and 164: Chapter 6Optimisation of CRA using
- Page 165 and 166: Chapter 6Optimisation of CRA using
- Page 167 and 168: Chapter 6Optimisation of CRA using
- Page 169 and 170: Chapter 6Optimisation of CRA using
- Page 171 and 172:
Chapter 7PERFORMANCE OPTIMISATION F
- Page 173 and 174:
Chapter 7Performance optimisation f
- Page 175 and 176:
Chapter 7Performance optimisation f
- Page 177 and 178:
Chapter 7Performance optimisation f
- Page 179 and 180:
Chapter 7Performance optimisation f
- Page 181 and 182:
Chapter 7Performance optimisation f
- Page 183 and 184:
Chapter 7Performance optimisation f
- Page 185 and 186:
Chapter 7Performance optimisation f
- Page 187 and 188:
Chapter 7Performance optimisation f
- Page 189 and 190:
Chapter 7Performance optimisation f
- Page 191 and 192:
Chapter 7Performance optimisation f
- Page 193 and 194:
Chapter 7Performance optimisation f
- Page 195 and 196:
Chapter 7Performance optimisation f
- Page 197 and 198:
Chapter 7Performance optimisation f
- Page 199 and 200:
Chapter 7Performance optimisation f
- Page 201 and 202:
aChapter 7Performance optimisation
- Page 203 and 204:
Chapter 7Performance optimisation f
- Page 205 and 206:
Chapter 7Performance optimisation f
- Page 207 and 208:
Chapter 7Performance optimisation f
- Page 209 and 210:
Chapter 8Final conclusions p8.2 Gen
- Page 211 and 212:
Chapter 8Final conclusions pWe have
- Page 213 and 214:
Chapter 8Final conclusions pperform
- Page 215 and 216:
Chapter 8Final conclusions pslots i
- Page 217 and 218:
Chapter 8Final conclusions pfocused
- Page 219 and 220:
Chapter 8Final conclusions preserva
- Page 221 and 222:
Chapter 8Final conclusions pbandwid
- Page 223 and 224:
Chapter 8Final conclusions pThe opt
- Page 225 and 226:
Chapter 8Final conclusions p8.4 Fut
- Page 227 and 228:
Chapter 8Final conclusions pApplica
- Page 229 and 230:
Chapter 8Final conclusions pTCIS st
- Page 231 and 232:
Referencesp[17] I. Cidon, and M. Si
- Page 233 and 234:
Referencesp[50] N. F. Huang, C. A.
- Page 235 and 236:
Referencesp[85] V. Rangel, R. Edwar
- Page 237 and 238:
Referencesp[112] K. Sriram, “Meth
- Page 239 and 240:
APPEDIX A: GLOSSARYAALABRADSLATMBCB
- Page 241 and 242:
Appendix AGlossary pkbpsLANLLCMACMA
- Page 243 and 244:
Appendix AGlossary pUSBUWVDSLVoDVoI
- Page 245 and 246:
Appendix BProtocol stack and packet
- Page 247 and 248:
Appendix BProtocol stack and packet
- Page 249 and 250:
APPENDIX C: D VERIFICATION TEST FOR
- Page 251 and 252:
Appendix D Verification test p209 2
- Page 253 and 254:
Appendix EResults for a 6 Mbps upst
- Page 255:
Appendix FGuide to CD-ROM p IEEE802