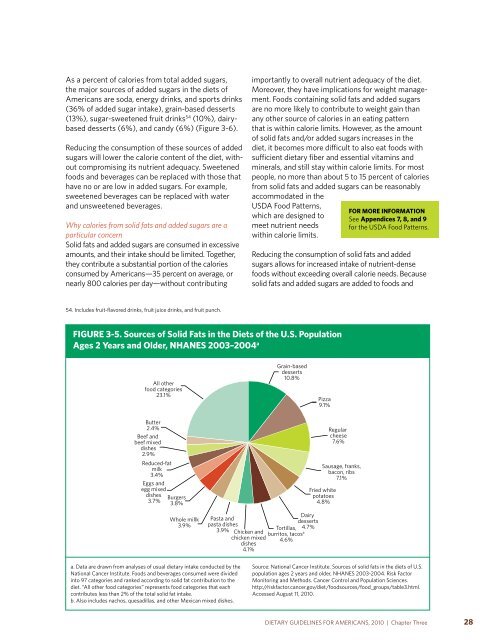
limiting the consumption of the specific foods thatare high in cholesterol. Many of these major sourcesinclude foods that can be purchased or prepared inways that limit the intake of cholesterol (e.g., usingegg substitutes). Cholesterol intake by men averagesabout 350 mg per day, which exceeds the re<strong>com</strong>mendedlevel of less than 300 mg per day. Averagecholesterol intake by women is 240 mg per day.<strong>Dietary</strong> cholesterol has been shown to raise blood LDLcholesterol levels in some individuals. However, thiseffect is reduced when saturated fatty acid intake islow, and the potential negative effects of dietary cholesterolare relatively small <strong>com</strong>pared to those of saturatedand trans fatty acids. Moderate evidence showsa relationship between higher intake of cholesteroland higher risk of cardiovascular disease. Independentof other dietary factors, evidence suggests that oneegg (i.e., egg yolk) per day does not result in increasedblood cholesterol levels, nor does it increase the risk ofcardiovascular disease in healthy people. Consumingless than 300 mg per day of cholesterol can helpmaintain normal blood cholesterol levels. Consumingless than 200 mg per day can further help individualsat high risk of cardiovascular disease.calories from solid fats and added sugarsSolid fatsAs noted previously, fats contain a mixture ofdifferent fatty acids, and much research has beenconducted on the association between the intakeof saturated and trans fatty acids and the risk ofchronic disease, especially cardiovascular disease.Most fats with a high percentage of saturated and/or trans fatty acids are solid at room temperatureand are referred to as “solid fats” (Figure 3-3).Common solid fats include butter, beef fat (tallow,suet), chicken fat, pork fat (lard), stick margarine,and shortening. The fat in fluid milk also is consideredto be solid fat; milk fat (butter) is solid at roomtemperature but is suspended in fluid milk by theprocess of homogenization.Although saturated and trans fatty acids are <strong>com</strong>ponentsof many foods, solid fats are foods themselvesor ingredients (e.g., shortening in a cake or hydrogenatedoils in fried foods). The purpose <strong>for</strong> discussingsolid fats in addition to saturated and trans fattyacids is that, apart from the effects of saturated andtrans fatty acids on cardiovascular disease risk, solidfats are abundant in the diets of <strong>Americans</strong> andcontribute significantly to excess calorie intake.Solid fats contribute an average of 19 percent of thetotal calories in American diets, but few essentialnutrients and no dietary fiber. Some major food sourcesof solid fats in the American diet are grain-based desserts(11% of all solid fat intake); pizza (9%); regular(full-fat) cheese (8%); sausage, franks, bacon, and ribs(7%); and fried white potatoes (5%) (Figure 3-5).In addition to being a major contributor of solid fats,moderate evidence suggests an association betweenthe increased intake of processed meats (e.g., franks,sausage, and bacon) and increased risk of colorectalcancer and cardiovascular disease. 53 To reduce theintake of solid fats, most <strong>Americans</strong> should limit theirintake of those sources that are high in solid fats and/or replace them with alternatives that are low in solidfats (e.g., fat-free milk). Reducing these sources ofexcess solid fats in the diet will result in reduced intakeof saturated fatty acids, trans fatty acids, and calories.Added sugarsSugars are found naturally in fruits (fructose) andfluid milk and milk products (lactose). The majorityof sugars in typical American diets are sugars addedto foods during processing, preparation, or at thetable. These “added sugars” sweeten the flavor offoods and beverages and improve their palatability.They also are added to foods <strong>for</strong> preservation purposesand to provide functional attributes, such asviscosity, texture, body, and browning capacity.Although the body’s response to sugars does notdepend on whether they are naturally present in foodor added to foods, sugars found naturally in foodsare part of the food’s total package of nutrients andother healthful <strong>com</strong>ponents. In contrast, many foodsthat contain added sugars often supply calories, butfew or no essential nutrients and no dietary fiber.Both naturally occurring sugars and added sugarsincrease the risk of dental caries.Added sugars contribute an average of 16 percentof the total calories in American diets. Addedsugars include high fructose corn syrup, whitesugar, brown sugar, corn syrup, corn syrup solids,raw sugar, malt syrup, maple syrup, pancake syrup,fructose sweetener, liquid fructose, honey, molasses,anhydrous dextrose, and crystal dextrose.53. The DGAC did not evaluate the <strong>com</strong>ponents of processed meats that are associated with increased risk of colorectal cancer and cardiovascular disease.27DIETARY GUIDELINES FOR AMERICANS, 2010 | Chapter Three
As a percent of calories from total added sugars,the major sources of added sugars in the diets of<strong>Americans</strong> are soda, energy drinks, and sports drinks(36% of added sugar intake), grain-based desserts(13%), sugar-sweetened fruit drinks 54 (10%), dairybaseddesserts (6%), and candy (6%) (Figure 3-6).Reducing the consumption of these sources of addedsugars will lower the calorie content of the diet, without<strong>com</strong>promising its nutrient adequacy. Sweetenedfoods and beverages can be replaced with those thathave no or are low in added sugars. For example,sweetened beverages can be replaced with waterand unsweetened beverages.Why calories from solid fats and added sugars are aparticular concernSolid fats and added sugars are consumed in excessiveamounts, and their intake should be limited. Together,they contribute a substantial portion of the caloriesconsumed by <strong>Americans</strong>—35 percent on average, ornearly 800 calories per day—without contributingimportantly to overall nutrient adequacy of the diet.Moreover, they have implications <strong>for</strong> weight management.Foods containing solid fats and added sugarsare no more likely to contribute to weight gain thanany other source of calories in an eating patternthat is within calorie limits. However, as the amountof solid fats and/or added sugars increases in thediet, it be<strong>com</strong>es more difficult to also eat foods withsufficient dietary fiber and essential vitamins andminerals, and still stay within calorie limits. For mostpeople, no more than about 5 to 15 percent of caloriesfrom solid fats and added sugars can be reasonablyac<strong>com</strong>modated in theUSDA Food Patterns,which are designed tomeet nutrient needswithin calorie limits.<strong>for</strong> More in<strong>for</strong>MationSee appendices 7, 8, and 9<strong>for</strong> the USDA Food Patterns.Reducing the consumption of solid fats and addedsugars allows <strong>for</strong> increased intake of nutrient-densefoods without exceeding overall calorie needs. Becausesolid fats and added sugars are added to foods and54. Includes fruit-flavored drinks, fruit juice drinks, and fruit punch.figure 3-5. sources of solid fats in the diets of the u.s. Populationages 2 years and older, nhanes 2003–2004 aAll otherfood categories23.1%Grainbaseddesserts10.8%Pizza9.1%Butter2.4%Beef andbeef mixeddishes2.9%Reducedfatmilk3.4%Eggs andegg mixeddishes3.7%Burgers3.8%Fried whitepotatoes4.8%Regularcheese7.6%Sausage, franks,bacon, ribs7.1%Whole millk3.9%DairyPasta anddessertspasta dishesTortillas, 4.7%3.9% Chicken and burritos, tacoschicken mixedb4.6%dishes4.1%a. Data are drawn from analyses of usual dietary intake conducted by theNational Cancer Institute. Foods and beverages consumed were dividedinto 97 categories and ranked according to solid fat contribution to thediet. “All other food categories” represents food categories that eachcontributes less than 2% of the total solid fat intake.b. Also includes nachos, quesadillas, and other Mexican mixed dishes.Source: National Cancer Institute. Sources of solid fats in the diets of U.S.population ages 2 years and older, NHANES 2003-2004. Risk FactorMonitoring and Methods. Cancer Control and Population Sciences.http://riskfactor.cancer.gov/diet/foodsources/food_groups/table3.html.Accessed August 11, 2010.DIETARY GUIDELINES FOR AMERICANS, 2010 | Chapter Three 28