Dietary Guidelines for Americans - SchoolNutritionAndFitness.com
Dietary Guidelines for Americans - SchoolNutritionAndFitness.com
Dietary Guidelines for Americans - SchoolNutritionAndFitness.com
- No tags were found...

You also want an ePaper? Increase the reach of your titles
YUMPU automatically turns print PDFs into web optimized ePapers that Google loves.
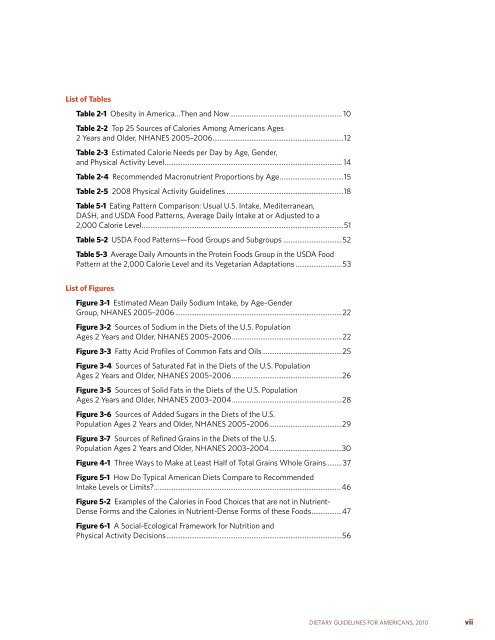
list of tablestable 2-1 Obesity in America…Then and Now ............................................................... 10table 2-2 Top 25 Sources of Calories Among <strong>Americans</strong> Ages 2 Years and Older, NHANES 2005–2006..........................................................................12 table 2-3 Estimated Calorie Needs per Day by Age, Gender, and Physical Activity Level.................................................................................................... 14 table 2-4 Re<strong>com</strong>mended Macronutrient Proportions by Age....................................15table 2-5 2008 Physical Activity <strong>Guidelines</strong> ..................................................................18table 5-1 Eating Pattern Comparison: Usual U.S. Intake, Mediterranean, DASH, and USDA Food Patterns, Average Daily Intake at or Adjusted to a 2,000 Calorie Level..................................................................................................................51 table 5-2 USDA Food Patterns—Food Groups and Subgroups .................................52table 5-3 Average Daily Amounts in the Protein Foods Group in the USDA Food Pattern at the 2,000 Calorie Level and its Vegetarian Adaptations ..........................53list of figuresfigure 3-1 Estimated Mean Daily Sodium Intake, by Age–GenderGroup, NHANES 2005–2006 ..............................................................................................22 figure 3-2 Sources of Sodium in the Diets of the U.S. Population Ages 2 Years and Older, NHANES 2005–2006..............................................................22figure 3-3 Fatty Acid Profiles of Common Fats and Oils.............................................25figure 3-4 Sources of Saturated Fat in the Diets of the U.S. Population Ages 2 Years and Older, NHANES 2005–2006..............................................................26figure 3-5 Sources of Solid Fats in the Diets of the U.S. Population Ages 2 Years and Older, NHANES 2003–2004..............................................................28figure 3-6 Sources of Added Sugars in the Diets of the U.S. Population Ages 2 Years and Older, NHANES 2005–2006.........................................29figure 3-7 Sources of Refined Grains in the Diets of the U.S. Population Ages 2 Years and Older, NHANES 2003–2004.........................................30figure 4-1 Three Ways to Make at Least Half of Total Grains Whole Grains.........37 figure 5-1 How Do Typical American Diets Compare to Re<strong>com</strong>mended Intake Levels or Limits?......................................................................................................... 46 figure 5-2 Examples of the Calories in Food Choices that are not in Nutrient-Dense Forms and the Calories in Nutrient-Dense Forms of these Foods.................47 figure 6-1 A Social-Ecological Framework <strong>for</strong> Nutrition and Physical Activity Decisions...................................................................................................56 DIETARY GUIDELINES FOR AMERICANS, 2010vii