Fact Sheet April - 2013.cdr - Tata Mutual Fund
Fact Sheet April - 2013.cdr - Tata Mutual Fund
Fact Sheet April - 2013.cdr - Tata Mutual Fund

Create successful ePaper yourself
Turn your PDF publications into a flip-book with our unique Google optimized e-Paper software.
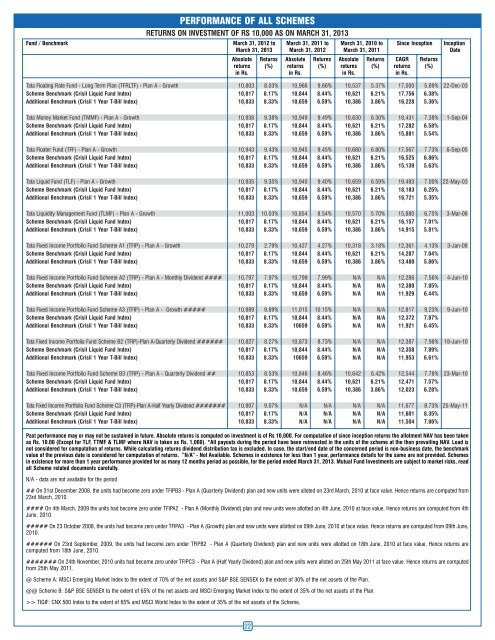
PERFORMANCE OF ALL SCHEMESRETURNS ON INVESTMENT OF RS 10,000 AS ON MARCH 31, 2013<strong>Fund</strong> / Benchmark March 31, 2012 to March 31, 2011 to March 31, 2010 to Since Inception InceptionMarch 31, 2013 March 31, 2012 March 31, 2011 DateAbsolute Returns Absolute Returns Absolute Returns CAGR Returnsreturns (%) returns (%) returns (%) returns (%)in Rs. in Rs. in Rs. in Rs.<strong>Tata</strong> Floating Rate <strong>Fund</strong> - Long Term Plan (TFRLTF) - Plan A - Growth 10,803 8.03% 10,966 9.66% 10,537 5.37% 17,000 5.89% 22-Dec-03Scheme Benchmark (Crisil Liquid <strong>Fund</strong> Index) 10,817 8.17% 10,844 8.44% 10,621 6.21% 17,756 6.38%Additional Benchmark (Crisil 1 Year T-Bill Index) 10,833 8.33% 10,659 6.59% 10,386 3.86% 16,228 5.36%<strong>Tata</strong> Money Market <strong>Fund</strong> (TMMF) - Plan A - Growth 10,938 9.38% 10,949 9.49% 10,630 6.30% 18,431 7.38% 1-Sep-04Scheme Benchmark (Crisil Liquid <strong>Fund</strong> Index) 10,817 8.17% 10,844 8.44% 10,621 6.21% 17,282 6.58%Additional Benchmark (Crisil 1 Year T-Bill Index) 10,833 8.33% 10,659 6.59% 10,386 3.86% 15,881 5.54%<strong>Tata</strong> Floater <strong>Fund</strong> (TFF) - Plan A - Growth 10,943 9.43% 10,945 9.45% 10,680 6.80% 17,567 7.73% 6-Sep-05Scheme Benchmark (Crisil Liquid <strong>Fund</strong> Index) 10,817 8.17% 10,844 8.44% 10,621 6.21% 16,525 6.86%Additional Benchmark (Crisil 1 Year T-Bill Index) 10,833 8.33% 10,659 6.59% 10,386 3.86% 15,139 5.63%<strong>Tata</strong> Liquid <strong>Fund</strong> (TLF) - Plan A - Growth 10,935 9.35% 10,940 9.40% 10,659 6.59% 19,493 7.00% 22-May-03Scheme Benchmark (Crisil Liquid <strong>Fund</strong> Index) 10,817 8.17% 10,844 8.44% 10,621 6.21% 18,183 6.25%Additional Benchmark (Crisil 1 Year T-Bill Index) 10,833 8.33% 10,659 6.59% 10,386 3.86% 16,721 5.35%<strong>Tata</strong> Liquidity Management <strong>Fund</strong> (TLMF) - Plan A - Growth 11,003 10.03% 10,854 8.54% 10,570 5.70% 15,880 6.75% 3-Mar-06Scheme Benchmark (Crisil Liquid <strong>Fund</strong> Index) 10,817 8.17% 10,844 8.44% 10,621 6.21% 16,157 7.01%Additional Benchmark (Crisil 1 Year T-Bill Index) 10,833 8.33% 10,659 6.59% 10,386 3.86% 14,915 5.81%<strong>Tata</strong> Fixed Income Portfolio <strong>Fund</strong> Scheme A1 (TFIP) - Plan A - Growth 10,279 2.79% 10,427 4.27% 10,318 3.18% 12,361 4.13% 3-Jan-08Scheme Benchmark (Crisil Liquid <strong>Fund</strong> Index) 10,817 8.17% 10,844 8.44% 10,621 6.21% 14,287 7.04%Additional Benchmark (Crisil 1 Year T-Bill Index) 10,833 8.33% 10,659 6.59% 10,386 3.86% 13,480 5.86%<strong>Tata</strong> Fixed Income Portfolio <strong>Fund</strong> Scheme A2 (TFIP) - Plan A - Monthly Dividend #### 10,797 7.97% 10,799 7.99% N/A N/A 12,286 7.56% 4-Jun-10Scheme Benchmark (Crisil Liquid <strong>Fund</strong> Index) 10,817 8.17% 10,844 8.44% N/A N/A 12,380 7.85%Additional Benchmark (Crisil 1 Year T-Bill Index) 10,833 8.33% 10,659 6.59% N/A N/A 11,929 6.44%<strong>Tata</strong> Fixed Income Portfolio <strong>Fund</strong> Scheme A3 (TFIP) - Plan A - Growth ##### 10,989 9.89% 11,015 10.15% N/A N/A 12,817 9.23% 9-Jun-10Scheme Benchmark (Crisil Liquid <strong>Fund</strong> Index) 10,817 8.17% 10,844 8.44% N/A N/A 12,372 7.87%Additional Benchmark (Crisil 1 Year T-Bill Index) 10,833 8.33% 10659 6.59% N/A N/A 11,921 6.45%<strong>Tata</strong> Fixed Income Portfolio <strong>Fund</strong> Scheme B2 (TFIP)-Plan A-Quarterly Dividend ###### 10,827 8.27% 10,873 8.73% N/A N/A 12,387 7.98% 18-Jun-10Scheme Benchmark (Crisil Liquid <strong>Fund</strong> Index) 10,817 8.17% 10,844 8.44% N/A N/A 12,358 7.89%Additional Benchmark (Crisil 1 Year T-Bill Index) 10,833 8.33% 10659 6.59% N/A N/A 11,953 6.61%<strong>Tata</strong> Fixed Income Portfolio <strong>Fund</strong> Scheme B3 (TFIP) - Plan A - Quarterly Dividend ## 10,853 8.53% 10,846 8.46% 10,642 6.42% 12,544 7.78% 23-Mar-10Scheme Benchmark (Crisil Liquid <strong>Fund</strong> Index) 10,817 8.17% 10,844 8.44% 10,621 6.21% 12,471 7.57%Additional Benchmark (Crisil 1 Year T-Bill Index) 10,833 8.33% 10,659 6.59% 10,386 3.86% 12,023 6.28%<strong>Tata</strong> Fixed Income Portfolio <strong>Fund</strong> Scheme C3 (TFIP)-Plan A-Half Yearly Dividend ####### 10,907 9.07% N/A N/A N/A N/A 11,677 8.73% 25-May-11Scheme Benchmark (Crisil Liquid <strong>Fund</strong> Index) 10,817 8.17% N/A N/A N/A N/A 11,601 8.35%Additional Benchmark (Crisil 1 Year T-Bill Index) 10,833 8.33% N/A N/A N/A N/A 11,504 7.86%Past performance may or may not be sustained in future. Absolute returns is computed on investment is of Rs 10,000. For computation of since inception returns the allotment NAV has been takenas Rs. 10.00 (Except for TLF, TTMF & TLMF where NAV is taken as Rs. 1,000). *All payouts during the period have been reinvested in the units of the scheme at the then prevailing NAV. Load isnot considered for computation of returns. While calculating returns dividend distribution tax is excluded. In case, the start/end date of the concerned period is non-business date, the benchmarkvalue of the previous date is considered for computation of returns. ”N/A” - Not Available. Schemes in existence for less than 1 year, performance details for the same are not provided. Schemesin existence for more than 1 year performance provided for as many 12 months period as possible, for the period ended March 31, 2013. <strong>Mutual</strong> <strong>Fund</strong> Investments are subject to market risks, readall Scheme related documents carefully.N/A - data are not available for the period## On 31st December 2008, the units had become zero under TFIPB3 - Plan A (Quarterly Dividend) plan and new units were alloted on 23rd March, 2010 at face value. Hence returns are computed from23rd March, 2010.#### On 4th March, 2009 the units had become zero under TFIPA2 - Plan A (Monthly Dividend) plan and new units were allotted on 4th June, 2010 at face value. Hence returns are computed from 4thJune, 2010.##### On 23 October 2008, the units had become zero under TFIPA3 - Plan A (Growth) plan and new units were allotted on 09th June, 2010 at face value. Hence returns are computed from 09th June,2010.###### On 23rd September, 2009, the units had become zero under TFIPB2 - Plan A (Quarterly Dividend) plan and new units were allotted on 18th June, 2010 at face value. Hence returns arecomputed from 18th June, 2010.####### On 24th November, 2010 units had become zero under TFIPC3 - Plan A (Half Yearly Dividend) plan and new units were alloted on 25th May 2011 at face value. Hence returns are computedfrom 25th May 2011.@ Scheme A: MSCI Emerging Market Index to the extent of 70% of the net assets and S&P BSE SENSEX to the extent of 30% of the net assets of the Plan.@@ Scheme B: S&P BSE SENSEX to the extent of 65% of the net assets and MSCI Emerging Market Index to the extent of 35% of the net assets of the Plan.>> TIGIF: CNX 500 Index to the extent of 65% and MSCI World Index to the extent of 35% of the net assets of the Scheme.22