Fact Sheet April - 2013.cdr - Tata Mutual Fund
Fact Sheet April - 2013.cdr - Tata Mutual Fund
Fact Sheet April - 2013.cdr - Tata Mutual Fund

You also want an ePaper? Increase the reach of your titles
YUMPU automatically turns print PDFs into web optimized ePapers that Google loves.
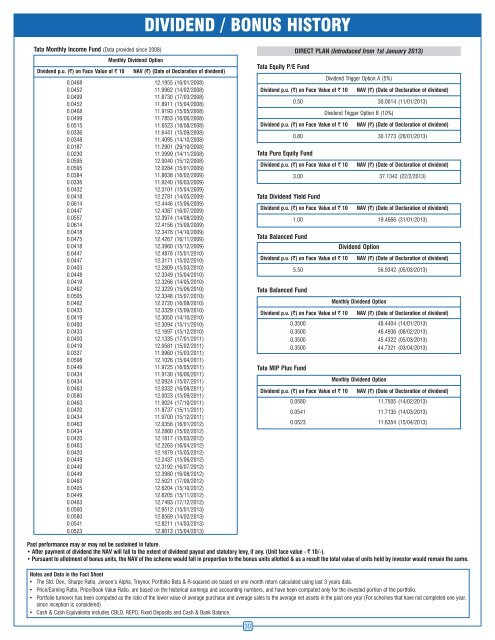
DIVIDEND / BONUS HISTORY<strong>Tata</strong> Monthly Income <strong>Fund</strong> (Data provided since 2008)Monthly Dividend OptionDividend p.u. (`) on Face Value of ` 10 NAV (`) (Date of Declaration of dividend)0.0468 12.1955 (16/01/2008)0.0452 11.9962 (14/02/2008)0.0499 11.8730 (17/03/2008)0.0452 11.8911 (15/04/2008)0.0468 11.9193 (15/05/2008)0.0499 11.7853 (16/06/2008)0.0515 11.6523 (18/08/2008)0.0336 11.6441 (15/09/2008)0.0348 11.4095 (14/10/2008)0.0187 11.2901 (29/10/2008)0.0230 11.3999 (14/11/2008)0.0595 12.0040 (15/12/2008)0.0595 12.0284 (15/01/2009)0.0384 11.8638 (16/02/2009)0.0336 11.9240 (16/03/2009)0.0432 12.3101 (15/04/2009)0.0418 12.2781 (14/05/2009)0.0614 12.4446 (15/06/2009)0.0447 12.4387 (16/07/2009)0.0557 12.3974 (14/08/2009)0.0614 12.4156 (15/09/2009)0.0418 12.3478 (14/10/2009)0.0475 12.4267 (16/11/2009)0.0418 12.3960 (15/12/2009)0.0447 12.4878 (15/01/2010)0.0447 12.3171 (15/02/2010)0.0403 12.2809 (15/03/2010)0.0448 12.3349 (15/04/2010)0.0419 12.3266 (14/05/2010)0.0462 12.3229 (15/06/2010)0.0505 12.3348 (15/07/2010)0.0462 12.2720 (16/08/2010)0.0433 12.3329 (15/09/2010)0.0419 12.3050 (14/10/2010)0.0400 12.3094 (15/11/2010)0.0433 12.1697 (15/12/2010)0.0400 12.1335 (17/01/2011)0.0419 12.0581 (15/02/2011)0.0337 11.9960 (15/03/2011)0.0598 12.1026 (15/04/2011)0.0449 11.9725 (16/05/2011)0.0434 11.9130 (16/06/2011)0.0434 12.0924 (15/07/2011)0.0463 12.0332 (16/08/2011)0.0580 12.0023 (15/09/2011)0.0463 11.9024 (17/10/2011)0.0420 11.8737 (15/11/2011)0.0434 11.9700 (15/12/2011)0.0463 12.0356 (16/01/2012)0.0434 12.2860 (15/02/2012)0.0420 12.1817 (15/03/2012)0.0463 12.2263 (16/04/2012)0.0420 12.1879 (15/05/2012)0.0449 12.2437 (15/06/2012)0.0449 12.3192 (16/07/2012)0.0449 12.3980 (16/08/2012)0.0463 12.5021 (17/09/2012)0.0405 12.6204 (15/10/2012)0.0449 12.6205 (15/11/2012)0.0463 12.7493 (17/12/2012)0.0560 12.9512 (15/01/2013)0.0580 12.8569 (14/02/2013)0.0541 12.8211 (14/03/2013)0.0523 12.8013 (15/04/2013)DIRECT PLAN (Introduced from 1st January 2013)<strong>Tata</strong> Equity P/E <strong>Fund</strong>Dividend Trigger Option A (5%)Dividend p.u. (`) on Face Value of ` 10 NAV (`) (Date of Declaration of dividend)0.50 30.0014 (11/01/2013)Dividend Trigger Option B (10%)Dividend p.u. (`) on Face Value of ` 10 NAV (`) (Date of Declaration of dividend)0.80 30.1773 (28/01/2013)<strong>Tata</strong> Pure Equity <strong>Fund</strong>Dividend p.u. (`) on Face Value of ` 10 NAV (`) (Date of Declaration of dividend)3.00 37.1342 (22/2/2013)<strong>Tata</strong> Dividend Yield <strong>Fund</strong>Dividend p.u. (`) on Face Value of ` 10 NAV (`) (Date of Declaration of dividend)1.00 19.4666 (31/01/2013)<strong>Tata</strong> Balanced <strong>Fund</strong>Dividend OptionDividend p.u. (`) on Face Value of ` 10 NAV (`) (Date of Declaration of dividend)5.50 56.9342 (05/03/2013)<strong>Tata</strong> Balanced <strong>Fund</strong>Monthly Dividend OptionDividend p.u. (`) on Face Value of ` 10 NAV (`) (Date of Declaration of dividend)0.3500 48.4404 (14/01/2013)0.3500 46.4936 (08/02/2013)0.3500 45.4322 (05/03/2013)0.3500 44.7321 (03/04/2013)<strong>Tata</strong> MIP Plus <strong>Fund</strong>Monthly Dividend OptionDividend p.u. (`) on Face Value of ` 10 NAV (`) (Date of Declaration of dividend)0.0580 11.7505 (14/02/2013)0.0541 11.7135 (14/03/2013)0.0523 11.6354 (15/04/2013)Past performance may or may not be sustained in future.• After payment of dividend the NAV will fall to the extent of dividend payout and statutory levy, if any. (Unit face value - ` 10/-).• Pursuant to allotment of bonus units, the NAV of the scheme would fall in proportion to the bonus units allotted & as a result the total value of units held by investor would remain the same.Notes and Data in the <strong>Fact</strong> <strong>Sheet</strong>• The Std. Dev., Sharpe Ratio, Jensen’s Alpha, Treynor, Portfolio Beta & R-squared are based on one month return calculated using last 3 years data.• Price/Earning Ratio, Price/Book Value Ratio, are based on the historical earnings and accounting numbers, and have been computed only for the invested portion of the portfolio.• Portfolio turnover has been computed as the ratio of the lower value of average purchase and average sales to the average net assets in the past one year (For schemes that have not completed one year,since inception is considered)• Cash & Cash Equivalents includes CBLO, REPO, Fixed Deposits and Cash & Bank Balance.30