

apr-11.pdf (2.07 MB) - Crown Ownership Monitoring Unit
apr-11.pdf (2.07 MB) - Crown Ownership Monitoring Unit
apr-11.pdf (2.07 MB) - Crown Ownership Monitoring Unit

You also want an ePaper? Increase the reach of your titles
YUMPU automatically turns print PDFs into web optimized ePapers that Google loves.
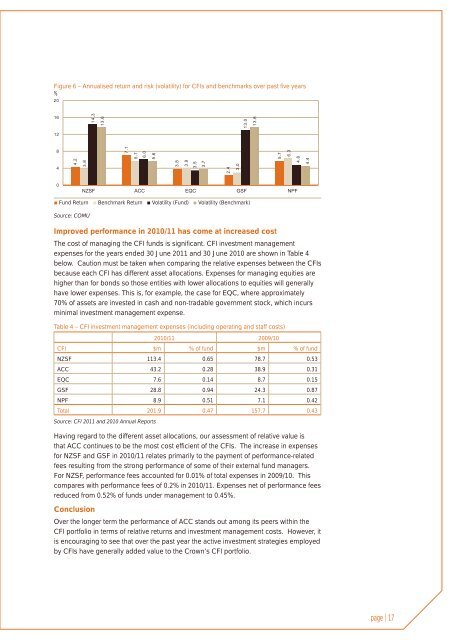
Figure 6 – Annualised return and risk (volatility) for CFIs and benchmarks over past five years%■ Fund Return ■ Benchmark Return ■ Volatility (Fund) ■ Volatility (Benchmark)Source: COMUImproved performance in 2010/11 has come at increased costThe cost of managing the CFI funds is significant. CFI investment managementexpenses for the years ended 30 June 2011 and 30 June 2010 are shown in Table 4below. Caution must be taken when comparing the relative expenses between the CFIsbecause each CFI has different asset allocations. Expenses for managing equities arehigher than for bonds so those entities with lower allocations to equities will generallyhave lower expenses. This is, for example, the case for EQC, where approximately70% of assets are invested in cash and non-tradable government stock, which incursminimal investment management expense.Tab le 4 – CFI investment management expenses (including operating and staff costs)2010/11 2009/10CFI $m % of fund $m % of fundNZSF 113.4 0.65 78.7 0.53ACC 43.2 0.28 38.9 0.31EQC 7.6 0.14 8.7 0.15GSF 28.8 0.94 24.3 0.87NPF 8.9 0.51 7.1 0.42Total 201.9 0.47 157.7 0.43Source: CFI 2011 and 2010 Annual ReportsHaving regard to the different asset allocations, our assessment of relative value isthat ACC continues to be the most cost efficient of the CFIs. The increase in expensesfor NZSF and GSF in 2010/11 relates primarily to the payment of performance-relatedfees resulting from the strong performance of some of their external fund managers.For NZSF, performance fees accounted for 0.01% of total expenses in 2009/10. Thiscompares with performance fees of 0.2% in 2010/11. Expenses net of performance feesreduced from 0.52% of funds under management to 0.45%.ConclusionOver the longer term the performance of ACC stands out among its peers within theCFI portfolio in terms of relative returns and investment management costs. However, itis encouraging to see that over the past year the active investment strategies employedby CFIs have generally added value to the <strong>Crown</strong>’s CFI portfolio.page | 17


