

apr-11.pdf (2.07 MB) - Crown Ownership Monitoring Unit
apr-11.pdf (2.07 MB) - Crown Ownership Monitoring Unit
apr-11.pdf (2.07 MB) - Crown Ownership Monitoring Unit

You also want an ePaper? Increase the reach of your titles
YUMPU automatically turns print PDFs into web optimized ePapers that Google loves.
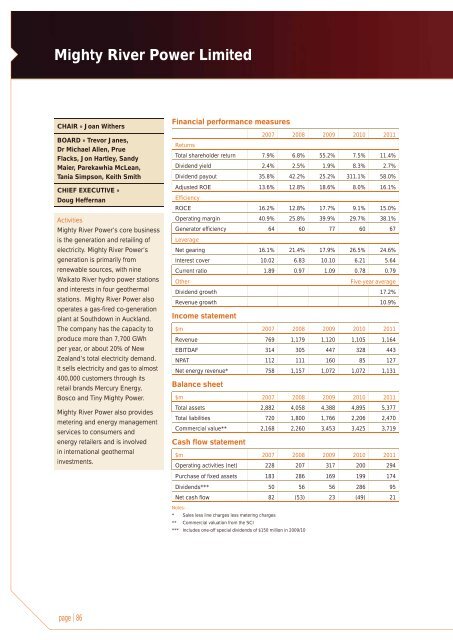
Mighty River Power LimitedCHAIR » Joan WithersBOARD » Trevor Janes,Dr Michael Allen, PrueFlacks, Jon Hartley, SandyMaier, Parekawhia McLean,Tania Simpson, Keith SmithCHIEF EXECUTIVE »Doug HeffernanActivitiesMighty River Power’s core businessis the generation and retailing ofelectricity. Mighty River Power’sgeneration is primarily fromrenewable sources, with nineWaikato River hydro power stationsand interests in four geothermalstations. Mighty River Power alsooperates a gas-fired co-generationplant at Southdown in Auckland.The company has the capacity toproduce more than 7,700 GWhper year, or about 20% of NewZealand’s total electricity demand.It sells electricity and gas to almost400,000 customers through itsretail brands Mercury Energy,Bosco and Tiny Mighty Power.Mighty River Power also providesmetering and energy managementservices to consumers andenergy retailers and is involvedin international geothermalinvestments.Financial performance measures2007 2008 2009 2010 2011ReturnsTotal shareholder return 7.9% 6.8% 55.2% 7.5% 11.4%Dividend yield 2.4% 2.5% 1.9% 8.3% 2.7%Dividend payout 35.8% 42.2% 25.2% 311.1% 58.0%Adjusted ROE 13.6% 12.8% 18.6% 8.0% 16.1%EfficiencyROCE 16.2% 12.8% 17.7% 9.1% 15.0%Operating margin 40.9% 25.8% 39.9% 29.7% 38.1%Generator efficiency 64 60 77 60 67LeverageNet gearing 16.1% 21.4% 17.9% 26.5% 24.6%Interest cover 10.02 6.83 10.10 6.21 5.64Current ratio 1.89 0.97 1.09 0.78 0.79OtherFive-year averageDividend growth 17.2%Revenue growth 10.9%Income statement$m 2007 2008 2009 2010 2011Revenue 769 1,179 1,120 1,105 1,164EBITDAF 314 305 447 328 443NPAT 112 111 160 85 127Net energy revenue* 758 1,157 1,072 1,072 1,131Balance sheet$m 2007 2008 2009 2010 2011Total assets 2,882 4,058 4,388 4,895 5,377Total liabilities 720 1,800 1,766 2,206 2,470Commercial value** 2,168 2,260 3,453 3,425 3,719Cash flow statement$m 2007 2008 2009 2010 2011Operating activities (net) 228 207 317 200 294Purchase of fixed assets 183 286 169 199 174Dividends*** 50 56 56 286 95Net cash flow 82 (53) 23 (49) 21Notes:* Sales less line charges less metering charges** Commercial valuation from the SCI*** Includes one-off special dividends of $150 million in 2009/10page | 86


