

apr-11.pdf (2.07 MB) - Crown Ownership Monitoring Unit
apr-11.pdf (2.07 MB) - Crown Ownership Monitoring Unit
apr-11.pdf (2.07 MB) - Crown Ownership Monitoring Unit

You also want an ePaper? Increase the reach of your titles
YUMPU automatically turns print PDFs into web optimized ePapers that Google loves.
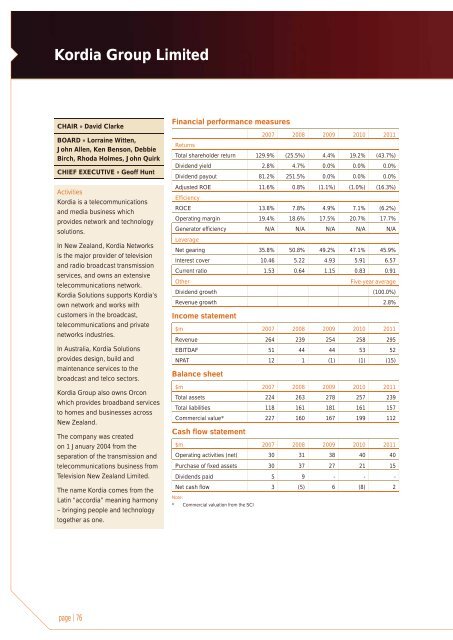
Kordia Group LimitedCHAIR » David ClarkeBOARD » Lorraine Witten,John Allen, Ken Benson, DebbieBirch, Rhoda Holmes, John QuirkCHIEF EXECUTIVE » Geoff HuntActivitiesKordia is a telecommunicationsand media business whichprovides network and technologysolutions.In New Zealand, Kordia Networksis the major provider of televisionand radio broadcast transmissionservices, and owns an extensivetelecommunications network.Kordia Solutions supports Kordia’sown network and works withcustomers in the broadcast,telecommunications and privatenetworks industries.In Australia, Kordia Solutionsprovides design, build andmaintenance services to thebroadcast and telco sectors.Kordia Group also owns Orconwhich provides broadband servicesto homes and businesses acrossNew Zealand.The company was createdon 1 January 2004 from theseparation of the transmission andtelecommunications business fromTelevision New Zealand Limited.The name Kordia comes from theLatin “accordia” meaning harmony– bringing people and technologytogether as one.Financial performance measures2007 2008 2009 2010 2011ReturnsTotal shareholder return 129.9% (25.5%) 4.4% 19.2% (43.7%)Dividend yield 2.8% 4.7% 0.0% 0.0% 0.0%Dividend payout 81.2% 251.5% 0.0% 0.0% 0.0%Adjusted ROE 11.6% 0.8% (1.1%) (1.0%) (16.3%)EfficiencyROCE 13.8% 7.8% 4.9% 7.1% (6.2%)Operating margin 19.4% 18.6% 17.5% 20.7% 17.7%Generator efficiency N/A N/A N/A N/A N/ALeverageNet gearing 35.8% 50.8% 49.2% 47.1% 45.9%Interest cover 10.46 5.22 4.93 5.91 6.57Current ratio 1.53 0.64 1.15 0.83 0.91OtherFive-year averageDividend growth (100.0%)Revenue growth 2.8%Income statement$m 2007 2008 2009 2010 2011Revenue 264 239 254 258 295EBITDAF 51 44 44 53 52NPAT 12 1 (1) (1) (15)Balance sheet$m 2007 2008 2009 2010 2011Total assets 224 263 278 257 239Total liabilities 118 161 181 161 157Commercial value* 227 160 167 199 112Cash flow statement$m 2007 2008 2009 2010 2011Operating activities (net) 30 31 38 40 40Purchase of fixed assets 30 37 27 21 15Dividends paid 5 9 - - -Net cash flow 3 (5) 6 (8) 2Note:* Commercial valuation from the SCIpage | 76


