EQECAT Model Submission - Florida State Board of Administration
EQECAT Model Submission - Florida State Board of Administration
EQECAT Model Submission - Florida State Board of Administration

You also want an ePaper? Increase the reach of your titles
YUMPU automatically turns print PDFs into web optimized ePapers that Google loves.
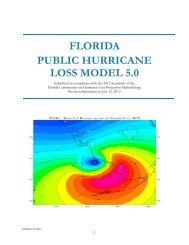
FLORIDA COMMISSION ONHURRICANE LOSS PROJECTIONMETHODOLOGYNovember 2012 <strong>Submission</strong>May 13, 2013 RevisionPrepared by:<strong>Florida</strong> Hurricane <strong>Model</strong> 2013aA Component <strong>of</strong> the <strong>EQECAT</strong> North Atlantic Hurricane <strong>Model</strong> inRisk Quantification and Engineering TMSubmitted under the 2011 Standards <strong>of</strong> the FCHLPM1
Enclosures:1. 7 bound copies <strong>of</strong> the <strong>EQECAT</strong> <strong>Submission</strong>2. 1 CD (labeled ‘FCHLPM – <strong>EQECAT</strong> 2011’) containing an electronic copy <strong>of</strong> the<strong>EQECAT</strong> <strong>Submission</strong> (FCHLPM_<strong>EQECAT</strong>2011_16April2013.pdf) and the following files:2011FormM1_<strong>EQECAT</strong>_16April2013.xls2011FormM3_<strong>EQECAT</strong>_16April2013.xls2011FormV2_<strong>EQECAT</strong>_16April2013.xls2011FormA1_<strong>EQECAT</strong>_16April2013.xls2011FormA1_<strong>EQECAT</strong>_16April2013.pdf2011FormA2_<strong>EQECAT</strong>_16April2013.xls2011FormA3_<strong>EQECAT</strong>_16April2013.xls2011FormA4_<strong>EQECAT</strong>_16April2013.xls2011FormA5_<strong>EQECAT</strong>_16April2013.xls2011FormA7_<strong>EQECAT</strong>_16April2013.xls2011FormA8_<strong>EQECAT</strong>_16April2013.xls•<strong>EQECAT</strong>, INC., An ABS Group Company • 475 14th Street, 5th Floor, Suite 550 • Oakland, California 94612-1900 USA • Phone 510.817.3100 • Fax 510.663.10483
The <strong>Florida</strong> Commission on Hurricane Loss Projection Methodology<strong>Model</strong> <strong>Submission</strong> Checklist1. Please indicate by checking below that the following has been included in yoursubmission to the <strong>Florida</strong> Commission on Hurricane Loss Projection Methodology.Yes No ItemX1. Letter to the CommissionX a. Refers to the certification forms and states that pr<strong>of</strong>essionals having credentials and/orexperience in the areas <strong>of</strong> meteorology, engineering, actuarial science, statistics, andcomputer science have reviewed the model for compliance with the standardsX b. <strong>State</strong>s model is ready to be reviewed by the Pr<strong>of</strong>essional TeamX c. Any caveats to the above statements noted with a complete explanationX2. Summary statement <strong>of</strong> compliance with each individual standard and the data and analysesrequired in the disclosures and formsX3. General description <strong>of</strong> any trade secret information the modeling organization intends to presentto the Pr<strong>of</strong>essional TeamX4. <strong>Model</strong> IdentificationX5. Seven (7) Bound Copies (duplexed)X6. Link containing:X a. <strong>Submission</strong> text in PDF formatX b. PDF file highlightable and bookmarked by standard, form, and sectionX c. Data file names include abbreviated name <strong>of</strong> modeling organization, standards year, andform name (when applicable)X d. Form S-6 (if required) in ASCII and PDF formatX e. Forms M-1, M-3, V-2, A-1, A-2, A-3, A-4, A-5, A-7, and A-8 in Excel formatX7. Table <strong>of</strong> ContentsX8. Materials consecutively numbered from beginning to end starting with the first page (includingcover) using a single numbering systemX9. All tables, graphs, and other non-text items consecutively numbered using whole numbersX10. All tables, graphs, and other non-text items specifically listed in Table <strong>of</strong> ContentsX11. All tables, graphs, and other non-text items clearly labeled with abbreviations definedX12. All column headings shown and repeated at the top <strong>of</strong> every subsequent page for forms andtablesX13. Standards, disclosures, and forms in italics, modeling organization responses in non-italicsX14. Graphs accompanied by legends and labels for all elementsX15. All units <strong>of</strong> measurement clearly identified with appropriate units usedX16. Hard copy <strong>of</strong> all forms included in a submission document Appendix exceptForms V-3, A-6, and S-62. Explanation <strong>of</strong> “No” responses indicated above. (Attach additional pages if needed.)Form S-6 was submitted in previous cycle, and can be made available upon request.<strong>EQECAT</strong> <strong>Florida</strong> Hurricane <strong>Model</strong>2013a Apr. 16, 2013<strong>Model</strong> Name <strong>Model</strong>er Signature Date4
The <strong>Florida</strong> Commission on Hurricane Loss Projection Methodology<strong>Model</strong> IdentificationName <strong>of</strong> <strong>Model</strong> and Version:<strong>EQECAT</strong> <strong>Florida</strong> Hurricane <strong>Model</strong> 2013aName <strong>of</strong> <strong>Model</strong>ing Organization: <strong>EQECAT</strong>, INC.Street Address: 475 14 th Street, Suite 550City, <strong>State</strong>, ZIP Code: Oakland, CA 94612-1900Mailing Address, if different from above:_______________________________________________________________________Contact Person: Justin BrolleyPhone Number: (510) 817-3126 Fax Number: (510) 663-1048E-mail Address: jbrolley@eqecat.com5
The <strong>Florida</strong> Commission on Hurricane Loss Projection MethodologyLicenses and TrademarksA number <strong>of</strong> trademarks and registered trademarks appear in this document. <strong>EQECAT</strong>,Inc. acknowledges all trademarks and the rights in the trademarks owned by thecompanies referred to herein.<strong>EQECAT</strong> , USWIND , USQUAKE , Risk Quantification andEngineering TM are trademarks <strong>of</strong> <strong>EQECAT</strong>, Inc.Windows is a trademark <strong>of</strong> Micros<strong>of</strong>t Corporation.MapInfo is a trademark <strong>of</strong> the MapInfo Corporation / Pitney BowesBusiness Insight. MapInfo contains data which is sublicensed fromMapInfo Corporation / Pitney Bowes Business Insight. MapInfoCorporation / Pitney Bowes Business Insight has obtained this dataunder license from other third party vendors as noted below.5-Digit ZIP Code data for the United <strong>State</strong>s, Puerto Rico, and theDistrict <strong>of</strong> Columbia. Copyright © 2012 MultiNet data and the United<strong>State</strong>s Postal Service. All Rights Reserved.6
The <strong>Florida</strong> Commission on Hurricane Loss Projection MethodologyTABLE OF CONTENTS2011 STANDARDSPageGENERAL STANDARDS ......................................................................... 12G-1 Scope <strong>of</strong> the Computer <strong>Model</strong> and Its Implementation ............................................................ 12G-2 Qualifications <strong>of</strong> <strong>Model</strong>ing Organization Personnel and Consultants ................................... 31G-3 Risk Location ................................................................................................................................ 42G-4 Independence <strong>of</strong> <strong>Model</strong> Components ........................................................................................ 44G-5 Editorial Compliance ................................................................................................................... 45METEOROLOGICAL STANDARDS ........................................................ 46M-1 Base Hurricane Storm Set ........................................................................................................... 46M-2 Hurricane Parameters and Characteristics ............................................................................... 48M-3 Hurricane Probabilities ................................................................................................................ 53M-4 Hurricane Windfield Structure .................................................................................................... 56M-5 Landfall and Over-Land Weakening Methodologies ................................................................ 61M-6 Logical Relationships <strong>of</strong> Hurricane Characteristics ................................................................ 64VULNERABILITY STANDARDS .............................................................. 65V-1 Derivation <strong>of</strong> Vulnerability Functions ........................................................................................ 65V-2 Derivation <strong>of</strong> Contents and Time Element Vulnerability Functions ....................................... 76V-3 Mitigation Measures ..................................................................................................................... 81ACTUARIAL STANDARDS ...................................................................... 89A-1 <strong>Model</strong>ing Input Data ..................................................................................................................... 89A-2 Event Definition ............................................................................................................................ 99A-3 <strong>Model</strong>ed Loss Cost and Probable Maximum Loss Considerations ...................................... 100A-4 Policy Considerations ............................................................................................................... 104A-5 Coverages ................................................................................................................................... 109A-6 Loss Output ................................................................................................................................ 112STATISTICAL STANDARDS ................................................................. 119S-1 <strong>Model</strong>ed Results and Goodness-<strong>of</strong>-Fit .................................................................................... 119S-2 Sensitivity Analysis for <strong>Model</strong> Output ..................................................................................... 124S-3 Uncertainty Analysis for <strong>Model</strong> Output ................................................................................... 126S-4 County Level Aggregation ........................................................................................................ 128S-5 Replication <strong>of</strong> Known Hurricane Losses ................................................................................. 129S-6 Comparison <strong>of</strong> Projected Hurricane Loss Costs .................................................................... 1307
The <strong>Florida</strong> Commission on Hurricane Loss Projection MethodologyFigure 46. Mobile Homes - % changes by county ............................................................................... 224Figure 47. Frame Renters - % changes by county ............................................................................... 225Figure 48. Masonry Renters - % changes by county ........................................................................... 226Figure 49. Frame Condos - % changes by county ............................................................................... 227Figure 50. Masonry Condos - % changes by county ........................................................................... 228Figure 51. Commercial Residential - % changes by county ............................................................... 229Figure 52. Current <strong>Submission</strong> Return Periods vs. Prior Year’s <strong>Submission</strong> Return Periods ....... 243Figure 53. Historical vs. <strong>Model</strong>ed Losses for Companies A to F ....................................................... 249Figure 54. Historical vs. <strong>Model</strong>ed Losses by LOB for Company C .................................................... 250Figure 55. Historical vs. <strong>Model</strong>ed Losses by County for Company D ............................................... 251Figure 56. Historical vs. <strong>Model</strong>ed Losses by LOB for Company E .................................................... 252Figure 57. Historical vs. <strong>Model</strong>ed Losses – Commercial Residential ............................................... 25311
The <strong>Florida</strong> Commission on Hurricane Loss Projection MethodologyGeneral Standardsthe insured loss components used in the model. The description shall be completeand shall not reference unpublished work.General description <strong>of</strong> Risk Quantification and Engineering TMRisk Quantification and Engineering TM (RQE) is <strong>EQECAT</strong>’s globalcatastrophe management s<strong>of</strong>tware, covering over 90 countries and the perils<strong>of</strong> hurricane / typhoon / cyclone (in <strong>Florida</strong> and elsewhere), windstorm,winterstorm, tornado, hail, wildfire, earthquake (ground shaking, fire following,sprinkler leakage, workers comp), and flood.The RQE platform is a networked, multi-user, client server architectureenabling enterprise-wide analysis using centralized and sharable databases.RQE uses a cost efficient industry standard computer infrastructure that caneasily expand to meet growing user demand. RQE uses standard PCs for enduser ‘clients’ running ordinary internet browsers. All users are networked tostandard Windows based servers which can be configured in scalableclusters to provide higher performance and capacity.RQE enables insurer and reinsurer analysis <strong>of</strong> multiple perils for over 90countries. A single product platform and user interface provides primary,facultative, treaty underwriting and accumulation management capabilityacross all lines <strong>of</strong> business with aggregation up to the corporate level. RQEalso provides underwriters with important information about risk volatility andthe impact <strong>of</strong> writing a new program on available capacity to enable real-timeportfolio optimization.One <strong>of</strong> the components <strong>of</strong> RQE is USWIND, a probabilistic model designed toestimate damage and insured losses due to the occurrence <strong>of</strong> hurricanesalong the 3100 miles <strong>of</strong> US coastline from Texas to Maine. Hereafter in thisdocument we use USWIND and <strong>Florida</strong> Hurricane <strong>Model</strong> 2013ainterchangeably. USWIND estimates the full probabilistic distribution <strong>of</strong>damage and loss for any scenario storm event. USWIND also calculatesAverage Annual Damage and Loss estimates, as well as annual probabilityexceedances using a database <strong>of</strong> 32,032 stochastic storm simulation resultsto develop average annual loss rates for each property site. Scenario andaverage annual damage and losses can be calculated for individual propertysites or for entire portfolios <strong>of</strong> residential and commercial properties.Scenario storms, derived from HURDAT, are used to estimate the mean andstandard deviation <strong>of</strong> damage and loss due to a single event. Any <strong>of</strong> the over100 years <strong>of</strong> historical storms contained in the storm database can beselected by users to calculate damage and loss. Damage and loss results forany <strong>of</strong> the 32,032 stochastic storm simulation results are also availablethrough the event loss table (ELT) reports.13
The <strong>Florida</strong> Commission on Hurricane Loss Projection MethodologyGeneral StandardsProbabilistic Annual Damage & Loss is computed using the results <strong>of</strong> 32,032stochastic storm simulation results. Annual damage and loss estimates aredeveloped for each individual site and aggregated, if desired, to overallportfolio damage and loss amounts. USWIND’s climatological models arebased on NOAA (National Oceanic & Atmospheric <strong>Administration</strong>)/NWS(National Weather Service) Technical Reports. Climatological probabilitydistributions (i.e., for storm parameters) were developed using an AdaptiveKernel Smoothing technique applied to the historical hurricane recordpublished by NOAA.Overall <strong>Model</strong> MethodologyUSWIND modeling methodology can be segmented into four components: 1)the Hazard definition, 2) Geocoding <strong>of</strong> Risk Location, 3) Damage estimate,and 4) Loss estimation.1. Hazard DefinitionThe storm database used by USWIND is a combination <strong>of</strong> historical andstochastic storms. Wind speed probabilistic distributions are calculated usingthe probabilistic distributions <strong>of</strong> all important storm parameters. The stormintensity is driven directly from the coastline-dependent smoothed wind speeddistributions generated from the information in the National Hurricane CenterHURDAT. The distributions for radius <strong>of</strong> maximum winds and translationalspeed are derived from NOAA Technical Report NWS 38 [Ho et al. 1987],and the National Hurricane Center’s Tropical Cyclone Reports andAdvisories. A proprietary wind speed equation based upon the NOAA modelas published in NWS 23 [Schwerdt, Ho, and Watkins 1979] and NWS 38 [Hoet al. 1987], modified and generalized to properly simulate wind speeds for allSSI categories <strong>of</strong> storms, computes a central pressure, which is used to applyinland decay [Vickery and Twisdale 1995] and as an input to thedetermination <strong>of</strong> the radius <strong>of</strong> maximum winds for severe storms. Theequation then computes wind speeds using the storm’s maximum sustainedwindspeed, the filling rate, radius to maximum winds, the storm track,translation speed, the gust factor [Krayer and Marshall 1992], the stormpr<strong>of</strong>ile (attenuation <strong>of</strong> wind speed outward from the center), and the frictioncaused by local terrain and man-made structures.2. Geocoding <strong>of</strong> Risk LocationUSWIND utilizes an embedded commercial GIS (Geographic InformationSystem), MapInfo, to compute the latitude and longitude <strong>of</strong> each siteanalyzed. The street address level, where such data is available, is used togeocode to the lat./long. coordinates. Failing the presence <strong>of</strong> a streetaddress, the geocoding can be done at a ZIP Code, City, or County centroidbasis. Wind speed distributions at the site locations are computed taking localfriction into account.14
The <strong>Florida</strong> Commission on Hurricane Loss Projection MethodologyGeneral Standards3. Estimation <strong>of</strong> DamageUSWIND provides the facility to define each <strong>of</strong> the property assets beinganalyzed in order to compute resulting damage. Damage can be calculatedfor Structure, Contents, Time Element (such as Additional Living Expense(ALE) or Business Interruption (BI)), and up to three additional user definedcoverage types. Site information includes the latitude and longitude <strong>of</strong> thelocations, the structure types (96 types), structure details such as number <strong>of</strong>stories, insured value, cladding type and a class <strong>of</strong> occupancy type (12types). Vulnerability functions may be modified by the incorporation <strong>of</strong>secondary structural components such as ro<strong>of</strong> type, ro<strong>of</strong> strength, ro<strong>of</strong>-wallstrength, wall-floor strength, wall-foundation strength, opening protection, andwind-door-skylight strength. Damage is estimated using vulnerabilityfunctions associated with the structure definition and occupancy type and thedistribution <strong>of</strong> peak gust wind speeds at each site. The vulnerability functionsused by USWIND have been derived through three methods: empirical data,expert opinion, and engineering analysis [Fujita 1992, McDonald-MehtaEngineers 1993, Simiu and Scanlan 1996].The probabilistic distribution <strong>of</strong> damage (for each coverage and site) isderived through the discrete calculations <strong>of</strong> the probabilistic distribution <strong>of</strong>wind speeds for the site with the probabilistic distributions <strong>of</strong> damage forgiven wind speeds. Damage distributions for each <strong>of</strong> the sites are aggregatedinto an overall portfolio distribution <strong>of</strong> damage.Since there can be a high degree <strong>of</strong> damage correlation for similar structuretypes within a geographic area, USWIND properly takes into account site andcoverage level correlations when aggregating individual site damage into anoverall portfolio damage amount.4. Estimation <strong>of</strong> LossInsurance information in the form <strong>of</strong> insured values, limits, deductibles andfacultative and/or treaty reinsurance are then aggregated, using discretecalculations, with the probabilistic distribution <strong>of</strong> computed damage for eachsite to determine the probabilistic distribution <strong>of</strong> “insured loss” amount.Correlation is properly taken into account when aggregating individual siteloss into an overall portfolio loss amount.ReportsUSWIND produces a vast array <strong>of</strong> management information, more than 200reports in all. Report categories include:Underwriting. TIV and premium can be mapped by geographicalsegmentation (state, county or ZIP Code) or reported by corporatesegmentation (company, division, branch, line <strong>of</strong> business, policy type,15
The <strong>Florida</strong> Commission on Hurricane Loss Projection MethodologyGeneral Standardsproducer, account, policy or site). Pr<strong>of</strong>iles <strong>of</strong> the deductibles and limits in theportfolio can also be displayed.Scenario Storms. Damage (ground-up effects), gross loss (includingdeductibles and limits), net loss (including facultative reinsurance) can bereported at all <strong>of</strong> the levels noted in the underwriting reports. Mean valuesand an upper bound corresponding to a prescribed non-exceedance level areprovided.Probabilistic. In a manner similar to Scenario Storms, the damage, gross loss,and net loss can be reported, including non-exceedances. Additional reportsdisplaying portfolio damage and loss for different non-exceedance levels, foreither annual aggregate or per occurrence analysis methods, are available.Reinsurance. Scenario and probabilistic results are displayed by reinsurer(including facultative reinsurance) or by treaty. Probabilistic results include theprobability <strong>of</strong> penetrating and exceeding treaty layers.Landfall Series. An abbreviated set <strong>of</strong> reports is available from running aseries <strong>of</strong> storms against the portfolio. The series <strong>of</strong> storms can be either <strong>of</strong>uniform intensity (as denoted by the SSI scale) or uniform recurrence levels.The storm series can have landfalls at 1, 10 or 35 mile intervals.Probability DistributionsIn many instances, probability distributions have been developed fromhistorical data (e.g., storm parameters such as radius to maximum winds,forward speed, etc.) and vulnerability functions. Goodness-<strong>of</strong>-fit tests havebeen used to compare modeled distributions <strong>of</strong> various parameters with theunderlying historical data.Sensitivity and Uncertainty AnalysesMany sensitivity and uncertainty analyses have been performed in thedevelopment <strong>of</strong> USWIND. For example, sensitivity analyses have beenperformed on track spacing; on the number <strong>of</strong> attack angles given landfall; onthe number <strong>of</strong> wind speed class intervals given landfall and attack angle; andon the number <strong>of</strong> other storm parameter samples used in the stochastichurricane database. A number <strong>of</strong> uncertainty analyses have been performedas well, including studies on the impact <strong>of</strong> vulnerability uncertainty on the lossexceedance curve.16
The <strong>Florida</strong> Commission on Hurricane Loss Projection MethodologyGeneral StandardsS<strong>of</strong>tware/Hardware - Risk Quantification and Engineering TMThe requirements for the Risk Quantification and Engineering TM (RQE)hardware configuration consist <strong>of</strong> a Master Server and one or more AnalysisServers.Applications running on the Master Server include the Master database, theWeb Server, and the Java Server. <strong>EQECAT</strong> processes, including theimporting <strong>of</strong> portfolio data and some analyses also run on the Master Server.Master database: Contains RQE System tables, customer portfolio data, andfinal analysis results.Web Server: Handles communications between the remote Client PCs andcommunicates with the Java Server.Java Server: Manages the activities performed on the Master and AnalysisServer(s) and the Master and Results Databases.The Analysis Server houses the Results Database, containing theintermediate results tables, and runs most <strong>of</strong> the analysis calculations. RQEusers access the Master Server via Internet Explorer web browserscommonly installed on the Client PCs. The Client PC may access the systemvia the LAN or via a WAN/Internet.Minimum Client Requirements: Operating System: Windows XP or Vista. Processor: 2.4 GHz or higher. RAM: 1 GB minimum (2 GB is recommended). Micros<strong>of</strong>t Office 2000 or later (Office is only required if using thespreadsheet import option in RQE). Browser: Micros<strong>of</strong>t Internet Explorer Version 5.5 or later. Monitor: Screen resolution <strong>of</strong> 1280 by 800 or greater; screen color depth<strong>of</strong> 256 colors or greater.Minimum Server Hardware Requirements:(Master Server and Analysis Server(s)) Operating System: Windows 2003 Server (SP2), 32 bit or 64 bit OS. Processors: 1-Quad Core CPU, 2.66 GHz or higher. RAM: 12 GB. Hard Drives: Capacity to house eight 146 Gigabyte drives. NTFS File System. DVD. NIC: 1.0 Gigabit.17
The <strong>Florida</strong> Commission on Hurricane Loss Projection MethodologyGeneral StandardsThe model structure is translated to the program structure using ObjectOriented Design and Analysis methodology. Physical and abstract entities inthe model structure are mapped to objects <strong>of</strong> the program structure. Theinteractions between objects are captured using Flowcharts and Eventdiagrams. Object oriented practices (data encapsulation, abstraction,inheritance and polymorphism) are extensively used to derive the benefits <strong>of</strong>Object Oriented approach.Basis for MethodologyUSWIND’s climatological models are based on NOAA/NWS TechnicalReports [Schwerdt, et. al. (1979); Ho, et. al. (1987)]. Climatological probabilitydistributions (i.e., for storm parameters) were developed using AdaptiveKernel Smoothing [Scott (1992)] applied to the historical hurricane recordpublished by NOAA [Jarvinen, et. al. (1984); Cry (1965)]. The maximum windspeed and overwater wind field modeling was developed from NOAA/NWSequations [Schwerdt, et. al. (1979)], with some empirical adjustment in orderto generalize the equations for lower intensity storms. The model uses currentscientifically accepted boundary layer methods to convert a marine surface(10-meter 1-minute) windfield to one which incorporates local land frictionwhen over land. The friction factors were developed by weighting andaveraging surface roughness within 20 km <strong>of</strong> a location and within a givendirectional sector. Vulnerability relationships were developed from severalsources, including observed damage relationships in historical storms[Friedman 1972, 1984; numerous Travelers Insurance Company internalmemoranda] and engineering studies [McDonald-Mehta (1993)]. Thesimulation methodology combines several standard techniques includingphysical modeling [Friedman 1975], Monte Carlo simulation [Metropolis andUlam (1949)] and Variance Reduction Techniques [Kahn (1950); Rubinstein(1981)]. The evaluation <strong>of</strong> loss costs and other risk measures is based onstandard actuarial theory [Beard, et. al. (1984)].3. Provide a flow diagram that illustrates interactions among major modelcomponents.USWIND is a complex system made up <strong>of</strong> many components, databases, anddata files. The flowcharts, class diagrams, and tables on the following pagessummarize the key aspects <strong>of</strong> the system. These aspects include therepresentation <strong>of</strong> physical entities <strong>of</strong> the hurricane catastrophe domain (e.g.storm, site, portfolio, etc.) as classes and objects within the program (Figure1); the procedural flow <strong>of</strong> information and steps within the program (Figure 2);and the exchange <strong>of</strong> information among various components <strong>of</strong> the system(e.g. portfolio tables, storm database, results tables, etc.) (Table 1 and Figure3).18
The <strong>Florida</strong> Commission on Hurricane Loss Projection MethodologyGeneral StandardsBeginPortfolioTablesRead Site's Informationfrom DatabaseCompute Hazard at theSiteCompute Damage tothe Site due tocalculated hazardResultsTablesOutput hazard andDamage ResultsEnd <strong>of</strong> Portfolio ?NoYesEndFigure 2. Flowchart – USWIND Hazard and Damage Calculation Procedure20
The <strong>Florida</strong> Commission on Hurricane Loss Projection MethodologyGeneral StandardsTABLE 1.KEY CLASSES OF THE USWIND WIND SPEED AND DAMAGE CALCULATIONClassCportfolioNo. <strong>of</strong>InstancesOnceOwner(s)Main()Csite Multiple CPortfolioCstormPeril Multiple CPortfolioCstorm Multiple CStormPerilCsiteWindHazardCsiteWindDamageOnceOnceCStormPerilCSiteWindHazard,CStormPerilResponsibilitiesPrincipal object that serves as startingpoint.Connects to Database.Opens Input and Output tables.Performs static initializations (likeloading binary files into memory)Creates CSite objects (one at time)Creates the Peril objects(CStormPeril)Analyzes the portfolio using the PerilobjectsHolds site specific informationCalculates information necessary forperforming hazard and damagecomputations.Represents the PerilLoads storm information fromDatabase and prepares the stormUses CSiteWindHazard object toperform hazard calculationsHolds the storm information read fromDatabase.Calculates storm parametersnecessary for subsequentcomputations.Calculates hazard from a given Stormto a given Site.Uses CStormPeril, CStorm, CSiteobjects to perform hazard calculationsCalculates damage to a site from agiven hazard.Uses CSite, CSiteWindHazard andother objects (e.g. CCoverage forcoverage information, CDamage fordamage curves, CResult for storingresults information etc.)21
The <strong>Florida</strong> Commission on Hurricane Loss Projection MethodologyGeneral StandardsCPortfolioobject1. Create a CSite objectwith information read aboutthe site from PortfolioTablesCSite Object(sitepar.cpp)2. Ask CStormPeril objectsto analyze this siteusesusesCStormPerilObject(storm.cpp)Creates CSiteWindHazardobject to perform HazardCalculationsusesCSiteWindHazardobject(sitewind.cpp)usesCSiteWindDamageobject(sitewdmg.cpp)Creates aCSiteWindDamage objectto perform DamageCalculationsObject Deployment for Hazard and DamageCalculationsFigure 3. Flowchart - Object Deployment for USWIND Hazard and Damage Calculations4. Provide a comprehensive list <strong>of</strong> complete references pertinent to the submission byStandard grouping, according to pr<strong>of</strong>essional citation standards.List <strong>of</strong> References:Meteorology StandardsBeven, Jack, and Hugh D. Cobb, III (2006), “Tropical Cyclone Report Hurricane Ophelia6-17 September 2005”, National Hurricane Center, January 2006..22
The <strong>Florida</strong> Commission on Hurricane Loss Projection MethodologyGeneral StandardsCase, Robert A. (1986) “Annual Summary Atlantic Hurricane Season <strong>of</strong> 1985”; MonthlyWeather Review, Vol. 114, Issue 7, July 1986, pp. 1390-1405Cry, G. W. (1965). Tropical Cyclones <strong>of</strong> the North Atlantic Ocean, TechnicalPaper No. 55, U.S. Department <strong>of</strong> Commerce, Weather Bureau,Washington, DC.Franklin, J.L., M.L. Black, and K. Valde (2003). “GPS dropwindsonde windpr<strong>of</strong>iles in hurricanes and their operational implications”, Weather andForecasting, Vol. 18, No. 1, pp. 32-44.Ho, F. P., Su, J. C., Hanevich, K. L., Smith, R. J., and Richards, F. P. (1987).Hurricane Climatology for the Atlantic and Gulf Coasts <strong>of</strong> the United<strong>State</strong>s, NOAA Technical Report NWS 38, U.S. Department <strong>of</strong> Commerce,National Oceanographic and Atmospheric <strong>Administration</strong>, NationalWeather Service, Washington, DC.Homer, C. C. Huang, L. Yang, B. Wylie and M. Coan (2004). “Development <strong>of</strong>a 2001 National Landcover Database for the United <strong>State</strong>s”.Photogrammetric Engineering and Remote Sensing, Vol. 70, No. 7, July2004, pp. 829-840Houston, S.H., and M.D. Powell (2003). “Surface wind fields for <strong>Florida</strong> BayHurricanes”, Journal <strong>of</strong> Coastal Research, Vol. 19, pp. 503-513.Hurricane Research Division- Reanalysis <strong>of</strong> the Atlantic hurricane database(HURDAT)- http://www.aoml.noaa.gov/hrd/hurdat/metadata_dec12.htmlJarvinen, B. R., Neumann, C. J., and Davis, M. A. S. (1984). A TropicalCyclone Data Tape for the North Atlantic Basin, Technical MemorandumNWS NHC 22, National Oceanic and Atmospheric <strong>Administration</strong> andNational Weather Service, Washington, DC.Krayer, W.R., and Marshall, R.D. (1992). “Gust factors applied to hurricanewinds,” Bulletin <strong>of</strong> the American Meteorological Society, Vol. 73, No. 5, pp.613-617.Kwon, I.H., and Cheong, H.B. (2010). "Tropical Cyclone Initialization with aSpherical High-Order Filter and an Idealized Three-Dimensional BogusVortex," Monthly Weather Review, Vol. 138, No. 4, pp. 1344-1367.Landsea, C. W. et al (2004). “A Reanalysis <strong>of</strong> Hurricane Andrew’s Intensity,”Bulletin <strong>of</strong> the American Meteorological Society, Vol. 85, No. 11, pp. 1699-1712.Powell, M.D., D. Bowman, D. Gilhousen, S. Murillo, N. Carrasco, and R. St.Fluer (2004). “Tropical Cyclone Winds at Landfall”, Bulletin <strong>of</strong> theAmerican Meteorological Society, Vol. 85, No. 6, pp. 845-851.Schwerdt, R. W., Ho, F. P., and Watkins, R. R. (1979). Meteorological Criteriafor Standard Project Hurricane and Maximum Probable Hurricane WindFields, Gulf and East Coasts <strong>of</strong> the United <strong>State</strong>s, NOAA Technical Report23
The <strong>Florida</strong> Commission on Hurricane Loss Projection MethodologyGeneral StandardsNWS 23, U.S. Department <strong>of</strong> Commerce, National Oceanographic andAtmospheric <strong>Administration</strong>, National Weather Service, Washington, DC.Simiu, E., Vickery, P., and Kareem, A. (2007), “Relation between Saffir-Simpson Hurricane Scale Wind Speeds and Peak 3-s Gust Speeds overOpen Terrain,” Journal <strong>of</strong> Structural Engineering, Vol. 133, No. 7, 1043-1045.Simpson, R.H., et. al., (1970) “The Atlantic Hurricane Season <strong>of</strong> 1969”; MonthlyWeather Review, Vol. 98, No.4, April 1970, pp 293-306U.S. Department <strong>of</strong> Commerce Weather Bureau, (1960) “Hurricane Ethel September14-17, 1960. November 1960Vickery, P.J. and Twisdale, L.A. (1995). “Wind-Field and Filling <strong>Model</strong>s forHurricane Wind-Speed Predictions,” Journal <strong>of</strong> Structural Engineering,Vol. 121, No. 11, pp. 1700-1709.Vihma, T. and Savijarvi, H. (1991) “On the Effective Roughness Length forHeterogeneous Terrain,” Quarterly Journal <strong>of</strong> Royal MeteorologicalSociety, Vo. 117, pp. 399-407.Westerink, J.J., et al. (2008). “A Basin- to Channel-Scale Unstructured GridHurricane Storm Surge <strong>Model</strong> Applied to Southern Louisiana,” MonthlyWeather Review, Vol. 136, No. 3, pp. 833-864.Vulnerability Standards<strong>Florida</strong> Building Code (2001). <strong>State</strong> <strong>of</strong> <strong>Florida</strong>, Tallahassee, <strong>Florida</strong>.Fujita, T. T. (1992). “Damage survey <strong>of</strong> Hurricane Andrew in south <strong>Florida</strong>,”Storm Data, Vol. 34, pp. 25–30.Hurricane Research Division – Data Sethttp://www.aoml.noaa.gov/hrd/data_sub/wind.html#McDonald-Mehta Engineers (1993). Vulnerability Functions for EstimatingWind Damage to Buildings, for EQE Engineering and Design, Texas TechUniversity, Lubbock, TX. (Available on-site, only)North Atlantic Hurricane <strong>Model</strong> Principles & Methodology - RQE v. 13,<strong>EQECAT</strong>. 2013.Simiu, E. and Scanlan, R. H. (1996). Wind Effects on Structures, John Wileyand Sons, New York, NY.South <strong>Florida</strong> Building Code (1994). Metropolitan Dade County, Miami,<strong>Florida</strong>.Secondary Structural Modifiers: Features and <strong>Model</strong> Description, ABSConsulting/<strong>EQECAT</strong> Report, Rev. 2, 2013.24
The <strong>Florida</strong> Commission on Hurricane Loss Projection MethodologyGeneral StandardsActuarial StandardsBeard, R.E., T. Pentikainen, and E. Pesonen (1984). Risk Theory: the Stochastic Basis<strong>of</strong> Insurance (3rd Edition, New York: Chapman and Hall).Bohn, M.P., et. al., (1983). “Application <strong>of</strong> the SSMRP Methodology to the SeismicRisk at the Zion Nuclear Plant,” prepared for the U.S. Nuclear RegulatoryCommission, Lawrence Livermore National Laboratory.Friedman, D. G. (1972). "Insurance and the natural hazards," 9th ASTINColloquium, International Congress <strong>of</strong> Actuaries, Randers, Denmark,International Journal for Actuarial Studies in Non-Life Insurance and RiskTheory, Amsterdam, The Netherlands, Vol. VII, Part 1, pp. 4-58.Friedman, D. G. (1984). "Natural hazard risk assessment for an insuranceprogram," The Geneva Papers on Risk and Insurance, Vol. 9, pp. 57-128.Hammersley, J.M. and D. C. Handscomb. (1965). Monte Carlo Methods (New York:Barnes & Noble).Hogg, R.V., and S. A. Klugman (1984). Loss Distributions (New York: John Wileyand Sons).Rubenstein's, R.Y. (1981). Simulation and the Monte Carlo Method (New York: JohnWiley and Sons)Statistical StandardsBeard, R. E., Pentikäinen, T., and Pesonen, E. (1984). Risk Theory: TheStochastic Basis <strong>of</strong> Insurance, London: Chapman and Hall.Chaudhuri, P. and Marron, J.S. (1999). “SiZer for Exploration <strong>of</strong> Structures inCurves”, Journal <strong>of</strong> the American Statistical Association, Vol. 94, pp. 807-823Kahn, H. (1950). “Modifications <strong>of</strong> the Monte Carlo method,” in Proceedings,Seminar on Scientific Computations, November 16-18, 1949, Hurd, C. C.,ed., pp. 20-27, International Business Machines, New York, NY.Metropolis, N., and Ulam, S. (1949). “The Monte Carlo method,” Journal <strong>of</strong>the American Statistical Association, Volume 44, page 335.Rubinstein, R. Y. (1981). Simulation and the Monte Carlo Method, John Wileyand Sons, New York, NY.Scott, D. W. (1992). Multivariate Density Estimation: Theory, Practice, andVisualization, John Wiley and Sons, New York, NY.Computer StandardsFriedman, D. G. (1975). Computer Simulation in Natural Hazard Assessment,Monograph NSF-RA-E-75-002. Institute <strong>of</strong> Behavioral Sciences, University<strong>of</strong> Colorado, Boulder, CO.25
The <strong>Florida</strong> Commission on Hurricane Loss Projection MethodologyGeneral Standards5. Provide the following information related to changes in the model from thepreviously accepted submission to the initial submission this year:A. <strong>Model</strong> Changes1. A summary description <strong>of</strong> changes that affect the personal or commercialresidential loss costs or probable maximum loss levels,The following significant changes were made to the model between thepreviously accepted submission (<strong>EQECAT</strong> <strong>Florida</strong> Hurricane <strong>Model</strong> 2011a)and the current submission (<strong>EQECAT</strong> <strong>Florida</strong> Hurricane <strong>Model</strong> 2013a):1. The probabilistic hurricane database was regenerated to be consistent with theNational Hurricane Center’s HURDAT data set as <strong>of</strong> May 14, 2012.2. The simulation time period has been doubled from 150,000 years to 300,000years. Also, nearly identical events have been merged, reducing the number <strong>of</strong>cases in the stochastic set from 47,315 to 32,032 events affecting the United<strong>State</strong>s Mainland.3. The resolution <strong>of</strong> the time stepping in the windfield calculation has beenincreased from 15-minutes to 5-minutes.4. The ZIP Code database has been updated to March 2012.5. The mitigation measures have been updated.6. The financial model has been updated to use discrete calculations instead <strong>of</strong>numerical integration for the computation <strong>of</strong> insured loss.2. A list <strong>of</strong> all other changes, andAll model changes have an impact on personal and commercial residentialloss costs and probable maximum loss levels.3. The rationale for each change.1. The probabilistic hurricane database was regenerated to be consistent with the latestavailable HURDAT data set at the time <strong>of</strong> the initial submission. This update satisfies therequirements set forth in Standard M-1.2. The current version uses a simulation time period that spans 300,000 years, whereasthe previous model covered 150,000 years. This change allows better sampling <strong>of</strong> rareevents by making it possible to increase the number <strong>of</strong> samples by tw<strong>of</strong>old. As part <strong>of</strong>this process, the stochastic storm set used in the simulation was optimized such thatnearly identical events (based on landfall location, storm parameters, and resulting windpatterns) were merged into a single representative case with its frequency as the sum <strong>of</strong>the merged events.26
The <strong>Florida</strong> Commission on Hurricane Loss Projection MethodologyGeneral StandardsThis event set optimization, where similar events are combined, resulted in a reducedtotal number <strong>of</strong> cases in the overall storm set, without notable change in the resolution <strong>of</strong>the loss estimating process. The new model uses 32,032 events over the 300,000 yearsimulation.3. The change to a finer time-step (from 15-minutes to 5-minutes) was made to betterresolve small details in the wind pattern for very fast-moving storms, such as in theNortheastern U.S., and also in cases <strong>of</strong> very small storms where extremely steep windspeed gradients may exist near the core. This was taken into consideration along withcomputer resources such as run-time.4. The ZIP Code database was updated to reflect the latest database. This updatesatisfies the requirements set forth in Standard G-3.5. Mitigation measures <strong>of</strong> the model have been updated to accommodate more optionsfor Ro<strong>of</strong> Sheathing and Foundation Anchorage. Updates were also made to performancescoring <strong>of</strong> options <strong>of</strong> some existing mitigation measures. These new options are addedto provide a more complete list <strong>of</strong> possible construction schemes. In addition to inclusion<strong>of</strong> more options, the scoring for some <strong>of</strong> the mitigation measures have been updated.6. The financial model was updated to be able to handle Excess and Surplus marketmulti-layered policies, multiple levels <strong>of</strong> deductibles and limits, and in addition to be ableto handle an arbitrary combination <strong>of</strong> sub-limits and sub-deductibles. The new model alsomakes all policy types consistent and available worldwide and adds handling <strong>of</strong> policies,spanning multiple countries.a. Percentage difference in average annual zero deductible statewide loss costs for:1. All changes combined,The average annual zero deductible statewide loss cost has increased by3.7% as a result <strong>of</strong> all changes combined.2. Each significant model component change, andThe average annual zero deductible statewide loss cost has increased by3.4% as a result <strong>of</strong> the HURDAT update, and has decreased by 0.9% as aresult <strong>of</strong> event optimization and increase in simulation time period to300,000 years. In addition, the time stepping model has caused anadditional 2.4% increase in average annual zero deductible statewide losscosts. The average annual zero deductible statewide loss cost hasdecreased by 0.2% as a result <strong>of</strong> the ZIP Code database update, and themitigation measures update has resulted in a 1.0% decrease. Thefinancial model changes have no impact on zero-deductible losses, but ithas an impact on losses on policies with non-zero deductibles.27
The <strong>Florida</strong> Commission on Hurricane Loss Projection MethodologyGeneral Standardsb. Color-coded maps by county reflecting the percentage difference in average annualzero deductible statewide loss costs for each significant model component change.Figure 4. Impact on average annual zero deductible loss costs – Frequency updateFigure 5. Impact on average annual zero deductible loss costs – Event Optimization28
The <strong>Florida</strong> Commission on Hurricane Loss Projection MethodologyGeneral StandardsFigure 6. Impact on average annual zero deductible loss costs – 5-minute Time StepUpdateFigure 7. Impact on average annual zero deductible loss costs – ZIP Code Update29
The <strong>Florida</strong> Commission on Hurricane Loss Projection MethodologyGeneral StandardsFigure 8. Impact on average annual zero deductible loss costs – Mitigation MeasuresUpdateFigure 9. Impact on average annual zero deductible loss costs – All Updates30
The <strong>Florida</strong> Commission on Hurricane Loss Projection MethodologyGeneral Standards2. Pr<strong>of</strong>essional CredentialsA. Provide in a chart format (a) the highest degree obtained (discipline andUniversity), (b) employment or consultant status and tenure in years, and (c)relevant experience and responsibilities <strong>of</strong> individuals involved in acceptabilityprocess or in any <strong>of</strong> the following aspects <strong>of</strong> the model:1. Meteorology2. Vulnerability3. Actuarial Science4. Statistics5. Computer ScienceThe tables below summarize the credentials for the individuals involved inthe development and maintenance <strong>of</strong> USWIND. More detailed credentialsfor selected personnel are provided in Appendix #6.1. MeteorologyNameAnnesHaseemkunjuJustin BrolleyMahmoudKhaterFan LeiZhiyuan LiuJohn ManganoDavid SmithJingyun WangHighest DegreePh.D. MeteorologyCochin University <strong>of</strong>Science and TechnologyPh.D. Meteorology<strong>Florida</strong> <strong>State</strong> UniversityPh.D. Structural EngineeringCornell UniversityM.S. MeteorologyUniversity <strong>of</strong> MarylandPh.D. Applied Mathematics /Meteorology, University <strong>of</strong>Wisconsin - MilwaukeeM.S. MeteorologyRutgers UniversityM.S. GeophysicsYale UniversityPh.D. Atmospheric ScienceBoston UniversityEmployeeSince200920071988Relevant ExperienceMeteorology, hurricaneanalysisMeteorology, hurricaneanalysis<strong>Model</strong> design, probabilisticanalysis2007 Meteorology2007 Meteorology2008 Meteorology1994Meteorology, hurricaneanalysis2007 Meteorology33
The <strong>Florida</strong> Commission on Hurricane Loss Projection MethodologyGeneral Standards2. VulnerabilityNameJames R. (Bob)BaileyGopi GotetiSurya GunturiOmar KhemiciYoungSuk KimKambanParasuramanAmanuel TecleHighest DegreePh.D. Civil EngineeringTexas Tech UniversityPhD, University <strong>of</strong>California-IrvinePh.D. Civil EngineeringStanford UniversityPh.D. Civil EngineeringStanford UniversityPh.D. Structural EngineeringUniversity <strong>of</strong> IllinoisPh.D. Civil EngineeringUniversity <strong>of</strong> SaskatchewanPh.D. Civil andEnvironmental Engineering<strong>Florida</strong> InternationalUniversityEmployeeSinceConsultantRelevant ExperienceWind engineering2012 Structural engineering2007 Structural engineering1990 Structural engineering2007 Structural engineering2007 Structural engineering2012 Structural engineering3. Actuarial ScienceNameLaura Maxwell,FCAS, MAAAHighest DegreeB.S. MathematicsMoravian CollegeEmployeeSinceRelevant Experience2012 Actuarial science4. StatisticsNameJames JohnsonMahmoudKhaterIlyes MeftahKambanParasuramanDavid SmithKunshan YinHighest DegreePh.D. Civil EngineeringUniversity <strong>of</strong> IllinoisPh.D. Structural EngineeringCornell UniversityM.S. Probability and Statistics,University Pierre and MarieCurrie - ParisPh.D. Civil EngineeringUniversity <strong>of</strong> SaskatchewanM.S. GeophysicsYale UniversityPh.D. StatisticsUniversity <strong>of</strong> Texas, DallasEmployeeSinceConsultant19882012Relevant ExperienceProbabilistic analysis<strong>Model</strong> design,probabilistic analysisProbabilistic Analysis,Pricing2007 Probabilistic analysis19942007<strong>Model</strong> design,probabilistic analysisStatistics, probabilisticanalysis34
The <strong>Florida</strong> Commission on Hurricane Loss Projection MethodologyGeneral Standards5. Computer ScienceNameBranimir BetovJohn BinuPhil BurtisKent DavidAarti DineshRodney GriffinRay KincaidTom LarsenJason MokJonathan MossSergeyPasternakJames ScottDavid SmithMarian SzeflerVinh ThachPadmini VijayAlexanderVolkovHighest DegreeM.S. Electrical EngineeringTechnical University <strong>of</strong>S<strong>of</strong>ia, BulgariaM.S. Computer ScienceBharathiar UniversityB.S. Electrical EngineeringIowa <strong>State</strong> UniversityM.S. Structural Analysis andDesignUniversity <strong>of</strong> California,BerkeleyM.B.A.University <strong>of</strong> Missouri,St. LouisBSc - Computer Science -University <strong>of</strong> South AfricaM.B.A.Pepperdine UniversityM. Eng. StructuralEngineeringUniversity <strong>of</strong> California,BerkeleyB.S. Computer EngineeringSan Jose <strong>State</strong> UniversityB.A. MathematicsSt. Norbert CollegeB.S. Electrical EngineeringPetrochemical and GasIndustry Institute, Moscow,RussiaMS, Computer Science, SanFrancisco <strong>State</strong> UniversityM.S. GeophysicsYale UniversityM.S. Electrical EngineeringGdansk University <strong>of</strong>TechnologyB.S. Computer Science andEngineeringUniversity <strong>of</strong> California,DavisB.S. Electrical EngineeringUniversity <strong>of</strong> Bombay, IndiaM.S. S<strong>of</strong>tware DevelopmentInternational TechnologicalUniversity, SunnyvaleEmployeeSinceRelevant Experience1998 S<strong>of</strong>tware development2012 S<strong>of</strong>tware development1996 S<strong>of</strong>tware development1987S<strong>of</strong>tware qualityassurance2007 Product management2012 Product management1985 S<strong>of</strong>tware development1989<strong>Model</strong> design, s<strong>of</strong>twaredevelopment, s<strong>of</strong>twareproduct management2006 S<strong>of</strong>tware development2012 S<strong>of</strong>tware development1995 S<strong>of</strong>tware development2011 S<strong>of</strong>tware development19942010(march)<strong>Model</strong> design, s<strong>of</strong>twaredevelopmentS<strong>of</strong>tware development2007 S<strong>of</strong>tware development2012 S<strong>of</strong>tware development2008 S<strong>of</strong>tware development35
The <strong>Florida</strong> Commission on Hurricane Loss Projection MethodologyGeneral StandardsNameKerryZimmermanHighest DegreeB.S. Computer ScienceCalifornia <strong>State</strong> University,San Luis ObispoEmployeeSinceRelevant Experience1997 S<strong>of</strong>tware developmentB. Identify any new employees or consultants (since the previous submission)working on the model or the acceptability process.Laura Maxwell, a consulting actuary with a private actuarial firm, providesadvice in the area <strong>of</strong> actuarial science.Gopi Goteti, Amanuel Tecle, Ilyes Meftah, John Binu, Rodney Griffin,Jonathan Moss, and Padmini Vijay have join <strong>EQECAT</strong> in 2012, andJames Scott has joined <strong>EQECAT</strong> in 2011.C. Provide visual business workflow documentation connecting all personnel relatedto model design, testing, execution, maintenance, and decision-making.See Figure 10 on the next page.36
The <strong>Florida</strong> Commission on Hurricane Loss Projection MethodologyGeneral StandardsProductManagement(TomLarsen)Methodology Development(Mahmoud Khater,David Smith)GUI Development(Ray Kincaid,Phil Burtis)<strong>Model</strong> Development(Mahmoud Khater,David Smith)Configuration Managemnt(Ray Kincaid,Phil Burtis)Documentation/Publications(Mahmoud Khater,David Smith,Ray Kincaid,Phil Burtis)Quality Assurance(Kent David)Shipping(Ray Kincaid,Phil Burtis)CustomerCustomer Service(Tom Larsen)Figure 10. Business Workflow DiagramD. Indicate specifically whether individuals listed in A. and B. are associated withthe insurance industry, a consumer advocacy group, or a government entity aswell as their involvement in consulting activities.None <strong>of</strong> the individuals listed in A. and B. including the consultants LauraMaxwell (credentials above); Dr. James Johnson (credentials above andin Appendix 1); and Dr. James R. (Bob) Bailey are associated with theinsurance industry, a consumer advocacy group, or a government entity.Laura Maxwell, a consulting actuary with a private actuarial firm, providesadvice in the area <strong>of</strong> actuarial science.Dr. James Johnson provides advice in the area <strong>of</strong> probabilistic analysis.37
The <strong>Florida</strong> Commission on Hurricane Loss Projection MethodologyGeneral StandardsDr. James R. (Bob) Bailey provides support in the area <strong>of</strong> mitigationmeasures within vulnerability.3. Independent Peer ReviewA. Provide dates <strong>of</strong> external independent peer reviews that have been performed onthe following components as currently functioning in the model:1. Meteorology2. Vulnerability3. Actuarial Science4. Statistics5. Computer Science1. MeteorologyPr<strong>of</strong>essor Robert Tuleya performed a review <strong>of</strong> the hurricane windfieldmodel in February 2011. His comments included the following: “I reviewedthe <strong>EQECAT</strong> revised wind field model. The review was composed <strong>of</strong>several presentations by <strong>EQECAT</strong>, review <strong>of</strong> several scientific referencesas well as fruitful discussion between <strong>EQECAT</strong> and myself. This model isa parametric model, which estimates the evolution <strong>of</strong> the inland surfacewind field given the values <strong>of</strong> several parameters describing the low-levelwind field just <strong>of</strong>f shore. The model uses as observed input the stormintensity, radial extent <strong>of</strong> winds and the storm track. It also assumes astandard filling rate as the storm progresses inland. The <strong>EQECAT</strong> modeluses a sophisticated high resolution land use field to diagnose the effect <strong>of</strong>upwind roughness effects accurately. The terrain roughness was shown tohave a dual role <strong>of</strong> reducing the damaging wind field due to frictionalretardation but also to a lesser extent increasing the possible wind effectsby contributing to a larger gust factor with increasing roughness. Thepresentation indicated realistic wind behavior for an incoming stormmaking landfall. The time evolution <strong>of</strong> the <strong>EQECAT</strong> model was quitesimilar to more sophisticated 3-D NWP operational and research models,lending credibility to their model product. <strong>EQECAT</strong> also showedcomparisons and verification to observed surface wind field as well. Themodel has a deviational component to account for statistical variation inresults. This estimate appears to be handled well, with the model for themost part, verifying well compared to observations. Overall, I believe the<strong>EQECAT</strong> revised model should model observed landfall wind evolutionquite well for both individual storms as well as for estimating aclimatological group <strong>of</strong> storms.”2. VulnerabilityDr. Kishor Mehta, Dr. James McDonald, and Dr. C. Allin Cornell performedindependent reviews <strong>of</strong> the vulnerability model in 1995. Pr<strong>of</strong>essor S.38
The <strong>Florida</strong> Commission on Hurricane Loss Projection MethodologyGeneral StandardsNarasimhan performed an independent review <strong>of</strong> the vulnerability model in2013.3. Actuarial ScienceDiscussed in conjunction with Statistics below.4. StatisticsDr. C. Allin Cornell and Dr. Richard Mensing reviewed the overallmethodology and technical approach in 1995. Their comments were asfollows: Cornell - suggested we make the procedure more transparent inorder to facilitate communication and learning by the users - “simple, bruteforce Monte Carlo simulation is about as straight-forward as you can be...but you are doing something smarter and hence more difficult to grasp.”Further suggestions were for a thorough sensitivity study and ideas for thetreatment <strong>of</strong> uncertainty. Mensing - “Overall, I believe the methodologyrepresents a very good approach to a probabilistic analysis <strong>of</strong> thedamages and losses associated with hurricanes.” His suggestions were toreview the treatment <strong>of</strong> uncertainty and verify the adequacy <strong>of</strong> the portfolioinput data. Additional studies were done to address these issues prior tothe release <strong>of</strong> USWIND.Mr. Peter Kelly and Dr. Lixin Zeng <strong>of</strong> Arkwright Mutual InsuranceCompany reviewed all aspects <strong>of</strong> the USWIND model in their paper ‘TheEngineering, Statistical, and Scientific Validity <strong>of</strong> <strong>EQECAT</strong> USWIND<strong>Model</strong>ing S<strong>of</strong>tware’ in 1996. They stated the following in their review:“The validity <strong>of</strong> <strong>EQECAT</strong> USWIND modeling s<strong>of</strong>tware is reviewedfrom several perspectives. Using several external sources forhurricane data, it is found that the storm data set represents thehistorical and expected long term storm patterns well and generallywithout bias. By reviewing storm damage estimates against atheoretical understanding <strong>of</strong> the wind effects on structures as well asactual experience, it was found that the model’s damage estimatesreasonably reflect the physical properties <strong>of</strong> force and damage andthat the system has no systematic bias in its damage estimationlogic.”A copy <strong>of</strong> their review is provided in Appendix #7.39
The <strong>Florida</strong> Commission on Hurricane Loss Projection MethodologyGeneral Standards5. Computer ScienceDr. Gamil Serag Eldin and Dr. Kashif Ali performed independent reviews<strong>of</strong> the computer science aspects <strong>of</strong> the model in 2013.B. Provide documentation <strong>of</strong> independent peer reviews directly relevant to themodeling organization’s responses to the current standards, disclosures, orforms. Identify any unresolved or outstanding issues as a result <strong>of</strong> these reviews.Refer to the Appendix for documentation. There are no unresolved oroutstanding issues resulting from the reviews.C. Describe the nature <strong>of</strong> any on-going or functional relationship the organizationhas with any <strong>of</strong> the persons performing the independent peer reviews.Dr. Cornell has also done a peer review on our USQUAKE model. Dr.Mensing was a full-time employee <strong>of</strong> <strong>EQECAT</strong> for several years andcontinues as a consultant to <strong>EQECAT</strong>, although he was an independentconsultant at the time he performed the review described above. Drs.Cornell and Mensing and Pr<strong>of</strong>essor Tuleya were compensated for theirtime by <strong>EQECAT</strong>.4. Provide a completed Form G-1, General Standards Expert Certification. Provide alink to the location <strong>of</strong> the form here.See Form G-1 at Appendix #1.5. Provide a completed Form G-2, Meteorological Standards Expert Certification.Provide a link to the location <strong>of</strong> the form here.See Form G-2 at Appendix #1.6. Provide a completed Form G-3, Vulnerability Standards Expert Certification.Provide a link to the location <strong>of</strong> the form here.See Form G-3 at Appendix #1.7. Provide a completed Form G-4, Actuarial Standards Expert Certification. Provide alink to the location <strong>of</strong> the form here.See Form G-4 at Appendix #1.8. Provide a completed Form G-5, Statistical Standards Expert Certification. Providea link to the location <strong>of</strong> the form here.See Form G-5 at Appendix #1.40
The <strong>Florida</strong> Commission on Hurricane Loss Projection MethodologyGeneral Standards9. Provide a completed Form G-6, Computer Standards Expert Certification. Providea link to the location <strong>of</strong> the form here.See Form G-6 at Appendix #1.41
The <strong>Florida</strong> Commission on Hurricane Loss Projection MethodologyGeneral StandardsG-3 Risk LocationA. ZIP Codes used in the model shall not differ from the United <strong>State</strong>sPostal Service publication date by more than 24 months at the date <strong>of</strong>submission <strong>of</strong> the model. ZIP Code information shall originate from theUnited <strong>State</strong>s Postal Service.The USWIND ZIP Code database was updated in October 2012, based oninformation originating from the United <strong>State</strong>s Postal Service current as <strong>of</strong>March 2012.B. ZIP Code centroids, when used in the model, shall be based onpopulation data.The ZIP Code centroids used in USWIND are derived using population.DisclosuresC. ZIP Code information purchased by the modeling organization shall beverified by the modeling organization for accuracy and appropriateness.<strong>EQECAT</strong> verifies each new ZIP Code database through a suite <strong>of</strong> procedures,including automated numeric tests and visual tests.1. List the current ZIP Code databases used by the model and the components <strong>of</strong> themodel to which they relate. Provide the effective (<strong>of</strong>ficial United <strong>State</strong>s PostalService) date corresponding to the ZIP Code databases.USWIND uses 5-Digit ZIP Code from MultiNet data. MultiNet is a registeredtrademark <strong>of</strong> TomTom. The ZIP Code data is created using a combination <strong>of</strong>MulitNet data, the United <strong>State</strong>s Postal Service (USPS) ZIP+4 Data File, theUSPS National 5-Digit ZIP Code and Post Office Directory, USPS ZIP+4<strong>State</strong> Directories, and the USPS City <strong>State</strong> File.The ZIP Code data is used in the import component <strong>of</strong> the model.The effective date <strong>of</strong> the ZIP Code data is March 2012.2. Describe in detail how invalid ZIP Codes are handled.Invalid ZIP Codes in input data are generated from many sources, including(a) typographical errors in the insurers’ data, (b) usage <strong>of</strong> mailing addressinstead <strong>of</strong> site address, or (c) usage <strong>of</strong> an out <strong>of</strong> date ZIP Code. TheUSWIND program attempts to locate any invalid sites to the most refined levelpossible, the data quality permitting. At the end <strong>of</strong> the ‘geocoding’ process,USWIND echoes the status <strong>of</strong> the quality <strong>of</strong> the data, indicating how many42
The <strong>Florida</strong> Commission on Hurricane Loss Projection MethodologyGeneral Standardslocations were mapped to the street address level, to ZIP Code centroids, citycentroids, and to county centroids.In addition, if users are uncertain <strong>of</strong> the quality <strong>of</strong> street address information,they can enter latitude and longitude coordinates.The steps in the geocoding process are as follows:1. If the street address is available, the program attempts to geocode thelocation to its exact location, to within approximately 400 feet in mosturban areas.2. If the program was unable to calculate the exact street location, theprogram looks at the site ZIP Code. If the input ZIP Code exactly matchesa ZIP Code in our database, the geocoding stops.3. If the exact ZIP Code was not matched, the program then looks throughthe database <strong>of</strong> ‘point’ ZIP Codes. Point ZIP Codes indicate Post Officeboxes or private entities who desire their own ZIP Code. The location <strong>of</strong>these point ZIP Codes is provided by the US Government. For displayingmaps <strong>of</strong> exposure and losses, these ZIP Codes are also ‘mapped’ toregional ZIP Codes which correspond to the ZIP Code area which thepoint ZIP Code is in.4. If the location is still not found, the program next looks at the city name inthe input data. If the city name was included in the input data, and the cityname is in the USWIND databases, then the location is geocoded to a citycentroid, and the geocoding summary is updated to indicate this.5. If the location is still not found, the program next looks at the county namein the input data. If the county name was included in the input data, andthe county name is in the USWIND databases, then the location isgeocoded to a county centroid, and the geocoding summary is updated toindicate this.6. If the data provided fails these steps then the risk is removed from thedatabase.43
The <strong>Florida</strong> Commission on Hurricane Loss Projection MethodologyGeneral StandardsG-4 Independence <strong>of</strong> <strong>Model</strong> ComponentsThe meteorological, vulnerability, and actuarial components <strong>of</strong> the modelshall each be theoretically sound without compensation for potential biasfrom the other two components.The meteorology, vulnerability, and actuarial components <strong>of</strong> USWIND have beenindependently developed, verified, and validated. The meteorology component,completely independent <strong>of</strong> the other components, calculates wind speed at eachsite.The vulnerability component is entirely independent <strong>of</strong> all other calculations, e.g.meteorological, loss, etc. Validation <strong>of</strong> the vulnerability functions has beenperformed independently from other validation tests, e.g. whenever thevulnerability functions have been validated using claims data from a historicalstorm, the wind field for that storm has first been validated independently. If any<strong>of</strong> the other calculation modules were changed, no changes would be necessaryto the vulnerability functions.The loss distributions are calculated using the damage distribution at each siteand the policy structure. Finally, the site distributions (damage and loss) arecombined statistically to estimate the expected annual loss and the lossexceedance curve for the portfolio. All components together have been validatedand verified to produce reasonable and consistent results.44
The <strong>Florida</strong> Commission on Hurricane Loss Projection MethodologyGeneral StandardsG-5 Editorial ComplianceDisclosureThe submission and any revisions provided to the Commission throughoutthe review process shall be reviewed and edited by a person or personswith experience in reviewing technical documents who shall certify onForm G-7 that the submission has been personally reviewed and iseditorially correct.All documents provided to the Commission by <strong>EQECAT</strong> throughout the reviewprocess have been reviewed and edited by a person or persons with experiencein reviewing technical documents. The document has been personally reviewedto ensure that it is editorially correct. This has been certified on Form G-71. Describe the process used for document control <strong>of</strong> the submission. Describe theprocess used to ensure that the paper and electronic versions <strong>of</strong> specific files areidentical in content.Data in the paper (Word document) version is copied directly from theelectronic versions <strong>of</strong> specific files. In order to ensure consistency, data fromboth the Word document and the electronic files are copied onto a Micros<strong>of</strong>tExcel document for comparison.2. Describe the process used by the signatories on Forms G-1 through G-6 to ensurethat the information contained under each set <strong>of</strong> standards is accurate andcomplete.Each signatory reviews the <strong>EQECAT</strong> responses for each standard and formwithin the relevant set <strong>of</strong> standards, including data, maps, and exhibitsprovided, to ensure that the responses are consistent with the model beingsubmitted and with any relevant <strong>EQECAT</strong> procedures.3. Provide a completed Form G-7, Editorial Certification. Provide a link to thelocation <strong>of</strong> the form here.See Form G-7 at Appendix #1.45
The <strong>Florida</strong> Commission on Hurricane Loss Projection MethodologyMeteorological StandardsMeteorological StandardsM-1 Base Hurricane Storm SetA. Annual frequencies used in both model calibration and model validationshall be based upon the National Hurricane Center HURDAT starting at1900 as <strong>of</strong> August 15, 2011 (or later). Complete additional seasonincrements based on updates to HURDAT approved by the TropicalPrediction Center/National Hurricane Center are acceptablemodifications to these storm sets. Peer reviewed atmospheric scienceliterature can be used to justify modifications to the Base HurricaneStorm Set.The storm set used is the National Hurricane Center HURDAT starting at 1900as <strong>of</strong> May 14, 2012.DisclosuresB. Any trends, weighting or partitioning shall be justified and consistentwith currently accepted scientific literature and statistical techniques.Calibration and validation shall encompass the complete BaseHurricane Storm Set as well as any partitions.No trending, weighting, or partitioning has been performed with respect to theBase Hurricane Storm Set.1. Identify the Base Hurricane Storm Set, the release date, and the time periodincluded to develop and implement landfall and by-passing storm frequencies intothe model.The storm set used is the National Hurricane Center HURDAT starting at1900 as <strong>of</strong> May 14, 2012.2. If the modeling organization has made any modifications to the Base HurricaneStorm Set related to landfall frequency and characteristics, provide justification forsuch modifications.<strong>EQECAT</strong> has not modified the Base Hurricane Storm Set.3. Where the model incorporates short-term or long-term modification <strong>of</strong> the historicaldata leading to differences between modeled climatology and that in the entire BaseHurricane Storm Set, describe how this is incorporated.The model considers only the long term view <strong>of</strong> hurricane frequencies, i.e. itmakes no modification <strong>of</strong> the frequencies implied by the entire BaseHurricane Storm Set.46
The <strong>Florida</strong> Commission on Hurricane Loss Projection MethodologyMeteorological Standards4. Provide a completed Form M-1, Annual Occurrence Rates. Provide a link to thelocation <strong>of</strong> the form here.See Form M-1 at Appendix #2.47
The <strong>Florida</strong> Commission on Hurricane Loss Projection MethodologyMeteorological Standardsthe information in the National Hurricane Center HURDAT starting at 1900as <strong>of</strong> May 14, 2012. All hurricanes in this data set were used.4. Radius <strong>of</strong> Maximum Winds: This is the distance from the geometric center<strong>of</strong> the storm to the region <strong>of</strong> highest winds, typically within the eye wall <strong>of</strong>a well-developed hurricane. This parameter, after landfall location andcentral pressure (storm strength), is the next most critical in terms <strong>of</strong> losssensitivity. It can range from 4 to 69 miles, and is statistically dependenton coastline location and storm strength. The historical data used isinformation contained in NOAA Technical Report NWS 38, updatedthrough the 2004 hurricane season with information from the NationalHurricane Center's Tropical Cyclone Reports and Advisories. Allhurricanes in HURDAT from 1900 through 2004 were used.5. Translational Speed: This is the speed <strong>of</strong> the movement <strong>of</strong> the entirestorm system itself. It is generally responsible for the asymmetry <strong>of</strong> ahurricane’s wind field. It also has an effect on the distance which thehighest winds are carried inland as the time-dependent filling weakens thestorm. This parameter can range from about 4 mph to 50 mph, though thehigh end <strong>of</strong> this range would only apply in the Northeastern / New Englandregion. The parameter is statistically dependent on coastline location andstorm strength, and in <strong>Florida</strong>, averages about 12-14 mph. The historicaldata used is information contained in NOAA Technical Report NWS 38,updated through the 2004 hurricane season with information from theNational Hurricane Center's Tropical Cyclone Reports. All hurricanes inthe Official Hurricane Set were used. All hurricanes in HURDAT from 1900through 2004 were used.6. Filling Rate (inland decay rate): Overland attenuation (filling) is describedby exponential decay <strong>of</strong> the hurricane central pressure deficit (differencebetween the background pressure and the storm central pressure). Thefilling rate is the parameter specifying the rate <strong>of</strong> this exponential decay.The historical data used is the National Hurricane Center HURDATstarting at 1900 as <strong>of</strong> June 1, 2007.7. Pr<strong>of</strong>ile Factor: This is a dimensionless shape parameter that varies thedrop-<strong>of</strong>f <strong>of</strong> winds outward from the hurricane’s eye. Since an individualhurricane’s pr<strong>of</strong>ile may differ from the average, this parameter allows theuser to best fit an actual storm’s pr<strong>of</strong>ile when modeling the specific event.In the probabilistic hurricane database, the pr<strong>of</strong>ile factor is based on thepr<strong>of</strong>ile factors <strong>of</strong> historical storms that have made landfall near the location<strong>of</strong> the probabilistic storm subject to a maximum that is dependent on theradius <strong>of</strong> maximum winds. The historical data used is the NationalHurricane Center Marine Exposure from the Advisory Archives (1963-1967, 1992-2008) and surface windspeed observations.49
The <strong>Florida</strong> Commission on Hurricane Loss Projection MethodologyMeteorological Standards8. Inflow Angle: This is the angle between purely circular (tangential) motionand the actual direction <strong>of</strong> air flowing in towards the center <strong>of</strong> thehurricane. <strong>Model</strong>ing <strong>of</strong> the Inflow Angle is based on Kwon and Cheong(2010).9. The model also considers air density and the Coriolis parameter, amongother variables.2. Describe the dependencies among variables in the windfield component and howthey are represented in the model, including the mathematical dependence <strong>of</strong>modeled windfield as a function <strong>of</strong> distance and direction from the center position.The model considers the radius <strong>of</strong> maximum winds to be dependent oncentral pressure for hurricanes with central pressure < 930 mb.We have analyzed the dependence <strong>of</strong> the radius <strong>of</strong> maximum winds (Rmax)on central pressure (P0) using the empirical data taken from NWS 38 Tables1 and 2. For storms with P0 greater than 930 mb, we have not found anystatistically significant correlation between Rmax and P0. This result isconsistent with the findings <strong>of</strong> NWS 38. Therefore, for storms with P0 greaterthan 930 mb, we use Rmax as a function <strong>of</strong> landfall location only, as given byNWS 38 Figures 37 and 38.For stronger storms with P0 less than 930 mb, we have found a statisticallysignificant correlation between P0 and Rmax. This is consistent with theresults <strong>of</strong> NWS 38. Therefore, below 930 mb, we use a piecewise linearrelationship to model the dependence <strong>of</strong> Rmax on P0. This information isreflected in Form M-2.Also, the pr<strong>of</strong>ile factor is subject to a maximum that is dependent on theradius <strong>of</strong> maximum winds.Within the radius <strong>of</strong> maximum winds, the Inflow Angle is dependent on thedistance from the storm center, and it is a constant at distances greater thanthe radius <strong>of</strong> maximum winds. The modeling <strong>of</strong> the Inflow Angle is based onKwon and Cheong (2010).Aside from these dependencies, all variables in the wind field component <strong>of</strong>the model are considered to be independent.3. Identify whether hurricane parameters are modeled as random variables, asfunctions, or as fixed values for the stochastic storm set. Provide rationale for thechoice <strong>of</strong> parameter representations.The joint probability distribution for landfall location, track direction, andmaximum one-minute sustained wind speed is obtained from a MaximumLikelihood Estimation kernel smoothing technique applied to the historicaldata. Radius to maximum winds and translational speed are modeled using50
The <strong>Florida</strong> Commission on Hurricane Loss Projection MethodologyMeteorological Standardssustained wind speed (higher wind speeds have less uncertainty on the gustfactor). The averaging interval for gust wind speeds is defined as 2 seconds.7. Describe the historical data used as the basis for the model’s hurricane tracks.Discuss the appropriateness <strong>of</strong> the model stochastic hurricane tracks with referenceto the historical storm database.In the probabilistic database, distributions for storm direction varygeographically and are based on smoothed historical data. The historical dataused is the portion <strong>of</strong> the National Hurricane Center HURDAT from 1900through 2001 as <strong>of</strong> June 1, 2003. All hurricanes in HURDAT from 1900through 2001 were used.8. If the historical data are partitioned or modified, describe how the hurricaneparameters are affected.The historical data are not partitioned or modified.9. Describe how the coastline is segmented (or partitioned) in determining theparameters for hurricane frequency used in the model. Provide the hurricanefrequency distribution by intensity for each segment.In the probabilistic analysis, the coast is divided into a series <strong>of</strong> 10 nauticalmile (nmi) segments. The landfall frequency is a smooth curve developedalong the entire coast using an adaptive smoothing procedure on the milepostlocations <strong>of</strong> the historic storm set landfalls. Distributions <strong>of</strong> the other modelingparameters were similarly developed. Frequencies, parameters, anddistributions thus change smoothly from one segment to the next. Forhurricane frequency distributions by intensity and segment, see Form M-1.10. Describe any evolution <strong>of</strong> the functional representation <strong>of</strong> hurricane parametersduring an individual storm life cycle.The <strong>EQECAT</strong> model has no changes in the functional representation <strong>of</strong>hurricane parameters during an individual storm life cycle, although local windspeeds are modified according to frictional effects, <strong>of</strong>ten resulting insubstantial changes in wind speeds over short distances, particularly near thecoast.52
The <strong>Florida</strong> Commission on Hurricane Loss Projection MethodologyMeteorological StandardsM-3 Hurricane ProbabilitiesA. <strong>Model</strong>ed probability distributions <strong>of</strong> hurricane parameters andcharacteristics shall be consistent with historical hurricanes in theAtlantic basin.<strong>Model</strong>ed probability distributions <strong>of</strong> hurricane parameters and characteristicsare consistent with historical hurricanes in the Atlantic basin.B. <strong>Model</strong>ed hurricane landfall frequency distributions shall reflect the BaseHurricane Storm Set used for category 1 to 5 hurricanes and shall beconsistent with those observed for each coastal segment <strong>of</strong> <strong>Florida</strong> andneighboring states (Alabama, Georgia, and Mississippi).<strong>Model</strong>ed hurricane landfall frequency distributions reflect the base hurricanestorm set and are consistent with those observed for each coastal segment <strong>of</strong><strong>Florida</strong> and other states along the Atlantic and Gulf Coasts.C. <strong>Model</strong>s shall use maximum one-minute sustained 10-meter windspeedwhen defining hurricane landfall intensity. This applies both to the BaseHurricane Storm Set used to develop landfall frequency distributions asa function <strong>of</strong> coastal location and to the modeled winds in eachhurricane which causes damage. The associated maximum one-minutesustained 10-meter windspeed shall be within the range <strong>of</strong> windspeeds(in statute miles per hour) categorized by the Saffir-Simpson scale.Saffir-Simpson Hurricane Scale:Category Winds (mph) Damage1 74 - 95 Minimal2 96 - 110 Moderate3 111 - 130 Extensive4 131 - 155 Extreme5 Over 155 CatastrophicUSWIND uses maximum one-minute sustained 10-meter wind speed whendefining hurricane landfall intensity.The USWIND pressure-wind speed relationship generates wind speeds whichare in agreement with the Saffir-Simpson category definition. Wind speedsdeveloped for historical hurricanes are also consistent with the observedvalues53
The <strong>Florida</strong> Commission on Hurricane Loss Projection MethodologyMeteorological StandardsDisclosures1. List assumptions used in creating the hurricane characteristic databases.NOAA Publication NWS-38 covers the period 1900-1984, and was the mainsource for compiling information on hurricane modeling parameters, (radius <strong>of</strong>maximum winds, direction <strong>of</strong> motion, translation speed, etc.) Data for laterstorms (1985-2004) were obtained in specific reports or publications from theNational Hurricane Center (including Tropical Cyclone Reports andAdvisories), analyses from the Hurricane Research Division, or from otherscientifically accepted publications. These publications include Powell, M.D.,D. Bowman, D. Gilhousen, S. Murillo, N. Carrasco, and R. St. Fluer, “TropicalCyclone Winds at Landfall”, Bulletin <strong>of</strong> the American Meteorological Society85(6): 845-851 (2004); Franklin, J.L., M.L. Black, and K. Valde, “GPSdropwindsonde wind pr<strong>of</strong>iles in hurricanes and their operational implications”,Weather and Forecasting, 18(1): 32-44 (2003); and Houston, S.H., and M.D.Powell, “Surface wind fields for <strong>Florida</strong> Bay Hurricanes”, Journal <strong>of</strong> CoastalResearch, 19: 503-513 (2003). Coastline-dependent landfall frequency andseverity distributions for the state <strong>of</strong> <strong>Florida</strong> were developed from the NationalHurricane Center HURDAT starting at 1900 as <strong>of</strong> May 14, 2012.Standard statistical techniques were used to develop the hurricane parameterand frequency distributions. The underlying assumption is that the period1900 through 2011 is representative in terms <strong>of</strong> hurricane climatology in<strong>Florida</strong> and adjacent areas.54
The <strong>Florida</strong> Commission on Hurricane Loss Projection MethodologyMeteorological Standards2. Provide a brief rationale for the probability distributions used for all hurricaneparameters and characteristics.Data sources include the following:Landfall Maximum Sustained Windspeed: the National Hurricane CenterHURDAT starting at 1900 as <strong>of</strong> May 14, 2012 (1900-2011).Radius <strong>of</strong> Maximum Winds: NOAA Technical Report NWS 38 (up to 1984),National Hurricane Center’s Tropical Cyclone Reports and Advisories (1985-2004)Translation Speed: NOAA Technical Report NWS 38 (up to 1984), NationalHurricane Center’s Tropical Cyclone Reports and Advisories (1985-2004)Filling Rate: Developed from HURDAT (1900-2006)Pr<strong>of</strong>ile Factor: National Hurricane Center Marine Exposure from the AdvisoryArchives (1963-1967, 1992-2008) and surface windspeed observationsThe parameter representations have been selected so as to provideagreement with historical data and to extrapolate to the full range <strong>of</strong> potentialvalues, or to provide the best fit to historical data among commonly useddistributions.55
The <strong>Florida</strong> Commission on Hurricane Loss Projection MethodologyMeteorological StandardsM-4 Hurricane Windfield StructureA. Windfields generated by the model shall be consistent with observedhistorical storms affecting <strong>Florida</strong>.Windfields generated by the model are consistent with observed historicalstorms.B. The translation <strong>of</strong> land use and land cover or other source informationinto a surface roughness distribution shall be consistent with currentstate-<strong>of</strong>-the-science and shall be implemented with appropriategeographic information system data.The translation <strong>of</strong> land use and land cover information into a surfaceroughness distribution in the model is consistent with current state-<strong>of</strong>-thescience,and has been implemented with appropriate GIS data.C. With respect to multi-story structures, the model windfield shall accountfor the effects <strong>of</strong> vertical variation <strong>of</strong> winds if not accounted for in thevulnerability functions.The model accounts for vertical variation <strong>of</strong> winds for multi-story structures inthe vulnerability functions.Disclosures1. Provide a rotational windspeed (y-axis) versus radius (x-axis) plot <strong>of</strong> the average ordefault symmetric wind pr<strong>of</strong>ile used in the model and justify the choice <strong>of</strong> this windpr<strong>of</strong>ile.Figure 11 below shows the minimum, mean, and maximum pr<strong>of</strong>iles used in<strong>Florida</strong> in the current submission. The pr<strong>of</strong>iles for the current submission weredeveloped from historical data in <strong>Florida</strong>.56
The <strong>Florida</strong> Commission on Hurricane Loss Projection MethodologyMeteorological StandardsWind Pr<strong>of</strong>ile for Average <strong>Florida</strong> Hurricane120Maximum Winds= 105 mphRadius <strong>of</strong> Maximum Winds = 20 miles10080MaximumPr<strong>of</strong>ile = 2.44Speed (mph)60MaximumMeanPr<strong>of</strong>ile = 1.1640MinimumPr<strong>of</strong>ile = 0.3820Minimum00 50 100 150 200 250 300 350 400Distance (miles)Figure 11. Wind Pr<strong>of</strong>ile for Average <strong>Florida</strong> Hurricane.2. If the model windfield has been modified in any way from the previous submission,provide a rotational windspeed (y-axis) versus radius (x-axis) plot <strong>of</strong> the average ordefault symmetric wind pr<strong>of</strong>ile for both the new and old functions. The choice <strong>of</strong>average or default shall be consistent for the new and old functions.The current model windfield storm radial wind pr<strong>of</strong>ile has not been modifiedfrom the previous submission, and is plotted in Figure 11.3. If the model windfield has been modified in any way from the previous submission,describe variations between the new and old windfield functions with reference tohistorical storms.The model windfield methodology has not been updated from the previoussubmission. The time-stepping interval has been reduced from 15 minutes to5 minutes.4. Describe how the vertical variation <strong>of</strong> winds is accounted for in the model whereapplicable. Document and justify any difference in the methodology for treatinghistorical and stochastic storm sets.The model accounts for vertical variation <strong>of</strong> winds for multi-story structures inthe vulnerability functions.57
The <strong>Florida</strong> Commission on Hurricane Loss Projection MethodologyMeteorological Standards5. Describe the relevance <strong>of</strong> the formulation <strong>of</strong> gust factor(s) used in the model.USWIND converts one-minute sustained 10-meter wind speeds to peak gust10-meter wind speeds using a gust factor function that takes surface frictionfrom land use and land cover into account (rougher terrain has a higher gustfactor). The uncertainty on the gust factor depends on the input one-minutesustained wind speed (higher wind speeds have less uncertainty on the gustfactor). The gust factor is based on information in Krayer and Marshall, 1992:Gust factors applied to hurricane winds, Bulletin <strong>of</strong> the AmericanMeteorological Society, Volume 73, pp. 613-617, and other scientificallyaccepted studies.As discussed in the vulnerability standards, the <strong>EQECAT</strong> model uses peakgust wind speed because damage is believed to be better correlated withpeak gusts than with long-term sustained wind speeds.6. Identify all non-meteorological variables that affect the windspeed estimation (e.g.,surface roughness, topography, etc.)Surface roughness, as determined by land use and land cover data, affectsthe local wind speeds in the model.7. Provide the collection and publication dates <strong>of</strong> the land use and land cover data usedin the model and justify their timeliness for <strong>Florida</strong>.In <strong>Florida</strong>, USWIND uses land use and land cover data provided in theNational Land Cover Database 2001 (NLCD 2001). The collection dates forthese data vary between 1999 and 2003. Initial publication dates for <strong>Florida</strong>vary between 2003 and 2006. The database was completed for theconterminous United <strong>State</strong>s and published in April 2007. Additionally, severalland use classes from the <strong>Florida</strong> Water Management District (FWMD 2004-2008) were used to augment the NLCD data.8. Describe the methodology used to convert land use and land cover information intoa spatial distribution <strong>of</strong> roughness coefficients in <strong>Florida</strong> and adjacent states.A roughness length is assigned to each land use / land cover category in thedata provided in the National Land Cover Database 2001 (NLCD 2001),based on recent meteorological references. These values are then spatiallyaveraged into 16 directional effective roughness lengths using currentlyaccepted methods. Each <strong>of</strong> the 16 values is then converted to a frictionalwind-reduction factor using standard, scientifically accepted boundary layersimilarity theory.9. Demonstrate the consistency <strong>of</strong> the spatial distribution <strong>of</strong> model-generated windswith observed windfields for hurricanes affecting <strong>Florida</strong>.58
The <strong>Florida</strong> Commission on Hurricane Loss Projection MethodologyMeteorological Standards<strong>EQECAT</strong> regularly reviews modeled versus observed hurricane wind fields.Figure 12 below is a comparison <strong>of</strong> modeled (shading) and observed(numbers) surface winds in mph gust for Hurricane Wilma (2005).Figure 12. Wind field for Hurricane Wilma (2005)10. Describe how the model’s windfield is consistent with the inherent differences inwindfields for such diverse hurricanes as Hurricane Charley (2004), HurricaneJeanne (2004), and Hurricane Wilma (2005).The parameters used to define a hurricane in the <strong>EQECAT</strong> wind field modelprovide enough control to capture a wide variety <strong>of</strong> storm characteristics.Obvious features such as the landfall location, storm track, and intensity <strong>of</strong>the storm in terms <strong>of</strong> one-minute sustained winds are included, and furtherdefinition <strong>of</strong> the event is provided by the radius to maximum winds and pr<strong>of</strong>ilefactor to describe the ‘width’ <strong>of</strong> the storm, and by the translational speed todescribe the asymmetry between the right and left sides <strong>of</strong> the storm. All <strong>of</strong>these parameters can vary widely from event to event including HurricanesCharley (2004), Jeanne (2004), and Wilma (2005).59
The <strong>Florida</strong> Commission on Hurricane Loss Projection MethodologyMeteorological Standards11. Describe any variations in the treatment <strong>of</strong> the model windfield for stochastic versushistorical storms and justify this variation.The treatment <strong>of</strong> the model windfield for stochastic and historical storms is thesame, except that for historical hurricanes the storm intensity is fixed everysix hours with the observed storm intensities (using HURDAT). Specifically,the decay rate is a regionally-dependent parameter for stochastic hurricanes,whereas for historical hurricanes a decay rate is fitted for each six-hourlytrack segment and used to interpolate the intensity between the six-hourlyobservations.12. Provide a completed Form M-2, Maps <strong>of</strong> Maximum Winds. Explain the differencesbetween the spatial distributions <strong>of</strong> maximum winds for open terrain and actualterrain for historical storms. Provide a link to the location <strong>of</strong> the form here.See Form M-2 at Appendix #2.The current model includes the treatment <strong>of</strong> the time evolution <strong>of</strong> thewindfield, the directional impact <strong>of</strong> upwind surface roughness conditions, andthe inflow angle. These features provide a refined modeling <strong>of</strong> local effects,especially along complex coastlines and coastal waterways such as bays andestuaries, and for improved modeling <strong>of</strong> transitions from one land use / landcover category to another.The spatial distribution <strong>of</strong> maximum winds for historic hurricanes show thegeneral characteristic <strong>of</strong> lower winds near the coast, as well as lower windsinland when the actual local terrain conditions are used relative to a uniformlysmooth "open terrain". Some notable differences well inland can also beseen, where lower winds occur when rougher terrain is taken into account(e.g., metro-Orlando, Panhandle forested areas) compared with using onlyopen terrain.60
The <strong>Florida</strong> Commission on Hurricane Loss Projection MethodologyMeteorological StandardsM-5 Landfall and Over-Land Weakening MethodologiesA. The hurricane over-land weakening rate methodology used by themodel shall be consistent with the historical records and with currentstate-<strong>of</strong>-the-science.The hurricane over-land weakening rate methodology used by USWIND forhurricanes in <strong>Florida</strong> is based on and consistent with historical records andthe current state-<strong>of</strong>-the-science.B. The transition <strong>of</strong> winds from over-water to over-land within the modelshall be consistent with current state <strong>of</strong> the science.USWIND uses land friction to produce a reduction <strong>of</strong> the marine (overwater)wind speeds when moving over land which is consistent with the acceptedscientific literature and with geographic surface roughness. The directionallyaveraged surface roughness friction factors produce a smooth transition <strong>of</strong>windspeeds from over-water to over-land exposure.Disclosures1. Describe and justify the functional form <strong>of</strong> hurricane decay rates used by the model.Overland attenuation (filling) is handled by exponential decay formulas fit tohistorical data. The basic form <strong>of</strong> this equation is:DP(t) = DP(0) exp [ -mu * t ]where DP(0) is the hurricane central pressure deficit (difference in theambient pressure <strong>of</strong> 1013 mb and the storm central pressure) at landfall; t isthe time after landfall; and mu is the decay rate parameter. The formulaestimates the pressure deficit at any time t after landfall. The decayparameter, mu, is a function <strong>of</strong> the initial pressure deficit, derived fromhistorical data using methodology consistent with Vickery and Twisdale(1995).2. Provide a graphical representation <strong>of</strong> the modeled decay rates for <strong>Florida</strong>hurricanes over time compared to wind observations.The decay rates for two <strong>Florida</strong> hurricanes are shown in Figures 13 and 14.61
The <strong>Florida</strong> Commission on Hurricane Loss Projection MethodologyMeteorological StandardsHurricane Opal (1995)140120<strong>Model</strong>edObservedMaximum Sustained Windspeed (mph)1008060402000 5 10 15 20Time After Landfall (hours)Figure 13. Hurricane Opal (1995)Hurricane Frances (2004)120100<strong>Model</strong>edObservedMaximum Sustained Windspeed (mph)8060402000 5 10 15 20 25Time After Landfall (hours)Figure 14. Hurricane Frances (2004)62
The <strong>Florida</strong> Commission on Hurricane Loss Projection MethodologyMeteorological Standards3. Describe the transition from over-water to over-land boundary layer simulated inthe model.The model uses current scientifically accepted boundary layer methods toconvert a marine surface (10-meter 1-minute) windfield to one whichincorporates local land friction when over land. The friction factors weredeveloped by weighting and averaging surface roughness within 20 km <strong>of</strong> alocation and within a given directional sector. Application <strong>of</strong> these directionalfriction factors produces a smooth transition <strong>of</strong> windspeeds from over-water toover-land exposure.4. Describe any changes in hurricane parameters, other than intensity, resulting fromthe transition from over-water to over-land.There are no changes in hurricane parameters when a storm moves fromover-water to over-land, other than its intensity via the filling rate.5. Describe the representation in the model <strong>of</strong> the passage over non-continental U.S.land masses on hurricanes affecting <strong>Florida</strong>.Intensities for stochastic storms are based on the statistical analyses <strong>of</strong>historical storms by location. An historical storm crossing over a noncontinentalU.S. land mass (such as Cuba) would have an impact on thestorm’s intensity. This intensity would then have an impact on the intensities<strong>of</strong> the stochastic storm set. The final intensity upon reaching <strong>Florida</strong>,however, has already been accounted for in the coastline-dependent intensitydistribution.6. Document any differences between the treatment <strong>of</strong> decay rates in the model forstochastic hurricanes compared to historical hurricanes affecting <strong>Florida</strong>.The treatment <strong>of</strong> decay rates for stochastic and historical hurricanes in the<strong>EQECAT</strong> model is the same, except that for historical hurricanes the stormintensity is fixed every six hours with the observed storm intensities (usingHURDAT). Specifically, the decay rate is a regionally-dependent parameterfor stochastic hurricanes, whereas for historical hurricanes a decay rate isfitted for each six-hourly track segment and used to interpolate the intensitybetween the six-hourly observations.63
The <strong>Florida</strong> Commission on Hurricane Loss Projection MethodologyMeteorological StandardsM-6 Logical Relationships <strong>of</strong> Hurricane CharacteristicsA. The magnitude <strong>of</strong> asymmetry shall increase as the translation speedincreases, all other factors held constant.The magnitude <strong>of</strong> asymmetry in USWIND increases as the translation speedincreases, all other factors held constant.B. The mean wind speed shall decrease with increasing surface roughness(friction), all other factors held constant.The mean wind speed in USWIND decreases with increasing surface roughness(friction), all other factors held constant.Disclosure1. Describe how the asymmetric structure <strong>of</strong> hurricanes is represented in the model.The asymmetric nature <strong>of</strong> hurricanes is modeled using an Asymmetry Term,which is a function <strong>of</strong> the translational speed <strong>of</strong> the storm, as well as the anglebetween a given location within the windfield and the storm’s direction <strong>of</strong>motion.Starting with a stationary marine windfield, the term will generally add towindspeeds on the right side <strong>of</strong> the storm (when looking in the direction <strong>of</strong>storm motion), and subtract from windspeeds on the left. This asymmetry <strong>of</strong>the overall windfield will become stronger as the translational speed <strong>of</strong> thestorm increases.2. Provide a completed Form M-3, Radius <strong>of</strong> Maximum Winds and Radii <strong>of</strong> StandardWind Thresholds. Provide a link to the location <strong>of</strong> the form here.See Form M-3 at Appendix #2.3. Discuss the radii values for each wind threshold in Form M-3 with reference toavailable hurricane observations.The radii values for each wind threshold in Form M-3 are consistent withavailable hurricane observations.64
The <strong>Florida</strong> Commission on Hurricane Loss Projection MethodologyVulnerability StandardsVulnerability StandardsV-1 Derivation <strong>of</strong> Vulnerability FunctionsA. Development <strong>of</strong> the vulnerability functions is to be based on acombination <strong>of</strong> the following: (1) historical data, (2) tests, (3) structuralcalculations, (4) expert opinion, or (5) site inspections. However, anydevelopment <strong>of</strong> the vulnerability functions based on structuralcalculations or expert opinion shall be supported by tests, siteinspections, and historical data.USWIND vulnerability functions are based on historically observed damage (interms <strong>of</strong> both claims data and post-hurricane field surveys), experimentalresearch conducted by Pr<strong>of</strong>essors Kishor Mehta and James McDonald at TexasTech, and structural calculations performed by EQE / <strong>EQECAT</strong> engineers.The claims data analyzed are from two basic sources: (1) claims data from allmajor storms during the period 1954 - 1994 analyzed by Dr. Don Friedman andJohn Mangano while managing the Natural Hazard Research Service (NHRS)effort for The Travelers Insurance Company; and (2) claims data from HurricanesAlicia (1983), Elena (1985), Gloria (1985), Juan (1985), Kate (1985), Hugo(1989), Bob (1991), Andrew (1992), Iniki (1992), Erin (1995), Opal (1995), Rita(2005), Ike (2008) and Gustav (2008) provided to <strong>EQECAT</strong> by the insurancecompanies assisting with the development <strong>of</strong> USWIND.In addition, <strong>EQECAT</strong> has analyzed claims data from Hurricanes Charley (2004),Frances (2004), Ivan (2004), Jeanne (2004), Katrina (2005), Rita (2005), andWilma (2005); this analysis resulted in an update to the mobile home vulnerabilityin <strong>Florida</strong> in June 2008 (first included in USWIND Version 5.13 /WORLDCATenterprise Version 3.11), but it has not resulted in any other updatesto the vulnerability functions in <strong>Florida</strong>.EQE / <strong>EQECAT</strong> teams have conducted post-disaster field surveys for severalstorms in the past few years, including Hurricanes Andrew (1992), Iniki (1992),Luis (1995), Marilyn (1995), Opal (1995), Georges (1998), Irene (1999), Lili(2002), Fabian (2003), Isabel (2003), Charley (2004), Frances (2004), Ivan(2004), Jeanne (2004), Katrina (2005), Rita (2005), and Ike (2008); TyphoonPaka (1997); and the Oklahoma City (1999), Fort Worth (2000), and Midwest(2003) tornado outbreaks. In addition, the research <strong>of</strong> Pr<strong>of</strong>essors Mehta andMcDonald incorporates a large amount <strong>of</strong> investigation into the effects <strong>of</strong> allmajor storms over a 25 year period.65
The <strong>Florida</strong> Commission on Hurricane Loss Projection MethodologyVulnerability StandardsB. The method <strong>of</strong> derivation <strong>of</strong> the vulnerability functions and theirassociated uncertainties shall be theoretically sound and consistentwith fundamental engineering principles.The method <strong>of</strong> derivation <strong>of</strong> the USWIND vulnerability functions andassociated uncertainties is theoretically sound and consistent withfundamental engineering principles.C. Residential building stock classification shall be representative <strong>of</strong><strong>Florida</strong> construction for personal and commercial residential properties.Residential building stock classification <strong>of</strong> the USWIND model isrepresentative <strong>of</strong> <strong>Florida</strong> construction for personal and commercial residentialproperties.D. Building height/number <strong>of</strong> stories, primary construction material, year<strong>of</strong> construction, location, and other construction characteristics, asapplicable, shall be used in the derivation and application <strong>of</strong>vulnerability functions.USWIND allows a user to account for the unique features <strong>of</strong> individualbuildings, including building height/number <strong>of</strong> stories, primary constructionmaterial, year <strong>of</strong> construction, location, and other construction characteristics.Such features modify the vulnerability functions.E. Vulnerability functions shall be separately derived for commercialresidential building structures, personal residential structures, mobilehomes, appurtenant structures, contents, and time element coverages.The USWIND vulnerability functions separately compute damages forcommercial residential building structures, personal residential structures,mobile homes, appurtenant structures, contents, and time element coverages.For each structure type, the vulnerability functions for appurtenant structuresare the same as for the building. However, the model does allow for thebuilding and appurtenant structure to be assigned different structure types.F. For each structure type, the vulnerability functions for appurtenantstructures are the same as for the building. However, the model doesallow for the building and appurtenant structure to be assigned differentstructure types.The minimum wind speed that generates damage shallbe consistent with fundamental engineering principles.The USWIND vulnerability functions calculate damage for all peak gust windspeeds greater than or equal to 40 miles per hour.G. Vulnerability functions shall include damage as attributable towindspeed and wind pressure, water infiltration, and missile impact66
The <strong>Florida</strong> Commission on Hurricane Loss Projection MethodologyVulnerability StandardsDisclosuresassociated with hurricanes. Vulnerability functions shall not includeexplicit damage to the structure due to flood, storm surge, or waveaction.The USWIND vulnerability functions include damage due to hurricane hazardssuch as windspeed and wind pressure, water infiltration, and missile impact.The USWIND vulnerability functions do not include explicit damage due t<strong>of</strong>lood, storm surge, or wave action.1. Provide a flow chart documenting the process by which the vulnerability functionsare derived and implemented.Figure 15 and 16 summarize the process by which <strong>EQECAT</strong> develops itsvulnerability functions. Abbreviations used in this figure are:B: Building, C: Contents, T: Time Element, and WS: Windspeed67
The <strong>Florida</strong> Commission on Hurricane Loss Projection MethodologyVulnerability StandardsFigure 15. Flowchart – Building and Contents Vulnerability DevelopmentFigure 16. Flowchart – Time Element Vulnerability Development2. Describe the nature and extent <strong>of</strong> actual insurance claims data used to develop themodel’s vulnerability functions. Describe in detail what is included, such as,number <strong>of</strong> policies, number <strong>of</strong> insurers, date <strong>of</strong> loss, and number <strong>of</strong> units <strong>of</strong> dollarexposure, separated into personal residential, commercial residential, and mobilehome.The primary set <strong>of</strong> claims data used to develop the vulnerability functionscontains over 13 million policies from 6 insurers, with a total exposure <strong>of</strong>about $2.2 trillion and a total insured loss <strong>of</strong> about $10 billion. By far themajority <strong>of</strong> this data is from personal lines, but about 120,000 <strong>of</strong> the policiesare from commercial residential lines, and about 125,000 <strong>of</strong> the policies arefrom mobile homes. The corresponding exposures are about $73 billion forcommercial residential lines and about $8 billion for mobile homes. The dataset includes claims from 18 hurricanes since 1983. The commercialresidential data is from all eight 2004 and 2005 storms that affected <strong>Florida</strong>.In addition, the <strong>EQECAT</strong> vulnerability functions are based on a large body <strong>of</strong>claims data from the Natural Hazard Research Service (NHRS), covering allmajor storms during the period 1954 – 1994.68
The <strong>Florida</strong> Commission on Hurricane Loss Projection MethodologyVulnerability Standards3. Provide support for the development <strong>of</strong> the vulnerability functions.Vulnerability functions were first developed in 1994, and have undergone aseries <strong>of</strong> updates since then. Supporting documents and claims data areavailable in the <strong>of</strong>fice.4. Summarize site inspections, including the source, and provide a brief description <strong>of</strong>the resulting use <strong>of</strong> these data in development, validation, or verification <strong>of</strong>vulnerability functions.Site inspections for storms prior to 2004 are summarized in the <strong>EQECAT</strong>document ‘Secondary Structural Modifiers: Features and <strong>Model</strong> Description’,Rev. 1, 2008. The primary use <strong>of</strong> these site inspections was to calibrate andvalidate the secondary structural module <strong>of</strong> the s<strong>of</strong>tware. ABSConsulting/<strong>EQECAT</strong> engineers also performed site inspections afterHurricanes Charley, Frances, Ivan, and Jeanne in 2004; Hurricane Katrina in2005; and Hurricane Ike in 2008.Following major windstorms, ABS Consulting/<strong>EQECAT</strong> engineers conductreconnaissance field surveys <strong>of</strong> the affected areas to collect data. Thisinformation enables us to verify that the overall building performance <strong>of</strong>different structures matches the damage functions in our model. In addition,these events <strong>of</strong>fer us the unique opportunity to gather evidence on failuremodes <strong>of</strong> secondary features, which allows us to constantly enhance themitigation measures component <strong>of</strong> the model.5. Describe research used in the development <strong>of</strong> the model’s vulnerability functions,including any unknown construction classification utilized.Claims data from all major storms during the period 1954 – 1994 analyzed byDr. Friedman and John Mangano while managing the Natural HazardResearch Service (NHRS) effort for the Travelers Insurance Company.Research conducted by Pr<strong>of</strong>essors Mehta and McDonald at Texas Tech overa 25-year period by investigating damage in all major hurricanes andtornadoes. Investigations by EQE / <strong>EQECAT</strong> <strong>of</strong> Hurricanes Andrew, Iniki,Luis, Marilyn, Opal, Charley, Frances, Ivan, Jeanne, Katrina, Rita, Ike andGustav; and Typhoon Paka (investigations <strong>of</strong> Typhoon Paka and the 2004and 2005 hurricanes were used to validate rather than modify the vulnerabilityfunctions). Analysis <strong>of</strong> claims from Hurricanes Alicia, Elena, Gloria, Juan,Kate, Hugo, Bob, Andrew, Iniki, Erin, Opal, Charley, Frances, Ivan, Jeanne,Katrina, Rita, and Wilma provided by companies assisting with thedevelopment <strong>of</strong> USWIND. In addition, <strong>EQECAT</strong> has analyzed claims datafrom Hurricanes Charley (2004), Frances (2004), Ivan (2004), Jeanne (2004),Katrina (2005), and Wilma (2005); this analysis has resulted in an update tothe mobile home vulnerability in <strong>Florida</strong>, but it has not resulted in any otherupdates to the vulnerability functions in <strong>Florida</strong>.69
The <strong>Florida</strong> Commission on Hurricane Loss Projection MethodologyVulnerability StandardsDefault structure types were developed for Unknown structure types in<strong>Florida</strong>. These Default structures are composite structures defined by the TIVweighted average <strong>of</strong> the different structures composing the <strong>Florida</strong> HurricaneCat Fund portfolio.6. Describe the number <strong>of</strong> categories <strong>of</strong> the different vulnerability functions.Specifically, include descriptions <strong>of</strong> the structure types and characteristics, buildingheight, year <strong>of</strong> construction, and coverages in which a unique vulnerability functionis used. Provide the total number <strong>of</strong> vulnerability functions available for use in themodel for personal and commercial residential classifications.USWIND uses a total <strong>of</strong> 96 basic construction types, covering alloccupancies. Twenty-one are low-rise residential types, applicable to buildingheights from one to three stories, and nine are mid/high-rise commercialtypes, applicable to building heights <strong>of</strong> four or more stories, with distinctvulnerability functions for each structure type applicable to building heightsfrom four to seven stories (mid-rise) and more than seven stories (high-rise).They are characterized by four parameters: occupancy, number <strong>of</strong> stories,structural system, and exterior cladding strength. USWIND uses occupanciesrather than line <strong>of</strong> business, because empirical evidence has shown that theformer is more relevant to building performance. USWIND has distinctvulnerability functions for structure and contents, and describes time elementlosses as a function <strong>of</strong> direct damage and detailed occupancy type.The year <strong>of</strong> construction is a primary structural characteristic that is used inconjunction with the construction type and location to define a series <strong>of</strong>default secondary structural characteristics.For low-rise residential structures, the 21 structure types are as follows:10 residential ISO classes plus one curve for average residential ISO: ISO Residential Class 1:Frame ISO Residential Class 2:Joisted Masonry ISO Residential Class 3:Non-combustible ISO Residential Class 4:Masonry Non-combustible ISO Residential Class 5:Modified Fire-resistive ISO Residential Class 6:Fire-resistive ISO Residential Class 7:Heavy Timber Joisted Masonry ISO Residential Class 8:Super Non-combustible ISO Residential Class 9:Super Masonry Non-combustible ISO Residential Average9 engineering classifications: Residential, Low-Rise, Reinforced-Masonry, Strong-Cladding Residential, Low-Rise, Reinforced-Masonry, Weak-Cladding Residential, Low-Rise, Reinforced-Masonry, Average-Cladding70
The <strong>Florida</strong> Commission on Hurricane Loss Projection MethodologyVulnerability StandardsResidential, Low-Rise, Timber, Strong-CladdingResidential, Low-Rise, Timber, Weak-CladdingResidential, Low-Rise, Timber, Average-CladdingResidential, Low-Rise, Unreinforced-Masonry, Strong-CladdingResidential, Low-Rise, Unreinforced-Masonry, Weak-CladdingResidential, Low-Rise, Unreinforced-Masonry, Average-Cladding2 mobile home curves:Residential, Low-Rise, Mobile Home - Tied DownResidential, Low-Rise, Mobile Home - Not Tied DownFor mid/high-rise structures, the 9 structure types are as follows:Mid/High-rise, Concrete, Strong-CladdingMid/High-rise, Concrete, Weak-CladdingMid/High-rise, Concrete, Average-CladdingMid/High-rise, Heavy-Steel, Strong-CladdingMid/High-rise, Heavy-Steel, Weak-CladdingMid/High-rise, Heavy-Steel, Average-CladdingMid/High-rise, Reinforced-Masonry, Strong-CladdingMid/High-rise, Reinforced-Masonry, Weak-CladdingMid/High-rise, Reinforced-Masonry, Average-CladdingFor mid/high-rise structure types, the number <strong>of</strong> stories is additionally used toselect either a mid-rise (4 to 7 stories) or high-rise (8 or more stories)vulnerability function.7. Describe the process by which local construction and building code criteria areconsidered in the model.Features pertaining to local construction and building code criteria areidentified as secondary structural features in the model and can be selectedby the users.8. Describe the development <strong>of</strong> the vulnerability functions for appurtenant structures,contents, and time element.Claims data from the appurtenant structures are combined with thecorresponding building claims to generate the building coverage vulnerabilityfunctions. The development <strong>of</strong> the building vulnerability functions is doneaccording to the algorithm in Figure 15.Contents vulnerability functions are also derived according to the process inFigure 15.71
The <strong>Florida</strong> Commission on Hurricane Loss Projection MethodologyVulnerability StandardsThe development <strong>of</strong> the time element vulnerability functions follows a slightlydifferent process as presented in the flow chart <strong>of</strong> Figure 16.9. Describe the relationship between building structure and appurtenant structurevulnerability functions.Appurtenant structures and building structures share the same vulnerabilityfunctions which are derived from the combined claims data <strong>of</strong> bothcoverages.10. Identify the assumptions used to develop vulnerability functions for unknownresidential construction types.Unknown structure types in <strong>Florida</strong> are modeled by the Default vulnerabilityfunctions which are defined by the TIV weighted average <strong>of</strong> the differentstructures composing the <strong>Florida</strong> Hurricane Cat Fund portfolio.11. Identify the assumptions used to develop vulnerability functions for commercialresidential construction types.The assumptions used to develop vulnerability functions for commercialresidential construction types are integrated in the following vulnerabilityfunction generation steps keeping in mind that commercial residentialpolicies cover condos, and apartment buildings with their specific building,contents and time element coverage and coinsurance parameters.The claims data includes the insurance coverage details pertaining to eachpolicy as well as the paid claims per coverage. All fields in the claims needto be defined by the insurance companies as well as their claim paymentpractices so that proper interpretation <strong>of</strong> claims is done to ensure accuraterepresentation <strong>of</strong> vulnerabilities. The fundamental assumption in using thevulnerability functions derived from claims data is that USWIND will estimatefuture hurricane damage according to the payment model observed in thehistorical claims analyzed.The standard vulnerability function generation steps are:1. Review claims data to identify potential errors and ensure consistency <strong>of</strong>data through logic checks, and to correct errors through interactions withthe insurance companies that provided the data. All fields included in theclaims data need to be clearly defined by the claims providers and whatprecisely is included in the reported loss. No assumptions are made onthe data contained in the claims and any ambiguity in the data is eitherreconciled after consultation and concurrence with insurance companiesor discarded from analysis.72
The <strong>Florida</strong> Commission on Hurricane Loss Projection MethodologyVulnerability Standards2. Group the data into appropriate construction classes for all commercialresidential claims. Ensure consistency between definitions <strong>of</strong> differentinsurers. This includes incorporating consideration <strong>of</strong> the relevantunderwriting practices <strong>of</strong> the different insurance companies that providedthe data.3. Correct insured values to include under-insurance, if any. This process isdone by consulting with the insurance company that provided the data.4. Calculate ground-up loss for each coverage, using the paid claim amountand the deductible. For blanket policies, the prorated share <strong>of</strong> deductibleper coverage is added to the corresponding coverage paid claim.5. Apply corrections to account for unreported data, e.g. damage below thedeductible. This correction is generally negligible for policies with lowdeductibles.6. Associate a wind speed to each location using the best available <strong>of</strong>ficialhistorical information.7. Perform regression analysis to derive the vulnerability functions byconstruction class for building coverage and for contents coverageseparately. This process may involve merging the new data set withpreviously analyzed claims. The building and contents vulnerabilityfunctions express the mean damage as a function <strong>of</strong> peak gust windspeed. Along with the mean, a coefficient <strong>of</strong> variation (COV) is alsoderived as a function <strong>of</strong> peak gust wind speed for each construction classand for each <strong>of</strong> the building and contents coverage. This step mayinvolve merging the new data set with previously analyzed claims.8. Perform regression analysis to derive the vulnerability functions for timeelement by regressing the maximum <strong>of</strong> either building or contentsdamage ratios, calculated from the claims, with the time element claimsdamage ratio for the commercial residential occupancy.9. Validate vulnerability curves by comparing modeled losses with actuallosses.12. Describe any assumptions included in vulnerability function development andvalidation concerning insurance company claim payment practices including theeffects <strong>of</strong> contractual obligations on the claim payment process.As discussed in Disclosure 11, all fields in the claims data and details on theclaim payment practices need to be clearly defined prior to processing <strong>of</strong> theclaims data for the generation <strong>of</strong> the vulnerability functions.73
The <strong>Florida</strong> Commission on Hurricane Loss Projection MethodologyVulnerability StandardsClaims payment practices were reviewed through consultations with claimsprovider and their available documents.13. Demonstrate that vulnerability function relationships by type <strong>of</strong> coverage(structures, appurtenant structures, contents, time element) are consistent withactual insurance data.As indicated in Figures 15 and 16, vulnerability functions are developedthrough statistical regression <strong>of</strong> the claims data. The regression analyzes bycoverage performed for the combined structures and appurtenant structures,contents and time element, ensure that the vulnerability functions areconsistent with actual insurance data. The last step <strong>of</strong> the vulnerabilityfunctions development is performed to validate the vulnerability functions bycoverage and includes a Goodness <strong>of</strong> Fit test.The demonstration <strong>of</strong> the consistency <strong>of</strong> vulnerability functions with actualclaims data contains proprietary information. As such this demonstration willbe done during the Pr<strong>of</strong>essional Team on-site visit using slides alreadypresented during prior visits. The demonstration includes comparisonbetween USWIND vulnerability functions by coverage and the correspondingclaims derived vulnerabilities. Goodness <strong>of</strong> fit tests results will also bepresented.14. Demonstrate that vulnerability function relationships by construction type areconsistent with actual insurance data.Similarly, the regression analyzes by construction/structure type ensure thatthe vulnerability functions are consistent with actual insurance data. Thevalidation includes a Goodness <strong>of</strong> Fit test.This demonstration contains proprietary information and will be answeredduring the Pr<strong>of</strong>essional Team on-site visit.15. Identify the one-minute average sustained wind speed at which the model begins toestimate damage.The model begins estimating damage at a peak gust wind speed <strong>of</strong> 40 mph. Anequivalent one-minute average wind speed can be estimated, but will varydepending on terrain conditions and elevation. For open terrain and an elevation<strong>of</strong> 10 meters, 40 mph peak gusts equate approximately with a one-minuteaverage wind speed <strong>of</strong> 35 mph. At other elevations and on different terrain, theone-minute average may be significantly different from this amount. For detailon this issue, the reader is referred to Simiu and Scanlan, 1996, Wind Effectson Structures, 3rd ed., John Wiley and Sons, New York, section 2.3.6. Note thatUSWIND uses peak gust wind speed because damage is believed to be bettercorrelated with peak gusts than with long-term sustained wind speeds. This74
The <strong>Florida</strong> Commission on Hurricane Loss Projection MethodologyVulnerability Standardsapproach is consistent with standard structural design philosophy: one designsfor extreme, or peak, conditions, such as the momentary resting <strong>of</strong> a heavypiece <strong>of</strong> equipment on an inadequately strong patch <strong>of</strong> ro<strong>of</strong>. It is the load at thatmoment that causes the equipment to punch through the ro<strong>of</strong>, not the loadaveraged over the previous minute.Ted Fujita, <strong>of</strong> the University <strong>of</strong> Chicago, also pointed out (following HurricanesAndrew and Iniki) that the gusts should be more important than the sustainedwind when considering damage production. In his concluding remarks in ananalysis <strong>of</strong> a videotape <strong>of</strong> a ro<strong>of</strong> being blown from a house during HurricaneIniki, he states: "It is important to realize that the ro<strong>of</strong> can be blown away by 1to 2 sec winds rather than a sustained wind" (Storm Data, Sept. 1992, Vol.34, page 27).16. Describe how the duration <strong>of</strong> wind speeds at a particular location over the life <strong>of</strong> ahurricane is considered.The duration <strong>of</strong> wind speeds is not explicitly considered in the model,although duration effects are included in the claims data used to develop thevulnerability functions.17. Provide a completed Form V-1, One Hypothetical Event. Provide a link to thelocation <strong>of</strong> the form here.Please see Form V-1 at Appendix #3.75
The <strong>Florida</strong> Commission on Hurricane Loss Projection MethodologyVulnerability StandardsV-2 Derivation <strong>of</strong> Contents and Time Element VulnerabilityFunctionsA. The relationship between the modeled structure and contentsvulnerability functions and historical structure and contents lossesshall be reasonable.<strong>EQECAT</strong>’s has separate vulnerability functions for contents. Contentvulnerability curves in USWIND are based on claims data.B. Time element vulnerability function derivations shall consider theestimated time required to repair or replace the property.The model’s time element vulnerability functions have been derived fromclaims data and consider the estimated time required to repair or replace theproperty.C. The relationship between the modeled structure and time elementvulnerability functions and historical structure and time element lossesshall be reasonable.<strong>EQECAT</strong>’s model calculates time element damage as a function <strong>of</strong> buildingand content damage. Time element vulnerability curves in USWIND arebased on claims data. The derivation <strong>of</strong> the vulnerability functions fromclaims follows a rigorous standard procedure to ensure that no erroneousdata is used and that all fields are clearly defined. At the end <strong>of</strong> thevulnerability generation a validation is performed. This validation ensures thatthe relationship between time element losses and building (and contents)losses are reasonable.D. Time element vulnerability functions used by the model shall includetime element coverage claims associated with wind, flood, and stormsurge damage to the infrastructure caused by a hurricane.Time element vulnerability curves in USWIND are based on claims data.1. Describe the methods used in the model to develop vulnerability functions forcontents coverage associated with personal and commercial residential structures.Residential content vulnerability functions were developed by regressinghistoric content claims against peak gust wind speed, using claims datagathered and analyzed since 1954. In USWIND, the user identifies thestructure type containing the contents, choosing from one or a combination <strong>of</strong>76
The <strong>Florida</strong> Commission on Hurricane Loss Projection MethodologyVulnerability Standardsthe basic structure types available in USWIND. That is not to say that contentvulnerability is the same as building vulnerability: there are two sets <strong>of</strong>vulnerability functions for each <strong>of</strong> the basic types, one set for contents andone set for buildings. The content vulnerability is a function <strong>of</strong> the structuretype, but it is not a direct function <strong>of</strong> the building vulnerability function. At thispoint, it would be helpful to clarify the distinction between “contentvulnerability,” “building vulnerability,” and “structure type.” Structure typerefers to the building’s structural system: whether the building is wood-frame,masonry, concrete, etc.; whether the exterior wall material is strong or not;whether the windows are large or small; and so on. When we say buildingvulnerability, we mean the degree to which a building <strong>of</strong> a given structure typeis estimated to be damaged at a given wind speed. A building with a concretestructure type is likely to be less vulnerable than a building with a timberstructure type. Similarly, content vulnerability refers to the degree to whichcontents within a building <strong>of</strong> a given structure type are estimated to bedamaged at a given wind speed. Contents in a building with a concretestructure type are less vulnerable to wind damage than contents in a buildingwith a timber structure type. Building vulnerability and content vulnerability areboth functions <strong>of</strong> structure type, but content vulnerability is not a function <strong>of</strong>building vulnerability.To the extent that both building damage and content damage increase athigher wind speeds, and to the extent that both building and content damageare generally higher in more vulnerable structure types, the two are positivelycorrelated, but there is no direct functional dependency defined in USWINDbetween the content vulnerability function and the building vulnerability for thesame structure type -- there is no magic factor applied to building damage toget content damage, nor should there be in the best designed model. Toimpose such a direct dependency would produce poorer vulnerabilityfunctions than are incorporated in USWIND. Content damage, like buildingdamage, is estimated when peak gust wind speed (2 second averaging time)exceeds 40 mph. Loss is calculated based on damage, deductible, limits, etc.Figure 17 below demonstrates the relationship between building and contentslosses exhibited in a series <strong>of</strong> hypothetical storms run in the model.77
The <strong>Florida</strong> Commission on Hurricane Loss Projection MethodologyVulnerability Standards16,00014,00012,000Contents Loss ($1,000s)10,0008,0006,0004,0002,00000 5,000 10,000 15,000 20,000 25,000 30,000 35,000Building Loss ($1,000s)Figure 17. Relationship Between Building and Contents Losses2. Describe the methods used to develop vulnerability functions for time elementcoverage associated with personal and commercial residential structures. <strong>State</strong>whether the model considers both direct and indirect loss to the insured property.For example, direct loss could be for expenses paid to house policyholders in anapartment while their home is being repaired. Indirect loss could be for expensesincurred for loss <strong>of</strong> power (e.g., food spoilage).USWIND estimates time element costs as a function <strong>of</strong> building damage,content damage, and occupancy. The program first determines the greater <strong>of</strong>building or content damage (as percentages <strong>of</strong> the coverage value) and thenevaluates the time-element vulnerability function at this x-value. There is nominimum threshold at which time element loss is calculated. That is to say, ifa site experiences significant structure or content damage, some timeelementcost is estimated to occur. The size <strong>of</strong> the storm, even if it is “merely”a category 1 event, is irrelevant to the policyholder and the insurer; all thatmatters is whether the home is occupyable under the terms <strong>of</strong> the policy. Norwould a threshold structure damage make sense: even if the structureexperiences minimal damage, such as just a few broken windows, significantdamage to contents can result in significant time-element costs. It is for this78
The <strong>Florida</strong> Commission on Hurricane Loss Projection MethodologyVulnerability Standardsreason that USWIND uses both structure and content damage, as well asoccupancy, in determining time-element costs.We recognize that the ideal model would also include explicit consideration <strong>of</strong>lifeline functionality, for example, whether electrical power and water areavailable at the insured’s home. Unfortunately, proper analysis <strong>of</strong> lifelinefunctionality is a complex issue. Merely to begin such an analysis requiresdetailed information on the lifeline facilities, such as the locations, structuralcharacteristics, and links between utility elements like local water mains,pumping stations, power plants, etc. Suffice it to say this type <strong>of</strong> data is tightlycontrolled by the multitude <strong>of</strong> public utilities involved, and is generallyunavailable at the local level. The reader should not infer from this thatUSWIND underestimates time-element costs by an amount equal to lifelinerelatedeffects. There is a strong positive correlation between local lifelinedamage and damage to a policyholder’s home. That correlation results from acommon cause: higher wind speeds generally result in higher damage tohomes, power lines, and even underground water mains, which canexperience damage from uprooted trees. The historical data that go intoUSWIND’s time-element vulnerability functions therefore account for lifelinedamage, if only in an indirect, average way, because they are based ondamage that is correlated with lifeline damage.3. <strong>State</strong> the minimum threshold at which time element loss is calculated (e.g., loss isestimated for structure damage greater than 20% or only for category 3, 4, 5events). Provide documentation <strong>of</strong> validation test results to verify the approachused.The minimum threshold at which time element loss is calculated is the point atwhich either building or contents damage becomes nonzero (i.e., at 40 mphgust).A simple validation test looked at a representative sample <strong>of</strong> claims data fromHurricane Andrew, and found that only 0.21% <strong>of</strong> the total dollar value <strong>of</strong> timeelement claims came from policies having no corresponding building orcontent claim. In many <strong>of</strong> these cases, building or content damage may haveoccurred below the level <strong>of</strong> the deductible.4. Describe how modeled time element loss costs take into consideration the damage(including damage due to storm surge, flood, and wind) to local and regionalinfrastructure.Storm surge and flood damage are not modeled explicitly in USWIND.However, to the extent that such perils (in addition to wind damage) affecttime element claims through damage to the infrastructure, they are implicitlyincluded in the USWIND time element vulnerability functions.79
The <strong>Florida</strong> Commission on Hurricane Loss Projection MethodologyVulnerability Standards5. Describe the relationship between building structure and contents vulnerabilityfunctions.The building vulnerability functions and the contents vulnerability functionsare generated separately from the claims data. Their derivation isindependent from one another, but these vulnerability functions arecorrelated to the extent <strong>of</strong> the damage to the building affects the damage tothe contents. The relationship between the building and contentsvulnerability functions can be observed by the linear trend shown in Figure18 and demonstrating that the two are positively correlated. As indicated inthe response to Standard D there is no direct functional dependency definedin USWIND between the building vulnerability function and the contentsvulnerability function.16,00014,00012,000Contents Loss ($1,000s)10,0008,0006,0004,0002,00000 5,000 10,000 15,000 20,000 25,000 30,000 35,000Building Loss ($1,000s)Figure 18. Relationship Between Building and Contents Losses6. Describe the relationship between building structure and time element vulnerabilityfunctions.The time element vulnerability function expresses the damage ratio withrespect to the annual time element coverage. This ratio is a function <strong>of</strong> themaximum <strong>of</strong> the building and contents damage ratios.80
The <strong>Florida</strong> Commission on Hurricane Loss Projection MethodologyVulnerability StandardsV-3 Mitigation MeasuresA. <strong>Model</strong>ing <strong>of</strong> mitigation measures to improve a structure’s windresistance and the corresponding effects on vulnerability shall betheoretically sound and consistent with fundamental engineeringprinciples. These measures shall include fixtures or constructiontechniques that enhance the performance <strong>of</strong> the structure and itscontents and shall consider:Ro<strong>of</strong> strengthRo<strong>of</strong> covering performanceRo<strong>of</strong>-to-wall strengthWall-to-floor-to-foundation strengthOpening protectionWindow, door, and skylight strength.DisclosuresThe USWIND model allows for modifications to the vulnerability curves in thesecondary structural component <strong>of</strong> the model if additional knowledge aboutthe construction characteristics is available. Such construction characteristicsinclude ro<strong>of</strong> strength, ro<strong>of</strong> covering performance, ro<strong>of</strong>-to-wall strength, wall-t<strong>of</strong>loor-to-foundationstrength, opening protection, and window, door, andskylight strength.B. Application <strong>of</strong> mitigation measures that enhance the performance <strong>of</strong> thestructure and its contents shall be justified as to the impact on reducingdamage whether done individually and in combination.The application <strong>of</strong> modifications to the vulnerability curves in the secondarystructural component <strong>of</strong> USWIND is reasonable both individually and incombination.1. Provide a completed Form V-2, Mitigation Measures – Range <strong>of</strong> Changes inDamage. Provide a link to the location <strong>of</strong> the form here.See Form V-2 at Appendix #3.2. Provide a description <strong>of</strong> the mitigation measures used by the model that are not listedin Form V-2.A large number <strong>of</strong> mitigation measures relevant to residential structuresincluding mobile homes are available in the model. These measures areprovided as various options under about 30 different secondary structuralfeatures. There are both a number <strong>of</strong> features available that are not used inForm V-2, e.g. glazing extent, as well as a number <strong>of</strong> options within eachfeature, e.g. additional ro<strong>of</strong> pr<strong>of</strong>ile types beyond braced gable and hip.81
The <strong>Florida</strong> Commission on Hurricane Loss Projection MethodologyVulnerability StandardsThe mitigation measures as well as their corresponding options available inthe USWIND model are described in the table below.SystemSecondaryStructural FeatureDescriptionIn FormV2Ro<strong>of</strong> CoveringUnknown or OtherAsphalt ShinglesAsphalt Shingles: Event RatedBuilt-Up Ro<strong>of</strong>ingAsbestos CementAsphalt on SlabSingle-ply Membrane, Not AttachedSingle-ply Membrane, AttachedMetal DeckingWood Shingles or ShakesSlate/TileFire ResistiveYesYesUnknownWood (Except Plywood)Reinforced ConcreteRo<strong>of</strong>ing SystemGypsum ConcreteMetal Deck W/o ConcreteMetal Deck With ConcreteMetal Deck With InsulationRo<strong>of</strong> SheathingWaferboardPlywood Sheet or OSB With 6d NailingPlywood Sheet: Sealed Joints and 6dNailingYesPlywood Sheets With 8d NailingPlywood Sheets With 8d Ring ShankNailingPlywood Sheets: Sealed Joints and 8dNailingPlywood Sheets: Sealed Joints and 8dRing Shank NailingPlywood Sheets: ASTM Felt and 6dNailingYes82
The <strong>Florida</strong> Commission on Hurricane Loss Projection MethodologyVulnerability StandardsSystemSecondaryStructural FeatureRo<strong>of</strong> FlashingRo<strong>of</strong> ConditionRo<strong>of</strong> AgeRo<strong>of</strong> Pr<strong>of</strong>ileRo<strong>of</strong> Overhang83DescriptionPlywood Sheets: ASTM Felt and 8dNailingPlywood Sheets: ASTM Felt and 8dRing Shank NailingPlywood Sheets: Sealed Joints +ASTM Felt and 6d NailingPlywood Sheets: Sealed Joints +ASTM Felt and 8d NailingPlywood Sheets: Sealed Joints +ASTM Felt and 8d Ring Shank NailingUnknown or N.A.Loose, bent or deteriorated flashingGood condition with adequatefasteningUnknownPoor, Needs ReplacingFairAverageGoodVery Good or NewUnknownLess Than 5 Years6 to 10 Years11 to 15 Years16 to 20 YearsMore Than 20 YearsUnknownFlat or Gable: Slope < 10 deg.Gable - BracedGable - UnbracedGable - UnknownHip: Slope>30 deg.Stepped or Multi-levelHip: Slope < 30 deg.UnknownNoneIn FormV2Yes
The <strong>Florida</strong> Commission on Hurricane Loss Projection MethodologyVulnerability StandardsSystemSecondaryStructural FeatureDescriptionIn FormV2AnchorageSystemWall SystemParapetRo<strong>of</strong> EquipmentAnchorageRo<strong>of</strong>-to-WallConnectionwall-to-Floor-to-FoundationAnchorageWall CladdingLess Than 1 FootMore Than 1 FootUnknown or NoneNon-structural, any heightStructural, < 3' tall (Flat/low slope Ro<strong>of</strong>)Structural, > 3' tall (Flat/low slope Ro<strong>of</strong>)Unknown or N.A.No EquipmentPoorly AnchoredWell AnchoredUnknown or Unable to LocateNo connectionPartial connectionBolted along with Nails (Wood Frames)Ordinary Box Nails (Wood Frames)Straps, Clips or Extra Strengtheningsuch as Wraps and Double WrapsTie-down straps in RC (masonry walls)Bolted or welded connectionsIntegrated RC slab with masonry wallUnknown or Unable to LocateNo or Inadequate ConnectionOrdinary Nailed Connection1/2'' dia. Anchor bolts @ 6ft SpacingO.C.Additional Straps or TiesContinuous Structural Anchor toGround1/2'' dia. Anchor Bolts @ 4ft SpacingO.C.5/8'' dia. Anchor Bolts @ 6ft SpacingO.C.Unknown or OtherConcrete (All Types)EIFS (Foam + Plaster)MasonryCorrugated Metal PanelsYesYesYesYes84
The <strong>Florida</strong> Commission on Hurricane Loss Projection MethodologyVulnerability StandardsSystemSecondaryStructural FeatureDescriptionIn FormV2OpeningProtectionSystemExterior WallConditionCondition <strong>of</strong> WoodFramingEntryway DoorOpeningOverhead DoorsDoorReinforcementsGlazing ExtentWood, Metal, or Plastic SidingStone PanelStuccoPlywoodAsbestos CementUnknownPoor, needs replacingFairAverageGoodVery Good or NewUnknown or N.A.Not Weakened or N.A.Weakened FramingUnknownMinor (< 10%)Moderate (10% to 25%)Major (> 25%)Unknown or N.A.NoSingle Door: Detached GarageDouble Doors: Detached GarageSingle Door: Attached GarageDouble Doors: Attached GarageMore than 2 Doors: AttachedMore than 2 Doors: DetachedAll Structurally ReinforcedUnknown or N.A.Hollow-core or Glass Panes(Residential)Tempered Glass Door (Commercial)Solid Door or Stiffened PanelsImpact Resistant Door and FrameUnknownNo GlazingVery Minor (< 5% <strong>of</strong> exterior wall area)Yes85
The <strong>Florida</strong> Commission on Hurricane Loss Projection MethodologyVulnerability StandardsSystemSecondaryStructural FeatureGlazing TypeGlazing SizeEvidence <strong>of</strong>Glazing StandardsShuttersDescriptionMinor (6% To 10% <strong>of</strong> exterior wallarea)Moderate (11%-30% exterior wall area)Major (31% to 70% <strong>of</strong> exterior wallarea)Almost All (> 70% <strong>of</strong> exterior wall area)Unknown or N.A.Ordinary: AnnealedHeat StrengthenedFully-temperedInsulatedLaminatedPlasticPolycarbonatePlastic - discolorationPolycarbonate - discolorationUnknown or N.A.Small (< 25 Sq. Ft.)Medium (25-50 Sq. Ft.)Large (> 50 Sq. Ft.)Unknown or N.A.No EvidenceVisible EvidenceUnknown or N.A.No Shutters or screensTemporary ShuttersPermanent Hurricane ShuttersImpact-resistant Fabric ScreensIn FormV2YesYesYesUnknown or NoneYesSkylight ExtentMinor ( 40% <strong>of</strong> ro<strong>of</strong> surface area)Unknown or N.A.Ordinary GlassStrengthened GlassInsulated Glass86
The <strong>Florida</strong> Commission on Hurricane Loss Projection MethodologyVulnerability StandardsSystemSecondaryStructural FeatureDescriptionIn FormV2Mobile HomeGeneralMobile Home Wallto-FloorAnchorageMobile HomeWidthWind ExposureDesign CodeLaminated GlassPlastic - no discolorationPolycarbonate - no discolorationPlastic - discolorationPolycarbonate - discolorationUnknownInadequate ConnectionOrdinary Nailed ConnectionsAnchor BoltsAdditional StrengtheningUnknownSingle-wideDouble-wideUnknown or AverageVery HighAbove AverageBelow AverageVery LowUnknownNBC/UBC/CABO/IBCANSI/ASCE/IRCSFBCSBC w/o Debris Impact StandardsSBC w/ Debris Impact StandardsHUD - Pre 1994 Mobile HomesHUD - Post 1994 Mobile Homes<strong>Florida</strong> Building CodeYes(relatedto Year<strong>of</strong>Construction)UnknownCode EnforcementNoYes87
The <strong>Florida</strong> Commission on Hurricane Loss Projection MethodologyVulnerability Standards3. Describe how mitigation is implemented in the model. Identify any assumptions.The options applicable to the different mitigation measures are selected andentered into the input portfolio file in conjunction with the base structure typeto modify its corresponding base vulnerability curve. The magnitude <strong>of</strong> themodification imparted by the selected mitigation measures to the basevulnerability curve is estimated in an algorithm where the relative vulnerabilitycontributions <strong>of</strong> the various mitigation measures are combined.Redundancy between mitigation measures within each system is taken intoconsideration to avoid double counting. Also, interaction between twosystems is included in the algorithm to best represent the overall vulnerability<strong>of</strong> the structure. Such interaction is important in the ro<strong>of</strong>-to-wall connectionand the wall-to-floor-to-foundation connection.The scoring system used in this algorithm is based on post-disaster fieldsurveys, engineering calculations, published papers, testing and engineeringjudgment.The use <strong>of</strong> the mitigation measures assumes that users have accurateinformation on a number <strong>of</strong> mitigation measures characterizing the buildingsin their portfolios.4. Describe the process used to ensure that multiple mitigation factors are correctlycombined in the model.The scoring system used to modify the vulnerability functions accounts forinteraction among features (two important classes <strong>of</strong> such interaction relate tothe ro<strong>of</strong>-to-wall connection and the wall-to-floor-to-foundation connection).88
The <strong>Florida</strong> Commission on Hurricane Loss Projection MethodologyActuarial StandardsActuarial StandardsA-1 <strong>Model</strong>ing Input DataA. When used in the modeling process or for verification purposes,adjustments, edits, inclusions, or deletions to insurance company inputdata used by the modeling organization shall be based upon acceptedactuarial, underwriting, and statistical procedures.When used in the modeling process or for verification purposes, adjustments,edits, inclusions, or deletions to insurance company input data used by themodeler are based upon accepted actuarial, underwriting, and statisticalprocedures.DisclosuresB. All modifications, adjustments, assumptions, inputs and/or input fileidentification, and defaults necessary to use the model shall beactuarially sound and shall be included with the model output report.Treatment <strong>of</strong> missing values for user inputs required to run the modelshall be actuarially sound and described with the model output report.Any assumption or method used by <strong>EQECAT</strong>’s hurricane loss projectionmodel that relates to a specific insurer’s inputs to the model, if any, for thepurposes <strong>of</strong> preparing the insurer’s rate filing is clearly identified. <strong>EQECAT</strong> willdisclose any implicit assumptions relating to insurance to value, theprevalence <strong>of</strong> appurtenant structures, or demographic risk characteristics.1. Identify depreciation assumptions and describe the methods and assumptions usedto reduce insured losses on account <strong>of</strong> depreciation. Provide a sample calculationfor determining the amount <strong>of</strong> depreciation and the actual cash value (ACV) losses.USWIND does not calculate a depreciation factor.2. Identify insurance-to-value assumptions and describe the methods and assumptionsused to determine the true property value and associated losses. Provide a samplecalculation for determining the property value and guaranteed replacement costlosses.The USWIND model does not make any insurance-to-value assumption todetermine the true property replacement cost. Hence, no such correction ismade by the model in the course <strong>of</strong> a portfolio analysis. The assumptionmade is that the total insured value provided represents true property value,so no underinsurance factor is necessary. However, <strong>EQECAT</strong> usesinsurance-to-value information provided by insurance companies to assess89
The <strong>Florida</strong> Commission on Hurricane Loss Projection MethodologyActuarial Standardsproperty replacement values when processing claims data for thedevelopment <strong>of</strong> vulnerability functions.3. Describe the methods used to distinguish among policy form types (e.g.,homeowners, dwelling property, mobile home, tenants, condo unit owners).USWIND has no pre-determined policy form types in it. The user must specifythe format <strong>of</strong> the policy form in the input file. The model can accept a widevariety <strong>of</strong> combinations <strong>of</strong> deductible and limits. The primary assumption inthe analysis <strong>of</strong> different policy forms is that the user has input the datacorrectly. USWIND has many reports which the user can use to validate thecorrectness <strong>of</strong> the data, but the responsibility for the correctness <strong>of</strong> theanalysis resides with the user. The model can produce loss costs for differenttypes <strong>of</strong> policies. All the elements <strong>of</strong> the loss are retained following ananalysis. With a properly formatted input file, the user can produce reportswhich detail many breakdowns <strong>of</strong> the data, not just by Policy Type, but alsoby ZIP Code, county, state, line <strong>of</strong> business, branch, division, etc. The userhas to select the correct identification codes for the various reports needed.4. Disclose, in a model output report, the specific type <strong>of</strong> input that is required to usethe model or model output in a residential property insurance rate filing. Such inputincludes, but is not limited to, optional features <strong>of</strong> the model, type <strong>of</strong> data to besupplied by the model user and needed to derive loss projections from the model,and any variables that a model user is authorized to set in using the model. Includethe model name and version number on the model output report. All items includedin the output form submitted to the Commission shall be clearly labeled and defined.The output reports on the next four pages provide an example <strong>of</strong> theinformation given. In the reports, ‘Multiple Layer Flag’, if ‘On’, indicates thatpolicies having the same account number should be treated as layers <strong>of</strong> asingle policy, and ‘Global Limits/Deductibles’, if other than ‘None Applied’,indicates that the limits and/or deductibles in the portfolio have beenoverridden with some user-specified global values.90
The <strong>Florida</strong> Commission on Hurricane Loss Projection MethodologyActuarial StandardsGeocode Statistics by <strong>State</strong>for Portfolio case1Number <strong>of</strong> Building Contents Total Property Time Element TotalGeocode Statistics Locations TIV TIV TIV TIV TIV$(Thousands) $(Thousands) $(Thousands) $(Thousands) $(Thousands)<strong>State</strong>: <strong>Florida</strong>Postal Code 2 200 0 200 0 200<strong>Florida</strong> <strong>State</strong> Total 2 $200 $0 $200 $0 $200Total for All <strong>State</strong>s 2 $200 $0 $200 $0 $200Factors Used in Analysis:Peril Type:Multiple Layer Flag:HurricaneOffProduct Version: <strong>Florida</strong> Hurricane <strong>Model</strong> Version: 2013a User ID = 1, Window ID = 1Page 1 <strong>of</strong> 1 February 15, 2013 11:47 AM91
The <strong>Florida</strong> Commission on Hurricane Loss Projection MethodologyActuarial StandardsQuality Factor by <strong>State</strong>for Portfolio case1Number <strong>of</strong> Building Contents Total Property Time Element TotalQuality Factor Locations TIV TIV TIV TIV TIV$(Thousands) $(Thousands) $(Thousands) $(Thousands) $(Thousands)<strong>State</strong>: <strong>Florida</strong>50 2 200 0 200 0 200<strong>Florida</strong> <strong>State</strong> Total 2 $200 $0 $200 $0 $200Total for All <strong>State</strong>s 2 $200 $0 $200 $0 $200Factors Used in Analysis:Peril Type:Multiple Layer Flag:HurricaneOffProduct Version: <strong>Florida</strong> Hurricane <strong>Model</strong> Version: 2013a User ID = 1, Window ID = 1Page 1 <strong>of</strong> 1 February 15, 2013 11:47 AM92
The <strong>Florida</strong> Commission on Hurricane Loss Projection MethodologyActuarial StandardsStructure Types by <strong>State</strong>for Portfolio case1Number <strong>of</strong> Building Contents Total Property Time Element TotalStructure Types Locations TIV TIV TIV TIV TIV$(Thousands) $(Thousands) $(Thousands) $(Thousands) $(Thousands)<strong>State</strong>: <strong>Florida</strong>Commercial, Low-Rise, Unreinforced-Masonry, 1 100 0 100 0 100Average-CladdingResidential, Low-Rise, Timber, Average-Cladding 1 100 0 100 0 100<strong>Florida</strong> <strong>State</strong> Total 2 $200 $0 $200 $0 $200Total for All <strong>State</strong>s 2 $200 $0 $200 $0 $200Factors Used in Analysis:Peril Type:Multiple Layer Flag:HurricaneOffProduct Version: <strong>Florida</strong> Hurricane <strong>Model</strong> Version: 2013a User ID = 1, Window ID = 1Page 1 <strong>of</strong> 1 February 15, 2013 11:47 AM93
The <strong>Florida</strong> Commission on Hurricane Loss Projection MethodologyActuarial StandardsHurricane - Expected Annual Damage and Loss by <strong>State</strong>for Portfolio case1Total No. <strong>of</strong> Expected Annual Damage Expected Annual Gross Loss Expected Annual Expected Annual Net Loss<strong>State</strong> TIV Bldgs. % Total % Total Fac. Cessions % Total$(Thousands) $(Thousands) TIV $(Thousands) TIV $(Thousands) $(Thousands) TIV<strong>Florida</strong> 200 2 1.00 0.4978 0.67 0.3349 0.00 0.67 0.3349Total for All <strong>State</strong>s $200 2 $1.00 0.4978% $0.67 0.3349% $0.00 $0.67 0.3349%Factors Used in Analysis:Demand Surge Factor:Region:Global Limits/Deductibles:Multiple Layer Flag:Demand Surge Not IncludedU.S. MainlandNone AppliedOffProduct Version: <strong>Florida</strong> Hurricane <strong>Model</strong> Version: 2013a User ID = 1, Window ID = 2Page 1 <strong>of</strong> 1 February 15, 2013 11:47 AM94
The <strong>Florida</strong> Commission on Hurricane Loss Projection MethodologyActuarial Standards5. Provide a copy <strong>of</strong> the input form used by a model user to provide input criteria to beused in the model. Describe the process followed by the user to generate the modeloutput produced from the input form. Include the model name and version numberon the input form. All items included in the input form submitted to the Commissionshall be clearly labeled and defined.An example USWIND input form is shown below. The field names are in thefirst column, and arranged into six groups (P for policy information, PC forpolicy coverage information, PF for policy facultative reinsurance, S for siteinformation, and SC for site coverage information). The example below hasfive records <strong>of</strong> data (policy numbers FLP001 through FLP005). To generatethe model output, a user <strong>of</strong> the model imports the import form usingfunctionality built into the <strong>EQECAT</strong> s<strong>of</strong>tware, selects the relevant analysisoptions and desired output reports, and executes the analysis.<strong>Florida</strong> Hurricane <strong>Model</strong> 2013aP_PolNum FLP001 FLP002 FLP003 FLP004 FLP005P_InsNameP_AcctNumP_AcctNameP_Company C1 C1 C1 C1 C1P_Division NY NY FL FL NYP_Branch Mia Mia Mia Mia MiaP_LineBus HO HO MP MP HOP_PolTyp COMF COMF HO HO HOP_PolStats IN IN IN IN INP_IncpDate 20020901 20021101 20021201 20020901 20021101P_ExprDate 20030831 20031031 20031130 20030831 20031031P_Producer 9912 4412 7413 1284 9912P_TransID 99 99 99 99 99PC_PerlTyp Wind Wind Wind Wind WindPC_CvgTyp Bldg Cont Time Time ALEPC_LmtAmt 500 333 111 222 67PC_LmtTyp CovSpec CovSpec CovSpec CovSpec CovSpecPC_DedAmt 1000 1000 1000 1000 1000PC_DedTyp CovSpec CovSpec CovSpec CovSpec CovSpecPC_PolPrm 600 600 600 600 600PC_AttcPnt 0 0 0 0 0PC_ProRata 100 100 100 100 100PF_CertNumPF_PerlTypPF_CvgTypPF_ReinAppPF_AttPntPF_LayAmtPF_CedPcntPF_ReinTypPF_AggLmtPF_ReinsrPF_BrokerPF_CertStaPF_ReinPrmPF_TrtyNum95
The <strong>Florida</strong> Commission on Hurricane Loss Projection MethodologyActuarial StandardsS_Number 1 1 1 1 1S_NameS_StrAddr 400 S Greenwood 2040 Whitfield 7400 Nw 19 2801 Rosselle 4586 Palm AveS_City Clearwater Sarasota Miami Jacksonville HialeahS_County Pinellas Manatee Dade Duval DadeS_<strong>State</strong> FL FL FL FL FLS_Zip_5dg 34616 34243 33147 32205 33012S_WndStruc SC52 SC52 SC654 SC654 SC654S_WndOccpy OC1 OC1 OC1 OC1 OC1S_YrBuilt 1968 1980 1934 1942 1960S_NumStory 1 2 1 1 1S_NumStruc 1 1 1 1 1SC_PerlTyp Wind Wind Wind Wind WindSC_CvgTyp Bldg Cont Time Time ALESC_CovQual 50 50 50 50 50SC_TIV 600 350 150 250 75SC_LmtAmt 500 333 111 222 67SC_LmtTyp CovSpec CovSpec CovSpec CovSpec CovSpecSC_DedAmt 1000 1000 1000 1000 1000SC_DedTyp CovSpec CovSpec CovSpec CovSpec CovSpecSC_Prem 600 600 600 600 600SF_CertNumSF_PerlTypSF_CvgTypSF_ReinAppSF_AttPntSF_LayAmtSF_CedPcntSF_ReinTypSF_ReinsrSF_BrokerSF_CertStaSF_PremSF_TrtyNumThe table below provides descriptions for each <strong>of</strong> the input data fields.Field Name Data Group DescriptionP_PolNum Policy Policy NumberP_InsName Policy Insured NameP_AcctNum Policy Account NumberP_AcctName Policy Account NameP_Company Policy CompanyP_Division Policy DivisionP_Branch Policy BranchP_LineBus Policy Line <strong>of</strong> BusinessP_PolTyp Policy Policy TypeP_PolStats Policy Policy StatusP_IncpDate Policy Inception DateP_ExprDate Policy Expiration DateP_Producer Policy ProducerP_TransID Policy Translation IDPC_PerlTyp Policy Coverage Peril TypePC_CvgTyp Policy Coverage Coverage TypePC_LmtAmt Policy Coverage Limit AmountPC_LmtTyp Policy Coverage Limit Type96
The <strong>Florida</strong> Commission on Hurricane Loss Projection MethodologyActuarial StandardsField Name Data Group DescriptionPC_DedAmt Policy Coverage Deductible AmountPC_DedTyp Policy Coverage Deductible TypePC_PolPrm Policy Coverage Policy PremiumPC_AttcPnt Policy Coverage Attachment PointPC_ProRata Policy Coverage ProrataPF_CertNum Policy Facultative Certificate NumberPF_PerlTyp Policy Facultative Peril TypePF_CvgTyp Policy Facultative Coverage TypePF_ReinApp Policy Facultative Reinsurance AppliesPF_AttPnt Policy Facultative Attachment PointPF_LayAmt Policy Facultative Layer AmountPF_CedPcnt Policy Facultative Ceded PercentagePF_ReinTyp Policy Facultative Reinsurance TypePF_AggLmt Policy Facultative Aggregate LimitPF_Reinsr Policy Facultative ReinsurerPF_Broker Policy Facultative BrokerPF_CertSta Policy Facultative Certificate StatusPF_ReinPrm Policy Facultative Reinsurance PremiumPF_TrtyNum Policy Facultative Treaty NumberS_Number Site Site NumberS_Name Site Site NameS_StrAddr Site Street AddressS_City Site CityS_County Site CountyS_<strong>State</strong> Site <strong>State</strong>S_Zip_5dg Site ZIP CodeS_WndStruc Site Wind Structure TypeS_WndOccpy Site Wind Occupancy TypeS_YrBuilt Site Year BuiltS_NumStory Site Number <strong>of</strong> StoriesS_NumStruc Site Number <strong>of</strong> StructuresSC_PerlTyp Site Coverage Peril TypeSC_CvgTyp Site Coverage Coverage TypeSC_CovQual Site Coverage Coverage QualitySC_TIV Site Coverage Total Insured ValueSC_LmtAmt Site Coverage Limit AmountSC_LmtTyp Site Coverage Limit TypeSC_DedAmt Site Coverage Deductible AmountSC_DedTyp Site Coverage Deductible TypeSC_Prem Site Coverage PremiumSF_CertNum Site Facultative Certificate NumberSF_PerlTyp Site Facultative Peril TypeSF_CvgTyp Site Facultative Coverage TypeSF_ReinApp Site Facultative Reinsurance AppliesSF_AttPnt Site Facultative Attachment PointSF_LayAmt Site Facultative Layer AmountSF_CedPcnt Site Facultative Ceded PercentageSF_ReinTyp Site Facultative Reinsurance TypeSF_Reinsr Site Facultative ReinsurerSF_Broker Site Facultative BrokerSF_CertSta Site Facultative Certificate StatusSF_Prem Site Facultative Reinsurance PremiumSF_TrtyNum Site Facultative Treaty Number97
The <strong>Florida</strong> Commission on Hurricane Loss Projection MethodologyActuarial Standards6. Describe actions performed to ensure the validity <strong>of</strong> insurer data used for modelinputs or validation/verification.Client data are extensively tested during the import process into the <strong>EQECAT</strong>system to confirm their accuracy. Field level validation is performed to confirmthat every data element within each record falls within known ranges. Datanot falling within known ranges are marked as errors or a warning in a logdepending upon the severity <strong>of</strong> the problem. Child/parent and other keyrelationships are also checked. A summary log is displayed at the end <strong>of</strong>import process denoting the number records which have warnings or errors.98
The <strong>Florida</strong> Commission on Hurricane Loss Projection MethodologyActuarial StandardsA-2 Event DefinitionA. <strong>Model</strong>ed loss costs and probable maximum loss levels shall reflect allinsured wind related damages from storms that reach hurricanestrength and produce minimum damaging wind speeds or greater onland in <strong>Florida</strong>.<strong>Model</strong>ed loss costs and probable maximum loss levels reflect all damagesstarting when modeled damage is first caused in <strong>Florida</strong> from an eventmodeled as a hurricane at that point in time and will include all subsequentdamage in <strong>Florida</strong> from that event.B. Time element loss costs shall reflect losses due to infrastructuredamage caused by a hurricane.Time element loss costs reflect losses due to infrastructure damage caused bya hurricane.Disclosure1. Describe how damage from model generated storms (landfalling and by-passing) isexcluded or included in the calculation <strong>of</strong> loss costs and probable maximum losslevels for the state <strong>of</strong> <strong>Florida</strong>.All damage from any storm that makes landfall or close bypass at hurricanestatus (Category 1 or above) is included in the calculation <strong>of</strong> loss costs andprobable maximum loss levels, including portions below Category 1 strength.2. Describe how damage resulting from concurrent or preceding flood or hurricanestorm surge is treated in the calculation <strong>of</strong> loss costs and probable maximum losslevels for the state <strong>of</strong> <strong>Florida</strong>.Residential property damage from storm surge is not explicitly calculated bythe model. However, to the extent that a fraction <strong>of</strong> such flood damage isincluded in the claims data, this damage will also be reflected in the damageestimation and hence in the loss costs and probable maximum loss levels.99
The <strong>Florida</strong> Commission on Hurricane Loss Projection MethodologyActuarial StandardsA-3 <strong>Model</strong>ed Loss Cost and Probable Maximum Loss ConsiderationsA. Loss cost projections and probable maximum loss levels shall notinclude expenses, risk load, investment income, premium reserves,taxes, assessments, or pr<strong>of</strong>it margin.Loss cost projections and probable maximum loss levels produced do notinclude expenses, risk load, investment income, premium reserves, taxes,assessments, or pr<strong>of</strong>it margin.B. Loss cost projections and probable maximum loss levels shall not makea prospective provision for economic inflation.The model does not make a prospective provision for economic inflation withregard to losses, probable maximum loss levels, or policy limits.C. Loss cost projections and probable maximum loss levels shall notinclude any provision for direct hurricane storm surge losses.The model does not include any provision for direct hurricane storm surge withregard to losses or probable maximum loss levels.D. Loss cost projections and probable maximum loss levels shall becapable <strong>of</strong> being calculated at a geocode (latitude-longitude) level <strong>of</strong>resolution.The model can calculate loss costs and probable maximum loss levels forspecific latitude-longitude coordinates.E. Demand surge shall be included in the model’s calculation <strong>of</strong> loss costsand probable maximum loss levels using relevant data.Demand surge has been included in all analyses submitted for review by theCommission, using relevant data.F. The methods, data, and assumptions used in the estimation <strong>of</strong> demandsurge shall be actuarially sound.The methods, data, and assumptions used in the estimation <strong>of</strong> demand surgeare actuarially sound.Disclosures1. Describe the method or methods used to estimate annual loss costs and probablemaximum loss levels. Identify any source documents used and research performed.100
The <strong>Florida</strong> Commission on Hurricane Loss Projection MethodologyActuarial StandardsOverall <strong>Model</strong> MethodologyUSWIND modeling methodology can be segmented into four components: 1)the Hazard definition, 2) Propagation <strong>of</strong> the hazard to a site, 3) Damageestimate, and 4) Loss estimation.1. Hazard DefinitionThe storm database used by USWIND is a combination <strong>of</strong> historical andstochastic storms. Wind speed probabilistic distributions are calculated usingthe probabilistic distributions <strong>of</strong> all important storm parameters. The stormintensity is driven directly from the coastline-dependent smoothed wind speeddistributions generated from the information in the National Hurricane CenterHURDAT. The distributions for radius <strong>of</strong> maximum winds and translationalspeed are derived from NOAA Technical Report NWS 38 [Ho et al. 1987],and the National Hurricane Center’s Tropical Cyclone Reports andAdvisories. A proprietary wind speed equation based upon the NOAA modelas published in NWS 23 [Schwerdt, Ho, and Watkins 1979] and NWS 38 [Hoet al. 1987], modified and generalized to properly simulate wind speeds for allSSI categories <strong>of</strong> storms, computes a central pressure, which is used to applyinland decay [Vickery and Twisdale 1995] and as an input to thedetermination <strong>of</strong> the radius <strong>of</strong> maximum winds for severe storms. Theequation then computes wind speeds using the storm’s maximum sustainedwindspeed, the filling rate, radius to maximum winds, the storm track,translation speed, the gust factor [Krayer and Marshall 1992], the stormpr<strong>of</strong>ile (attenuation <strong>of</strong> wind speed outward from the center), and the frictioncaused by local terrain and man-made structures.2. Propagation <strong>of</strong> the Hazard to the SiteUSWIND utilizes an embedded commercial GIS (Geographic InformationSystem), MapInfo, to compute the latitude and longitude <strong>of</strong> each siteanalyzed. The street address level, where such data is available, is used togeocode to the lat./long. coordinates. Failing the presence <strong>of</strong> a streetaddress, the geocoding can be done at a ZIP Code, City, or County centroidbasis. Wind speed distributions at the site locations are computed taking localfriction into account.3. Estimation <strong>of</strong> DamageUSWIND provides the facility to define each <strong>of</strong> the property assets beinganalyzed in order to compute resulting damage. Damage can be calculatedfor Structure, Contents, Time Element (such as Additional Living Expense(ALE) or Business Interruption (BI)), and up to three additional user definedcoverage types. Site information includes the latitude and longitude <strong>of</strong> thelocations, the structure types (96 types), structure details such as number <strong>of</strong>stories, insured value, cladding type and a class <strong>of</strong> occupancy type (12types). Vulnerability functions may be modified by the incorporation <strong>of</strong>101
The <strong>Florida</strong> Commission on Hurricane Loss Projection MethodologyActuarial Standardssecondary structural components such as ro<strong>of</strong> type, ro<strong>of</strong> strength, ro<strong>of</strong>-wallstrength, wall-floor strength, wall-foundation strength, opening protection, andwind-door-skylight strength. Damage is estimated using vulnerabilityfunctions associated with the structure definition and occupancy type and thedistribution <strong>of</strong> peak gust wind speeds at each site. The vulnerability functionsused by USWIND have been derived through three methods: empirical data,expert opinion, and engineering analysis [Fujita 1992, McDonald-MehtaEngineers 1993, Simiu and Scanlan 1996].The probabilistic distribution <strong>of</strong> damage (for each coverage and site) isderived through the discrete calculations <strong>of</strong> the probabilistic distribution <strong>of</strong>wind speeds for the site with the probabilistic distributions <strong>of</strong> damage forgiven wind speeds. Damage distributions for each <strong>of</strong> the sites are aggregatedinto an overall portfolio distribution <strong>of</strong> damage.Since there can be a high degree <strong>of</strong> damage correlation for similar structuretypes within a geographic area, USWIND properly takes into account site andcoverage level correlations when aggregating individual site damage into anoverall portfolio damage amount.4. Estimation <strong>of</strong> LossInsurance information in the form <strong>of</strong> insured values, limits, deductibles andfacultative and/or treaty reinsurance uses discrete calculations with theprobabilistic distribution <strong>of</strong> computed damage for each site to determine theprobabilistic distribution <strong>of</strong> “insured loss” amount. Correlation is properly takeninto account when aggregating individual site loss into an overall portfolio lossamount.2. Identify the highest level <strong>of</strong> resolution for which loss costs and probable maximumloss levels can be provided. Identify all possible resolutions available for thereported output ranges.Loss costs can be provided at state, county, ZIP Code, and site (specificlatitude-longitude) levels. For the reported output ranges, all analyses wereperformed at the ZIP Code level.3. Describe how the model incorporates demand surge in the calculation <strong>of</strong> loss costsand probable maximum loss levels.The USWIND model <strong>of</strong>fers the option to either include or exclude theincreased loss resulting from the effect <strong>of</strong> demand surge which is observedfollowing major cat events.Two indices are calculated to determine the magnitude <strong>of</strong> the demand surgeat any given location subjected to a windspeed V. The Cat Index is a function<strong>of</strong> the storm intensity and the landfall milepost. This index is a function <strong>of</strong> the102
The <strong>Florida</strong> Commission on Hurricane Loss Projection MethodologyActuarial Standardsstorm ground-up damage on one hand, and the availability <strong>of</strong> buildingmaterials and construction labor in the affected region on the other hand. TheCat Inflation Index represents the factor by which repair cost increases in acat event as a function <strong>of</strong> V.4. Provide citations to published papers, if any, that were used to develop how themodel estimates demand surge.The demand surge algorithm used in USWIND is strictly based on <strong>EQECAT</strong>research.103
The <strong>Florida</strong> Commission on Hurricane Loss Projection MethodologyActuarial StandardsA-4 Policy ConsiderationsA. The methods used in the development <strong>of</strong> mathematical distributions toreflect the effects <strong>of</strong> deductibles and policy limits shall be actuariallysound.The methods used in the development <strong>of</strong> mathematical distributions to reflectthe effects <strong>of</strong> deductibles and policy limits are actuarially sound.B. The relationship among the modeled deductible loss costs shall bereasonable.USWIND estimates the damage distribution for a given site through discretecalculations <strong>of</strong> the site hazard distribution and the corresponding vulnerabilityfunction as shown in Figure 19 below.Figure 19. Uncertainty on Hazard and DamageThe loss distribution is estimated through the discrete calculations <strong>of</strong> the sitedamage distribution, taking into account deductibles and limits, as shown inFigure 20 below.104
The <strong>Florida</strong> Commission on Hurricane Loss Projection MethodologyActuarial StandardsFigure 20. Damage Distribution to Calculate LossC. Deductible loss costs shall be calculated in accordance with s.627.701(5)(a), F.S.All loss costs have been calculated in accordance with s.627.701(5)(a), F.S.Disclosures1. Describe the methods used in the model to treat deductibles (both flat andpercentage), policy limits, replacement costs, and insurance-to-value whenprojecting loss costs.The model assumes that the user has correctly input the replacement cost <strong>of</strong>all coverages in the portfolio. The input replacement cost must include anyadjustments for insurance-to-value, as the model does not make anycorrections for this. The deductible is also a user input value. The user mayinput a flat deductible (i.e., a fixed dollar amount) or a percentage amount (apercentage <strong>of</strong> the TIV). Deductibles may be applied separately to eachcoverage, or applied to aggregated damage. The allowed aggregations areBlanket (i.e., all coverages subject to one deductible) or Property Damage /Business Interruption (PD/BI) (i.e. all real property coverages are subject toone deductible, and the Time Element coverage is subject to a differentdeductible). Limits are input by the user, in a manner similar to that fordeductibles. Limits are input as a dollar amount, to be applied either to (a) all105
The <strong>Florida</strong> Commission on Hurricane Loss Projection MethodologyActuarial Standardscoverages separately, (b) all coverages in aggregate, or (c) two limits, one forreal property, and one for Time Element. Internally, the program calculatesthe loss by aggregating over the probability distribution function (PDF) <strong>of</strong> thedamage.2. Provide an example <strong>of</strong> how insurer loss (loss net <strong>of</strong> deductibles) is calculated.Discuss data or documentation used to confirm or validate the method used by themodel.Example:(A) (B) (C) (D)=(A)*(C) (E)=(D)-(B)StructureValuePolicyLimit DeductibleDamageRatioZero DeductibleLossLoss Net <strong>of</strong>Deductible100,000 90,000 500 2% 2,000 1,500Consider the property in the example above with given value, limit, anddeductible, subject to a wind speed with average damage ratio as given.Assume further that the vulnerability functions specify the range <strong>of</strong> possibleoutcomes as follows:Probability <strong>of</strong> Zero Damage = 0.50Probability <strong>of</strong> Damage Greaterthan Zero =Probability Distribution <strong>of</strong> PositiveDamages =0.50{Lognormal with mean=4%and standard deviation=6%}truncated at 100%(Note: this functional distribution is only used for illustrative purposes anddoes not necessarily reflect the method contained within USWIND.)Then the average damage rate (mathematical expectation) is 0.5 x 4% = 2%,as specified, providing an expected damage amount (ground up loss) <strong>of</strong>$100,000 x 2% = $2000.For any given property, the insurer loss is the greater <strong>of</strong> two quantities: (1)zero, and (2) the damage minus the deductible, but not greater than the policylimit. Because the damage is a random variable, i.e., it is associated with aprobability distribution, so too is the insurer loss. However, we can calculatethe average insurer loss (mathematical expectation) by the followingexpression:0.9+.005 1100,000 • [ (x-0.005) • f(x)dx + (0.9) • f(x)dx]0.005 0.9 + .005106
The <strong>Florida</strong> Commission on Hurricane Loss Projection MethodologyActuarial Standardswhere f(x) is the probability density function defined above. In this case, theresult comes out to be an expected insurer loss <strong>of</strong> $1752. This is substantiallyhigher than $1500 because the expectation combines the probabilities <strong>of</strong>high-loss outcomes, where the deductible is fully applied, with low-lossoutcomes, where the deductible does not fully apply.The foregoing example illustrates the actuarial theory behind the application<strong>of</strong> deductibles and limits. USWIND implements this theory in loss costcalculations by a Latin Hypercube Sampling. For each property, one thousandinstances <strong>of</strong> the random damage ratio are drawn from the model's probabilitydistribution for damage ratio. The deductibles and limits are applied to eachoutcome and the results are averaged. Table 2 illustrates this process.TABLE 2.EXAMPLE DAMAGE TO LOSS SIMULATIONInstance # Damage Ratio Ground Up Loss Insurer Loss1 0.00 0.00 0.002 2% 2,000.00 1,500.00... ... ... ...999 0.37% 370.00 0.001000 10% 10,000.00 9,500.00Total 2,000,765 1,751,942.00Average 2.001% 2,001.00 1.752.00The theoretical calculation presented above is standard in the actuarialliterature. See, for example, chapter 3 <strong>of</strong> R. E. Beard, T. Pentikainen, and E.Pesonen's Risk Theory: the Stochastic Basis <strong>of</strong> Insurance (3rd Edition, NewYork: Chapman and Hall) or chapter 5 <strong>of</strong> R. V. Hogg and S. A. Klugman'sLoss Distributions (New York: John Wiley and Sons).The implementation by way <strong>of</strong> simulation is standard in the simulationliterature. See, for example, chapter 4 <strong>of</strong> R. Y. Rubenstein's Simulation andthe Monte Carlo Method (New York: John Wiley and Sons) or chapter 5 <strong>of</strong> J.M. Hammersley and D. C. Handscomb's Monte Carlo Methods (New York:Barnes & Noble), or M.P. Bohn, et. al., “Application <strong>of</strong> the SSMRPMethodology to the Seismic Risk at the Zion Nuclear Plant,” prepared for theU.S. Nuclear Regulatory Commission, Lawrence Livermore NationalLaboratory.107
The <strong>Florida</strong> Commission on Hurricane Loss Projection MethodologyActuarial StandardsThe specifics <strong>of</strong> the distributional models are based both on engineeringstudies <strong>of</strong> the variability <strong>of</strong> damage from winds and on extensive historicaldatasets detailing losses risk-by-risk.3. Describe how the model calculates annual deductibles.All results in this submission, where annual deductibles are required, werecompiled through the post-processing <strong>of</strong> intermediate results generated bythe standard <strong>EQECAT</strong> model. The handling <strong>of</strong> the annual deductibles wasdone according to the 627.701(5)(a) <strong>Florida</strong> Statutes.Using stratified sampling, for each year, a number <strong>of</strong> events are simulatedfrom the hurricane frequency distribution. As each simulated yearprogresses, losses from each hurricane during that year are tracked by policyand the corresponding effect on the remaining amount <strong>of</strong> the hurricanedeductible evaluated. The results are used to quantify the annual deductibleeffects.108
The <strong>Florida</strong> Commission on Hurricane Loss Projection MethodologyActuarial StandardsA-5 CoveragesDisclosureA. The methods used in the development <strong>of</strong> contents loss costs shall beactuarially sound.The methods used in the development <strong>of</strong> contents loss costs are actuariallysound.B. The methods used in the development <strong>of</strong> time element coverage losscosts shall be actuarially sound.The methods used in the development <strong>of</strong> time element loss costs areactuarially sound.1. Describe the methods used in the model to calculate loss costs for contents coverageassociated with personal and commercial residential structures.Residential content vulnerability functions were developed by regressinghistoric content claims against peak gust wind speed, using claims datagathered and analyzed over the last 40 years. In USWIND, the user identifiesthe structure type containing the contents, choosing from one or acombination <strong>of</strong> the basic structure types available in USWIND. That is not tosay that content vulnerability is the same as building vulnerability: there aretwo sets <strong>of</strong> vulnerability functions for each <strong>of</strong> the basic types, one set forcontents and one set for buildings. The content vulnerability is a function <strong>of</strong>the structure type, but it is not a direct function <strong>of</strong> the building vulnerabilityfunction. At this point, it would be helpful to clarify the distinction between“content vulnerability,” “building vulnerability,” and “structure type.” Structuretype refers to the building’s structural system: whether the building is woodframe,masonry, concrete, etc.; whether the exterior wall material is strong ornot; whether the windows are large or small; and so on. When we saybuilding vulnerability, we mean the degree to which a building <strong>of</strong> a givenstructure type is estimated to be damaged at a given wind speed. A buildingwith a concrete structure type is likely to be less vulnerable than a buildingwith a timber structure type. Similarly, content vulnerability refers to thedegree to which contents within a building <strong>of</strong> a given structure type areestimated to be damaged at a given wind speed. Contents in a building with aconcrete structure type are less vulnerable to wind damage than contents in abuilding with a timber structure type. Building vulnerability and contentvulnerability are both functions <strong>of</strong> structure type, but content vulnerability isnot a function <strong>of</strong> building vulnerability.To the extent that both building damage and content damage increase athigher wind speeds, and to the extent that both building and content damageare generally higher in more vulnerable structure types, the two are positivelycorrelated, but there is no direct functional dependency defined in USWINDbetween the content vulnerability function and the building vulnerability for the109
The <strong>Florida</strong> Commission on Hurricane Loss Projection MethodologyActuarial Standardssame structure type -- there is no magic factor applied to building damage toget content damage, nor should there be in the best designed model. Toimpose such a direct dependency would produce poorer vulnerabilityfunctions than are incorporated in USWIND. Content damage, like buildingdamage, is estimated when peak gust wind speed (2 second averaging time)exceeds 40 mph. Loss is calculated based on damage, deductible, limits, etc.Figure 21 below demonstrates the relationship between building and contentslosses exhibited in a series <strong>of</strong> hypothetical storms run in the model.16,00014,00012,000Contents Loss ($1,000s)10,0008,0006,0004,0002,00000 5,000 10,000 15,000 20,000 25,000 30,000 35,000Building Loss ($1,000s)Figure 21. Relationship Between Building and Contents Losses2. Describe the methods used in the model to calculate loss costs for time elementcoverage associated with personal and commercial residential structures. <strong>State</strong>whether the model considers both direct and indirect loss to the insured property.For example, direct loss could be for expenses paid to house policyholders in anapartment while their home is being repaired. Indirect loss could be for expensesincurred for loss <strong>of</strong> power (e.g., food spoilage).USWIND estimates time element costs as a function <strong>of</strong> building damage,content damage, and occupancy. The program first determines the greater <strong>of</strong>building or content damage (as percentages <strong>of</strong> the coverage value) and thenevaluates the time-element vulnerability function at this x-value. There is nominimum threshold at which time element loss is calculated. That is to say, if110
The <strong>Florida</strong> Commission on Hurricane Loss Projection MethodologyActuarial Standardsa site experiences significant structure or content damage, some timeelementcost is estimated to occur. The size <strong>of</strong> the storm, even if it is “merely”a category 1 event, is irrelevant to the policyholder and the insurer; all thatmatters is whether the home is occupiable under the terms <strong>of</strong> the policy. Norwould a threshold structure damage make sense: even if the structureexperiences minimal damage, such as just a few broken windows, significantdamage to contents can result in significant time-element costs. It is for thisreason that USWIND uses both structure and content damage, as well asoccupancy, in determining time-element costs.We recognize that the ideal model would also include explicit consideration <strong>of</strong>lifeline functionality, for example, whether electrical power and water areavailable at the insured’s home. Unfortunately, proper analysis <strong>of</strong> lifelinefunctionality is a complex issue. Merely to begin such an analysis requiresdetailed information on the lifeline facilities, such as the locations, structuralcharacteristics, and links between utility elements like local water mains,pumping stations, power plants, etc. Suffice it to say this type <strong>of</strong> data is tightlycontrolled by the multitude <strong>of</strong> public utilities involved, and is generallyunavailable at the local level. The reader should not infer from this thatUSWIND underestimates time-element costs by an amount equal to lifelinerelatedeffects. There is a strong positive correlation between local lifelinedamage and damage to a policyholder’s home. That correlation results from acommon cause: higher wind speeds generally result in higher damage tohomes, power lines, and even underground water mains, which canexperience damage from uprooted trees. The historical data that go intoUSWIND’s time-element vulnerability functions therefore account for lifelinedamage, if only in an indirect, average way, because they are based ondamage that is correlated with lifeline damage.111
The <strong>Florida</strong> Commission on Hurricane Loss Projection MethodologyActuarial StandardsA-6 Loss OutputA. The methods, data, and assumptions used in the estimation <strong>of</strong> probablemaximum loss levels shall be actuarially sound.The methods, data, and assumptions used in the estimation <strong>of</strong> probablemaximum loss levels are actuarially sound.B. Loss costs shall not exhibit an illogical relation to risk, nor shall losscosts exhibit a significant change when the underlying risk does notchange significantly.<strong>EQECAT</strong>’s loss costs exhibit logical relation to risk. Loss costs produced bythe model do not exhibit a significant change when the underlying risk doesnot change significantly.C. Loss costs produced by the model shall be positive and non-zero for allvalid <strong>Florida</strong> ZIP Codes.Loss costs produced by the model are positive and non-zero for all valid<strong>Florida</strong> ZIP Codes.D. Loss costs cannot increase as the quality <strong>of</strong> construction type,materials and workmanship increases, all other factors held constant.Loss costs do not increase as the quality <strong>of</strong> construction type, materials, andworkmanship increases, all other factors held constant.E. Loss costs cannot increase as the presence <strong>of</strong> fixtures or constructiontechniques designed for hazard mitigation increases, all other factorsheld constant.Loss costs do not increase with the presence <strong>of</strong> fixtures or constructiontechniques designed for hazard mitigation, all other factors held constant.F. Loss costs cannot increase as the quality <strong>of</strong> building codes andenforcement increases, all other factors held constant.Loss costs do not increase as the quality <strong>of</strong> building codes and enforcementincreases, all other factors held constant.G. Loss costs shall decrease as deductibles increase, all other factors heldconstant.Loss costs decrease as deductibles increase, all other factors held constant.112
The <strong>Florida</strong> Commission on Hurricane Loss Projection MethodologyActuarial StandardsH. The relationship <strong>of</strong> loss costs for individual coverages, (e.g., structuresand appurtenant structures, contents, and time element) shall beconsistent with the coverages provided.Relationships among the loss costs for coverages A,B,C,D are consistent withthe coverages provided.I. Output ranges shall be logical for the type <strong>of</strong> risk being modeled anddeviations supported.The output ranges produced by the model are logical for the type <strong>of</strong> risk beingmodeled and deviations are supported.J. All other factors held constant, output ranges produced by the modelshall reflect lower loss costs for:1. masonry construction versus frame construction,The output ranges produced by the model reflect lower loss costs formasonry construction versus frame construction, subject to the discussion inDisclosure 14 below.2. personal residential risk exposure versus mobile home riskexposure,The output ranges produced by the model reflect lower loss costs forpersonal residential risk exposure versus mobile home risk exposure, subjectto the discussion in Disclosure 14 below.3. inland counties versus coastal counties, andThe output ranges produced by the model reflect lower loss costs, in general,for inland counties versus coastal counties.4. northern counties versus southern counties.The output ranges produced by the model reflect lower loss costs, in general,for northern counties versus southern counties.K. For loss cost and probable maximum loss level estimates derived fromor validated with historical insured hurricane losses, the assumptions inthe derivations concerning (1) construction characteristics, (2) policyprovisions, (3) coinsurance, (4) contractual provisions, and (5) relevantunderwriting practices underlying those losses, as well as any actuarialmodifications, shall be appropriate based on the type <strong>of</strong> risk beingmodeled.Vulnerability functions in USWIND are based on claims data obtained frominsurance companies and are appropriate based on the type <strong>of</strong> risk beingmodeled. For each data set obtained, the following process is used toincorporate the data into new or existing vulnerability functions:1. Review claims data to ensure consistency, correct any errors throughinteractions with the insurance company that provided the data and113
The <strong>Florida</strong> Commission on Hurricane Loss Projection MethodologyActuarial Standardsdetermine all <strong>of</strong> the elements included within the claims data (e.g.,allocated loss adjustment expense, etc.).2. Group the data into appropriate construction classes, and ensureconsistency between definitions <strong>of</strong> different insurers. This includesincorporating consideration <strong>of</strong> the relevant underwriting practices <strong>of</strong> theinsurance company that provided the data.3. Correct insured values to include under-insurance, if any (e.g., 80%insured to value clause in many homeowner policies). This process isdone by consulting with the insurance company that provided the data.4. Calculate ground up loss for each coverage, using the paid claimamount and the deductible.5. Apply corrections to account for unreported data, e.g. damage belowthe deductible. This correction is generally negligible for residentialclaims, which typically have low deductibles.6. Associate a wind speed to each location using the best available<strong>of</strong>ficial historical information.7. Perform regression analysis to derive the vulnerability functions byconstruction class and coverage. This process may involve mergingthe new data set with previously analyzed claims.8. Validate curves against loss experience from various insuranceportfolios.Disclosures1. Provide a completed Form A-1, Zero Deductible Personal Residential Loss Costs byZIP Code. Provide a link to the location <strong>of</strong> the form here.See Form A-1 at Appendix #4.2. Provide a completed Form A-2, Base Hurricane Storm Set <strong>State</strong>wide Loss Costs.Provide a link to the location <strong>of</strong> the form here.See Form A-2 at Appendix #4.3. Provide a completed Form A-3, Cumulative Losses from the 2004 HurricaneSeason. Provide a link to the location <strong>of</strong> the form here.See Form A-3 at Appendix #4.114
The <strong>Florida</strong> Commission on Hurricane Loss Projection MethodologyActuarial Standards4. Provide a completed Form A-4, Output-Ranges. Provide a link to the location <strong>of</strong> theform here.See Form A-4 at Appendix #4.5. Provide a Form A-5, Percentage Change in Output Ranges. Provide a link to thelocation <strong>of</strong> the form here.See Form A-5 at Appendix #4.6. A completed Form A-6, Logical Relationship to Risk (Trade Secret item) shall beprovided during the closed meeting portion <strong>of</strong> the Commission meeting to review themodel for acceptability.Form A-6, Logical Relationship to Risk, is provided during the closedmeeting portion <strong>of</strong> the Commission meeting to review the model foracceptability.7. Provide a completed Form A-7, Percentage Change in Logical Relationship to Risk.Provide a link to the location <strong>of</strong> the form here.See Form A-7 at Appendix #4.8. Provide a completed Form A-8, Probable Maximum Loss for <strong>Florida</strong>. Provide alink to the location <strong>of</strong> the form here.See Form A-8 at Appendix #4.9. Describe how the model produces probable maximum loss levels.The model simulates 300,000 years <strong>of</strong> North Atlantic hurricane events.Occurrence exceedance probabilities are based on the maximum loss withineach <strong>of</strong> the simulated years; annual aggregate exceedance probabilities arebased on the sum <strong>of</strong> the losses within each <strong>of</strong> the simulated years.10. Provide citations to published papers, if any, that were used to estimate probablemaximum loss levels.No specific papers were used as the basis for the estimation <strong>of</strong> probablemaximum loss levels.11. Describe how the probable maximum loss levels produced by the model include theeffects <strong>of</strong> personal and commercial residential insurance coverage.Probable maximum loss levels produced by the model incorporate damageand insured loss calculations for both personal and commercial residentialexposures. The methodology to compute probable maximum loss levels is115
The <strong>Florida</strong> Commission on Hurricane Loss Projection MethodologyActuarial Standardsconsistent between personal and commercial residential exposures, and isbased on a 300,000 year simulation.12. Explain any differences between the values provided on Form A-8 and thoseprovided on Form S-2.The FHCF results on Form A-8 represent zero deductible losses; the FHCFresults on Form S-2 represent insured losses incorporating policy conditions.13. Demonstrate that loss cost relationships among coverages, territories, and regionsare consistent and reasonable.We have conducted several analyses to demonstrate how the loss cost(Average Annual Loss or AAL) relationships produced by USWIND areconsistent with actual insurance data. Using our large empirical data set <strong>of</strong>exposure loss information from historical storms, we have calculatedexpected ratios <strong>of</strong> loss rates between coverages and between structure typesby peak gust wind speeds. We compared these ratios at various wind speedsto corresponding ratios for AAL. We looked at various different AAL ratiosincluding the average and 75th percentile over all ZIP Codes for eachcorresponding group. The results highlighted how the AAL relationships arewithin the expectations derived from actual insurance data.As an example <strong>of</strong> the consistency <strong>of</strong> the loss cost relationships betweenstructure types, the ratio <strong>of</strong> expected loss between Construction Type #1 andConstruction Type #2 varied between 56% and 93% for gust wind speedsbetween 70 and 200 mph. The average ratio <strong>of</strong> AALs between these twoconstruction types over all ZIP Codes was 57%, and the 75th percentile was68%.Demonstrating the consistency <strong>of</strong> the relationships between loss costs andterritories, Figure 22 displays USWIND’s loss cost estimates. Depicted hereare the loss costs for all construction types and all coverages. The horizontalaxis lists all coastal counties starting with the north-eastern most county <strong>of</strong>Nassau and ending with the western most county <strong>of</strong> Escambia. The chartbelow the graph in the figure illustrates the corresponding historical events bySSI category for these regions.The progression from north to south and then back up to the panhandlecoincides with the historical storm activity. For example, the southeast regionhas historically seen the most frequent and most severe storms and thereforeyields the highest loss costs.Please note that the erratic behavior <strong>of</strong> the graph in certain regions can beexplained by the fact that counties have varying geographic area.USWIND produces loss costs that are highly correlated to historical data.116
The <strong>Florida</strong> Commission on Hurricane Loss Projection MethodologyActuarial StandardsFigure 22. Loss Costs for Coastal Counties14. Provide an explanation for all anomalies in the loss costs that are not consistentwith the requirements <strong>of</strong> this Standard.All the loss costs shown in Forms A-4 are consistent with the requirements <strong>of</strong>this standard, except:<strong>State</strong>wide weighted average loss costs for masonry are higher than thecorresponding statewide weighted average loss costs for frame for allcoverage types, policy types, and deductibles in Form A-4. This is due tothe masonry exposures generally being more heavily weighted than theframe exposures in areas having higher levels <strong>of</strong> hazard.Weighted average loss costs for masonry owners are equal to or higherthan the corresponding maximum/minimum loss costs for frame ownersfor certain coverage types and deductibles for a number <strong>of</strong> counties inForm A-4. This is due to variations in secondary structural modifiers and afew ZIP Codes whose exposures lack frame or masonry coverages.117
The <strong>Florida</strong> Commission on Hurricane Loss Projection MethodologyActuarial StandardsWeighted average loss costs for masonry renters and condos are equal toor higher than the corresponding weighted average loss costs for framerenters and condos for certain coverage types and deductibles for anumber <strong>of</strong> counties in Form A-4. All <strong>of</strong> these situations are due to themasonry exposures in these counties being more heavily weighted thanthe frame exposures in areas having higher levels <strong>of</strong> hazard and thevariations <strong>of</strong> secondary structural modifiers and age groups.15. Provide an explanation <strong>of</strong> the differences in output ranges between the previouslyaccepted submission and the current submission.The following significant changes were made to the model between thepreviously accepted submission (<strong>EQECAT</strong> <strong>Florida</strong> Hurricane <strong>Model</strong> 2011a) andthe current submission (<strong>EQECAT</strong> <strong>Florida</strong> Hurricane <strong>Model</strong> 2013a):1. The probabilistic hurricane database was regenerated to be consistent with theNational Hurricane Center’s HURDAT data set as <strong>of</strong> May 14, 2012.2. The simulation time period has been doubled from 150,000 years to 300,000years. Also, nearly identical events have been merged, reducing the number <strong>of</strong>cases in the stochastic set from 47,315 to 32,032 events affecting the United<strong>State</strong>s Mainland.3. The resolution <strong>of</strong> the time stepping in the windfield calculation has beenincreased from 15-minutes to 5-minutes.4. The ZIP Code database has been updated to March 2012.5. The mitigation measures have been updated.6. The financial model has been updated to use discrete calculations instead <strong>of</strong>numerical integration for the computation <strong>of</strong> insured loss.16. Identify the assumptions used to account for the effects <strong>of</strong> coinsurance oncommercial residential construction loss costs.For each set <strong>of</strong> claims data used to derive or validate the commercialresidential vulnerability functions, <strong>EQECAT</strong> has clarified any potentialissues, including the effects <strong>of</strong> coinsurance, with the company providing thedata.17. Describe how loss adjustment expenses are considered within the loss cost andprobable maximum loss level estimates.Loss adjustment expenses are not considered.118
The <strong>Florida</strong> Commission on Hurricane Loss Projection MethodologyStatistical StandardsStatistical StandardsS-1 <strong>Model</strong>ed Results and Goodness-<strong>of</strong>-FitDisclosuresA. The use <strong>of</strong> historical data in developing the model shall be supported byrigorous methods published in currently accepted scientific literature.<strong>EQECAT</strong>’s use <strong>of</strong> historical data in developing USWIND is supported byrigorous methods published in currently accepted scientific literature.B. <strong>Model</strong>ed and historical results shall reflect statistical agreement usingcurrently accepted scientific and statistical methods for the academicdisciplines appropriate for the various model components orcharacteristics.<strong>Model</strong>ed and historical results reflect agreement using currently acceptedscientific and statistical methods in the appropriate disciplines for the variousmodel components and characteristics.1. Identify the form <strong>of</strong> the probability distributions used for each function or variable, ifapplicable. Identify statistical techniques used for the estimates and the specificgoodness-<strong>of</strong>-fit tests applied. Describe whether the p-values associated with the fitteddistributions provide a reasonable agreement with the historical data. Provide acompleted Form S-3, Distribution <strong>of</strong> Stochastic Hurricane Parameters. Provide alink to the location <strong>of</strong> the form here.Radius to maximum winds, translational speed, and pr<strong>of</strong>ile factor are modeledusing lognormal distributions, the parameters <strong>of</strong> which vary smoothly alongthe coast. Filling rate is modeled using a normal distribution. Friction and gustfactor are modeled using lognormal distributions. Chi-squared andKolmogorov-Smirnov tests have been performed to assess the goodness-<strong>of</strong>fit,and reasonable agreement with the historical data has been shown.See Form S-3 at Appendix #5.2. Describe the nature and results <strong>of</strong> the tests performed to validate the windspeedsgenerated.<strong>EQECAT</strong> has performed a study <strong>of</strong> USWIND-generated peak gust windpatterns with those <strong>of</strong> actual hurricanes: Actual peak gust observations wereobtained for eighteen landfalls <strong>of</strong> fifteen notable hurricanes since 1960. Theseobservations were compared with model-generated peak gust wind speeds.Scatter plots were made <strong>of</strong> observed versus modeled. Table 3 belowsummarizes the results, and is limited to observations with gusts above 60mph to avoid including areas where wind damage on the fringe <strong>of</strong> a storm119
The <strong>Florida</strong> Commission on Hurricane Loss Projection MethodologyStatistical Standardswould not be significant; (this level would roughly correspond to a 1-minutesustained <strong>of</strong> 45 mph).TABLE 3.COMPARISON OF POINT LOCATION OBSERVATIONS WITHMODEL-GENERATED WINDS(Peak Gust Observations 60 mph or more)Hurricane Year #Obs #Simulated +/- 10mph#Simulated +/- 15mphDonna 1960 21 12 57% 17 81%Carla 1961 14 7 50% 10 71%Betsy 1965 18 13 72% 16 89%Alicia 1983 6 4 67% 5 83%Elena 1985 8 3 38% 6 75%Gloria 1985 18 13 72% 15 83%Hugo 1989 8 6 75% 6 75%Bob 1991 18 11 61% 11 61%Andrew 1992 11 6 55% 8 73%Charley 2004 7 5 71% 5 71%Frances 2004 23 12 52% 17 74%Ivan 2004 3 2 67% 3 100%Jeanne 2004 7 4 57% 6 86%Katrina 2005 13 7 54% 8 62%Wilma 2005 28 14 50% 20 71%Total 203 119 59% 153 75%3. Provide the date <strong>of</strong> loss <strong>of</strong> the insurance company data available for validation andverification <strong>of</strong> the model.The primary information available for validation and verification <strong>of</strong> the modelis claims data from Hurricanes Alicia (1983), Elena (1985), Gloria (1985),Juan (1985), Kate (1985), Hugo (1989), Bob (1991), Andrew (1992), Iniki(1992), Erin (1995), Opal (1995), Charley (2004), Frances (2004), Ivan(2004), Jeanne (2004), Katrina (2005), Rita (2005), and Wilma (2005).4. Provide an assessment <strong>of</strong> uncertainty in loss costs for output ranges using confidenceintervals or other accepted scientific characterizations <strong>of</strong> uncertainty.Figure 23 below compares the loss exceedance curve presented in Form S-2with the curves that would result from adding or subtracting one standarddeviation (sigma) to the total annual hurricane frequency in the model usingthe hypothetical data set.120
The <strong>Florida</strong> Commission on Hurricane Loss Projection MethodologyStatistical StandardsFigure 23. Uncertainty Analysis for Frequency5. Justify any differences between the historical and modeled results using currentaccepted scientific and statistical methods in the appropriate disciplines.A number <strong>of</strong> tests have been performed to verify that the differences betweenhistorical and modeled results are not statistically significant. Form S-5 at theend <strong>of</strong> this section provides such tests for the historical versus modeledresults for the 2007 FHCF exposures.6. Provide graphical comparisons <strong>of</strong> modeled and historical data and goodness-<strong>of</strong>-fittests. Examples include hurricane frequencies, tracks, intensities, and physicaldamage.Figures 24 and 25 are examples <strong>of</strong> graphical comparisons <strong>of</strong> modeled andhistorical data.Figure 24 compares the historical data for translational speed near Ft. Myersand Daytona Beach with the lognormal distribution used to model it. As anexample <strong>of</strong> a more quantitative comparison, we performed a Kolmogorov-121
The <strong>Florida</strong> Commission on Hurricane Loss Projection MethodologyStatistical StandardsSmirnov test to assess the goodness-<strong>of</strong>-fit <strong>of</strong> our modeled distribution fortranslational speed at Ft. Myers to the historical data. The test statistic valueis 0.116. The critical test value at a 5% level <strong>of</strong> significance is 0.21, for 41data points. Hence, the modeled distribution cannot be rejected at that level<strong>of</strong> significance. Similarly, for Daytona Beach the test statistic value is 0.208,and the critical test value at a 5% level <strong>of</strong> significance is 0.27, for 23 datapoints; hence the modeled distribution cannot be rejected at that level <strong>of</strong>significance.(a)(b)Figure 24. Goodness-<strong>of</strong>-fit for Translational Speed122
The <strong>Florida</strong> Commission on Hurricane Loss Projection MethodologyStatistical StandardsFigure 25. Goodness-<strong>of</strong>-fit for Hurricane Frequency in <strong>Florida</strong>Figure 25 compares the historical data for hurricane frequency in <strong>Florida</strong> withthe negative binomial distribution used to model it. We performed aKolmogorov-Smirnov test to assess the goodness-<strong>of</strong>-fit <strong>of</strong> our modeleddistribution for hurricane frequency in <strong>Florida</strong> to the historical data. The teststatistic value is 0.0536. The critical test value at a 5% level <strong>of</strong> significance is0.127, hence the modeled distribution cannot be rejected at that level <strong>of</strong>significance.7. Provide a completed Form S-1, Probability <strong>of</strong> <strong>Florida</strong> Landfalling Hurricanes perYear. Provide a link to the location <strong>of</strong> the form hereSee Form S-1 at Appendix #5.8. Provide a completed Form S-2, Examples <strong>of</strong> Loss Exceedance Estimates. Provide alink to the location <strong>of</strong> the form here.See Form S-2 at Appendix #5.123
The <strong>Florida</strong> Commission on Hurricane Loss Projection MethodologyStatistical StandardsS-2 Sensitivity Analysis for <strong>Model</strong> OutputThe modeling organization shall have assessed the sensitivity <strong>of</strong> temporaland spatial outputs with respect to the simultaneous variation <strong>of</strong> inputvariables using currently accepted scientific and statistical methods in theappropriate disciplines and have taken appropriate action.<strong>EQECAT</strong> has assessed the sensitivity <strong>of</strong> temporal and spatial outputs withrespect to the simultaneous variation <strong>of</strong> input variables using currently acceptedscientific and statistical methods in the appropriate disciplines, and has takenappropriate action.Disclosures1. Identify the most sensitive aspect <strong>of</strong> the model and the basis for making thisdetermination. Provide a full discussion <strong>of</strong> the degree to which these sensitivitiesaffect output results and illustrate with an example.The most sensitive aspect <strong>of</strong> our model involves the conversion <strong>of</strong> windspeed to damage. This is due to the fact that the damage sustained by aparticular structure type depends very sensitively on the wind speedexperienced at the site. For example, the damage sustained by a givenstructure type depends approximately on the wind speed raised to somepower. If the damage is proportional to the fifth power <strong>of</strong> the wind speed, thena 1% uncertainty in the wind speed will result in a 5% uncertainty in thedamage calculated at that site. The origin <strong>of</strong> this uncertainty is the underlyingnon-linearity <strong>of</strong> the vulnerability relationship, and not in any assumptions, dataor properties unique to our model.2. Describe how other aspects <strong>of</strong> the model may have a significant impact on thesensitivities in output results and the basis for making this determination.The results <strong>of</strong> any model depend sensitively on details <strong>of</strong> the structuralcharacteristics and location <strong>of</strong> the insured sites. Often, this information is notprovided by the insurance or underwriting agency for use by the model. Suchdetails can potentially have a large impact on results due to the large variationin damageability among different structure classes and secondary structuralconfigurations, and to the large variation in the wind hazard with respect todistance to coast and other factors.3. Describe and justify action or inaction as a result <strong>of</strong> the sensitivity analysesperformed.The sensitivity analyses performed during the initial development <strong>of</strong> the modelwere crucial in determining optimal sample sizes and the relative importance<strong>of</strong> parameters. Subsequent analyses have been used to verify that thedecisions made continue to be valid.124
The <strong>Florida</strong> Commission on Hurricane Loss Projection MethodologyStatistical Standards4. Provide a completed Form S-6, Hypothetical Events for Sensitivity andUncertainty Analysis (Requirement for models submitted by modelingorganizations which have not previously provided the Commission with thisanalysis. For models previously found acceptable, the Commission will determineat the meeting to review modeling organization submissions, if an existingmodeling organization will be required to provide Form S-6 prior to thePr<strong>of</strong>essional Team on-site review). If applicable, provide a link to the location <strong>of</strong>the form here.Form S-6 will be provided if required.125
The <strong>Florida</strong> Commission on Hurricane Loss Projection MethodologyStatistical StandardsS-3 Uncertainty Analysis for <strong>Model</strong> OutputThe modeling organization shall have performed an uncertainty analysis onthe temporal and spatial outputs <strong>of</strong> the model using currently acceptedscientific and statistical methods in the appropriate disciplines and havetaken appropriate action. The analysis shall identify and quantify the extentthat input variables impact the uncertainty in model output as the inputvariables are simultaneously varied.<strong>EQECAT</strong> has performed uncertainty analysis on the temporal and spatial outputs<strong>of</strong> the model using currently accepted scientific and statistical methods in theappropriate disciplines and has taken appropriate action. The analysis hasidentified and quantified the extent that input variables impact the uncertainty inmodel output as the input variables are simultaneously varied.Disclosures1. Identify the major contributors to the uncertainty in model outputs and the basis formaking this determination. Provide a full discussion <strong>of</strong> the degree to which theseuncertainties affect output results and illustrate with an example.Major contributors to the uncertainty in model output include uncertainty onstorm parameters, uncertainty on site parameters, and uncertainty on thevulnerability functions, as identified in our uncertainty analysis.One such contributor is the conversion <strong>of</strong> wind speed to damage. This is dueto the fact that the damage sustained by a particular structure type dependsvery sensitively on the <strong>of</strong> wind speed experienced at the site. For example,the damage sustained by a given structure type depends approximately onthe <strong>of</strong> wind speed raised to some power. If the damage is proportional to thefifth power <strong>of</strong> the wind speed, then a 1% uncertainty in the wind speed willresult in a 5% uncertainty in the damage calculated at that site. The origin <strong>of</strong>this uncertainty is the underlying non-linearity <strong>of</strong> the vulnerability relationship,and not in any assumptions, data or properties unique to our model.2. Describe how other aspects <strong>of</strong> the model may have a significant impact on theuncertainties in output results and the basis for making this determination.The results <strong>of</strong> any model depend sensitively on details <strong>of</strong> the structuralcharacteristics and location <strong>of</strong> the insured sites. Often, this information is notprovided by the insurance or underwriting agency for use by the model. Suchdetails can potentially have a large impact on results due to the large variationin damageability among different structure classes and secondary structuralconfigurations, and to the large variation in the wind hazard with respect todistance to coast and other factors.126
The <strong>Florida</strong> Commission on Hurricane Loss Projection MethodologyStatistical Standards3. Describe actions taken in light <strong>of</strong> the uncertainty analyses performed.The uncertainty analyses performed during the initial development <strong>of</strong> themodel were crucial in determining optimal sample sizes and the relativeimportance <strong>of</strong> parameters. Subsequent analyses have been used to verifythat the decisions made continue to be valid.4. Form S-6, if disclosed under Standard S-2, will be used in the verification <strong>of</strong>Standard S-3.Form S-6 will be provided if required.127
The <strong>Florida</strong> Commission on Hurricane Loss Projection MethodologyStatistical StandardsS-4 County Level AggregationAt the county level <strong>of</strong> aggregation, the contribution to the error in loss costestimates attributable to the sampling process shall be negligible.USWIND estimates loss costs in the mainland United <strong>State</strong>s from Texas toMaine on the basis <strong>of</strong> 32,032 stochastic storm simulation results. Of these,16,765 affect <strong>Florida</strong>. Given the high resolution <strong>of</strong> the stochastic storm database,the contribution to the error in loss cost estimates induced by the samplingprocess is negligible.Disclosure1. Describe the sampling plan used to obtain the average annual loss costs and outputranges. For a direct Monte Carlo simulation, indicate steps taken to determine samplesize. For importance sampling design, describe the underpinnings <strong>of</strong> the design.USWIND estimates loss costs using a Latin Hypercube technique. Theprimary storm (e.g. radius, forward speed, and filling rate) and site (e.g.friction, gust factor) parameters are all random variables in the model.128
The <strong>Florida</strong> Commission on Hurricane Loss Projection MethodologyStatistical StandardsS-5 Replication <strong>of</strong> Known Hurricane LossesThe model shall estimate incurred losses in an unbiased manner on asufficient body <strong>of</strong> past hurricane events from more than one company,including the most current data available to the modeling organization.This standard applies separately to personal residential and, to the extentdata are available, to commercial residential. Personal residentialexperience may be used to replicate structure-only and contents-onlylosses. The replications shall be produced on an objective body <strong>of</strong> lossdata by county or an appropriate level <strong>of</strong> geographic detail and shallinclude loss data from both 2004 and 2005.USWIND reasonably replicates incurred losses on a sufficient body <strong>of</strong> pasthurricane events, including the most current data available to <strong>EQECAT</strong>, whichincludes 2004 and 2005 data.Disclosures1. Describe the nature and results <strong>of</strong> the analyses performed to validate the lossprojections generated by the model for personal and commercial residentialseparately. Include analyses for the 2004 and 2005 hurricane seasons.Overall reasonability/validity checks on historical storm estimates andexpected annual loss estimates are continuously conducted on portfoliosreceived from our clients.Some <strong>of</strong> the validation comparisons performed is summarized in Form S-4.2. Provide a completed Form S-4, Validation Comparisons. Provide a link to thelocation <strong>of</strong> the form here.See Form S-4 at Appendix #5.129
The <strong>Florida</strong> Commission on Hurricane Loss Projection MethodologyStatistical StandardsS-6 Comparison <strong>of</strong> Projected Hurricane Loss CostsThe difference, due to uncertainty, between historical and modeled annualaverage statewide loss costs shall be reasonable, given the body <strong>of</strong> data,by established statistical expectations and norms.The difference, due to uncertainty, between historical and modeled annualaverage statewide loss costs is statistically reasonable, as shown in theinformation provided below.Disclosures1. Describe the nature and results <strong>of</strong> the tests performed to validate the expected lossprojections generated. If a set <strong>of</strong> simulated hurricanes or simulation trials was usedto determine these loss projections, specify the convergence tests that were used andthe results. Specify the number <strong>of</strong> hurricanes or trials that were used.The results <strong>of</strong> our model were validated by checking each component <strong>of</strong> themodel separately. We took the following steps to validate the hazardcomponent:a) Ensure that the frequency <strong>of</strong> the simulated storms matches againsthistorical landfall frequency.b) Compare USWIND return period wind speed estimates by landfalllocation against other substantive research in this area.Steps a) and b) were used as the reasonability check for the hazardfrequency (number <strong>of</strong> landfalls per year) and severity (expected wind speedsto be experienced every x years).Given reasonability <strong>of</strong> the hazard component <strong>of</strong> the model, loss estimateswere compared to actual losses sustained by specific insurance companies.In addition, comparisons <strong>of</strong> statewide expected annual loss versus theaverage <strong>of</strong> all historical events impacting <strong>Florida</strong> in this century werecompared in order to validate estimated losses.The expected annual loss estimates produced by USWIND are furtherchecked for reasonability against alternative methods <strong>of</strong> obtaining the sameresults. Such methods include Monte Carlo simulations, analyses basedsolely on historical storms and actuarial techniques, and alternative methodsusing NHRS and historical frequency rates.Relativities <strong>of</strong> the expected annual loss estimates by geographic territory andby construction type have also been evaluated to ensure reasonableness.130
The <strong>Florida</strong> Commission on Hurricane Loss Projection MethodologyStatistical StandardsConvergence tests were also performed in order to ensure that USWINDproduces stable results and that additional detail (i.e., simulated storms)would not significantly alter the result. The basis for our expected annual lossestimates is the modeling <strong>of</strong> 32,032 storms.2. Identify and justify differences, if any, in how the model produces loss costs forspecific historical events versus loss costs for events in the stochastic hurricane set.There are no differences in how the model produces loss costs for specifichistorical events versus loss costs for events in the stochastic hurricane set.3. Provide a completed Form S-5, Average Annual Zero Deductible <strong>State</strong>wide LossCosts – Historical versus <strong>Model</strong>ed. Provide a link to the location <strong>of</strong> the form here.See Form S-5 at Appendix #5.131
The <strong>Florida</strong> Commission on Hurricane Loss Projection MethodologyComputer StandardsComputer StandardsC-1 DocumentationA. <strong>Model</strong> functionality and technical descriptions shall be documentedformally in an archival format separate from the use <strong>of</strong> letters, slides,and unformatted text files.<strong>EQECAT</strong> maintains an archive <strong>of</strong> model functionality and technicaldescriptions separate from the use <strong>of</strong> letters, slides, and unformatted text files.B. The modeling organization shall maintain a primary document binder,containing a complete set <strong>of</strong> documents specifying the model structure,detailed s<strong>of</strong>tware description, and functionality. Development <strong>of</strong> eachsection shall be indicative <strong>of</strong> accepted s<strong>of</strong>tware engineering practices.<strong>EQECAT</strong> maintains all such documentation, and will have it available to thepr<strong>of</strong>essional team during the on-site visit.C. All computer s<strong>of</strong>tware (i.e., user interface, scientific, engineering,actuarial, data preparation, and validation) relevant to the submissionshall be consistently documented and dated.<strong>EQECAT</strong> maintains all such documentation, and will have it available to thepr<strong>of</strong>essional team during the on-site visit.D. The modeling organization shall maintain (1) a table <strong>of</strong> all changes in themodel from the previously accepted submission to the initialsubmission this year and (2) a table <strong>of</strong> all substantive changes sincethis year’s initial submission.<strong>EQECAT</strong> maintains such a table that provides all changes from the previouslyaccepted submission to the initial submission and all substantive changessince this year’s initial submission.E. Documentation shall be created separately from the source code.<strong>EQECAT</strong> maintains all such documentation, and will have it available to thepr<strong>of</strong>essional team during the on-site visit.132
The <strong>Florida</strong> Commission on Hurricane Loss Projection MethodologyComputer StandardsC-2 RequirementsThe modeling organization shall maintain a complete set <strong>of</strong> requirementsfor each s<strong>of</strong>tware component as well as for each database or data fileaccessed by a component. Requirements shall be updated wheneverchanges are made to the model.<strong>EQECAT</strong> maintains such requirements and documentation, and will have itavailable to the pr<strong>of</strong>essional team during the on-site visit. <strong>EQECAT</strong> updates therelevant requirements documentation whenever changes are made to the model.Disclosure1. Provide a description <strong>of</strong> the documentation for interface, human factors, functionality,documentation, data, human and material resources, security, and quality assurance.<strong>EQECAT</strong> maintains a set <strong>of</strong> documents describing the specifications andproduct requirements for user interfaces, database schema, clientcustomizations, security considerations, user manuals, and references.The above documentation will be available to the pr<strong>of</strong>essional team duringthe on-site visit.133
The <strong>Florida</strong> Commission on Hurricane Loss Projection MethodologyComputer StandardsC-3 <strong>Model</strong> Architecture and Component DesignThe modeling organization shall maintain and document (1) detailedcontrol and data flow diagrams and interface specifications for eachs<strong>of</strong>tware component, and (2) schema definitions for each database anddata file. Documentation shall be to the level <strong>of</strong> components that makesignificant contributions to the model output.The design levels <strong>of</strong> the s<strong>of</strong>tware have been documented, including s<strong>of</strong>twarecomponents and interfaces, data files, and database elements. Thisdocumentation will be shown to the pr<strong>of</strong>essional team during the on-site visit.134
The <strong>Florida</strong> Commission on Hurricane Loss Projection MethodologyComputer StandardsC-4 ImplementationA. The modeling organization shall maintain a complete procedure <strong>of</strong>coding guidelines consistent with accepted s<strong>of</strong>tware engineeringpractices.<strong>EQECAT</strong> maintains such a procedure.B. The modeling organization shall maintain a complete procedure used increating, deriving, or procuring and verifying databases or data filesaccessed by components.<strong>EQECAT</strong> maintains such a procedure.C. All components shall be traceable, through explicit componentidentification in the flow diagrams, down to the code level.All components are traceable in this manner.D. The modeling organization shall maintain a table <strong>of</strong> all s<strong>of</strong>twarecomponents affecting loss costs, with the following table columns: (1)Component name, (2) Number <strong>of</strong> lines <strong>of</strong> code, minus blank andcomment lines; and (3) Number <strong>of</strong> explanatory comment lines.This table will be available for review by the pr<strong>of</strong>essional team.E. Each component shall be sufficiently and consistently commented sothat a s<strong>of</strong>tware engineer unfamiliar with the code shall be able tocomprehend the component logic at a reasonable level <strong>of</strong> abstraction.Yes, the source code is commented in this manner. Also, <strong>EQECAT</strong> maintainslive intranet source code documentation for the analysis engines. The model isbased upon published research modified as appropriate by <strong>EQECAT</strong>’smeteorological, engineering, and statistical personnel. System data isorganized and maintained in tables, binary files, or flat files, depending uponthe type <strong>of</strong> analysis. The underlying model including algorithm implementationand technical assumptions along with the procedures used for updating thesystem data will be available for review by the pr<strong>of</strong>essional team during theon-site visit. The overall system design has been implemented using standards<strong>of</strong>tware engineering techniques. System documentation is maintained todefine critical system functionality in terms <strong>of</strong> Data Flow Diagrams, StructureCharts, and the corresponding narratives which describe how each modulefunctions. This information is available for on-site review.135
The <strong>Florida</strong> Commission on Hurricane Loss Projection MethodologyComputer StandardsF. The modeling organization shall maintain the following documentationfor all components or data modified by items identified in Standard G-1,Disclosures 5:1. A list <strong>of</strong> all equations and formulas used in documentation <strong>of</strong> themodel with definitions <strong>of</strong> all terms and variables.This list will be available for review by the pr<strong>of</strong>essional team.2. A cross-referenced list <strong>of</strong> implementation source code terms andvariable names corresponding to items within F.1.This list will be available for review by the pr<strong>of</strong>essional team.Disclosure1. Specify the hardware, operating system, other s<strong>of</strong>tware, and all computer languagesrequired to use the model.Details regarding the required hardware, operating system, and other s<strong>of</strong>twareare given in Standard G-1, Disclosure 2. The calculational components <strong>of</strong> themodel have been developed in C++; other components have been developed inC++ and Java.136
The <strong>Florida</strong> Commission on Hurricane Loss Projection MethodologyComputer StandardsC-5 VerificationA. GeneralFor each component, the modeling organization shall maintainprocedures for verification, such as code inspections, reviews,calculation crosschecks, and walkthroughs, sufficient to demonstratecode correctness. Verification procedures shall include tests performedby modeling organization personnel other than the original componentdevelopers.The models have been extensively tested to verify that calculated results areconsistent with the intended simulation approach. A variety <strong>of</strong> methods havebeen employed. These include algorithm verification through comparison toindependently developed s<strong>of</strong>tware packages, hand calculations, andsensitivity analyses. Much <strong>of</strong> this verification is performed by personnel otherthan the original component developers.Extensive validation testing <strong>of</strong> the s<strong>of</strong>tware generated wind fields has beenperformed to confirm that generated wind speeds are consistent withobservations. Numerous analyses have been conducted using actualinsurance portfolio data to confirm the reasonableness <strong>of</strong> resulting answers.B. Component Testing1. The modeling organization shall use testing s<strong>of</strong>tware to assist indocumenting and analyzing all components.Testing s<strong>of</strong>tware is used to assist in documenting and analyzing allcomponents.2. Unit tests shall be performed and documented for each component.Unit tests have been performed and documented for each component relevantto residential hurricane loss costs in <strong>Florida</strong>.3. Regression tests shall be performed and documented on incrementalbuilds.A suite <strong>of</strong> automated regression tests is regularly run on the s<strong>of</strong>tware toensure integrity <strong>of</strong> the various components as well as the results produced bythe integrated system.Quality assurance documentation includes a description for each test casefrom the regression testing suite.4. Aggregation tests shall be performed and documented to ensure thecorrectness <strong>of</strong> all model components. Sufficient testing shall beperformed to ensure that all components have been executed at leastonce.137
The <strong>Florida</strong> Commission on Hurricane Loss Projection MethodologyComputer StandardsA suite <strong>of</strong> automated regression tests is regularly run on the s<strong>of</strong>tware toensure integrity <strong>of</strong> the various components as well as the results produced bythe integrated system.C. Data Testing1. The modeling organization shall use testing s<strong>of</strong>tware to assist indocumenting and analyzing all databases and data files accessed bycomponents.Testing s<strong>of</strong>tware is used to assist in documenting and analyzing alldatabases and data files accessed by components.2. The modeling organization shall perform and document integrity,consistency, and correctness checks on all databases and data filesaccessed by the components.Client data is extensively tested during the import process into the <strong>EQECAT</strong>system to confirm its accuracy. Field level validation is performed to confirmthat every data element within each record falls within known ranges. Datanot falling within known ranges is marked as an error or a warning in a logdepending upon the severity <strong>of</strong> the problem. Child/parent and other keyrelationships are also checked. A summary log is displayed at the end <strong>of</strong>import process denoting the number records which have warnings or errors.Disclosures1. <strong>State</strong> whether two executions <strong>of</strong> the model with no changes in input data, parameters,code, and seeds <strong>of</strong> random number generators produce the same loss costs and probablemaximum loss levels.Yes, they produce the same loss costs and probable maximum loss levels.2. Provide an overview <strong>of</strong> the component testing procedures.A suite <strong>of</strong> automated regression tests is regularly run on the s<strong>of</strong>tware toensure integrity <strong>of</strong> the various components as well as the correctness andconsistency <strong>of</strong> results produced by the integrated system.138
The <strong>Florida</strong> Commission on Hurricane Loss Projection MethodologyComputer StandardsC-6 <strong>Model</strong> Maintenance and RevisionA. The modeling organization shall maintain a clearly written policy formodel revision, including verification and validation <strong>of</strong> revisedcomponents, databases, and data files.<strong>EQECAT</strong> has a clearly written policy for model revision with respect tomethodologies and data, including verification and validation <strong>of</strong> revisedcomponents, databases, and data files.B. A revision to any portion <strong>of</strong> the model that results in a change in any<strong>Florida</strong> residential hurricane loss cost shall result in a new modelversion number.A revision to any portion <strong>of</strong> the model that results in a change in any <strong>Florida</strong>residential hurricane loss cost results in a new model version number.C. The modeling organization shall use tracking s<strong>of</strong>tware to identify allerrors, as well as modifications to code, data, and documentation.<strong>EQECAT</strong> uses tracking s<strong>of</strong>tware to identify all errors, as well as modificationsto code, data, and documentation.<strong>EQECAT</strong>’s policies and procedures for model revision will be made availableto the pr<strong>of</strong>essional team during the on-site visit.D. The modeling organization shall maintain a list <strong>of</strong> all model versionssince the initial submission for this year. Each model description shallhave a unique version identification, and a list <strong>of</strong> additions, deletions,and changes that define that version.<strong>EQECAT</strong> maintains such a list <strong>of</strong> all model versions since the initialsubmission for the year. Each model description has a unique versionidentification with a list <strong>of</strong> additions, deletions, and changes that define thatversion.Disclosure1. Identify procedures used to maintain code, data, and documentation.<strong>EQECAT</strong> has a series <strong>of</strong> ISO procedures regarding the maintenance <strong>of</strong> code,data, and documentation, and these will be made available to the pr<strong>of</strong>essionalteam.2. Describe the rules underlying the model and code revision numbering system.<strong>EQECAT</strong> produces a major release <strong>of</strong> its s<strong>of</strong>tware (including Risk Quantificationand Engineering TM (RQE)) approximately annually. Between such major139
The <strong>Florida</strong> Commission on Hurricane Loss Projection MethodologyComputer Standardsreleases <strong>EQECAT</strong> sometimes produces interim releases, generally to updateone or more models within RQE, to provide additional s<strong>of</strong>tware functionality, orto provide other enhancements or corrections. Version numbers for majorreleases are <strong>of</strong> the form Risk Quantification and Engineering TM M.X, e.g. RiskQuantification and Engineering TM 13.00. Version numbers for interim releasesappend an additional two-digit number, e.g. Risk Quantification andEngineering TM 13.00.01.The <strong>EQECAT</strong> <strong>Florida</strong> Hurricane model is contained in both our standalones<strong>of</strong>tware USWIND and our client-server s<strong>of</strong>tware RQE. The <strong>Florida</strong> Hurricanemodel version number is included on all output reports produced by RQE. Anychange in <strong>Florida</strong> residential hurricane loss costs results in a new versionnumber <strong>of</strong> the <strong>EQECAT</strong> <strong>Florida</strong> Hurricane model.For example, the initial submission under the 2011 standards is for the<strong>EQECAT</strong> <strong>Florida</strong> Hurricane <strong>Model</strong> 2013. The version number is designated bythe year <strong>of</strong> completion. If subsequent model revisions occur, the versionnumbers would have a letter appended after the year (2013a, 2013b, etc.)140
The <strong>Florida</strong> Commission on Hurricane Loss Projection MethodologyComputer StandardsC-7 SecurityThe modeling organization shall have implemented and fully documentedsecurity procedures for: (1) secure access to individual computers wherethe s<strong>of</strong>tware components or data can be created or modified, (2) secureoperation <strong>of</strong> the model by clients, if relevant, to ensure that the corrects<strong>of</strong>tware operation cannot be compromised, (3) anti-virus s<strong>of</strong>twareinstallation for all machines where all components and data are beingaccessed, and (4) secure access to documentation, s<strong>of</strong>tware, and data inthe event <strong>of</strong> a catastrophe.In accordance with standard industry practices, <strong>EQECAT</strong> has in place securityprocedures for access to code, data, and documentation, including disastercontingency, and for maintenance <strong>of</strong> anti-virus s<strong>of</strong>tware on all machines wherecode and data are accessed. Procedures are also in place to ensure thatlicensees <strong>of</strong> the model cannot compromise the correct operation <strong>of</strong> the s<strong>of</strong>tware.These procedures will be made available to the pr<strong>of</strong>essional team during the onsitevisit.Disclosure1. Describe methods used to ensure the security and integrity <strong>of</strong> the code, data, anddocumentation.The model can only be used by authorized users. Authorized user accounts arecreated by a trusted administrator. The program files <strong>of</strong> the model are in machinecode and cannot be reverse engineered or tampered with. The data files(vulnerability curves, hazard etc.) are in binary format and cannot be tamperedwith. The output from the model is always labeled with the analysis parametersand other information needed to repeat a particular analysis - thus, reports <strong>of</strong> theprogram cannot be misused or altered to present incorrect information.141
The <strong>Florida</strong> Commission on Hurricane Loss Projection MethodologyAppendix 1 – Forms in General StandardsAppendix 1 – Forms in General Standards142
The <strong>Florida</strong> Commission on Hurricane Loss Projection MethodologyAppendix 1 – Forms in General StandardsForm G-1: General Standards Expert CertificationI hereby certify that I have reviewed the current submission <strong>of</strong> <strong>EQECAT</strong> <strong>Florida</strong> Hurricane<strong>Model</strong> 2013a for compliance with the 2011 Standards adopted by the <strong>Florida</strong> Commission onHurricane Loss Projection Methodology and hereby certify that:1) The model meets the General Standards (G1 – G5);2) The disclosures and forms related to the General Standards section are editorially andtechnically accurate, reliable, unbiased, and complete;3) My review was completed in accordance with the pr<strong>of</strong>essional standards and code <strong>of</strong>ethical conduct for my pr<strong>of</strong>ession;4) My review involved ensuring the consistency <strong>of</strong> the content in all sections <strong>of</strong> thesubmission; and5) In expressing my opinion I have not been influenced by any other party in order to bias orprejudice my opinion.NOTE: A facsimile or any properly reproduced signature will be acceptable to meet thisrequirement.143
The <strong>Florida</strong> Commission on Hurricane Loss Projection MethodologyAppendix 1 – Forms in General StandardsForm G-2: Meteorological Standards Expert CertificationI hereby certify that I have reviewed the current submission <strong>EQECAT</strong> <strong>Florida</strong> Hurricane <strong>Model</strong>2013a for compliance with the 2011 Standards adopted by the <strong>Florida</strong> Commission on HurricaneLoss Projection Methodology and hereby certify that:1) The model meets the Meteorological Standards (M1 – M6);2) The disclosures and forms related to the Meteorological Standards section are editoriallyand technically accurate, reliable, unbiased, and complete;3) My review was completed in accordance with the pr<strong>of</strong>essional standards and code <strong>of</strong>ethical conduct for my pr<strong>of</strong>ession; and4) In expressing my opinion I have not been influenced by any other party in order to bias orprejudice my opinion.NOTE: A facsimile or any properly reproduced signature will be acceptable to meet thisrequirement.144
The <strong>Florida</strong> Commission on Hurricane Loss Projection MethodologyAppendix 1 – Forms in General StandardsForm G-3: Vulnerability Standards Expert CertificationI hereby certify that I have reviewed the current submission <strong>of</strong> <strong>EQECAT</strong> <strong>Florida</strong> Hurricane<strong>Model</strong> 2013a for compliance with the 2011 Standards adopted by the <strong>Florida</strong> Commission onHurricane Loss Projection Methodology and hereby certify that:1) The model meets the Vulnerability Standards (V1 – V3);2) The disclosures and forms related to the Vulnerability Standards section are editoriallyand technically accurate, reliable, unbiased, and complete;3) My review was completed in accordance with the pr<strong>of</strong>essional standards and code <strong>of</strong>ethical conduct for my pr<strong>of</strong>ession; and4) In expressing my opinion I have not been influenced by any other party in order to bias orprejudice my opinion.NOTE: A facsimile or any properly reproduced signature will be acceptable to meet thisrequirement.145
The <strong>Florida</strong> Commission on Hurricane Loss Projection MethodologyAppendix 1 – Forms in General StandardsForm G-4: Actuarial Standards Expert CertificationI hereby certify that I have reviewed the current submission <strong>of</strong> <strong>EQECAT</strong> <strong>Florida</strong> Hurricane<strong>Model</strong> 2013a for compliance with the 2011 Standards adopted by the <strong>Florida</strong> Commission onHurricane Loss Projection Methodology and hereby certify that:1) The model meets the Actuarial Standards (A1 – A6);2) The disclosures and forms related to the Actuarial Standards section are editorially andtechnically accurate, reliable, unbiased, and complete;3) My review was completed in accordance with the pr<strong>of</strong>essional standards and code <strong>of</strong>ethical conduct for my pr<strong>of</strong>ession; and4) In expressing my opinion I have not been influenced by any other party in order to bias orprejudice my opinion.NOTE: A facsimile or any properly reproduced signature will be acceptable to meet thisrequirement.146
The <strong>Florida</strong> Commission on Hurricane Loss Projection MethodologyAppendix 1 – Forms in General StandardsForm G-5: Statistical Standards Expert CertificationI hereby certify that I have reviewed the current submission <strong>of</strong> <strong>EQECAT</strong> <strong>Florida</strong> Hurricane<strong>Model</strong> 2013a for compliance with the 2011 Standards adopted by the <strong>Florida</strong> Commission onHurricane Loss Projection Methodology and hereby certify that:1) The model meets the Statistical Standards (S1 – S6);2) The disclosures and forms related to the Statistical Standards section are editorially andtechnically accurate, reliable, unbiased, and complete;3) My review was completed in accordance with the pr<strong>of</strong>essional standards and code <strong>of</strong>ethical conduct for my pr<strong>of</strong>ession; and4) In expressing my opinion I have not been influenced by any other party in order to bias orprejudice my opinion.NOTE: A facsimile or any properly reproduced signature will be acceptable to meet thisrequirement.147
The <strong>Florida</strong> Commission on Hurricane Loss Projection MethodologyAppendix 1 – Forms in General StandardsForm G-6: Computer Standards Expert CertificationI hereby certify that I have reviewed the current submission <strong>of</strong> <strong>EQECAT</strong> <strong>Florida</strong> Hurricane<strong>Model</strong> 2013a for compliance with the 2011 Standards adopted by the <strong>Florida</strong> Commission onHurricane Loss Projection Methodology and hereby certify that:1) The model meets the Computer Standards (C1 – C7);2) The disclosures and forms related to the Computer Standards section are editorially andtechnically accurate, reliable, unbiased, and complete;3) My review was completed in accordance with the pr<strong>of</strong>essional standards and code <strong>of</strong>ethical conduct for my pr<strong>of</strong>ession; and4) In expressing my opinion I have not been influenced by any other party in order to bias orprejudice my opinion.NOTE: A facsimile or any properly reproduced signature will be acceptable to meet thisrequirement.148
The <strong>Florida</strong> Commission on Hurricane Loss Projection MethodologyAppendix 1 – Forms in General StandardsForm G-7: Editorial CertificationI/We hereby certify that I/we have reviewed the current submission <strong>of</strong> <strong>EQECAT</strong> <strong>Florida</strong>Hurricane <strong>Model</strong> 2013a for compliance with the “Process for Determining the Acceptability <strong>of</strong> aComputer Simulation <strong>Model</strong>” adopted by the <strong>Florida</strong> Commission on Hurricane Loss ProjectionMethodology in its Report <strong>of</strong> Activities as <strong>of</strong> December 31, 2011, and hereby certify that:1) The model submission is in compliance with the Commission’s Notification Requirements and GeneralStandard G-5;2) The disclosures and forms related to each standards section are editorially accurate and contain completeinformation and any changes that have been made to the submission during the review process have beenreviewed for completeness, for grammatical correctness, and for typographical errors;3) There are no incomplete responses, inaccurate citations, charts or graphs, or extraneous text or references;4) The current version <strong>of</strong> the model submission has been reviewed for grammatical correctness, typographicalerrors, completeness, the exclusion <strong>of</strong> extraneous data/information and is otherwise acceptable forpublication; and5) In expressing my/our opinion I/we have not been influenced by any other party in order to bias or prejudicemy/our opinion.NOTE: A facsimile or any properly reproduced signature will be acceptable to meet thisrequirement.149
The <strong>Florida</strong> Commission on Hurricane Loss Projection MethodologyAppendix 2 – Forms in Meteorological StandardsAppendix 2 – Forms in Meteorological Standards150
The <strong>Florida</strong> Commission on Hurricane Loss Projection MethodologyAppendix 2 – Forms in Meteorological StandardsForm M-1: Annual Occurrence RatesA. Provide annual occurrence rates for landfall from the data set defined by marine exposurethat the model generates by hurricane category (defined by maximum windspeed at landfallin the Saffir-Simpson scale) for the entire state <strong>of</strong> <strong>Florida</strong> and selected regions as defined inFigure 26 below. List the annual occurrence rate per hurricane category. Annual occurrencerates shall be rounded to two decimal places. The historical frequencies below have beenderived from the Base Hurricane Storm Set as defined in Standard M-1.See the tables in this form.B. Describe model variations from the historical frequencies.<strong>Model</strong> variations from the historical frequencies are primarily due to the sparsenessin the historical data. The development <strong>of</strong> the stochastic event set has includedsmoothing this data, resulting in what we believe is the best estimate <strong>of</strong> hurricanefrequencies by location and intensity.C. Provide vertical bar graphs depicting distributions <strong>of</strong> hurricane frequencies by category byregion <strong>of</strong> <strong>Florida</strong> (Figure 26 below) and for the neighboring states <strong>of</strong> Alabama/Mississippiand Georgia. For the neighboring states, statistics based on the closest milepost to the stateboundaries used in the model are adequate.See Figure 27 in this form.D. If the data are partitioned or modified, provide the historical annual occurrence rates for theapplicable partition (and its complement) or modification as well as the modeled annualoccurrence rates in additional copies <strong>of</strong> Form M-1.The data have not been partitioned or modified.E. List all hurricanes added, removed, or modified from the previously accepted submissionversion <strong>of</strong> the Base Hurricane Storm Set.The base storm set has been updated to reflect the reanalysis that has beenperformed by the Hurricane Research Division on the 1926-1935 hurricanes. Inaddition to the 1926-1935 hurricane seasons, a few storms between 1900 and 1925have been reanalyzed by the Hurricane Research Division after the 2009 HURDATrelease. These storms include the following: NoName4-1901, NoName-06-1915,NoName-06-1921, NoName-04-1925 (removed due to downgrade to tropical stormat <strong>Florida</strong>’s landfall), NoName-01-1926, NoName-07-1926, NoName-10-1926,NoName-01-1928, NoName-04-1928, NoName-02-1929, NoName-03-1932,NoName-05-1933, NoName-02-1935, NoName-06-1935.F. Provide this form in Excel format. The file name shall include the abbreviated name <strong>of</strong> themodeling organization, the standards year, and the form name. A hard copy <strong>of</strong> Form M-1shall be included in a submission appendix.151
The <strong>Florida</strong> Commission on Hurricane Loss Projection MethodologyAppendix 2 – Forms in Meteorological Standards<strong>Model</strong>ed Annual Occurrence RatesEntire <strong>State</strong>Region A – NW <strong>Florida</strong>Historical <strong>Model</strong>ed Historical <strong>Model</strong>edCategory Number Rate Number Rate Number Rate Number Rate1 25 0.23 30 0.27 13 0.12 13 0.122 12 0.11 14 0.12 4 0.04 7 0.063 17 0.15 15 0.14 6 0.05 4 0.044 8 0.07 8 0.08 0 0.00 1 0.015 2 0.02 1 0.01 0 0.00 0 0.00Region B – SW <strong>Florida</strong>Region C – SE <strong>Florida</strong>Historical <strong>Model</strong>ed Historical <strong>Model</strong>edCategory Number Rate Number Rate Number Rate Number Rate1 7 0.06 5 0.05 6 0.05 9 0.082 1 0.01 3 0.03 5 0.05 6 0.053 4 0.04 7 0.06 7 0.06 6 0.054 3 0.03 3 0.03 5 0.05 6 0.055 1 0.01 0 0.00 1 0.01 1 0.01Region D – NE <strong>Florida</strong><strong>Florida</strong> By-Passing HurricanesHistorical <strong>Model</strong>ed Historical <strong>Model</strong>edCategory Number Rate Number Rate Number Rate Number Rate1 1 0.01 2 0.02 7 0.06 4 0.042 3 0.03 1 0.01 7 0.06 2 0.023 0 0.00 0 0.00 4 0.04 3 0.034 0 0.00 0 0.00 0 0.00 1 0.015 0 0.00 0 0.00 0 0.00 1 0.01Region E – GeorgiaRegion F – Alabama/MississippiHistorical <strong>Model</strong>ed Historical <strong>Model</strong>edCategory Number Rate Number Rate Number Rate Number Rate1 4 0.04 2 0.02 7 0.06 4 0.042 0 0.00 1 0.01 4 0.04 2 0.023 0 0.00 0 0.00 5 0.05 3 0.034 0 0.00 0 0.00 1 0.01 1 0.015 0 0.00 0 0.00 1 0.01 0 0.00Note: Except where specified, Number <strong>of</strong> Hurricanes does not include By-Passing Hurricanes. Eachtime a hurricane goes from water to land (once per region) it is counted as a landfall in that region.However, each hurricane is counted only once in the Entire <strong>State</strong> totals. Hurricanes recorded foradjacent states need not have reported damaging winds in <strong>Florida</strong>.152
The <strong>Florida</strong> Commission on Hurricane Loss Projection MethodologyAppendix 2 – Forms in Meteorological Standards(FORM M-1 CONTINUED)81.45 W 30.71 N87.55 W 30.27 NFigure 26. <strong>State</strong> <strong>of</strong> <strong>Florida</strong> and Neighboring <strong>State</strong>s by Region153
The <strong>Florida</strong> Commission on Hurricane Loss Projection MethodologyAppendix 2 – Forms in Meteorological StandardsFigure 27. Hurricane Frequencies by Category by Region154
The <strong>Florida</strong> Commission on Hurricane Loss Projection MethodologyAppendix 2 – Forms in Meteorological StandardsForm M-2: Maps <strong>of</strong> Maximum WindsA. Provide color maps <strong>of</strong> the maximum winds for the modeled version <strong>of</strong> the Base HurricaneStorm Set for land use as set for open terrain and land use set for actual terrain as defined bythe modeling organization.See Figure 28 in this form.B. Provide color maps <strong>of</strong> the maximum winds for a 100-year and a 250-year return period fromthe stochastic storm set for both open terrain and actual terrain.See Figures 29 and 30 in this form.C. Provide the maximum winds plotted on each contour map and plot their location.Actual terrain is the roughness distribution used in the standard version <strong>of</strong> the model. Openterrain uses the same roughness value <strong>of</strong> 0.03 meters at all land points.All maps shall be color coded at the ZIP Code level.Maximum winds in these maps are defined as the maximum one-minute sustained winds over theterrain as modeled and recorded at each location.The same color scheme and increments shall be used for all maps.Use the following seven isotach values and interval color coding:(1) 50 mph Blue(2) 65 mph Medium Blue(3) 80 mph Light Blue(4) 95 mph White(5) 110 mph Light Red(6) 125 mph Medium Red(7) 140 mph RedContouring in addition to these isotach values may be included.The maximum historical windspeed plotted is 173 mph and 175 mph for actual andopen terrain respectively; the maximum stochastic windspeed for the 100-year returnperiod is 135 mph and 139 mph for actual and open terrain respectively. The maximumstochastic windspeed for the 250-year return period is 153 mph and 156 mph for actualand open terrain respectively. Locations <strong>of</strong> maximum windspeed are marked with agreen star.155
The <strong>Florida</strong> Commission on Hurricane Loss Projection MethodologyAppendix 2 – Forms in Meteorological Standards(FORM M-2 CONTINUED)a)b)Figure 28. Contour Map - Maximum Winds For <strong>Model</strong>ed Version Of Base HurricaneStorm Set for actual terrain (a) and open terrain (b). Wind Speeds Are One-MinuteSustained mph. Locations <strong>of</strong> maximum windspeed are marked with a green star.156
The <strong>Florida</strong> Commission on Hurricane Loss Projection MethodologyAppendix 2 – Forms in Meteorological Standards(FORM M-2 CONTINUED)a)b)Figure 29. Contour Map - Maximum Winds For 100-Year Return Period From StochasticStorm Set for actual terrain (a) and open terrain (b). Wind Speeds Are One-MinuteSustained mph. Locations <strong>of</strong> maximum windspeed are marked with a green star.157
The <strong>Florida</strong> Commission on Hurricane Loss Projection MethodologyAppendix 2 – Forms in Meteorological Standards(FORM M-2 CONTINUED)a)b)Figure 30. Contour Map - Maximum Winds For 250-Year Return Period From StochasticStorm Set for actual terrain (a) and open terrain (b). Wind Speeds Are One-MinuteSustained mph. Locations <strong>of</strong> maximum windspeed are marked with a green star.158
The <strong>Florida</strong> Commission on Hurricane Loss Projection MethodologyAppendix 2 – Forms in Meteorological StandardsForm M-3: Radius <strong>of</strong> Maximum Winds andRadii <strong>of</strong> Standard Wind ThresholdsA. For the central pressures in the table below, provide the minimum and maximum values for(1) the radius <strong>of</strong> maximum winds (Rmax) used by the model to create the stochastic storm set,and the minimum and maximum values for the outer radii (R) <strong>of</strong> (2) Category 3 winds (>110mph), (3) Category 1 winds (>73 mph), and (4) gale force winds (>40 mph). Thisinformation should be readily calculated from the windfield formula input to the model anddoes not require running the stochastic storm set. Describe the procedure used to completethis Form.CentralPressure (mb)Rmax(mi)Outer Radii(>110 mph)(mi)Outer Radii(>73 mph)(mi)Outer Radii(>40 mph)(mi)Min Max Min Max Min Max Min Max990 6 69 n/a n/a 7 94 20 400980 6 68 n/a n/a 11 136 29 493970 6 68 11 51 14 177 41 566960 6 68 7 75 16 215 42 612950 6 68 11 91 21 247 53 651940 6 68 14 116 25 293 67 704930 6 67 12 130 24 311 60 740920 4 62 16 121 29 283 75 601910 4 27 15 73 29 158 71 365900 4 20 12 53 26 112 56 219B. Identify the other variables that influence Rmax.For a given hurricane, central pressure is the only variable that influences Rmax.C. Provide a box plot and histogram <strong>of</strong> Central Pressure (x-axis) versus Rmax (y-axis) todemonstrate relative populations and continuity <strong>of</strong> sampled hurricanes in the stochasticstorm set.A box plot <strong>of</strong> Rmax vs. Central Pressure is provided in Figure 31 in this form.Histograms are provided in Figure 32 in this form.159
Radius to Maximum Winds (miles)The <strong>Florida</strong> Commission on Hurricane Loss Projection MethodologyAppendix 2 – Forms in Meteorological Standards706050403020100900 910 920 930 940 950 960 970 980 990Central Pressure (mb)Figure 31. Rmax vs. Central Pressure – Box plot160
Frequency (%)The <strong>Florida</strong> Commission on Hurricane Loss Projection MethodologyAppendix 2 – Forms in Meteorological Standards(a)45403530Frequency (%)252015105(b)03560Rmax (Miles)302520151050900 910 920 930 940 950 960 970 980 990Central Pressure (mb)Figure 32. Rmax and Central Pressure – Histograms. Histogram for Rmax is presentedin panel (a); histogram for Central Pressure is presented in panel (b).D. Provide this form in Excel format. The file name shall include the abbreviated name <strong>of</strong> themodeling organization, the standards year, and the form name. A hard copy <strong>of</strong> Form M-3shall be included in a submission appendix.161
The <strong>Florida</strong> Commission on Hurricane Loss Projection MethodologyAppendix 3 – Forms in Vulnerability StandardsAppendix 3 – Forms in Vulnerability Standards162
The <strong>Florida</strong> Commission on Hurricane Loss Projection MethodologyAppendix 3 – Forms in Vulnerability StandardsForm V-1: One Hypothetical EventA. Wind speeds for 335 ZIP Codes and sample personal and commercial residential exposuredata are provided in the file named “FormV1Input11.xls.” The wind speeds and ZIP Codesrepresent a hypothetical hurricane track. <strong>Model</strong> the sample personal and commercialresidential exposure data provided in the file named against these windspeeds at thespecified ZIP Codes and provide the damage ratios summarized by windspeed (mph) andconstruction type.The windspeeds provided are one-minute sustained 10-meter wind speeds. The samplepersonal and commercial residential exposure data provided consists <strong>of</strong> four structures (one<strong>of</strong> each construction type – wood frame, masonry, mobile home, and concrete) individuallyplaced at the population centroid <strong>of</strong> each <strong>of</strong> the ZIP Codes provided. Each ZIP Code issubjected to a specific windspeed. For completing Part A, Estimated Damage for eachindividual windspeed range is the sum <strong>of</strong> ground up loss to all structures in the ZIP Codessubjected to that individual windspeed range, excluding demand surge and storm surge.Subject Exposure is all exposures in the ZIP Codes subjected to that individual windspeedrange. For completing Part B, Estimated Damage is the sum <strong>of</strong> the ground up loss to allstructures <strong>of</strong> a specific type (wood frame, masonry, mobile home, or concrete) in all <strong>of</strong> thewind speed ranges, excluding demand surge and storm surge. Subject Exposure is allexposures <strong>of</strong> that specific type in all <strong>of</strong> the ZIP Codes.One reference structure for each <strong>of</strong> the construction types shall be placed at the populationcentroid <strong>of</strong> the ZIP Codes. Do not include contents, appurtenant structures, or time elementcoverages.Reference Frame Structure:One storyUnbraced gable end ro<strong>of</strong>Normal shingles (55mph)½” plywood deck6d nails, deck to ro<strong>of</strong> membersToe nail truss to wall anchorWood framed exterior walls5/8” diameter anchors at 48” centers forwall/floor/foundation connectionsNo shuttersStandard glass windowsNo door coversNo skylight coversConstructed in 1980Reference Masonry Structure:One storyUnbraced gable end ro<strong>of</strong>Normal shingles (55mph)½” plywood deck6d nails, deck to ro<strong>of</strong> membersToe nail truss to wall anchorMasonry exterior wallsNo vertical wall reinforcingNo shuttersStandard glass windowsNo door coversNo skylight coversConstructed in 1980163
The <strong>Florida</strong> Commission on Hurricane Loss Projection MethodologyAppendix 3 – Forms in Vulnerability StandardsReference Mobile Home Structure:Tie downsSingle unitManufactured in 1980Reference Concrete Structure:Twenty storyEight apartment units per storyNo shuttersStandard glass windowsConstructed in 1980B. Confirm that the structures used in completing the Form are identical to those in the abovetable for the reference structures. If additional assumptions are necessary to complete thisForm (for example, regarding structural characteristics, duration or surface roughness),provide the reasons why the assumptions were necessary as well as a detailed description <strong>of</strong>how they were included.The structures used in completing the Form are identical to those in the above table.The input one-minute sustained 10-meter wind speeds were assumed to be overlandand were converted to peak gust wind speeds.164
The <strong>Florida</strong> Commission on Hurricane Loss Projection MethodologyAppendix 3 – Forms in Vulnerability StandardsForm V-1: One Hypothetical EventPart AWindspeed (mph)Estimated Damage/Subject Exposure41 – 50 0.15%51 – 60 0.33%61 – 70 0.96%71 – 80 1.87%81 – 90 3.64%91 – 100 6.94%101 – 110 11.50%111 – 120 23.78%121 – 130 33.29%131 – 140 49.43%141 – 150 62.64%151 – 160 69.31%161 – 170 75.93%Part BConstruction TypeEstimated Damage/Subject ExposureWood Frame 7.36%Masonry 6.45%Mobile Home 10.35%Concrete 1.89%165
The <strong>Florida</strong> Commission on Hurricane Loss Projection MethodologyAppendix 3 – Forms in Vulnerability StandardsC. Provide a plot <strong>of</strong> the Form V-1, Part A data.A plot <strong>of</strong> the Form V-1 Part A data is provided in Figure 33 below.Figure 33. Plot <strong>of</strong> Form V-1 Part A data.166
The <strong>Florida</strong> Commission on Hurricane Loss Projection MethodologyAppendix 3 – Forms in Vulnerability StandardsForm V-2: Mitigation Measures – Range <strong>of</strong> Changes in DamageA. Provide the change in the zero deductible personal residential reference structure damagerate (not loss cost) for each individual mitigation measure listed in Form V-2 as well as forthe combination <strong>of</strong> the four mitigation measures provided for the Mitigated Frame Structureand the Mitigated Masonry Structure below.B. If additional assumptions are necessary to complete this Form (for example, regardingduration or surface roughness), provide the rationale for the assumptions as well as adetailed description <strong>of</strong> how they are included.The year <strong>of</strong> construction is a primary structural characteristic that is used in conjunction withthe construction type and location to define a series <strong>of</strong> default secondary structuralcharacteristics. Any explicitly specified secondary structural characteristics, e.g. thecharacteristics provided by the Commission for this form, override these defaults. Note thatthis represents a change relative to the prior submission, in which the model did not defineany such defaults. This information will be available for the closed meeting.C. Provide this Form in Excel format without truncation. The file name shall include theabbreviated name <strong>of</strong> the modeling organization, the standards year, and the form name. Ahard copy <strong>of</strong> Form V-2 shall be included in a submission appendix.Reference Frame Structure:One storyUnbraced gable end ro<strong>of</strong>Normal shingles (55mph)½” plywood deck6d nails, deck to ro<strong>of</strong> membersToe nail truss to wall anchorWood framed exterior walls5/8” diameter anchors at 48” centers forwall/floor/foundation connectionsNo shuttersStandard glass windowsNo door coversNo skylight coversConstructed in 1980Mitigated Frame Structure:Rated shingles (110mph)8d nails, deck to ro<strong>of</strong> membersTruss straps at ro<strong>of</strong>Plywood ShuttersReference Masonry Structure:One storyUnbraced gable end ro<strong>of</strong>Normal shingles (55mph)½” plywood deck6d nails, deck to ro<strong>of</strong> membersToe nail truss to wall anchorMasonry exterior wallsNo vertical wall reinforcingNo shuttersStandard glass windowsNo door coversNo skylight coversConstructed in 1980Mitigated Masonry Structure:Rated shingles (110mph)8d nails, deck to ro<strong>of</strong> membersTruss straps at ro<strong>of</strong>Plywood Shutters167
The <strong>Florida</strong> Commission on Hurricane Loss Projection MethodologyAppendix 3 – Forms in Vulnerability StandardsReference and mitigated structures are fully insured structures with a zero deductible policy asindicated under “Owners” Policy Type for Form A-6.Place the reference structure at the population centroid for ZIP Code 33921 located in LeeCounty.Windspeeds used in the Form are one-minute sustained 10-meter windspeeds168
The <strong>Florida</strong> Commission on Hurricane Loss Projection MethodologyAppendix 3 – Forms in Vulnerability StandardsForm V-2: Mitigation Measures – Range <strong>of</strong> Changes in DamageROOFSTRENGTHROOFCOVERINGROOF-WALLSTRENGTHWALL-FLOORSTRENGTHWALL-FOUNDATIONSTRENGTHOPENINGPROTECTIONWINDOW,DOOR,SKYLIGHTSTRENGTHINDIVIDUALMITIGATION MEASURESPERCENTAGE CHANGES IN DAMAGE*(REFERENCE DAMAGE RATE - MITIGATED DAMAGE RATE) /REFERENCE DAMAGE RATE * 100FRAME STRUCTUREMASONRY STRUCTUREWINDSPEED (MPH)WINDSPEED (MPH)60 85 110 135 160 60 85 110 135 160REFERENCE STRUCTURE 0 0 0 0 0 0 0 0 0 0BRACED GABLE ENDS 15.2% 15.1% 12.9% 10.5% 5.1% 11.9% 12.2% 10.7% 8.8% 5.6%HIP ROOF 19.7% 19.4% 16.6% 13.6% 6.7% 16.6% 17.1% 15.0% 12.3% 7.9%METAL -2.5% -2.5% -2.2% -1.7% -0.8% -2.4% -2.4% -2.1% -1.8% -1.1%RATED SHINGLES (110 MPH) 7.6% 7.6% 6.5% 5.2% 2.5% 4.8% 4.9% 4.3% 3.5% 2.3%MEMBRANE 2.5% 2.5% 2.2% 1.7% 0.8% 0.0% 0.0% 0.0% 0.0% 0.0%NAILING OF DECK 8d 2.5% 2.5% 2.2% 1.7% 0.8% 0.0% 0.0% 0.0% 0.0% 0.0%CLIPS 0.0% 0.0% 0.0% 0.0% 0.0% 0.0% 0.0% 0.0% 0.0% 0.0%STRAPS 0.0% 0.0% 0.0% 0.0% 0.0% 0.0% 0.0% 0.0% 0.0% 0.0%TIES OR CLIPS 5.1% 5.0% 4.3% 3.5% 1.7% 9.5% 9.8% 8.6% 7.0% 4.5%STRAPS 5.1% 5.0% 4.3% 3.5% 1.7% 9.5% 9.8% 8.6% 7.0% 4.5%LARGER ANCHORSOR CLOSER SPACING0.0% 0.0% 0.0% 0.0% 0.0% - - - - -STRAPS 5.1% 5.0% 4.3% 3.5% 1.7% - - - - -VERTICAL REINFORCING - - - - - - - - - -WINDOW PLYWOOD 12.7% 12.6% 10.8% 8.7% 4.2% 9.5% 9.8% 8.6% 7.0% 4.5%SHUTTERS STEEL 12.7% 12.6% 10.8% 8.7% 4.2% 9.5% 9.8% 8.6% 7.0% 4.5%ENGINEERED 19.7% 19.4% 16.6% 13.6% 6.7% 16.6% 17.1% 15.0% 12.3% 7.9%DOOR AND SKYLIGHT COVERS 21.6% 21.1% 18.2% 14.9% 7.4% 19.0% 19.5% 17.2% 14.1% 9.0%WINDOWS LAMINATED 10.1% 10.1% 8.6% 7.0% 3.4% 7.1% 7.3% 6.4% 5.3% 3.4%MITIGATION MEASURES INCOMBINATIONIMPACT GLASS 10.1% 10.1% 8.6% 7.0% 3.4% 7.1% 7.3% 6.4% 5.3% 3.4%PERCENTAGE CHANGES IN DAMAGE*(REFERENCE DAMAGE RATE - MITIGATED DAMAGE RATE) /REFERENCE DAMAGE RATE * 100FRAME STRUCTUREMASONRY STRUCTUREWINDSPEED (MPH)WINDSPEED (MPH)60 85 110 135 160 60 85 110 135 160STRUCTURE MITIGATED STRUCTURE 31.4% 30.0% 26.0% 21.6% 11.1% 28.9% 28.8% 25.5% 21.2% 13.9%* Note: Larger or closer spaced anchor bolts: not currently distinguished in the model, as other aspects are deemed more important; also difficultto ascertain vertical reinforcing for masonry walls: this feature is accounted for through the selection <strong>of</strong> the base structure; vertically reinforcedmasonry walls are considered by the <strong>EQECAT</strong> model as Reinforced Masonry (RM).The input one-minute sustained 10-meter wind speeds were assumed to be over-water and were converted to over-land peak gust wind speedsusing the minimum direction-dependent roughness length for the ZIP Code centroid and the model’s standard gust factor formulation.169
The <strong>Florida</strong> Commission on Hurricane Loss Projection MethodologyAppendix 4 – Forms in Actuarial StandardsAppendix 4 – Forms in Actuarial Standards170
The <strong>Florida</strong> Commission on Hurricane Loss Projection MethodologyAppendix 4 – Forms in Actuarial StandardsForm A-1: Zero Deductible Personal ResidentialLoss Costs by ZIP CodeA. Provide three maps, color-coded by ZIP Code (with a minimum <strong>of</strong> 6 value ranges),displaying zero deductible personal residential loss costs per $1,000 <strong>of</strong> exposure for frame,masonry, and mobile home.Thematic maps displaying zero deductible loss costs by 5-digit ZIP Code forframe, masonry, and mobile home are provided in Figures 34 to 36.Figure 34. Ground-up Loss Costs for Frame Structures171
The <strong>Florida</strong> Commission on Hurricane Loss Projection MethodologyAppendix 4 – Forms in Actuarial Standards(FORM A-1 CONTINUED)Figure 35. Ground-up Loss Costs for Masonry Structures172
The <strong>Florida</strong> Commission on Hurricane Loss Projection MethodologyAppendix 4 – Forms in Actuarial Standards(FORM A-1 CONTINUED)Figure 36. Ground-up Loss Costs for Mobile Home StructuresB. Create exposure sets for these exhibits by modeling all <strong>of</strong> the structures from Notional Set 3described in the file “NotionalInput11.xlsx” geocoded to each ZIP Code centroid in thestate, as provided in the model. Refer to the Notional Policy Specification below foradditional modeling information. Explain any assumptions, deviations, and differences fromthe prescribed exposure information.C. Provide the underlying loss cost data rounded to 3 decimal places used for A. above in Exceland PDF format. The file name shall include the abbreviated name <strong>of</strong> the modelingorganization, the standards year, and the form name.173
The <strong>Florida</strong> Commission on Hurricane Loss Projection MethodologyAppendix 4 – Forms in Actuarial StandardsNotional Policy SpecificationsPolicy TypeOwnersAssumptionsCoverage A = Structure Replacement Cost included subject to Coverage A limit Ordinance or Law not includedCoverage B = Appurtenant Structures Replacement Cost included subject to Coverage B limit Ordinance or Law not includedCoverage C = Contents Replacement Cost included subject to Coverage C limitCoverage D = Time Element Time Limit = 12 months Per Diem = $150.00/day per policy, if used Loss costs per $1,000 shall be related to the Coverage A limit. Loss costs for the various specified deductibles shall be determinedbased on annual deductibles. All-other perils deductible shall be $500.Mobile HomeCoverage A = Structure Replacement Cost included subject to Coverage A limitCoverage B = Appurtenant Structures Replacement Cost included subject to Coverage B limitCoverage C = Contents Replacement Cost included subject to Coverage C limitCoverage D = Time Element Time Limit = 12 months Per Diem = $150.00/day per policy, if used Loss costs per $1,000 shall be related to the Coverage A limit. Loss costs for the various specified deductibles shall be determinedbased on annual deductibles. All-other perils deductible shall be $500.This information is provided in the file 2011FormA1_<strong>EQECAT</strong>_16April2013.xls.174
The <strong>Florida</strong> Commission on Hurricane Loss Projection MethodologyAppendix 4 – Forms in Actuarial StandardsForm A-2: Base Hurricane Storm <strong>State</strong>wide Loss CostsA. Provide the total insured loss and the dollar contribution to the average annual lossassuming personal residential zero deductible policies from each specific hurricane in theBase Hurricane Storm Set, as defined in Standard M-1, for the 2007 <strong>Florida</strong> HurricaneCatastrophe Fund’s aggregate personal and commercial residential exposure data found inthe file named “hlpm2007c.exe.”The table below contains the minimum number <strong>of</strong> hurricanes from HURDAT to be includedin the Base Hurricane Storm Set. Each hurricane has been assigned an ID number.Additional hurricanes included in the model’s Base Hurricane Storm Set shall be added tothe table below and assigned an ID number as the hurricane falls within the given IDnumbers.B. Provide this form in Excel format. The file name shall include the abbreviated name <strong>of</strong> themodeling organization, the standards year, and the form name. A hard copy <strong>of</strong> Form A-2shall be included in a submission appendix.FORM A-2: BASE HURRICANE STORM SET AVERAGE ANNUAL ZERODEDUCTIBLE STATEWIDE LOSS COSTSID Date Year Name Total PersonalResidential andCommercial InsuredLosses ($1000s)175Dollar Contribution($1000s)005 8/15/1901 1901 NoName 4-1901 220,302 1,967010 9/12/1903 1903 NoName 3-1903 3,378,570 30,166015 10/17/1904 1904 NoName 3-1904 739,418 6,602020 6/18/1906 1906 NoName 2-1906 2,619,728 23,390025 9/27/1906 1906 NoName 6-1906 1,116,420 9,968030 10/17/1906 1906 NoName 8-1906 2,169,458 19,370035 10/11/1909 1909 NoName 10-1909 1,249,863 11,159040 10/17/1910 1910 NoName 5-1910 9,350,740 83,489045 8/12/1911 1911 NoName 2-1911 409,715 3,658050 9/14/1912 1912 NoName 4-1912 42,239 377055 8/1/1915 1915 NoName 1-1915 430,301 3,842060 9/4/1915 1915 NoName 4-1915 124,098 1,108065 7/6/1916 1916 NoName 2-1916 709,497 6,335070 10/18/1916 1916 NoName 14-1916 805,819 7,195075 9/29/1917 1917 NoName 4-1917 2,693,077 24,045080 9/10/1919 1919 NoName 2-1919 7,119,718 63,569085 10/25/1921 1921 NoName 6-1921 8,869,270 79,190090 9/15/1924 1924 NoName 4-1924 58,889 526095 10/21/1924 1924 NoName 7-1924 936,246 8,359100 12/1/1925 1925 NoName 2-1925 381,242 3,404105 7/28/1926 1926 NoName 1-1926 2,066,807 18,454110 9/18/1926 1926 NoName 6-1926 60,322,447 538,593111 10/21/1926 1926 NoName 10-1926 2,760,891 24,651115 8/8/1928 1928 NoName 1-1928 2,491,825 22,248
The <strong>Florida</strong> Commission on Hurricane Loss Projection MethodologyAppendix 4 – Forms in Actuarial StandardsID Date Year Name Total PersonalResidential andCommercial InsuredLosses ($1000s)176Dollar Contribution($1000s)120 9/17/1928 1928 NoName 4-1928 34,013,512 303,692125 9/28/1929 1929 NoName 2-1929 6,142,814 54,847130 9/1/1932 1932 NoName 3-1932 461,363 4,119135 7/30/1933 1933 NoName 5-1933 378,186 3,377140 9/4/1933 1933 NoName 12-1933 8,941,523 79,835145 9/3/1935 1935 NoName 2-1935 27,796,780 248,186150 11/4/1935 1935 NoName 6-1935 2,101,684 18,765155 7/31/1936 1936 NoName 5-1936 1,249,243 11,154160 8/11/1939 1939 NoName 2-1939 926,328 8,271165 10/6/1941 1941 NoName 5-1941 12,682,188 113,234170 10/19/1944 1944 NoName 11-1944 10,541,515 94,121175 6/24/1945 1945 NoName 1-1945 1,092,976 9,759180 9/16/1945 1945 NoName 9-1945 14,140,183 126,252185 10/8/1946 1946 NoName 5-1946 886,928 7,919190 9/17/1947 1947 NoName 4-1947 47,420,142 423,394195 10/12/1947 1947 NoName 8-1947 1,491,199 13,314200 9/22/1948 1948 NoName 7-1948 2,319,222 20,707205 10/5/1948 1948 NoName 8-1948 587,463 5,245210 8/27/1949 1949 NoName 2-1949 17,904,304 159,860215 8/31/1950 1950 Baker-1950 181,027 1,616220 9/5/1950 1950 Easy-1950 8,677,466 77,477225 10/18/1950 1950 King-1950 7,185,388 64,155230 9/26/1953 1953 Florence-1953 370,509 3,308235 9/25/1956 1956 Flossy-1956 620,560 5,541240 9/10/1960 1960 Donna-1960 13,213,267 117,976245 8/27/1964 1964 Cleo-1964 5,075,172 45,314250 9/10/1964 1964 Dora-1964 2,820,497 25,183255 10/14/1964 1964 Isbell-1964 5,431,671 48,497260 9/8/1965 1965 Betsy-1965 6,689,392 59,727265 6/9/1966 1966 Alma-1966 588,892 5,258270 10/4/1966 1966 Inez-1966 346,929 3,098275 10/19/1968 1968 Gladys-1968 1,925,653 17,193280 6/19/1972 1972 Agnes-1972 69,292 619285 9/23/1975 1975 Eloise-1975 868,764 7,757290 9/4/1979 1979 David-1979 4,513,439 40,299295 9/13/1979 1979 Frederic-1979 570,806 5,096300 9/2/1985 1985 Elena-1985 2,379,533 21,246305 11/21/1985 1985 Kate-1985 342,261 3,056310 10/21/1987 1987 Floyd-1987 48,044 429315 8/24/1992 1992 Andrew-1992 26,012,262 232,252320 8/2/1995 1995 Erin-1995 1,111,301 9,922325 10/4/1995 1995 Opal-1995 1,417,346 12,655330 7/19/1997 1997 Danny-1997 143,515 1,281335 9/3/1998 1998 Earl-1998 151,384 1,352340 9/28/1998 1998 Georges-1998 411,131 3,671345 10/15/1999 1999 Irene-1999 2,990,013 26,697
The <strong>Florida</strong> Commission on Hurricane Loss Projection MethodologyAppendix 4 – Forms in Actuarial StandardsID Date Year Name Total PersonalResidential andCommercial InsuredLosses ($1000s)Dollar Contribution($1000s)350 8/13/2004 2004 Charley-2004 11,140,505 99,469355 9/5/2004 2004 Frances-2004 9,114,416 81,379360 9/16/2004 2004 Ivan-2004 4,804,349 42,896365 9/26/2004 2004 Jeanne-2004 8,779,055 78,384370 7/10/2005 2005 Dennis-2005 1,353,756 12,087375 8/26/2005 2005 Katrina-2005 2,017,879 18,017380 9/21/2005 2005 Rita-2005 176,350 1,575385 10/24/2005 2005 Wilma-2005 12,850,378 114,736Other hurricanesincluded…032 9/21/1909 1909 NoName 9-1909 119,004 1,063141 10/5/1933 1933 NoName 18-1933 614,983 5,491143 6/16/1934 1934 NoName 1-1934 16,235 145241 9/15/1960 1960 Ethel-1960 5,540 49276 8/18/1969 1969 Camille-1969 33,131 296299 9/25/1985 1985 Bob-1985 110,860 990379 9/8/2005 2005 Ophelia-2005 151,695 1,354Total 3,996,319Note: Total dollar contributions should agree with the total average annual zero deductiblestatewide loss costs provided in Form S-5 for current year.177
The <strong>Florida</strong> Commission on Hurricane Loss Projection MethodologyAppendix 4 – Forms in Actuarial StandardsForm A-3: Cumulative Losses from the 2004 Hurricane SeasonA. Provide the percentage <strong>of</strong> total residential zero deductible cumulative losses, rounded to fourdecimal places, from Hurricane Charley (2004), Hurricane Frances (2004), Hurricane Ivan(2004), and Hurricane Jeanne (2004) for each affected ZIP Code. Include all ZIP Codeswhere losses are equal to or greater than $500,000.Use the 2007 <strong>Florida</strong> Hurricane Catastrophe Fund’s aggregate personal and commercialresidential exposure data found in “hlpm2007c.exe”.Rather than using directly a specified published windfield, the winds underlying the loss costcalculations must be produced by the model being evaluated and should be the samehurricane parameters as used in completing Form A-2.See the table below.B. Provide maps color-coded by ZIP Code depicting the percentage <strong>of</strong> total residential lossesfrom each hurricane, Hurricane Charley (2004), Hurricane Frances (2004), Hurricane Ivan(2004), and Hurricane Jeanne (2004) and for the cumulative losses using the followinginterval coding:Red Over 5%Light Red 2% to 5%Pink 1% to 2%Light Pink 0.5% to 1%Light Blue 0.2% to 0.5%Medium Blue 0.1% to 0.2%Blue Below 0.1%See Figures 37 to 41 in this form.C. Provide this Form in Excel format. The file name shall include the abbreviated name <strong>of</strong> themodeling organization, the standards year, and the form name. A hard copy <strong>of</strong> Form A-3shall be included in a submission appendix.178
The <strong>Florida</strong> Commission on Hurricane Loss Projection MethodologyAppendix 4 – Forms in Actuarial Standards(FORM A-3 CONTINUED)FORM A-3: CUMULATIVE LOSSES FROM THE 2004 HURRICANE SEASONZIP CodePersonal andCommercial ResidentialMonetary Contribution($1000s)179Percent <strong>of</strong> Losses (%)32003 5,714 0.02%32008 747 0.00%32011 737 0.00%32024 3,388 0.01%32025 2,188 0.01%32033 1,177 0.00%32034 6,605 0.02%32038 1,600 0.00%32040 548 0.00%32043 4,202 0.01%32052 524 0.00%32054 1,088 0.00%32055 2,274 0.01%32060 2,964 0.01%32063 538 0.00%32065 2,747 0.01%32068 3,936 0.01%32071 614 0.00%32073 5,416 0.02%32080 17,841 0.05%32082 22,932 0.07%32084 7,940 0.02%32086 9,800 0.03%32091 1,454 0.00%32092 4,267 0.01%32095 2,704 0.01%32097 1,014 0.00%32102 1,308 0.00%32110 2,179 0.01%32112 1,328 0.00%32113 1,419 0.00%32114 13,224 0.04%32117 14,763 0.04%32118 37,699 0.11%32119 25,250 0.08%32124 2,250 0.01%32127 41,201 0.12%32128 20,076 0.06%32129 16,284 0.05%32130 2,545 0.01%32131 1,180 0.00%32132 8,188 0.02%32134 1,028 0.00%
The <strong>Florida</strong> Commission on Hurricane Loss Projection MethodologyAppendix 4 – Forms in Actuarial StandardsZIP CodePersonal and Percent <strong>of</strong> Losses (%)Commercial ResidentialMonetary Contribution($1000s)32136 9,074 0.03%32137 31,089 0.09%32139 578 0.00%32141 25,884 0.08%32145 1,242 0.00%32148 1,469 0.00%32159 56,485 0.17%32162 61,367 0.18%32164 18,855 0.06%32168 25,284 0.08%32169 34,999 0.10%32174 58,975 0.18%32176 29,361 0.09%32177 2,795 0.01%32179 3,219 0.01%32180 1,030 0.00%32181 582 0.00%32189 1,057 0.00%32195 2,960 0.01%32204 648 0.00%32205 3,515 0.01%32206 1,002 0.00%32207 3,936 0.01%32208 1,979 0.01%32209 1,452 0.00%32210 4,421 0.01%32211 2,726 0.01%32216 3,388 0.01%32217 2,500 0.01%32218 3,836 0.01%32219 605 0.00%32220 923 0.00%32221 1,950 0.01%32222 697 0.00%32223 4,551 0.01%32224 5,102 0.02%32225 8,651 0.03%32226 1,986 0.01%32233 4,591 0.01%32244 3,917 0.01%32246 4,084 0.01%32250 7,429 0.02%32254 674 0.00%32256 4,210 0.01%32257 4,543 0.01%32258 2,797 0.01%180
The <strong>Florida</strong> Commission on Hurricane Loss Projection MethodologyAppendix 4 – Forms in Actuarial StandardsZIP CodePersonal and Percent <strong>of</strong> Losses (%)Commercial ResidentialMonetary Contribution($1000s)32259 5,339 0.02%32266 2,685 0.01%32277 3,059 0.01%32301 5,113 0.02%32302 708 0.00%32303 8,096 0.02%32304 2,830 0.01%32305 1,781 0.01%32308 5,901 0.02%32309 6,762 0.02%32310 1,861 0.01%32311 3,162 0.01%32312 8,752 0.03%32317 2,948 0.01%32320 1,684 0.01%32322 1,001 0.00%32327 2,303 0.01%32328 4,672 0.01%32333 1,421 0.00%32340 1,145 0.00%32344 1,689 0.01%32346 830 0.00%32347 1,688 0.01%32348 1,310 0.00%32351 1,561 0.00%32401 11,095 0.03%32404 15,095 0.05%32405 13,647 0.04%32407 11,730 0.04%32408 38,790 0.12%32409 3,687 0.01%32410 1,921 0.01%32411 652 0.00%32413 33,715 0.10%32420 690 0.00%32421 523 0.00%32425 2,860 0.01%32428 3,580 0.01%32431 883 0.00%32433 9,680 0.03%32435 2,074 0.01%32438 576 0.00%32439 7,256 0.02%32440 1,397 0.00%32443 537 0.00%32444 10,614 0.03%181
The <strong>Florida</strong> Commission on Hurricane Loss Projection MethodologyAppendix 4 – Forms in Actuarial StandardsZIP CodePersonal and Percent <strong>of</strong> Losses (%)Commercial ResidentialMonetary Contribution($1000s)32446 1,892 0.01%32448 1,230 0.00%32455 1,004 0.00%32456 8,001 0.02%32459 54,546 0.16%32461 1,726 0.01%32462 811 0.00%32464 788 0.00%32465 831 0.00%32466 1,603 0.00%32501 80,799 0.24%32502 15,855 0.05%32503 275,605 0.82%32504 206,620 0.62%32505 89,052 0.27%32506 155,658 0.46%32507 233,370 0.70%32508 2,442 0.01%32514 188,079 0.56%32526 147,818 0.44%32530 1,280 0.00%32531 6,592 0.02%32533 105,798 0.32%32534 46,570 0.14%32535 6,888 0.02%32536 22,854 0.07%32539 19,945 0.06%32541 116,224 0.35%32542 970 0.00%32547 68,796 0.21%32548 61,412 0.18%32549 526 0.00%32550 76,024 0.23%32561 363,320 1.08%32563 224,525 0.67%32564 2,389 0.01%32565 12,306 0.04%32566 184,769 0.55%32567 1,400 0.00%32568 4,836 0.01%32569 73,566 0.22%32570 90,359 0.27%32571 128,601 0.38%32577 15,409 0.05%32578 104,646 0.31%32579 38,528 0.12%182
The <strong>Florida</strong> Commission on Hurricane Loss Projection MethodologyAppendix 4 – Forms in Actuarial StandardsZIP CodePersonal and Percent <strong>of</strong> Losses (%)Commercial ResidentialMonetary Contribution($1000s)32580 8,353 0.02%32583 97,359 0.29%32601 1,948 0.01%32605 6,211 0.02%32606 5,383 0.02%32607 4,982 0.01%32608 7,068 0.02%32609 2,065 0.01%32615 3,213 0.01%32617 1,280 0.00%32618 1,343 0.00%32619 797 0.00%32621 1,175 0.00%32625 1,257 0.00%32626 1,635 0.00%32640 2,311 0.01%32641 1,261 0.00%32643 2,184 0.01%32653 3,636 0.01%32656 2,863 0.01%32666 1,615 0.00%32667 1,050 0.00%32668 2,303 0.01%32669 2,859 0.01%32680 998 0.00%32686 1,775 0.01%32693 1,736 0.01%32696 2,967 0.01%32701 21,653 0.06%32702 1,272 0.00%32703 46,569 0.14%32707 40,981 0.12%32708 60,570 0.18%32709 2,411 0.01%32712 58,023 0.17%32713 17,604 0.05%32714 34,341 0.10%32720 20,222 0.06%32724 23,370 0.07%32725 35,666 0.11%32726 24,014 0.07%32730 5,090 0.02%32732 6,772 0.02%32735 4,815 0.01%32736 8,324 0.02%32738 35,930 0.11%183
The <strong>Florida</strong> Commission on Hurricane Loss Projection MethodologyAppendix 4 – Forms in Actuarial StandardsZIP CodePersonal and Percent <strong>of</strong> Losses (%)Commercial ResidentialMonetary Contribution($1000s)32744 2,084 0.01%32746 53,350 0.16%32750 32,085 0.10%32751 43,907 0.13%32754 15,015 0.04%32757 27,818 0.08%32759 4,021 0.01%32763 11,160 0.03%32764 2,881 0.01%32765 60,062 0.18%32766 21,674 0.06%32767 1,077 0.00%32771 40,604 0.12%32773 21,025 0.06%32775 511 0.00%32776 8,004 0.02%32777 642 0.00%32778 33,716 0.10%32779 66,547 0.20%32780 58,317 0.17%32784 7,228 0.02%32789 76,604 0.23%32792 48,853 0.15%32796 29,264 0.09%32798 8,053 0.02%32801 14,936 0.04%32803 41,320 0.12%32804 42,685 0.13%32805 16,634 0.05%32806 58,107 0.17%32807 27,901 0.08%32808 41,791 0.12%32809 36,700 0.11%32810 33,396 0.10%32811 24,850 0.07%32812 47,229 0.14%32814 9,202 0.03%32817 30,116 0.09%32818 51,281 0.15%32819 93,218 0.28%32820 10,621 0.03%32821 26,717 0.08%32822 51,953 0.16%32824 55,484 0.17%32825 54,078 0.16%32826 19,701 0.06%184
The <strong>Florida</strong> Commission on Hurricane Loss Projection MethodologyAppendix 4 – Forms in Actuarial StandardsZIP CodePersonal and Percent <strong>of</strong> Losses (%)Commercial ResidentialMonetary Contribution($1000s)32827 16,693 0.05%32828 63,526 0.19%32829 25,848 0.08%32832 30,277 0.09%32833 14,602 0.04%32835 73,737 0.22%32836 63,929 0.19%32837 90,931 0.27%32839 28,521 0.09%32901 63,172 0.19%32903 88,454 0.26%32904 83,780 0.25%32905 95,798 0.29%32907 138,295 0.41%32908 34,268 0.10%32909 104,443 0.31%32920 25,615 0.08%32922 13,501 0.04%32926 33,431 0.10%32927 34,581 0.10%32931 71,121 0.21%32934 53,631 0.16%32935 98,151 0.29%32937 115,380 0.34%32940 102,223 0.31%32948 11,301 0.03%32949 20,087 0.06%32950 29,785 0.09%32951 155,266 0.46%32952 56,430 0.17%32953 39,109 0.12%32955 75,767 0.23%32957 2,503 0.01%32958 250,099 0.75%32960 110,046 0.33%32961 1,085 0.00%32962 111,799 0.33%32963 471,977 1.41%32964 1,404 0.00%32966 125,925 0.38%32967 107,112 0.32%32968 78,645 0.23%32969 554 0.00%32970 1,302 0.00%32976 224,795 0.67%33004 4,917 0.01%185
The <strong>Florida</strong> Commission on Hurricane Loss Projection MethodologyAppendix 4 – Forms in Actuarial StandardsZIP CodePersonal and Percent <strong>of</strong> Losses (%)Commercial ResidentialMonetary Contribution($1000s)33009 16,541 0.05%33010 4,577 0.01%33012 9,752 0.03%33013 4,860 0.01%33014 9,127 0.03%33015 14,692 0.04%33016 9,028 0.03%33018 9,714 0.03%33019 10,597 0.03%33020 10,293 0.03%33021 20,218 0.06%33023 17,261 0.05%33024 25,965 0.08%33025 16,387 0.05%33026 16,353 0.05%33027 20,217 0.06%33028 12,800 0.04%33029 28,726 0.09%33030 4,435 0.01%33031 2,384 0.01%33032 3,873 0.01%33033 4,456 0.01%33034 1,597 0.00%33035 991 0.00%33036 3,148 0.01%33037 7,646 0.02%33040 12,526 0.04%33042 4,757 0.01%33043 1,952 0.01%33050 4,264 0.01%33051 936 0.00%33054 4,072 0.01%33055 11,066 0.03%33056 7,260 0.02%33060 15,645 0.05%33062 37,794 0.11%33063 36,926 0.11%33064 37,602 0.11%33065 41,825 0.12%33066 18,139 0.05%33067 39,660 0.12%33068 24,599 0.07%33069 14,121 0.04%33070 3,031 0.01%33071 41,960 0.13%33073 21,495 0.06%186
The <strong>Florida</strong> Commission on Hurricane Loss Projection MethodologyAppendix 4 – Forms in Actuarial StandardsZIP CodePersonal and Percent <strong>of</strong> Losses (%)Commercial ResidentialMonetary Contribution($1000s)33076 49,113 0.15%33109 2,792 0.01%33125 4,490 0.01%33126 4,439 0.01%33127 2,476 0.01%33129 5,159 0.02%33130 918 0.00%33131 1,446 0.00%33132 1,071 0.00%33133 13,394 0.04%33134 11,566 0.03%33135 2,741 0.01%33136 802 0.00%33137 2,686 0.01%33138 6,152 0.02%33139 17,935 0.05%33140 17,199 0.05%33141 11,759 0.04%33142 4,579 0.01%33143 12,829 0.04%33144 3,932 0.01%33145 5,233 0.02%33146 6,689 0.02%33147 4,907 0.01%33149 9,474 0.03%33150 2,676 0.01%33154 14,132 0.04%33155 9,084 0.03%33156 18,350 0.05%33157 14,045 0.04%33158 2,938 0.01%33160 19,987 0.06%33161 7,167 0.02%33162 7,391 0.02%33165 10,843 0.03%33166 4,766 0.01%33167 2,835 0.01%33168 3,976 0.01%33169 7,103 0.02%33170 1,914 0.01%33172 4,493 0.01%33173 8,537 0.03%33174 4,349 0.01%33175 12,392 0.04%33176 15,389 0.05%33177 9,529 0.03%187
The <strong>Florida</strong> Commission on Hurricane Loss Projection MethodologyAppendix 4 – Forms in Actuarial StandardsZIP CodePersonal and Percent <strong>of</strong> Losses (%)Commercial ResidentialMonetary Contribution($1000s)33178 9,770 0.03%33179 12,362 0.04%33180 17,637 0.05%33181 4,107 0.01%33182 4,212 0.01%33183 6,776 0.02%33184 4,198 0.01%33185 6,287 0.02%33186 16,784 0.05%33187 4,773 0.01%33189 3,941 0.01%33190 1,226 0.00%33193 8,807 0.03%33194 695 0.00%33196 10,906 0.03%33301 11,392 0.03%33304 9,716 0.03%33305 7,911 0.02%33306 2,869 0.01%33308 27,568 0.08%33309 17,339 0.05%33311 17,652 0.05%33312 23,163 0.07%33313 19,236 0.06%33314 7,637 0.02%33315 6,415 0.02%33316 12,206 0.04%33317 24,554 0.07%33319 28,310 0.08%33321 36,962 0.11%33322 32,903 0.10%33323 15,395 0.05%33324 28,157 0.08%33325 21,991 0.07%33326 25,200 0.08%33327 20,734 0.06%33328 19,477 0.06%33330 14,275 0.04%33331 20,433 0.06%33332 9,098 0.03%33334 13,110 0.04%33351 17,670 0.05%33401 52,552 0.16%33403 18,368 0.05%33404 60,683 0.18%33405 37,942 0.11%188
The <strong>Florida</strong> Commission on Hurricane Loss Projection MethodologyAppendix 4 – Forms in Actuarial StandardsZIP CodePersonal and Percent <strong>of</strong> Losses (%)Commercial ResidentialMonetary Contribution($1000s)33406 39,602 0.12%33407 53,227 0.16%33408 106,059 0.32%33409 44,680 0.13%33410 132,381 0.40%33411 191,627 0.57%33412 75,567 0.23%33413 29,910 0.09%33414 217,625 0.65%33415 63,831 0.19%33417 61,856 0.18%33418 239,183 0.71%33424 1,214 0.00%33425 529 0.00%33426 37,323 0.11%33427 527 0.00%33428 56,604 0.17%33430 18,444 0.06%33431 33,745 0.10%33432 36,627 0.11%33433 67,666 0.20%33434 56,642 0.17%33435 56,618 0.17%33436 115,625 0.35%33437 187,761 0.56%33438 1,821 0.01%33440 32,930 0.10%33441 17,451 0.05%33442 33,398 0.10%33444 24,177 0.07%33445 65,377 0.20%33446 83,041 0.25%33455 124,832 0.37%33458 177,892 0.53%33460 42,504 0.13%33461 51,514 0.15%33462 76,836 0.23%33463 107,580 0.32%33467 212,142 0.63%33469 108,633 0.32%33470 89,603 0.27%33471 13,494 0.04%33475 1,092 0.00%33476 12,230 0.04%33477 117,750 0.35%33478 57,741 0.17%189
The <strong>Florida</strong> Commission on Hurricane Loss Projection MethodologyAppendix 4 – Forms in Actuarial StandardsZIP CodePersonal and Percent <strong>of</strong> Losses (%)Commercial ResidentialMonetary Contribution($1000s)33480 193,521 0.58%33483 47,269 0.14%33484 55,965 0.17%33486 32,327 0.10%33487 50,827 0.15%33493 2,829 0.01%33496 90,351 0.27%33498 37,819 0.11%33510 28,384 0.08%33511 49,563 0.15%33513 6,962 0.02%33514 1,504 0.00%33521 514 0.00%33523 12,432 0.04%33525 28,757 0.09%33527 15,744 0.05%33534 8,858 0.03%33538 3,776 0.01%33540 15,739 0.05%33541 31,973 0.10%33542 25,462 0.08%33543 40,920 0.12%33544 21,401 0.06%33547 25,673 0.08%33548 7,431 0.02%33549 21,445 0.06%33556 32,438 0.10%33558 20,113 0.06%33559 8,528 0.03%33563 19,003 0.06%33565 20,120 0.06%33566 27,241 0.08%33567 16,503 0.05%33569 77,800 0.23%33570 19,185 0.06%33572 31,736 0.09%33573 31,433 0.09%33576 6,563 0.02%33584 29,061 0.09%33585 1,165 0.00%33592 7,373 0.02%33594 100,811 0.30%33597 8,923 0.03%33598 7,706 0.02%33602 11,133 0.03%33603 13,249 0.04%190
The <strong>Florida</strong> Commission on Hurricane Loss Projection MethodologyAppendix 4 – Forms in Actuarial StandardsZIP CodePersonal and Percent <strong>of</strong> Losses (%)Commercial ResidentialMonetary Contribution($1000s)33604 21,822 0.07%33605 8,147 0.02%33606 23,528 0.07%33607 8,704 0.03%33609 19,684 0.06%33610 18,205 0.05%33611 30,301 0.09%33612 19,440 0.06%33613 21,402 0.06%33614 19,632 0.06%33615 26,549 0.08%33616 8,219 0.02%33617 26,367 0.08%33618 27,823 0.08%33619 17,355 0.05%33624 37,317 0.11%33625 16,910 0.05%33626 23,857 0.07%33629 41,513 0.12%33634 11,310 0.03%33635 9,878 0.03%33637 7,560 0.02%33647 47,488 0.14%33701 7,586 0.02%33702 21,219 0.06%33703 22,045 0.07%33704 17,059 0.05%33705 12,213 0.04%33706 26,478 0.08%33707 23,354 0.07%33708 16,060 0.05%33709 10,038 0.03%33710 18,745 0.06%33711 10,856 0.03%33712 13,847 0.04%33713 14,235 0.04%33714 6,693 0.02%33715 18,563 0.06%33716 5,244 0.02%33755 15,693 0.05%33756 22,827 0.07%33759 9,877 0.03%33760 6,332 0.02%33761 15,517 0.05%33762 7,482 0.02%33763 9,384 0.03%191
The <strong>Florida</strong> Commission on Hurricane Loss Projection MethodologyAppendix 4 – Forms in Actuarial StandardsZIP CodePersonal and Percent <strong>of</strong> Losses (%)Commercial ResidentialMonetary Contribution($1000s)33764 17,622 0.05%33765 7,463 0.02%33767 18,264 0.05%33770 19,838 0.06%33771 14,183 0.04%33772 14,851 0.04%33773 9,402 0.03%33774 14,537 0.04%33776 12,249 0.04%33777 10,705 0.03%33778 9,596 0.03%33781 9,473 0.03%33782 10,777 0.03%33785 12,519 0.04%33786 5,310 0.02%33801 63,827 0.19%33802 1,764 0.01%33803 66,179 0.20%33805 26,517 0.08%33809 58,470 0.17%33810 82,504 0.25%33811 37,809 0.11%33812 15,057 0.04%33813 127,358 0.38%33815 12,909 0.04%33820 1,162 0.00%33823 85,128 0.25%33825 150,705 0.45%33827 23,212 0.07%33830 72,107 0.22%33834 12,566 0.04%33835 774 0.00%33837 64,034 0.19%33838 11,889 0.04%33839 7,012 0.02%33840 628 0.00%33841 21,502 0.06%33843 81,441 0.24%33844 117,891 0.35%33846 934 0.00%33847 880 0.00%33848 1,354 0.00%33849 1,021 0.00%33850 20,637 0.06%33851 4,936 0.01%33852 110,876 0.33%192
The <strong>Florida</strong> Commission on Hurricane Loss Projection MethodologyAppendix 4 – Forms in Actuarial StandardsZIP CodePersonal and Percent <strong>of</strong> Losses (%)Commercial ResidentialMonetary Contribution($1000s)33853 64,097 0.19%33855 6,586 0.02%33857 8,815 0.03%33858 714 0.00%33859 51,007 0.15%33860 39,520 0.12%33865 3,049 0.01%33867 1,273 0.00%33868 20,621 0.06%33870 74,840 0.22%33872 131,100 0.39%33873 44,923 0.13%33875 48,129 0.14%33876 20,902 0.06%33877 1,234 0.00%33880 89,604 0.27%33881 100,812 0.30%33884 215,381 0.64%33890 29,696 0.09%33896 19,411 0.06%33897 54,823 0.16%33898 101,376 0.30%33901 28,620 0.09%33903 107,383 0.32%33904 202,938 0.61%33905 30,674 0.09%33907 28,021 0.08%33908 163,189 0.49%33909 90,320 0.27%33912 54,660 0.16%33913 21,467 0.06%33914 448,798 1.34%33916 10,396 0.03%33917 86,147 0.26%33919 82,086 0.25%33920 7,680 0.02%33921 328,401 0.98%33922 125,756 0.38%33924 321,624 0.96%33928 31,569 0.09%33931 115,868 0.35%33932 702 0.00%33935 17,745 0.05%33936 26,098 0.08%33938 1,988 0.01%33945 3,577 0.01%193
The <strong>Florida</strong> Commission on Hurricane Loss Projection MethodologyAppendix 4 – Forms in Actuarial StandardsZIP CodePersonal and Percent <strong>of</strong> Losses (%)Commercial ResidentialMonetary Contribution($1000s)33946 112,154 0.33%33947 102,985 0.31%33948 182,750 0.55%33949 698 0.00%33950 858,367 2.56%33951 910 0.00%33952 331,058 0.99%33953 52,038 0.16%33954 260,315 0.78%33955 174,999 0.52%33956 146,163 0.44%33957 890,483 2.66%33960 2,302 0.01%33966 7,266 0.02%33967 10,068 0.03%33971 24,599 0.07%33972 13,958 0.04%33980 337,920 1.01%33981 129,560 0.39%33982 189,052 0.56%33983 242,250 0.72%33990 133,666 0.40%33991 172,592 0.52%33993 266,247 0.79%34102 46,385 0.14%34103 38,144 0.11%34104 16,716 0.05%34105 24,183 0.07%34108 54,799 0.16%34109 30,462 0.09%34110 40,205 0.12%34112 22,210 0.07%34113 12,121 0.04%34114 9,477 0.03%34116 11,339 0.03%34117 6,901 0.02%34119 32,119 0.10%34120 12,771 0.04%34134 58,377 0.17%34135 47,780 0.14%34142 2,225 0.01%34145 40,298 0.12%34201 6,874 0.02%34202 33,175 0.10%34203 22,574 0.07%34205 13,513 0.04%194
The <strong>Florida</strong> Commission on Hurricane Loss Projection MethodologyAppendix 4 – Forms in Actuarial StandardsZIP CodePersonal and Percent <strong>of</strong> Losses (%)Commercial ResidentialMonetary Contribution($1000s)34207 11,845 0.04%34208 16,823 0.05%34209 27,584 0.08%34210 11,904 0.04%34211 4,912 0.01%34212 20,072 0.06%34215 806 0.00%34216 2,435 0.01%34217 14,341 0.04%34219 20,122 0.06%34221 35,413 0.11%34222 11,727 0.04%34223 176,711 0.53%34224 147,558 0.44%34228 24,407 0.07%34229 12,683 0.04%34231 31,757 0.09%34232 23,200 0.07%34233 13,607 0.04%34234 10,026 0.03%34235 13,745 0.04%34236 19,498 0.06%34237 7,508 0.02%34238 21,164 0.06%34239 14,446 0.04%34240 24,196 0.07%34241 24,250 0.07%34242 23,143 0.07%34243 25,892 0.08%34250 965 0.00%34251 20,678 0.06%34265 1,518 0.00%34266 431,056 1.29%34267 1,712 0.01%34268 1,713 0.01%34269 53,773 0.16%34275 27,150 0.08%34285 28,649 0.09%34286 150,497 0.45%34287 428,084 1.28%34288 69,642 0.21%34289 23,401 0.07%34292 51,369 0.15%34293 91,934 0.27%34420 7,131 0.02%34428 5,050 0.02%195
The <strong>Florida</strong> Commission on Hurricane Loss Projection MethodologyAppendix 4 – Forms in Actuarial StandardsZIP CodePersonal and Percent <strong>of</strong> Losses (%)Commercial ResidentialMonetary Contribution($1000s)34429 7,921 0.02%34431 4,809 0.01%34432 10,412 0.03%34433 4,502 0.01%34434 5,380 0.02%34436 5,864 0.02%34442 14,513 0.04%34446 19,373 0.06%34448 9,126 0.03%34449 772 0.00%34450 7,865 0.02%34452 7,083 0.02%34453 7,618 0.02%34461 7,892 0.02%34465 14,230 0.04%34470 7,386 0.02%34471 12,454 0.04%34472 11,432 0.03%34473 9,647 0.03%34474 8,804 0.03%34475 2,521 0.01%34476 16,176 0.05%34479 4,651 0.01%34480 9,639 0.03%34481 11,870 0.04%34482 8,569 0.03%34484 3,035 0.01%34488 2,974 0.01%34491 34,561 0.10%34601 12,467 0.04%34602 8,594 0.03%34604 6,169 0.02%34606 22,882 0.07%34607 6,338 0.02%34608 24,133 0.07%34609 33,639 0.10%34610 11,768 0.04%34613 20,541 0.06%34614 4,228 0.01%34637 4,135 0.01%34638 15,031 0.04%34639 26,076 0.08%34652 15,627 0.05%34653 17,378 0.05%34654 17,088 0.05%34655 33,807 0.10%196
The <strong>Florida</strong> Commission on Hurricane Loss Projection MethodologyAppendix 4 – Forms in Actuarial StandardsZIP CodePersonal and Percent <strong>of</strong> Losses (%)Commercial ResidentialMonetary Contribution($1000s)34667 24,123 0.07%34668 26,052 0.08%34669 10,572 0.03%34677 16,292 0.05%34681 1,851 0.01%34683 34,607 0.10%34684 22,695 0.07%34685 16,112 0.05%34688 7,896 0.02%34689 21,402 0.06%34690 6,862 0.02%34691 10,475 0.03%34695 16,299 0.05%34698 40,003 0.12%34705 5,486 0.02%34711 133,933 0.40%34714 24,197 0.07%34715 21,993 0.07%34731 14,828 0.04%34734 9,112 0.03%34736 22,695 0.07%34737 6,103 0.02%34739 4,666 0.01%34741 68,437 0.20%34743 70,730 0.21%34744 122,289 0.37%34746 120,597 0.36%34747 78,006 0.23%34748 73,370 0.22%34753 5,159 0.02%34755 1,083 0.00%34756 10,418 0.03%34758 73,794 0.22%34759 81,047 0.24%34760 2,629 0.01%34761 57,950 0.17%34762 1,032 0.00%34769 70,071 0.21%34771 47,757 0.14%34772 79,000 0.24%34773 8,015 0.02%34785 10,702 0.03%34786 160,438 0.48%34787 104,211 0.31%34788 29,067 0.09%34797 3,074 0.01%197
The <strong>Florida</strong> Commission on Hurricane Loss Projection MethodologyAppendix 4 – Forms in Actuarial StandardsZIP CodePersonal and Percent <strong>of</strong> Losses (%)Commercial ResidentialMonetary Contribution($1000s)34945 19,167 0.06%34946 20,356 0.06%34947 38,435 0.11%34949 108,059 0.32%34950 27,388 0.08%34951 103,379 0.31%34952 187,865 0.56%34953 192,341 0.57%34956 13,821 0.04%34957 134,945 0.40%34972 48,664 0.15%34973 595 0.00%34974 141,902 0.42%34981 12,079 0.04%34982 90,392 0.27%34983 123,880 0.37%34984 53,124 0.16%34986 116,928 0.35%34987 21,769 0.06%34990 159,888 0.48%34991 1,279 0.00%34992 565 0.00%34994 58,327 0.17%34996 120,401 0.36%34997 166,487 0.50%198
The <strong>Florida</strong> Commission on Hurricane Loss Projection MethodologyAppendix 4 – Forms in Actuarial Standards(FORM A-3 CONTINUED)Figure 37. Hurricane Charley % <strong>of</strong> Loss for FHCF2007 Total Residential by Zip Code199
The <strong>Florida</strong> Commission on Hurricane Loss Projection MethodologyAppendix 4 – Forms in Actuarial Standards(FORM A-3 CONTINUED)Figure 38. Hurricane Frances % <strong>of</strong> Loss for FHCF2007 Total Residential by Zip Code200
The <strong>Florida</strong> Commission on Hurricane Loss Projection MethodologyAppendix 4 – Forms in Actuarial Standards(FORM A-3 CONTINUED)Figure 39. Hurricane Ivan % <strong>of</strong> Loss for FHCF2007 Total Residential by Zip Code201
The <strong>Florida</strong> Commission on Hurricane Loss Projection MethodologyAppendix 4 – Forms in Actuarial Standards(FORM A-3 CONTINUED)Figure 40. Hurricane Jeanne % <strong>of</strong> Loss for FHCF2007 Total Residential by Zip Code202
The <strong>Florida</strong> Commission on Hurricane Loss Projection MethodologyAppendix 4 – Forms in Actuarial Standards(FORM A-3 CONTINUED)Figure 41. 2004 Season % <strong>of</strong> Loss for FHCF2007 Total Residential by Zip Code203
The <strong>Florida</strong> Commission on Hurricane Loss Projection MethodologyAppendix 4 – Forms in Actuarial StandardsForm A-4: Output RangesA. Provide personal and commercial residential output ranges in the format shown in the filenamed “2011FormA4.xlsx” by using an automated program or script. A hard copy <strong>of</strong> FormA-4 shall be included in a submission appendix. Provide this form in Excel format. The filename shall include the abbreviated name <strong>of</strong> the modeling organization, the standards year,and the form name.B. Provide loss costs rounded to three (3) decimal places by county. Within each county, losscosts shall be shown separately per $1,000 <strong>of</strong> exposure for frame owners, masonry owners,frame renters, masonry renters, frame condo unit owners, masonry condo unit owners,mobile home, and commercial residential. For each <strong>of</strong> these categories using ZIP Codecentroids, the output range shall show the highest loss cost, the lowest loss cost, and theweighted average loss cost. The aggregate residential exposure data for this form shall bedeveloped from the information in the file named “hlpm2007c.exe,” except for insured valueand deductibles information. Insured values shall be based on the output range specificationsbelow. Deductible amounts <strong>of</strong> 0% and as specified in the output range specifications will beassumed to be uniformly applied to all risks. When calculating the weighted average losscosts, weight the loss costs by the total insured value calculated above. Include the statewiderange <strong>of</strong> loss costs (i.e., low, high, and weighted average).C. If a modeling organization has loss costs for a ZIP Code for which there is no exposure, givethe loss costs zero weight (i.e., assume the exposure in that ZIP Code is zero). Provide a listin the submission document <strong>of</strong> those ZIP Codes where this occurs.D. If a modeling organization does not have loss costs for a ZIP Code for which there is someexposure, do not assume such loss costs are zero, but use only the exposures for which thereare loss costs in calculating the weighted average loss costs. Provide a list in the submissiondocument <strong>of</strong> the ZIP Codes where this occurs.E. All anomalies in loss costs that are not consistent with the requirements <strong>of</strong> Standard A-6 andhave been explained in Disclosure A-6.14 shall be shaded.Indicate if per diem is used in producing loss costs for Coverage D (ALE) in the personalresidential output ranges. If a per diem rate is used in the submission, a rate <strong>of</strong> $150.00 per dayper policy shall be used.204
The <strong>Florida</strong> Commission on Hurricane Loss Projection MethodologyAppendix 4 – Forms in Actuarial StandardsThe following ZIP Codes are in the 2007 FHCF exposure but do not have losscosts in USWIND:32215, 32267, 32290, 32454, 32592, 32613, 32782, 32890, 33110, 33121,33148, 33195, 33439, 33447, 33690, 33697The Form A-4 results appear in the file 2011FormA4_<strong>EQECAT</strong>_16April2013.xls.205
The <strong>Florida</strong> Commission on Hurricane Loss Projection MethodologyAppendix 4 – Forms in Actuarial StandardsOutput Range SpecificationsPolicy TypeOwnersAssumptionsCoverage A = Structure Coverage A limit = $100,000 Replacement Cost included subject to Coverage A limit Ordinance or Law not includedCoverage B = Appurtenant Structures Coverage B limit = 10% <strong>of</strong> Coverage A limit Replacement Cost included subject to Coverage B limit Ordinance or Law not includedCoverage C = Contents Coverage C limit = 50% <strong>of</strong> Coverage A limit Replacement Cost included subject to Coverage C limitCoverage D = Time Element Coverage D limit = 20% <strong>of</strong> Coverage A limit Time Limit = 12 months Per Diem = $150.00/day per policy, if used Dominant Coverage = A. Loss costs per $1,000 shall be related to the Coverage A limit. Loss costs for the various specified deductibles shall be determinedbased on annual deductibles. 2% Deductible <strong>of</strong> Coverage A. All-other perils deductible shall be $500.RentersCoverage C = Contents Coverage C limit = $25,000 Replacement Cost included subject to Coverage C limitCoverage D = Time Element Coverage D limit = 40% <strong>of</strong> Coverage C limit Time Limit = 12 months Per Diem = $150.00/day per policy, if used Dominate Coverage = C. Loss costs per $1,000 shall be related to the Coverage C limit. Loss costs for the various specified deductibles shall be determinedbased on annual deductibles. 2% Deductible <strong>of</strong> Coverage C. All-other perils deductible shall be $500.206
The <strong>Florida</strong> Commission on Hurricane Loss Projection MethodologyAppendix 4 – Forms in Actuarial StandardsCondo Unit Owners Coverage A = Structure Coverage A limit = 10% <strong>of</strong> Coverage C limit Replacement Cost included subject to Coverage A limitCoverage C = Contents Coverage C limit = $50,000 Replacement Cost included subject to Coverage C limitCoverage D = Time Element Coverage D limit = 40% <strong>of</strong> Coverage C limit Time Limit = 12 months Per Diem = $150.00/day per policy, if used Dominant Coverage = C. Loss costs per $1,000 shall be related to the Coverage C limit. Loss costs for the various specified deductibles shall be determinedbased on annual deductibles. 2% Deductible <strong>of</strong> Coverage C. All-other perils deductible shall be $500.Mobile HomeCoverage A = Structure Coverage A limit = $50,000 Replacement Cost included subject to Coverage A limitCoverage B = Appurtenant Structures Coverage B limit = 10% <strong>of</strong> Coverage A limit Replacement Cost included subject to Coverage B limitCoverage C = Contents Coverage C limit = 50% <strong>of</strong> Coverage A limit Replacement Cost included subject to Coverage C limitCoverage D = Time Element Coverage D limit = 20% <strong>of</strong> Coverage A limit Time Limit = 12 months Per Diem = $150.00/day per policy, if used Dominant Coverage = A. Loss costs per $1,000 shall be related to the Coverage A limit. Loss costs for the various specified deductibles shall be determinedbased on annual deductibles. 2% Deductible <strong>of</strong> Coverage A. All-other perils deductible shall be $500.207
The <strong>Florida</strong> Commission on Hurricane Loss Projection MethodologyAppendix 4 – Forms in Actuarial StandardsCommercial ResidentialCoverage A = Structure Coverage A limit = $750,000 Replacement Cost included subject to Coverage A limitCoverage C= Contents Coverage C limit = 5% <strong>of</strong> Coverage A limit Replacement Cost included subject to Coverage C limitCoverage D= Time Element Coverage D limit = 20% <strong>of</strong> Coverage A limit Time Limit = 12 months Per Diem = $150.00/day per policy, if used Dominant Coverage = A. Loss costs per $1,000 shall be related to the Coverage A limit. Loss costs for the various specified deductibles shall be determinedbased on annual deductibles. 3% Deductible <strong>of</strong> Coverage A. All-other perils deductible shall be $500.208
<strong>Model</strong>ing Organization: <strong>EQECAT</strong>, inc<strong>Model</strong> Name & Version Number: <strong>Florida</strong> Hurricane <strong>Model</strong> 2013a<strong>Model</strong> Release Date: 30 June 2013MasonryOwnersForm A-4 Output RangesLOSS COSTS PER $1000 for 0% DeductibleMobileHomesFrame CondoUnitMasrony CondoUnitCommercialResidentialCounty Loss Costs Frame OwnersFrame Renters Masonry RentersAlachua LOW 0.591 0.415 2.006 0.210 0.161 0.219 0.181 0.368AVERAGE 0.684 0.509 2.443 0.229 0.198 0.290 0.237 0.446HIGH 0.994 0.716 3.229 0.296 0.245 0.321 0.298 0.609Baker LOW 0.343 0.255 1.136 0.163 0.153 0.189 0.212 0.356AVERAGE 0.449 0.331 1.422 0.187 0.178 0.189 0.212 0.356HIGH 0.473 0.352 1.615 0.196 0.182 0.189 0.212 0.356Bay LOW 1.260 0.929 4.637 0.417 0.297 0.787 0.415 0.750AVERAGE 3.605 2.388 10.570 1.440 1.191 2.772 2.113 2.832HIGH 7.140 5.642 24.868 3.608 3.055 4.544 3.240 4.245Bradford LOW 0.562 0.389 1.783 0.229 0.209 0.274 0.248 0.419AVERAGE 0.597 0.436 1.910 0.236 0.210 0.274 0.248 0.428HIGH 0.623 0.450 2.008 0.254 0.225 0.274 0.248 0.433Brevard LOW 2.092 1.275 7.039 0.720 0.495 0.929 0.606 1.017AVERAGE 4.005 2.857 16.457 1.635 1.333 2.245 2.276 2.920HIGH 10.093 7.301 30.213 5.247 4.252 5.852 4.614 5.228Broward LOW 8.359 4.345 32.677 3.334 2.461 2.110 2.358 3.234AVERAGE 10.989 7.453 38.460 6.820 3.983 5.839 4.930 6.681HIGH 19.483 12.727 52.102 9.724 8.052 11.398 10.482 9.677Calhoun LOW 0.902 0.635 2.858 0.263 0.206 0.000 0.000 0.463AVERAGE 0.996 0.699 3.459 0.287 0.244 0.000 0.000 0.463HIGH 1.150 0.829 3.951 0.349 0.290 0.000 0.000 0.463Charlotte LOW 2.867 1.801 11.167 0.991 0.820 1.136 0.889 1.571AVERAGE 3.897 2.533 13.530 1.665 1.175 2.360 1.318 2.006HIGH 5.304 3.899 19.040 2.331 2.152 3.180 2.196 2.807Citrus LOW 0.960 0.640 3.435 0.329 0.252 0.387 0.276 0.502AVERAGE 1.181 0.771 4.153 0.384 0.295 0.471 0.368 0.673HIGH 1.452 0.977 4.944 0.473 0.351 0.545 0.454 0.844Clay LOW 0.522 0.362 1.780 0.186 0.165 0.200 0.174 0.360AVERAGE 0.669 0.501 2.166 0.242 0.211 0.290 0.226 0.469HIGH 0.987 0.710 3.083 0.296 0.252 0.382 0.308 0.533Collier LOW 3.418 2.076 13.747 1.173 0.881 1.203 1.016 1.604AVERAGE 5.115 3.282 16.287 2.786 1.774 2.910 2.341 3.054HIGH 8.250 5.835 28.081 4.004 3.297 4.766 3.668 4.619Columbia LOW 0.428 0.303 1.392 0.191 0.182 0.250 0.214 0.352AVERAGE 0.544 0.392 2.005 0.209 0.189 0.268 0.226 0.358HIGH 0.636 0.440 2.253 0.224 0.207 0.279 0.235 0.365DeSoto LOW 2.988 2.050 11.221 1.192 0.660 1.296 0.787 1.563AVERAGE 3.411 2.315 11.990 1.284 0.962 1.394 1.005 1.590HIGH 3.457 2.425 12.122 1.293 0.981 1.555 1.043 1.937Dixie LOW 0.635 0.433 2.164 0.225 0.164 0.235 0.207 0.298AVERAGE 0.846 0.521 2.469 0.274 0.221 0.309 0.257 0.357HIGH 1.508 1.029 5.234 0.289 0.227 0.438 0.387 0.564Duval LOW 0.376 0.283 1.265 0.159 0.157 0.176 0.158 0.301AVERAGE 0.767 0.567 2.224 0.255 0.227 0.298 0.263 0.505HIGH 1.341 1.471 6.698 0.613 0.474 0.538 0.710 0.806209
Form A-4 Output RangesLOSS COSTS PER $1000 for 0% Deductible<strong>Model</strong>ing Organization: <strong>EQECAT</strong>, inc<strong>Model</strong> Name & Version Number: <strong>Florida</strong> Hurricane <strong>Model</strong> 2013a<strong>Model</strong> Release Date: 30 June 2013County Loss Costs Frame OwnersMasonryOwnersMobileHomesFrame Renters Masonry RentersFrame CondoUnitMasrony CondoUnitCommercialResidentialEscambia LOW 1.277 0.941 4.328 0.402 0.304 0.689 0.746 1.082AVERAGE 3.865 2.944 11.723 1.668 1.367 2.474 1.818 2.516HIGH 8.012 5.173 24.154 3.628 2.702 4.460 3.459 4.786Flagler LOW 0.863 0.561 2.798 0.270 0.217 0.456 0.216 0.366AVERAGE 1.166 0.667 4.562 0.352 0.256 0.541 0.297 0.573HIGH 2.426 1.618 8.374 0.637 0.692 1.086 0.605 1.017Franklin LOW 1.977 1.678 8.147 0.894 0.683 0.683 0.680 1.056AVERAGE 3.286 2.543 11.207 1.704 0.959 0.976 1.323 1.893HIGH 5.204 4.291 17.870 1.866 1.538 1.969 1.503 2.278Gadsden LOW 0.373 0.294 1.437 0.137 0.118 0.000 0.000 0.345AVERAGE 0.480 0.354 1.564 0.165 0.140 0.000 0.000 0.351HIGH 0.720 0.531 2.251 0.217 0.172 0.000 0.000 0.363Gilchrist LOW 0.767 0.499 2.632 0.264 0.233 0.000 0.280 0.533AVERAGE 0.807 0.572 2.878 0.304 0.250 0.000 0.280 0.533HIGH 0.823 0.607 2.998 0.312 0.260 0.000 0.280 0.533Glades LOW 3.792 2.506 12.980 1.765 1.277 0.000 0.000 0.000AVERAGE 4.597 3.278 17.431 1.765 1.277 0.000 0.000 0.000HIGH 4.633 3.295 17.565 1.765 1.277 0.000 0.000 0.000Gulf LOW 1.018 0.789 3.666 0.347 0.274 1.787 1.318 2.161AVERAGE 3.384 2.615 7.427 1.564 1.227 1.787 1.565 2.161HIGH 3.863 3.329 14.871 1.944 1.604 1.787 1.625 2.161Hamilton LOW 0.370 0.269 1.197 0.142 0.141 0.000 0.173 0.253AVERAGE 0.382 0.273 1.237 0.162 0.155 0.000 0.173 0.262HIGH 0.395 0.284 1.296 0.167 0.160 0.000 0.173 0.281Hardee LOW 2.499 1.697 9.091 0.872 0.644 0.000 0.000 1.496AVERAGE 2.673 1.847 9.684 0.905 0.687 0.000 0.000 1.500HIGH 2.903 2.012 10.435 1.042 0.768 0.000 0.000 1.576Hendry LOW 4.411 2.570 15.272 1.641 1.117 2.027 1.478 2.579AVERAGE 5.084 3.780 20.385 1.923 1.633 2.729 2.068 3.668HIGH 6.725 4.744 24.525 2.632 1.922 3.149 2.187 3.773Hernando LOW 1.093 0.696 3.643 0.379 0.269 0.483 0.367 0.691AVERAGE 1.439 1.017 4.998 0.453 0.370 0.635 0.492 0.793HIGH 1.849 1.191 6.170 0.590 0.491 0.750 0.561 0.972Highlands LOW 2.872 1.976 10.563 0.951 0.746 1.278 0.909 1.731AVERAGE 3.506 2.453 12.180 1.236 0.866 1.483 1.095 1.919HIGH 4.427 2.900 15.084 1.569 1.176 1.861 1.352 2.378Hillsborough LOW 1.207 0.847 4.968 0.403 0.318 0.509 0.376 0.690AVERAGE 2.349 1.515 8.067 0.929 0.674 1.066 0.873 1.253HIGH 4.156 3.585 12.509 2.138 1.520 2.119 1.934 2.214Holmes LOW 0.982 0.705 3.110 0.315 0.299 0.376 0.000 0.812AVERAGE 1.180 0.848 3.935 0.357 0.299 0.376 0.000 0.812HIGH 1.215 0.874 4.143 0.369 0.299 0.376 0.000 0.812Indian River LOW 3.880 2.078 14.143 1.462 0.909 2.795 1.678 2.653AVERAGE 7.183 4.620 20.807 3.692 2.643 4.137 3.642 4.547HIGH 10.035 6.868 32.542 4.999 4.087 6.146 4.707 5.621210
Form A-4 Output RangesLOSS COSTS PER $1000 for 0% Deductible<strong>Model</strong>ing Organization: <strong>EQECAT</strong>, inc<strong>Model</strong> Name & Version Number: <strong>Florida</strong> Hurricane <strong>Model</strong> 2013a<strong>Model</strong> Release Date: 30 June 2013County Loss Costs Frame OwnersMasonryOwnersMobileHomesFrame Renters Masonry RentersFrame CondoUnitMasrony CondoUnitCommercialResidentialJackson LOW 0.816 0.587 2.649 0.229 0.192 0.342 0.255 0.552AVERAGE 0.952 0.680 3.156 0.291 0.235 0.342 0.278 0.690HIGH 1.224 0.881 4.065 0.391 0.304 0.342 0.315 0.799Jefferson LOW 0.335 0.241 1.067 0.130 0.116 0.000 0.000 0.266AVERAGE 0.373 0.268 1.237 0.138 0.129 0.000 0.000 0.266HIGH 0.457 0.327 1.395 0.157 0.134 0.000 0.000 0.266Lafayette LOW 0.523 0.392 1.789 0.181 0.131 0.000 0.000 0.000AVERAGE 0.525 0.392 1.790 0.181 0.131 0.000 0.000 0.000HIGH 0.604 0.422 1.902 0.181 0.131 0.000 0.000 0.000Lake LOW 0.986 0.677 3.131 0.307 0.267 0.399 0.321 0.548AVERAGE 1.914 1.349 6.874 0.637 0.490 0.953 0.659 1.135HIGH 2.935 1.885 11.003 1.106 0.784 1.055 0.764 1.433Lee LOW 2.833 1.871 12.365 0.955 0.661 0.995 0.763 1.245AVERAGE 5.207 2.559 14.581 2.250 1.124 2.565 1.597 2.340HIGH 11.539 6.412 31.847 5.510 4.579 6.108 5.521 5.996Leon LOW 0.375 0.257 1.306 0.112 0.103 0.128 0.110 0.241AVERAGE 0.527 0.384 1.852 0.172 0.155 0.216 0.182 0.391HIGH 0.762 0.547 2.347 0.232 0.195 0.275 0.225 0.484Levy LOW 0.585 0.380 1.864 0.168 0.182 0.352 0.486 0.525AVERAGE 1.065 0.724 3.700 0.419 0.292 0.657 0.486 0.841HIGH 1.553 1.196 5.837 0.673 0.391 0.662 0.486 0.878Liberty LOW 0.562 0.396 1.765 0.170 0.151 0.000 0.000 0.000AVERAGE 0.583 0.421 1.865 0.173 0.152 0.000 0.000 0.000HIGH 0.585 0.423 1.875 0.184 0.154 0.000 0.000 0.000Madison LOW 0.347 0.258 1.133 0.138 0.113 0.000 0.000 0.293AVERAGE 0.405 0.291 1.287 0.149 0.134 0.000 0.000 0.293HIGH 0.434 0.318 1.358 0.158 0.153 0.000 0.000 0.293Manatee LOW 2.291 1.395 9.127 0.867 0.653 0.762 0.616 0.935AVERAGE 3.352 1.964 10.755 1.464 0.949 2.150 1.445 1.994HIGH 7.390 5.813 22.076 3.996 3.262 4.443 3.596 3.985Marion LOW 0.534 0.367 1.646 0.172 0.154 0.225 0.189 0.323AVERAGE 1.359 0.871 4.374 0.419 0.332 0.577 0.467 0.687HIGH 1.731 1.133 5.841 0.564 0.448 0.722 0.555 0.933Martin LOW 7.491 4.503 26.873 2.978 2.499 3.890 3.054 4.098AVERAGE 9.533 6.258 30.978 5.131 3.529 5.994 4.869 5.667HIGH 13.074 9.087 39.850 6.915 5.690 7.834 6.401 7.325Miami-Dade LOW 7.590 3.440 29.842 3.153 2.227 3.491 1.745 3.512AVERAGE 13.118 8.958 41.332 9.195 7.054 9.729 8.444 8.641HIGH 32.270 20.886 71.203 17.552 14.281 16.961 14.784 15.547Monroe LOW 12.580 9.655 41.223 7.324 5.786 7.135 6.308 7.262AVERAGE 15.232 14.272 55.535 9.078 9.659 11.515 10.973 10.180HIGH 26.090 20.049 68.764 16.431 14.038 17.681 14.997 15.072Nassau LOW 0.341 0.254 1.184 0.151 0.133 0.153 0.144 0.258AVERAGE 0.769 0.493 1.796 0.297 0.245 0.416 0.310 0.602HIGH 1.174 0.929 4.271 0.451 0.358 0.550 0.358 0.823211
Form A-4 Output RangesLOSS COSTS PER $1000 for 0% Deductible<strong>Model</strong>ing Organization: <strong>EQECAT</strong>, inc<strong>Model</strong> Name & Version Number: <strong>Florida</strong> Hurricane <strong>Model</strong> 2013a<strong>Model</strong> Release Date: 30 June 2013County Loss Costs Frame OwnersMasonryOwnersMobileHomesFrame Renters Masonry RentersFrame CondoUnitMasrony CondoUnitCommercialResidentialOkaloosa LOW 1.408 1.036 5.306 0.454 0.313 0.482 1.227 0.918AVERAGE 3.767 2.858 8.618 1.638 1.280 2.500 1.819 2.812HIGH 6.463 4.941 21.276 3.015 2.415 3.395 2.530 3.641Okeechobee LOW 4.784 3.346 18.154 1.772 1.347 3.994 1.259 2.743AVERAGE 6.804 4.844 25.947 2.620 2.118 3.994 3.150 4.486HIGH 8.190 5.665 27.968 3.420 2.575 3.994 3.180 4.635Orange LOW 1.251 0.908 5.201 0.377 0.295 0.450 0.377 0.734AVERAGE 1.936 1.321 6.721 0.581 0.440 0.728 0.546 1.037HIGH 2.792 2.267 10.564 0.918 0.658 1.336 1.005 1.250Osceola LOW 1.295 0.932 5.417 0.396 0.308 0.499 0.369 0.764AVERAGE 2.044 1.560 9.154 0.660 0.519 0.717 0.500 1.077HIGH 3.383 2.223 11.391 1.060 0.793 1.252 0.977 1.598Palm Beach LOW 7.213 4.709 27.248 3.124 2.166 2.750 2.205 2.979AVERAGE 10.876 7.250 35.991 7.918 4.836 6.540 5.480 6.758HIGH 25.904 18.542 56.458 10.803 12.052 16.150 12.039 13.987Pasco LOW 1.260 0.879 4.765 0.443 0.298 0.530 0.411 0.725AVERAGE 1.640 1.200 6.545 0.612 0.466 0.766 0.643 1.042HIGH 2.849 2.181 9.412 1.004 0.899 1.191 0.907 1.375Pinellas LOW 1.789 1.268 6.886 0.649 0.497 0.783 0.618 0.986AVERAGE 3.167 2.181 9.025 1.264 0.991 1.695 1.422 1.984HIGH 7.328 5.024 14.701 2.989 2.462 3.509 3.381 3.408Polk LOW 1.444 1.038 5.754 0.483 0.342 0.533 0.410 0.870AVERAGE 2.469 1.655 9.162 0.834 0.617 1.002 0.774 1.363HIGH 3.559 2.383 12.104 1.194 0.886 1.463 1.095 1.866Putnam LOW 0.587 0.424 1.973 0.220 0.191 0.341 0.223 0.566AVERAGE 0.903 0.634 2.903 0.285 0.236 0.403 0.293 0.610HIGH 1.246 0.864 3.977 0.406 0.331 0.449 0.398 0.717St. Johns LOW 0.444 0.345 2.225 0.148 0.137 0.223 0.199 0.385AVERAGE 0.908 0.694 3.299 0.373 0.294 0.505 0.394 0.793HIGH 1.448 0.941 5.571 0.496 0.383 0.615 0.478 0.992St. Lucie LOW 6.027 3.476 22.766 2.380 1.585 1.952 1.842 2.454AVERAGE 7.528 4.309 26.553 3.431 2.275 4.902 4.440 4.953HIGH 13.292 9.690 39.174 6.365 5.258 7.482 5.900 6.218Santa Rosa LOW 1.571 1.158 5.533 0.510 0.389 1.049 0.665 1.068AVERAGE 3.809 2.954 11.379 1.741 1.602 3.832 2.359 3.308HIGH 7.341 5.659 25.265 3.755 2.852 4.465 2.760 4.288Sarasota LOW 1.918 1.417 9.650 0.850 0.667 1.152 0.712 1.310AVERAGE 3.837 2.409 12.595 1.765 1.305 2.284 1.845 2.409HIGH 6.155 4.210 19.437 3.103 2.394 3.543 2.765 3.334Seminole LOW 1.433 0.943 5.175 0.358 0.328 0.509 0.369 0.760AVERAGE 1.728 1.166 5.786 0.505 0.393 0.660 0.492 0.976HIGH 2.397 1.505 7.817 0.635 0.565 0.728 0.598 1.133Sumter LOW 1.330 0.869 4.594 0.394 0.304 0.592 0.456 0.776AVERAGE 1.497 1.019 5.358 0.520 0.424 0.677 0.480 0.812HIGH 1.797 1.206 6.574 0.573 0.475 0.721 0.532 0.965212
Form A-4 Output RangesLOSS COSTS PER $1000 for 0% Deductible<strong>Model</strong>ing Organization: <strong>EQECAT</strong>, inc<strong>Model</strong> Name & Version Number: <strong>Florida</strong> Hurricane <strong>Model</strong> 2013a<strong>Model</strong> Release Date: 30 June 2013County Loss Costs Frame OwnersMasonryOwnersMobileHomesFrame Renters Masonry RentersFrame CondoUnitMasrony CondoUnitCommercialResidentialSuwannee LOW 0.495 0.355 1.684 0.191 0.165 0.236 0.000 0.357AVERAGE 0.549 0.393 1.883 0.196 0.172 0.236 0.000 0.412HIGH 0.667 0.466 2.292 0.242 0.209 0.236 0.000 0.472Taylor LOW 0.323 0.248 1.045 0.110 0.145 0.160 0.185 0.325AVERAGE 0.576 0.414 1.911 0.196 0.165 0.201 0.185 0.361HIGH 0.642 0.501 2.478 0.253 0.186 0.243 0.185 0.373Union LOW 0.528 0.346 1.433 0.218 0.194 0.210 0.214 0.388AVERAGE 0.529 0.384 1.768 0.221 0.202 0.210 0.214 0.388HIGH 0.550 0.394 1.795 0.222 0.210 0.210 0.214 0.388Volusia LOW 0.867 0.525 3.066 0.251 0.190 0.380 0.221 0.554AVERAGE 1.647 1.073 5.221 0.487 0.415 0.785 0.814 1.296HIGH 3.561 2.573 12.263 1.265 0.976 1.699 1.293 1.752Wakulla LOW 0.443 0.321 1.570 0.132 0.120 0.194 0.151 0.253AVERAGE 0.608 0.427 1.759 0.176 0.169 0.403 0.444 0.559HIGH 1.368 1.119 5.321 0.517 0.406 0.627 0.484 0.938Walton LOW 1.184 0.869 4.157 0.382 0.300 0.554 0.333 0.930AVERAGE 3.334 2.262 7.912 1.561 1.369 2.677 2.092 2.867HIGH 5.828 4.139 22.670 2.814 2.631 3.607 2.510 3.487Washington LOW 1.106 0.813 3.826 0.359 0.279 0.512 0.000 0.746AVERAGE 1.197 0.868 4.276 0.385 0.308 0.570 0.000 0.746HIGH 1.544 1.108 5.396 0.504 0.380 0.602 0.000 0.746<strong>State</strong>wide LOW 0.323 0.241 1.045 0.110 0.103 0.128 0.110 0.241AVERAGE 2.955 3.703 10.337 1.920 2.412 2.435 3.589 4.675HIGH 32.270 20.886 71.203 17.552 14.281 17.681 14.997 15.547213
<strong>Model</strong>ing Organization: <strong>EQECAT</strong>, inc<strong>Model</strong> Name & Version Number: <strong>Florida</strong> Hurricane <strong>Model</strong> 2013a<strong>Model</strong> Release Date: 30 June 2013MasonryOwnersForm A-4 Output RangesLOSS COSTS PER $1000 with Specified DeductiblesMobileHomesFrame CondoUnitMasrony CondoUnitCommercialResidentialCounty Loss Costs Frame OwnersFrame Renters Masonry RentersAlachua LOW 0.177 0.101 1.404 0.021 0.010 0.027 0.012 0.042AVERAGE 0.231 0.148 1.795 0.036 0.019 0.050 0.025 0.064HIGH 0.395 0.257 2.453 0.066 0.039 0.066 0.050 0.106Baker LOW 0.073 0.050 0.665 0.006 0.006 0.010 0.013 0.041AVERAGE 0.113 0.070 0.888 0.011 0.009 0.010 0.013 0.041HIGH 0.123 0.077 1.046 0.012 0.009 0.010 0.013 0.041Bay LOW 0.556 0.367 3.815 0.129 0.071 0.342 0.112 0.150AVERAGE 2.449 1.489 9.449 0.935 0.758 1.994 1.495 1.547HIGH 5.592 4.345 23.213 2.829 2.392 3.551 2.478 2.644Bradford LOW 0.154 0.088 1.160 0.016 0.011 0.024 0.016 0.048AVERAGE 0.168 0.109 1.255 0.017 0.013 0.024 0.016 0.052HIGH 0.181 0.115 1.345 0.027 0.014 0.024 0.016 0.054Brevard LOW 1.111 0.566 5.976 0.312 0.176 0.431 0.229 0.273AVERAGE 2.699 1.818 15.050 1.082 0.857 1.512 1.595 1.580HIGH 8.226 5.764 28.319 4.342 3.465 4.773 3.689 3.440Broward LOW 6.416 2.892 30.752 2.369 1.654 1.271 1.509 1.654AVERAGE 8.875 5.667 36.378 5.604 3.027 4.521 3.760 4.453HIGH 17.028 10.664 49.641 8.349 6.841 9.785 8.982 7.139Calhoun LOW 0.368 0.222 2.241 0.059 0.036 0.000 0.000 0.065AVERAGE 0.417 0.254 2.770 0.071 0.051 0.000 0.000 0.065HIGH 0.497 0.321 3.202 0.103 0.070 0.000 0.000 0.065Charlotte LOW 1.786 0.975 10.006 0.545 0.427 0.597 0.435 0.606AVERAGE 2.732 1.609 12.299 1.144 0.743 1.681 0.805 0.959HIGH 4.065 2.872 17.723 1.763 1.629 2.433 1.606 1.642Citrus LOW 0.401 0.220 2.693 0.084 0.050 0.126 0.045 0.086AVERAGE 0.557 0.307 3.407 0.126 0.079 0.154 0.108 0.164HIGH 0.729 0.433 4.116 0.175 0.110 0.185 0.147 0.231Clay LOW 0.135 0.071 1.158 0.013 0.007 0.015 0.010 0.036AVERAGE 0.214 0.142 1.514 0.035 0.021 0.045 0.023 0.070HIGH 0.382 0.235 2.326 0.052 0.036 0.072 0.040 0.090Collier LOW 2.184 1.104 12.429 0.662 0.430 0.600 0.480 0.558AVERAGE 3.715 2.198 14.887 2.110 1.240 2.104 1.665 1.711HIGH 6.610 4.484 26.400 3.192 2.606 3.777 2.848 2.963Columbia LOW 0.104 0.061 0.857 0.011 0.012 0.026 0.019 0.042AVERAGE 0.165 0.103 1.411 0.021 0.013 0.029 0.019 0.042HIGH 0.221 0.127 1.649 0.037 0.024 0.052 0.020 0.045DeSoto LOW 1.912 1.143 9.952 0.672 0.297 0.738 0.344 0.630AVERAGE 2.174 1.349 10.684 0.745 0.511 0.791 0.525 0.643HIGH 2.201 1.408 10.785 0.780 0.518 0.880 0.529 0.808Dixie LOW 0.226 0.131 1.581 0.041 0.014 0.045 0.032 0.032AVERAGE 0.366 0.180 1.859 0.064 0.036 0.087 0.058 0.054HIGH 0.815 0.505 4.373 0.078 0.039 0.160 0.129 0.132Duval LOW 0.078 0.051 0.750 0.007 0.004 0.013 0.003 0.026AVERAGE 0.284 0.187 1.617 0.050 0.033 0.056 0.042 0.086HIGH 0.646 0.773 5.701 0.275 0.176 0.171 0.312 0.202214
Form A-4 Output RangesLOSS COSTS PER $1000 with Specified Deductibles<strong>Model</strong>ing Organization: <strong>EQECAT</strong>, inc<strong>Model</strong> Name & Version Number: <strong>Florida</strong> Hurricane <strong>Model</strong> 2013a<strong>Model</strong> Release Date: 30 June 2013County Loss Costs Frame OwnersMasonryOwnersMobileHomesFrame Renters Masonry RentersFrame CondoUnitMasrony CondoUnitCommercialResidentialEscambia LOW 0.621 0.409 3.601 0.142 0.082 0.292 0.346 0.347AVERAGE 2.642 1.924 10.533 1.115 0.893 1.716 1.210 1.276HIGH 6.436 3.914 22.555 2.864 2.075 3.504 2.660 3.123Flagler LOW 0.323 0.149 2.089 0.046 0.019 0.112 0.015 0.030AVERAGE 0.508 0.209 3.731 0.106 0.042 0.190 0.056 0.105HIGH 1.421 0.836 7.274 0.292 0.317 0.557 0.231 0.305Franklin LOW 1.089 0.892 7.132 0.478 0.334 0.293 0.293 0.316AVERAGE 2.166 1.601 10.051 1.165 0.562 0.522 0.797 0.851HIGH 3.839 3.102 16.443 1.303 1.053 1.299 0.939 1.099Gadsden LOW 0.088 0.071 0.971 0.016 0.010 0.000 0.000 0.046AVERAGE 0.139 0.097 1.092 0.021 0.013 0.000 0.000 0.047HIGH 0.258 0.179 1.695 0.037 0.024 0.000 0.000 0.047Gilchrist LOW 0.297 0.157 1.991 0.054 0.036 0.000 0.048 0.105AVERAGE 0.318 0.200 2.208 0.077 0.045 0.000 0.048 0.105HIGH 0.327 0.220 2.314 0.082 0.050 0.000 0.048 0.105Glades LOW 2.352 1.355 11.571 1.039 0.675 0.000 0.000 0.000AVERAGE 2.988 1.949 15.831 1.039 0.675 0.000 0.000 0.000HIGH 3.019 1.964 15.959 1.039 0.675 0.000 0.000 0.000Gulf LOW 0.417 0.295 2.936 0.094 0.059 1.200 0.826 1.078AVERAGE 2.334 1.748 6.534 1.094 0.830 1.200 1.040 1.078HIGH 2.724 2.318 13.650 1.406 1.136 1.200 1.092 1.078Hamilton LOW 0.082 0.055 0.706 0.008 0.006 0.000 0.009 0.021AVERAGE 0.091 0.058 0.754 0.008 0.006 0.000 0.009 0.024HIGH 0.107 0.066 0.848 0.010 0.009 0.000 0.009 0.032Hardee LOW 1.502 0.915 7.946 0.428 0.265 0.000 0.000 0.515AVERAGE 1.567 0.963 8.502 0.455 0.292 0.000 0.000 0.519HIGH 1.720 1.046 9.194 0.542 0.357 0.000 0.000 0.581Hendry LOW 2.885 1.432 13.794 0.976 0.567 1.184 0.759 1.126AVERAGE 3.444 2.368 18.690 1.184 0.961 1.709 1.195 1.818HIGH 4.815 3.126 22.644 1.714 1.181 2.019 1.279 1.886Hernando LOW 0.508 0.247 2.974 0.129 0.070 0.163 0.099 0.175AVERAGE 0.751 0.475 4.191 0.178 0.130 0.264 0.183 0.223HIGH 1.051 0.609 5.268 0.274 0.206 0.345 0.253 0.317Highlands LOW 1.621 0.984 9.232 0.438 0.302 0.616 0.365 0.591AVERAGE 2.122 1.348 10.778 0.659 0.392 0.766 0.501 0.697HIGH 2.898 1.692 13.573 0.936 0.619 1.066 0.682 0.992Hillsborough LOW 0.573 0.348 4.173 0.145 0.086 0.182 0.100 0.171AVERAGE 1.478 0.842 7.059 0.557 0.358 0.611 0.479 0.513HIGH 3.080 2.593 11.353 1.587 1.078 1.527 1.374 1.233Holmes LOW 0.431 0.269 2.481 0.081 0.073 0.098 0.000 0.208AVERAGE 0.546 0.350 3.225 0.109 0.073 0.098 0.000 0.208HIGH 0.570 0.368 3.416 0.118 0.073 0.098 0.000 0.208Indian River LOW 2.456 1.045 12.704 0.841 0.435 1.924 1.018 1.276AVERAGE 5.494 3.295 19.209 2.876 1.967 3.154 2.765 2.836HIGH 8.171 5.342 30.670 4.086 3.286 5.015 3.746 3.741215
Form A-4 Output RangesLOSS COSTS PER $1000 with Specified Deductibles<strong>Model</strong>ing Organization: <strong>EQECAT</strong>, inc<strong>Model</strong> Name & Version Number: <strong>Florida</strong> Hurricane <strong>Model</strong> 2013a<strong>Model</strong> Release Date: 30 June 2013County Loss Costs Frame OwnersMasonryOwnersMobileHomesFrame Renters Masonry RentersFrame CondoUnitMasrony CondoUnitCommercialResidentialJackson LOW 0.310 0.197 2.042 0.044 0.028 0.070 0.042 0.101AVERAGE 0.388 0.248 2.489 0.070 0.046 0.070 0.053 0.152HIGH 0.575 0.374 3.342 0.131 0.081 0.070 0.067 0.200Jefferson LOW 0.085 0.048 0.674 0.011 0.005 0.000 0.000 0.026AVERAGE 0.095 0.058 0.804 0.012 0.007 0.000 0.000 0.026HIGH 0.138 0.086 0.941 0.019 0.010 0.000 0.000 0.026Lafayette LOW 0.173 0.121 1.303 0.029 0.012 0.000 0.000 0.000AVERAGE 0.174 0.121 1.303 0.029 0.012 0.000 0.000 0.000HIGH 0.220 0.134 1.384 0.029 0.012 0.000 0.000 0.000Lake LOW 0.368 0.217 2.345 0.053 0.028 0.075 0.044 0.079AVERAGE 0.971 0.598 5.827 0.249 0.155 0.403 0.225 0.305HIGH 1.734 0.963 9.718 0.578 0.348 0.484 0.302 0.468Lee LOW 1.680 0.998 11.086 0.497 0.297 0.473 0.334 0.388AVERAGE 3.848 1.569 13.238 1.638 0.672 1.816 1.021 1.172HIGH 9.735 5.124 30.047 4.633 3.836 5.069 4.587 4.207Leon LOW 0.104 0.058 0.916 0.009 0.006 0.010 0.007 0.024AVERAGE 0.166 0.105 1.361 0.022 0.015 0.032 0.021 0.052HIGH 0.298 0.185 1.803 0.051 0.029 0.058 0.035 0.073Levy LOW 0.216 0.118 1.334 0.027 0.031 0.075 0.208 0.106AVERAGE 0.484 0.280 2.929 0.149 0.067 0.317 0.208 0.270HIGH 0.862 0.636 4.999 0.362 0.163 0.321 0.208 0.295Liberty LOW 0.181 0.116 1.281 0.021 0.013 0.000 0.000 0.000AVERAGE 0.189 0.121 1.372 0.021 0.013 0.000 0.000 0.000HIGH 0.190 0.126 1.383 0.023 0.017 0.000 0.000 0.000Madison LOW 0.074 0.052 0.653 0.012 0.006 0.000 0.000 0.035AVERAGE 0.112 0.070 0.840 0.014 0.007 0.000 0.000 0.035HIGH 0.127 0.081 0.905 0.016 0.009 0.000 0.000 0.035Manatee LOW 1.414 0.740 8.069 0.464 0.326 0.381 0.285 0.307AVERAGE 2.343 1.212 9.682 1.016 0.586 1.560 0.969 1.058HIGH 6.034 4.673 20.641 3.315 2.678 3.632 2.913 2.665Marion LOW 0.154 0.092 1.101 0.012 0.010 0.020 0.016 0.033AVERAGE 0.616 0.325 3.492 0.119 0.070 0.179 0.124 0.138HIGH 0.857 0.458 4.798 0.192 0.114 0.258 0.157 0.256Martin LOW 5.679 3.137 25.137 2.112 1.762 2.802 2.181 2.338AVERAGE 7.612 4.727 29.051 4.129 2.723 4.781 3.842 3.700HIGH 10.958 7.347 37.678 5.780 4.726 6.490 5.260 5.135Miami-Dade LOW 5.736 2.211 27.999 2.225 1.520 2.517 1.065 1.988AVERAGE 10.887 7.095 39.175 7.842 5.906 8.193 7.076 6.209HIGH 29.380 18.489 68.385 15.763 12.705 15.040 13.089 12.432Monroe LOW 10.496 7.859 39.072 6.188 4.792 5.871 5.113 5.017AVERAGE 13.005 12.274 53.117 7.802 8.441 9.977 9.577 7.682HIGH 23.594 17.858 66.118 14.803 12.630 15.905 13.443 12.171Nassau LOW 0.075 0.048 0.720 0.008 0.003 0.009 0.009 0.026AVERAGE 0.305 0.160 1.302 0.078 0.054 0.122 0.072 0.130HIGH 0.565 0.417 3.502 0.171 0.112 0.208 0.098 0.238216
Form A-4 Output RangesLOSS COSTS PER $1000 with Specified Deductibles<strong>Model</strong>ing Organization: <strong>EQECAT</strong>, inc<strong>Model</strong> Name & Version Number: <strong>Florida</strong> Hurricane <strong>Model</strong> 2013a<strong>Model</strong> Release Date: 30 June 2013County Loss Costs Frame OwnersMasonryOwnersMobileHomesFrame Renters Masonry RentersFrame CondoUnitMasrony CondoUnitCommercialResidentialOkaloosa LOW 0.685 0.443 4.489 0.158 0.079 0.150 0.688 0.239AVERAGE 2.597 1.877 7.620 1.101 0.817 1.738 1.193 1.476HIGH 4.982 3.670 19.760 2.310 1.801 2.549 1.816 2.157Okeechobee LOW 3.182 2.038 16.554 1.053 0.753 2.851 0.620 1.213AVERAGE 4.986 3.334 24.060 1.781 1.386 2.851 2.158 2.528HIGH 6.236 4.052 26.007 2.469 1.762 2.851 2.185 2.641Orange LOW 0.487 0.320 4.238 0.092 0.051 0.101 0.071 0.125AVERAGE 0.954 0.557 5.654 0.202 0.114 0.250 0.144 0.249HIGH 1.606 1.235 9.232 0.447 0.251 0.679 0.435 0.357Osceola LOW 0.523 0.335 4.458 0.095 0.054 0.121 0.069 0.136AVERAGE 1.050 0.727 7.974 0.270 0.175 0.259 0.142 0.278HIGH 2.101 1.216 10.085 0.537 0.361 0.635 0.444 0.547Palm Beach LOW 5.362 3.280 25.513 2.242 1.454 1.808 1.387 1.432AVERAGE 8.803 5.526 33.913 6.657 3.847 5.203 4.305 4.538HIGH 23.190 16.227 53.949 9.375 10.632 14.332 10.488 11.017Pasco LOW 0.623 0.383 4.016 0.178 0.089 0.209 0.137 0.192AVERAGE 0.901 0.611 5.627 0.296 0.198 0.365 0.299 0.385HIGH 1.944 1.433 8.417 0.635 0.580 0.729 0.520 0.613Pinellas LOW 1.045 0.669 6.016 0.337 0.226 0.396 0.280 0.350AVERAGE 2.224 1.428 8.063 0.851 0.634 1.168 0.959 1.072HIGH 5.986 3.959 13.570 2.410 1.951 2.808 2.721 2.222Polk LOW 0.629 0.388 4.868 0.148 0.072 0.149 0.086 0.174AVERAGE 1.401 0.826 7.993 0.394 0.245 0.458 0.311 0.448HIGH 2.172 1.275 10.662 0.620 0.379 0.743 0.466 0.674Putnam LOW 0.178 0.104 1.372 0.023 0.011 0.049 0.016 0.088AVERAGE 0.332 0.195 2.165 0.045 0.026 0.085 0.035 0.103HIGH 0.524 0.317 3.108 0.104 0.065 0.102 0.081 0.142St. Johns LOW 0.106 0.070 1.632 0.012 0.005 0.035 0.017 0.044AVERAGE 0.374 0.244 2.565 0.116 0.066 0.168 0.098 0.201HIGH 0.711 0.369 4.689 0.191 0.111 0.239 0.140 0.290St. Lucie LOW 4.357 2.227 21.118 1.616 0.967 1.160 1.114 1.093AVERAGE 5.736 2.942 24.797 2.573 1.594 3.804 3.463 3.139HIGH 11.186 7.926 37.075 5.303 4.324 6.214 4.816 4.230Santa Rosa LOW 0.801 0.536 4.689 0.201 0.124 0.530 0.262 0.322AVERAGE 2.615 1.941 10.214 1.187 1.097 2.924 1.665 1.887HIGH 5.765 4.300 23.622 2.959 2.175 3.493 2.012 2.656Sarasota LOW 1.077 0.732 8.607 0.467 0.337 0.658 0.339 0.508AVERAGE 2.781 1.593 11.473 1.288 0.899 1.672 1.317 1.379HIGH 4.890 3.174 18.075 2.483 1.875 2.790 2.120 2.114Seminole LOW 0.599 0.334 4.221 0.086 0.062 0.129 0.068 0.135AVERAGE 0.819 0.469 4.775 0.161 0.094 0.211 0.119 0.231HIGH 1.292 0.675 6.656 0.246 0.187 0.258 0.191 0.319Sumter LOW 0.626 0.354 3.835 0.129 0.077 0.187 0.107 0.162AVERAGE 0.684 0.395 4.430 0.175 0.113 0.232 0.120 0.180HIGH 0.908 0.535 5.481 0.201 0.149 0.260 0.145 0.256217
Form A-4 Output RangesLOSS COSTS PER $1000 with Specified Deductibles<strong>Model</strong>ing Organization: <strong>EQECAT</strong>, inc<strong>Model</strong> Name & Version Number: <strong>Florida</strong> Hurricane <strong>Model</strong> 2013a<strong>Model</strong> Release Date: 30 June 2013County Loss Costs Frame OwnersMasonryOwnersMobileHomesFrame Renters Masonry RentersFrame CondoUnitMasrony CondoUnitCommercialResidentialSuwannee LOW 0.154 0.097 1.175 0.026 0.017 0.036 0.000 0.052AVERAGE 0.180 0.113 1.343 0.028 0.019 0.036 0.000 0.066HIGH 0.236 0.146 1.687 0.046 0.030 0.036 0.000 0.083Taylor LOW 0.084 0.060 0.678 0.007 0.011 0.014 0.040 0.043AVERAGE 0.202 0.125 1.402 0.030 0.018 0.038 0.040 0.061HIGH 0.253 0.195 1.979 0.082 0.025 0.064 0.040 0.067Union LOW 0.140 0.078 0.881 0.015 0.008 0.014 0.013 0.046AVERAGE 0.144 0.092 1.155 0.017 0.010 0.014 0.013 0.046HIGH 0.155 0.095 1.175 0.018 0.012 0.014 0.013 0.046Volusia LOW 0.312 0.138 2.277 0.042 0.020 0.062 0.023 0.078AVERAGE 0.805 0.451 4.303 0.168 0.133 0.329 0.380 0.444HIGH 2.288 1.574 10.947 0.750 0.539 1.032 0.742 0.707Wakulla LOW 0.121 0.077 1.126 0.011 0.007 0.021 0.012 0.018AVERAGE 0.215 0.132 1.294 0.032 0.029 0.131 0.141 0.125HIGH 0.654 0.507 4.495 0.213 0.141 0.248 0.161 0.259Walton LOW 0.547 0.351 3.432 0.120 0.067 0.204 0.075 0.248AVERAGE 2.225 1.385 6.965 1.047 0.905 1.917 1.436 1.563HIGH 4.394 2.947 21.108 2.121 1.976 2.734 1.787 2.030Washington LOW 0.486 0.324 3.113 0.102 0.060 0.155 0.000 0.169AVERAGE 0.547 0.358 3.531 0.119 0.076 0.199 0.000 0.169HIGH 0.761 0.499 4.548 0.180 0.110 0.224 0.000 0.169<strong>State</strong>wide LOW 0.073 0.048 0.654 0.006 0.003 0.009 0.003 0.018AVERAGE 2.007 2.615 9.236 1.424 1.815 1.764 2.751 3.038HIGH 29.380 18.489 68.385 15.763 12.705 15.890 13.430 12.432218
The <strong>Florida</strong> Commission on Hurricane Loss Projection MethodologyAppendix 4 – Forms in Actuarial StandardsForm A-5: Percentage Change in Output RangesA. Provide summaries <strong>of</strong> the percentage change in average loss cost output range datacompiled in Form A-4 relative to the equivalent data compiled from the previously acceptedmodel in the format shown in the file named “2011FormA5.xlsx”.For the change in output range exhibit, provide the summary by: <strong>State</strong>wide (overall percentage change), By region, as defined in Figure 42 – North, Central and South, By county, as defined in Figure 43 – Coastal and Inland.B. Provide this form in Excel format. The file name shall include the abbreviated name <strong>of</strong> themodeling organization, the standards year, and the form name. A hard copy <strong>of</strong> all tables inForm A-5 shall be included in a submission appendix.219
The <strong>Florida</strong> Commission on Hurricane Loss Projection MethodologyAppendix 4 – Forms in Actuarial StandardsFigure 42<strong>State</strong> <strong>of</strong> <strong>Florida</strong> by North/Central/South RegionsNorthCentralSouthFigure 43<strong>State</strong> <strong>of</strong> <strong>Florida</strong> by Coastal/Inland CountiesCoastalInlandThe results are shown on Form A-5.220
The <strong>Florida</strong> Commission on Hurricane Loss Projection MethodologyAppendix 4 – Forms in Actuarial StandardsForm A-5: Percentage Change in Output RangesC. Provide color-coded maps by county reflecting the percentage changes in the average losscosts with specified deductibles for frame owners, masonry owners, frame renters, masonryrenters, frame condo unit owners, masonry condo unit owners, mobile home, and commercialresidential from the output ranges from the previously accepted model.Counties with a negative percentage change (reduction in loss costs) shall be indicated withshades <strong>of</strong> blue; counties with a positive percentage change (increase in loss costs) shall beindicated with shades <strong>of</strong> red; and counties with no percentage change shall be white. Thelarger the percentage change in the county, the more intense the color-shade.221
The <strong>Florida</strong> Commission on Hurricane Loss Projection MethodologyAppendix 4 – Forms in Actuarial StandardsThe percentage changes in the county level weighted average loss costs with thespecified deductible for the eight policy types are shown in Figures 44 to 51below.Figure 44. Frame Owners - % changes by county222
The <strong>Florida</strong> Commission on Hurricane Loss Projection MethodologyAppendix 4 – Forms in Actuarial StandardsFigure 45. Masonry Owners - % changes by county223
The <strong>Florida</strong> Commission on Hurricane Loss Projection MethodologyAppendix 4 – Forms in Actuarial StandardsFigure 46. Mobile Homes - % changes by county224
The <strong>Florida</strong> Commission on Hurricane Loss Projection MethodologyAppendix 4 – Forms in Actuarial StandardsFigure 47. Frame Renters - % changes by county225
The <strong>Florida</strong> Commission on Hurricane Loss Projection MethodologyAppendix 4 – Forms in Actuarial StandardsFigure 48. Masonry Renters - % changes by county226
The <strong>Florida</strong> Commission on Hurricane Loss Projection MethodologyAppendix 4 – Forms in Actuarial StandardsFigure 49. Frame Condos - % changes by county227
The <strong>Florida</strong> Commission on Hurricane Loss Projection MethodologyAppendix 4 – Forms in Actuarial StandardsFigure 50. Masonry Condos - % changes by county228
The <strong>Florida</strong> Commission on Hurricane Loss Projection MethodologyAppendix 4 – Forms in Actuarial StandardsFigure 51. Commercial Residential - % changes by county229
The <strong>Florida</strong> Commission on Hurricane Loss Projection MethodologyAppendix 4 – Forms in Actuarial StandardsForm A-7: Percentage Change in Logical Relationship to RiskA. Provide summaries <strong>of</strong> the percentage change in logical relationship to risk exhibits from thepreviously accepted model in the format shown in the file named “2011FormA7.xlsx.”B. Create exposure sets for each exhibit by modeling all <strong>of</strong> the structures from the appropriateNotional Set listed below at each <strong>of</strong> the locations in “Location Grid B” as described in thefile “NotionalInput11.xlsx.” Refer to the Notional Policy Specifications provided in Form A-6 for additional modeling information. Explain any assumptions, deviations, and differencesfrom the prescribed exposure information.ExhibitNotional SetDeductible Sensitivity Set 1Construction Sensitivity Set 2Policy Form Sensitivity Set 3Coverage Sensitivity Set 4Building Code/Enforcement (Year Built) Sensitivity Set 5Building Strength Sensitivity Set 6Condo Unit Floor Sensitivity Set 7Number <strong>of</strong> Stories Sensitivity Set 8<strong>Model</strong>s shall treat points in Location Grid B as coordinates that would result from ageocoding process. <strong>Model</strong>s shall treat points by simulating loss at exact location or by usingthe nearest modeled parcel/street/cell in the model.Provide the results statewide (overall percentage change) and by the regions defined inForm A-5.C. Provide this form in Excel format. The file name shall include the abbreviated name <strong>of</strong> themodeling organization, the standards year, and the form name. A hard copy <strong>of</strong> all tables inForm A-7 shall be included in a submission appendix.230
The <strong>Florida</strong> Commission on Hurricane Loss Projection MethodologyAppendix 4 – Forms in Actuarial Standards231
The <strong>Florida</strong> Commission on Hurricane Loss Projection MethodologyAppendix 4 – Forms in Actuarial Standards232
The <strong>Florida</strong> Commission on Hurricane Loss Projection MethodologyAppendix 4 – Forms in Actuarial Standards233
The <strong>Florida</strong> Commission on Hurricane Loss Projection MethodologyAppendix 4 – Forms in Actuarial Standards234
The <strong>Florida</strong> Commission on Hurricane Loss Projection MethodologyAppendix 4 – Forms in Actuarial Standards235
The <strong>Florida</strong> Commission on Hurricane Loss Projection MethodologyAppendix 4 – Forms in Actuarial Standards236
The <strong>Florida</strong> Commission on Hurricane Loss Projection MethodologyAppendix 4 – Forms in Actuarial Standards237
The <strong>Florida</strong> Commission on Hurricane Loss Projection MethodologyAppendix 4 – Forms in Actuarial Standards238
The <strong>Florida</strong> Commission on Hurricane Loss Projection MethodologyAppendix 4 – Forms in Actuarial StandardsForm A-8: Probable Maximum Loss for <strong>Florida</strong>A. Provide a detailed explanation <strong>of</strong> how the Expected Annual Hurricane Losses and ReturnPeriods are calculated.The expected annual losses and return periods are based on the <strong>EQECAT</strong>stochastic event set <strong>of</strong> 32,032 stochastic events affecting the mainland United<strong>State</strong>s, <strong>of</strong> which 16,765 affect the 2007 FHCF exposure data provided by theCommission. Each <strong>of</strong> the 16,765 hurricanes has an annual frequency defined in themodel, and a modeled result for Personal and Commercial Residential ZeroDeductible statewide loss, using the FHCF exposure data. When the 16,765hurricanes are sorted in descending order <strong>of</strong> loss (Personal and CommercialResidential), the exceedance frequency for each loss is given by the sum <strong>of</strong> allhurricane frequencies with losses at or above that level.Each row <strong>of</strong> the tables in Part A represents a range <strong>of</strong> losses. We calculated theaverage loss for each range as the sum <strong>of</strong> all losses (from the 16,765 hurricanes)falling within the range divided by the number <strong>of</strong> such losses (the number <strong>of</strong> lossesis provided in the ‘No. <strong>of</strong> storms’ column).We calculated the expected annual hurricane loss for each range by summing theproduct <strong>of</strong> loss and annual frequency over all hurricanes with losses falling withinthe range.We calculated the return period in years for each range by first interpolating theexceedance frequency to the value corresponding to the average loss for the range(this was done linearly between the adjacent hurricane losses, from among the16,765 hurricanes). Taking this exceedance frequency to be , we calculated thereturn period in years as 1/ (1 – exp(-)).B. Complete Part A showing the personal and commercial residential probable maximum lossfor <strong>Florida</strong>. For the Expected Annual Hurricane Losses column, provide personal andcommercial residential, zero deductible statewide loss costs based on the 2007 <strong>Florida</strong>Hurricane Catastrophe Fund’s aggregate personal and commercial residential exposuredata found in the file named “hlpm2007c.exe.”In the column, Return Period (Years), provide the return period associated with the averageloss within the ranges indicated on a cumulative basis.For example, if the average loss is $4,705 million for the range $4,501 million to $5,000million, provide the return period associated with a loss that is $4,705 million or greater.For each loss range in millions ($1,001-$1,500, $1,501-$2,000, $2,001-$2,500) the averageloss within that range should be identified and then the return period associated with that239
The <strong>Florida</strong> Commission on Hurricane Loss Projection MethodologyAppendix 4 – Forms in Actuarial Standardsloss calculated. The return period is then the reciprocal <strong>of</strong> the probability <strong>of</strong> the lossequaling or exceeding this average loss size.The probability <strong>of</strong> equaling or exceeding the average <strong>of</strong> each range should be smaller as theranges increase (and the average losses within the ranges increase). Therefore, the returnperiod associated with each range and average loss within that range should be larger as theranges increase. Return periods shall be based on cumulative probabilities.A return period for an average loss <strong>of</strong> $4,705 million within the $4,501-$5,000 million rangeshould be lower than the return period for an average loss <strong>of</strong> $5,455 million associated witha $5,001- $6,000 million range.See the completed form on next page.C. Provide a graphical comparison <strong>of</strong> the current submission Residential Return Periods losscurve to the previously accepted submission Residential Return Periods loss curve.Residential Return Period (Years) shall be shown on the y-axis on a log 10 scale with Lossesin Billions shown on the x-axis. The legend shall indicate the corresponding submission witha solid line representing the current year and a dotted line representing the previouslyaccepted submission.See Figure 52 in this form.D. Provide the estimated loss and uncertainty interval for each <strong>of</strong> the Personal and CommercialResidential Return Periods given in Part B. Describe how the uncertainty intervals werederived.See the completed form below. The uncertainty intervals were derived byconstructing exceedance curves based on the extremes <strong>of</strong> the 95% confidenceinterval on each event.E. Provide this Form Excel format. The file name shall include the abbreviated name <strong>of</strong> themodeling organization, the standards year, and the form name. A hard copy <strong>of</strong> Form A-8shall be included in a submission appendix.The Form A-8 results appear in the file 2011FormA8_<strong>EQECAT</strong>_16April2013.xls.240
The <strong>Florida</strong> Commission on Hurricane Loss Projection MethodologyAppendix 4 – Forms in Actuarial StandardsFORM A-8: PERSONAL AND COMMERCIAL RESIDENTIAL PROBABLE MAXIMUM LOSS FOR FLORIDAPart ALOSS RANGE (Millions)EXPECTEDRETURNTOTAL LOSS AVERAGE NUMBER OF ANNUALPERIOD(Millions) LOSS (Millions) HURRICANES HURRICANE(YEARS)LOSSES (Millions)$ - TO $ 500 $ 833,788 $ 1485,626 $ 48.32$ 501 TO $ 1,000 $ 1,278,060 $ 7351,740 $ 65.33$ 1,001 TO $ 1,500 $ 1,471,179 $ 1,2401,186 $ 78.63$ 1,501 TO $ 2,000 $ 1,464,513 $ 1,743840 $ 76.93$ 2,001 TO $ 2,500 $ 1,569,135 $ 2,238701 $ 76.94$ 2,501 TO $ 3,000 $ 1,479,122 $ 2,734541 $ 64.24$ 3,001 TO $ 3,500 $ 1,529,618 $ 3,234473 $ 78.04$ 3,501 TO $ 4,000 $ 1,376,823 $ 3,752367 $ 57.25$ 4,001 TO $ 4,500 $ 1,429,116 $ 4,253336 $ 68.05$ 4,501 TO $ 5,000 $ 1,497,485 $ 4,754315 $ 80.25$ 5,001 TO $ 6,000 $ 2,586,872 $ 5,504470 $ 121.56$ 6,001 TO $ 7,000 $ 2,615,622 $ 6,474404 $ 144.77$ 7,001 TO $ 8,000 $ 2,636,369 $ 7,490352 $ 113.77$ 8,001 TO $ 9,000 $ 2,291,557 $ 8,487270 $ 95.08$ 9,001 TO $ 10,000 $ 1,885,998 $ 9,477199 $ 77.09$ 10,001 TO $ 11,000 $ 2,137,258 $ 10,477204 $ 90.39$ 11,001 TO $ 12,000 $ 1,987,409 $ 11,488173 $ 82.110$ 12,001 TO $ 13,000 $ 2,119,907 $ 12,470170 $ 92.311$ 13,001 TO $ 14,000 $ 1,817,719 $ 13,465135 $ 78.811$ 14,001 TO $ 15,000 $ 1,814,915 $ 14,519125 $ 75.312$ 15,001 TO $ 16,000 $ 1,800,916 $ 15,525116 $ 91.113$ 16,001 TO $ 17,000 $ 1,570,837 $ 16,53595 $ 65.014$ 17,001 TO $ 18,000 $ 2,026,442 $ 17,469116 $ 79.314$ 18,001 TO $ 19,000 $ 1,847,494 $ 18,475100 $ 66.215$ 19,001 TO $ 20,000 $ 1,635,991 $ 19,47684 $ 63.116$ 20,001 TO $ 21,000 $ 1,247,860 $ 20,45761 $ 57.217$ 21,001 TO $ 22,000 $ 1,461,447 $ 21,49268 $ 48.718$ 22,001 TO $ 23,000 $ 1,486,280 $ 22,51966 $ 59.018$ 23,001 TO $ 24,000 $ 1,502,407 $ 23,47564 $ 63.419$ 24,001 TO $ 25,000 $ 1,322,954 $ 24,49954 $ 60.520$ 25,001 TO $ 26,000 $ 1,149,171 $ 25,53745 $ 53.721$ 26,001 TO $ 27,000 $ 1,114,383 $ 26,53342 $ 38.922$ 27,001 TO $ 28,000 $ 1,621,979 $ 27,49159 $ 67.822$ 28,001 TO $ 29,000 $ 1,625,188 $ 28,51257 $ 51.824$ 29,001 TO $ 30,000 $ 1,092,329 $ 29,52237 $ 43.125$ 30,001 TO $ 35,000 $ 5,539,109 $ 32,392171 $ 224.527$ 35,001 TO $ 40,000 $ 6,753,212 $ 37,518180 $ 267.233$ 40,001 TO $ 45,000 $ 5,023,871 $ 42,575118 $ 181.341$ 45,001 TO $ 50,000 $ 4,902,466 $ 47,597103 $ 201.050$ 50,001 TO $ 55,000 $ 3,912,902 $ 52,17275 $ 118.259$ 55,001 TO $ 60,000 $ 4,382,327 $ 57,66276 $ 205.370$ 60,001 TO $ 65,000 $ 2,995,267 $ 62,40148 $ 128.790$ 65,001 TO $ 70,000 $ 3,503,130 $ 67,36852 $ 104.5108$ 70,001 TO $ 75,000 $ 2,529,365 $ 72,26835 $ 65.9119$ 75,001 TO $ 80,000 $ 2,804,186 $ 77,89436 $ 69.2139$ 80,001 TO $ 90,000 $ 4,527,128 $ 83,83654 $ 164.1172$ 90,001 TO $ 100,000 $ 3,854,167 $ 94,00441 $ 95.8222$ 100,001 TO Maximum $ 10,657,571 $ 125,38385 $ 472.5891TOTAL: 16,765 $4,871.4*Zero deductible statewide loss using 2007 FHCF exposure data – file name: hlpm2007c.exe.241
The <strong>Florida</strong> Commission on Hurricane Loss Projection MethodologyAppendix 4 – Forms in Actuarial StandardsFORM A-8: PERSONAL AND COMMERCIAL RESIDENTIAL PROBABLE MAXIMUM LOSS FOR FLORIDAReturn Time(years)Estimated Loss(Millions)Uncertainty Interval*Top Event $202,837 $124,420 to 284,1541000 $144,765 $68,477 to $195,536500 $124,425 $61,727 to $164,405250 $100,496 $53,863 to $150,910100 $70,077 $34,998 to $103,86650 $48,924 $22,776 to $75,78920 $24,445 $10,353 to $42,41610 $11,119 $4,573 to $20,8495 $3,711 $1,433 to $8,410*Uncertainty bounds are not a standard output <strong>of</strong> the <strong>EQECAT</strong> model.242
The <strong>Florida</strong> Commission on Hurricane Loss Projection MethodologyAppendix 4 – Forms in Actuarial StandardsFigure 52. Current <strong>Submission</strong> Return Periods vs. Prior Year’s <strong>Submission</strong> Return Periods243
The <strong>Florida</strong> Commission on Hurricane Loss Projection MethodologyAppendix 5 – Forms in Statistical StandardsAppendix 5 – Forms in Statistical Standards244
The <strong>Florida</strong> Commission on Hurricane Loss Projection MethodologyAppendix 5 – Forms in Statistical StandardsForm S-1: Probability and Frequency <strong>of</strong> <strong>Florida</strong>Landfalling Hurricanes per YearComplete the table below showing the probability and modeled frequency <strong>of</strong> landfalling <strong>Florida</strong>hurricanes per year. <strong>Model</strong>ed probability shall be rounded to four decimal places. The historicalprobabilities and frequencies below have been derived from the Base Hurricane Storm Set asdefined in Standard M-1.If the data are partitioned or modified, provide the historical probabilities and frequencies forthe applicable partition (and its complement) or modification as well as the modeled probabilitiesand frequencies in additional copies <strong>of</strong> Form S-1.<strong>Model</strong> ResultsProbability <strong>of</strong> <strong>Florida</strong> Landfalling Hurricanes per YearNumberOf HurricanesPer YearHistoricalProbabilities<strong>Model</strong>edProbabilitiesHistoricalFrequencies<strong>Model</strong>edFrequencies0 0.5982 0.5515 67 621 0.2589 0.3095 29 352 0.1161 0.1041 13 123 0.0268 0.0272 3 34 0.0000 0.0062 0 15 0.0000 0.0013 0 06 0.0000 0.0003 0 07 0.0000 0.0000 0 08 0.0000 0.0000 0 09 0.0000 0.0000 0 010 or more 0.0000 0.0000 0 0245
The <strong>Florida</strong> Commission on Hurricane Loss Projection MethodologyAppendix 5 – Forms in Statistical StandardsForm S-2: Examples <strong>of</strong> Loss Exceedance EstimatesProvide projections <strong>of</strong> the aggregate personal and commercial insured loss for variousprobability levels using the notional risk data set specified in Form A-1 and using the 2007<strong>Florida</strong> Hurricane Catastrophe Fund aggregate personal and commercial residential exposuredata set provided in the file named “hlpm2007c.exe.” Provide the total average annual loss forthe loss exceedance distribution. If the modeling methodology does not allow the model toproduce a viable answer, please state so and why.Part AReturn Time(years)Probability <strong>of</strong>ExceedanceEstimated LossHypothetical Data Set($)Estimated Personal &Commercial ResidentialLoss FHCF Data Set ($)Top event 91,122,656 202,836,869,12010000 0.0001 87,026,768 201,156,984,8325000 0.0002 83,007,592 182,196,322,3042000 0.0005 71,940,240 160,724,713,4721000 0.001 64,360,644 136,692,400,128500 0.002 55,906,564 117,151,850,496250 0.004 47,712,752 93,114,261,504100 0.01 35,839,088 62,828,175,36050 0.02 26,089,260 41,719,914,49620 0.0514,210,14218,666,905,60010 0.1 6,841,375 7,040,454,6565 0.2 2,349,228 1,809,055,360Part BMean (Total Average AnnualLoss)2,482,754 3,379,905,792Median 15,341 3,565,291Standard Deviation 6,843,422 12,161,240,064Interquartile Range 1,423,985 986,077,952Sample Size 32,032 events 32,032 events246
The <strong>Florida</strong> Commission on Hurricane Loss Projection MethodologyAppendix 5 – Forms in Statistical StandardsForm S-3: Distributions <strong>of</strong> Stochastic Hurricane ParametersProvide the probability distribution functional form used for each stochastic hurricaneparameter in the model. Provide a summary <strong>of</strong> the rationale for each functional form selectedfor each general classification.Stochastic HurricaneParameter (Functionor Variable)Landfall LocationTrack DirectionMaximum SustainedWind SpeedRadius <strong>of</strong> MaximumWindsTranslational SpeedInland Filling RatePr<strong>of</strong>ile FactorFunctional Form<strong>of</strong> DistributionMaximumLikelihoodEstimation KernelSmoothingMaximumLikelihoodEstimation KernelSmoothingMaximumLikelihoodEstimation KernelSmoothingLognormalLognormalNormalLognormalData SourceHURDATHURDATHURDATNWS 38 (to 1984),NHC TC Reportsand Advisories(1985-2004)NWS 38 (to 1984),NHC TC Reportsand Advisories(1985-2004)HURDATNHC AdvisoriesYearRangeUsed1900-20111900-20111900-20111900-20041900-20041900-20061963-1967;1992-2008Justification for FunctionalFormPreferred method <strong>of</strong> derivation soas to provide agreement withhistorical data and to extrapolateto full range <strong>of</strong> potential valuesPreferred method <strong>of</strong> derivation soas to provide agreement withhistorical data and to extrapolateto full range <strong>of</strong> potential valuesPreferred method <strong>of</strong> derivation soas to provide agreement withhistorical data and to extrapolateto full range <strong>of</strong> potential valuesProvides best fit to historical dataamong commonly useddistributionsProvides best fit to historical dataamong commonly useddistributionsProvides best fit to historical dataamong commonly useddistributionsProvides best fit to historical dataamong commonly useddistributions247
The <strong>Florida</strong> Commission on Hurricane Loss Projection MethodologyAppendix 5 – Forms in Statistical StandardsForm S-4: Validation ComparisonsA. Provide five validation comparisons <strong>of</strong> actual personal residential exposures and loss tomodeled exposures and loss. These comparisons must be provided by line <strong>of</strong> insurance,construction type, policy coverage, county or other level <strong>of</strong> similar detail in addition to totallosses. Include loss as a percent <strong>of</strong> total exposure. Total exposure represents the total amount<strong>of</strong> insured values (all coverages combined) in the area affected by the hurricane. This wouldinclude exposures for policies that did not have a loss. If this is not available, use exposuresfor only those policies that had a loss. Specify which was used. Also, specify the name <strong>of</strong> thehurricane event compared.B. Provide a validation comparison <strong>of</strong> actual commercial residential exposures and loss tomodeled exposures and loss. Use and provide a definition <strong>of</strong> the model’s relevantcommercial residential classificationsC. Provide scatter plot(s) <strong>of</strong> modeled vs. historical losses for each <strong>of</strong> the required validationcomparisons. (Plot the historical losses on the x-axis and the modeled losses on the y-axis.)Rather than using directly a specific published hurricane wind field, the winds underlying themodeled loss cost calculations must be produced by the model being evaluated and should bethe same hurricane parameters as used in completing Form A-2.Totals by CompanyCompany Event Year TIV ($M)Actual($M)USWIND($M)DifferenceA Opal 1995 222,270.00 112.91 100.74 -10.8%B Andrew 1992 4,578.28 48.20 42.42 -12.0%C Andrew 1992 1,229.95 19.93 18.57 -6.8%D Andrew 1992 793.41 30.75 29.66 -3.5%E Andrew 1992 608.67 29.02 28.88 -0.5%F Charley 2004 221,681.89 1134.00 1,088.24 -4.0%F Frances 2004 221,681.89 686.19 352.40 -48.6%F Ivan 2004 221,681.89 437.67 454.37 3.8%F Jeanne 2004 221,681.89 362.76 456.70 25.9%F Wilma 2005 240,854.58 902.63 885.62 -1.9%248
The <strong>Florida</strong> Commission on Hurricane Loss Projection MethodologyAppendix 5 – Forms in Statistical StandardsFigure 53. Historical vs. <strong>Model</strong>ed Losses for Companies A to F249
The <strong>Florida</strong> Commission on Hurricane Loss Projection MethodologyAppendix 5 – Forms in Statistical Standards(FORM S-4 CONTINUED)Company C by Line <strong>of</strong> BusinessEvent LOB TIV ($M) Actual ($M)USWIND($M)DifferenceAndrew Mobile Homes 56.16 0.82 0.75 -8.1%Fire & Extended 11.80 0.16 0.21 30.6%Homeowners 1,017.47 17.28 16.06 -7.1%Renters/Tenants 10.99 0.13 0.10 -25.8%Landlord 74.29 1.00 1.00 -0.2%Condominiums 59.25 0.54 0.46 -15.0%Total 1,229.95 19.93 18.57 -6.8%Figure 54. Historical vs. <strong>Model</strong>ed Losses by LOB for Company C250
The <strong>Florida</strong> Commission on Hurricane Loss Projection MethodologyAppendix 5 – Forms in Statistical Standards(FORM S-4 CONTINUED)Company D by CountyEvent County TIV ($M) Actual ($M)USWIND($M)DifferenceAndrew Broward 234.51 0.50 0.54 7.8%Charlotte 25.64 0.00 0.00 0.0%Collier 44.65 0.18 0.15 -17.7%Hendry 2.74 0.00 0.00 0.0%Martin 8.22 0.00 0.00 0.0%Miami-Dade 203.79 30.01 28.98 -3.4%Monroe 0.31 0.00 0.00 0.0%Total 793.41 30.75 29.66 -3.5%Figure 55. Historical vs. <strong>Model</strong>ed Losses by County for Company D251
The <strong>Florida</strong> Commission on Hurricane Loss Projection MethodologyAppendix 5 – Forms in Statistical Standards(FORM S-4 CONTINUED)Company E by Line <strong>of</strong> BusinessEvent LOB TIV ($M) Actual ($M)USWIND($M)DifferenceAndrew Homeowner Form 1 0.15 0.02 0.02 -20.7%Homeowner Form 3 179.08 7.34 8.34 13.7%Homeowner Form 4 8.25 0.22 0.26 16.0%Homeowner Form 5 368.84 20.82 19.57 -6.0%Homeowner Form 6 52.36 0.63 0.70 10.9%Total 608.67 29.02 28.88 -0.5%Figure 56. Historical vs. <strong>Model</strong>ed Losses by LOB for Company E252
The <strong>Florida</strong> Commission on Hurricane Loss Projection MethodologyAppendix 5 – Forms in Statistical StandardsTotals by Company – Commercial ResidentialUSWINDCompany Event Year TIV ($M) Actual ($M)Difference($M)G Wilma 2005 10,869.45 156.34 153.33 -1.93%Commercial residential exposures are mapped to the vulnerability functions listed inStandard V-1, including both low-rise and high-rise structure types.Figure 57. Historical vs. <strong>Model</strong>ed Losses – Commercial Residential253
The <strong>Florida</strong> Commission on Hurricane Loss Projection MethodologyAppendix 5 – Forms in Statistical StandardsForm S-5: Average Annual Zero Deductible <strong>State</strong>wide Loss Costs –Historical versus <strong>Model</strong>edA. Provide the average annual zero deductible statewide personal and commercial residentialloss costs produced using the list <strong>of</strong> hurricanes in the Base Hurricane Storm Set as defined inStandard M-1 based on the 2007 <strong>Florida</strong> Hurricane Catastrophe Fund’s aggregate personaland commercial residential exposure data found in the file named “hlpm2007c.exe”.B. Provide a comparison with the statewide personal and commercial residential loss costsproduced by the model on an average industry basisAverage Annual Zero Deductible <strong>State</strong>wide Personal andCommercial Residential Loss CostsTime PeriodHistoricalHurricanesProduced by <strong>Model</strong>Current <strong>Submission</strong> $4.00 Billion $4.87 BillionPreviously Accepted <strong>Submission</strong> $3.80 Billion $4.70 BillionPercentage Change Current<strong>Submission</strong> / PreviouslyAccepted <strong>Submission</strong>Second Previously Accepted<strong>Submission</strong>Percentage Change Current<strong>Submission</strong> / Second PreviouslyAccepted <strong>Submission</strong>5.22% 3.62%N/AN/AN/AN/AC. Provide the 95% confidence interval on the differences between the mean <strong>of</strong> the historicaland modeled personal and commercial residential loss.Based on the historical storm set for the 112 year experience period (1900through 2011) and using the <strong>Florida</strong> Hurricane Catastrophe Fund’s 2007aggregate personal residential exposure data resulted in a statewide historicalannual average zero deductible loss <strong>of</strong> $4.00 billion and a modeled annualaverage zero deductible loss <strong>of</strong> $4.87 billion.The difference can be shown to be statistically insignificant as follows:Let X i (i=1…85) represent the losses from the 85 historical events, whichoccurred over 112 years. Then the historical annual loss cost A is given by:254
The <strong>Florida</strong> Commission on Hurricane Loss Projection MethodologyAppendix 5 – Forms in Statistical StandardsA = X i / 112 (where i = 1…85) = $4.00 BillionThe standard error <strong>of</strong> A is given by:S.E (A) = SQRT(A 2 /85 + 85* Var ({X i }) /112 2 ) = $0.92 Billionwhere Var ({X i }) is the variance <strong>of</strong> the historical losses (from the 85 storms). Thisassumes that the X i have identical independent distributions and the frequencyhas a Poisson distribution.Using the t-test the two-tailed 90% confidence for the true annual loss costinterval (narrower than the 95% confidence interval) is given by the range:A1 = A - 1.671 * S.E (A) = $2.45 BillionA2 = A + 1.671 * S.E (A) = $5.54 BillionThe modeled annual loss cost ($4.87 Billion) is within the above range, so thedifference between the historical and the modeled results is not statisticallysignificant.D. If the data are partitioned or modified, provide the average annual zero deductible statewidepersonal and commercial residential loss costs for the applicable partition (and itscomplement) or modification, as well as the modeled average annual zero deductiblestatewide personal and commercial residential loss costs in additional copies <strong>of</strong> Form S-5.The data are not partitioned or modified.255
The <strong>Florida</strong> Commission on Hurricane Loss Projection MethodologyAppendix 6 - Credentials <strong>of</strong> Selected PersonnelAppendix 6 - Credentials <strong>of</strong> Selected Personnel256
The <strong>Florida</strong> Commission on Hurricane Loss Projection MethodologyAppendix 6 - Credentials <strong>of</strong> Selected PersonnelCREDENTIALSDr. James R. (Bob) Bailey has over 15 years experience as a technical consultant, researcher,and project manager. His doctoral work in Civil Engineering included an emphasis on windengineering, specifically wind effects on buildings and components. He is experienced insubjects related to construction materials, solid mechanics, dynamics, numerical analysis,structural analysis and design. He served as a consultant to NASA by performing an on-siteinspection at the Marshall Space Flight Center to assess the structural integrity <strong>of</strong> buildingssubject to tornado winds. He also has performed on-site inspections <strong>of</strong> commercial high-risebuildings in Dallas to evaluate the performance <strong>of</strong> structurally-glazed window glass systemssubject to extreme wind events. He is a member <strong>of</strong> the API subcommittee that is developing anew wind loading specification for drilling masts and derricks. Dr. Bailey holds a Ph.D., M.S.,and B.S. in Civil Engineering from Texas Tech University.Dr. James J. Johnson, Consultant to <strong>EQECAT</strong>, has more than 30 years <strong>of</strong> project managementand civil/nuclear engineering experience, serving the insurance/reinsurance, Fortune 500, andnuclear (domestic and international) industries. From its creation in 1994 until 2000 he headedthe <strong>EQECAT</strong> division, a group that provides catastrophic risk management services to the globalinsurance and reinsurance industries, including catastrophe modeling s<strong>of</strong>tware, portfolio andsingle site analysis, risk management consulting, training, and information. In addition, Dr.Johnson has participated in the development, implementation, and teaching <strong>of</strong> seismic risk andseismic margin assessment methodologies. He has participated in seismic PRAs <strong>of</strong> over 20nuclear power plants. His participation encompasses many aspects including hazard definition,seismic response and uncertainty determination, detailed walkdowns, and fragility assessment.Dr. Johnson has contributed to over 80 technical reports and journal articles and is a member <strong>of</strong>the Earthquake Engineering Research Institute, American Society <strong>of</strong> Civil Engineers, and othertechnical organizations. Dr. Johnson holds a Ph.D. and M.S. in civil engineering from theUniversity <strong>of</strong> Illinois, and a B.C.E. in civil engineering from the University <strong>of</strong> Minnesota. He isalso a licensed Civil Engineer in California.Dr. Mahmoud Khater, Senior Vice President and Chief Technical Officer <strong>of</strong> <strong>EQECAT</strong>, hasmore than 20 years <strong>of</strong> engineering experience in natural hazards risk and reliability assessment;in the insurance, power, industrial, and commercial sectors; and in the behavior <strong>of</strong> structures andlifelines under seismic and wind loading. His experience includes seismic, fire, and hurricanehazard and risk assessments for single buildings, lifeline systems, and portfolios <strong>of</strong> properties.Since joining <strong>EQECAT</strong>, Dr. Khater has served as <strong>EQECAT</strong>’s project and technical manager forthe development <strong>of</strong> state-<strong>of</strong>-the-art probabilistic analysis computer programs for application tocivil engineering problems, seismic risk analysis and hurricane risk assessment. Responsibilitieshave included several earthquake and hurricane structural response analyses and portfolioanalyses. Dr. Khater holds a Ph.D. in structural engineering from Cornell University, and aM.Sc. and M.Bc. in structural engineer from Cairo University in Egypt. He is an active memberin the Earthquake Engineering Research Institute and the American Society <strong>of</strong> Engineers.Dr. Omar Khemici has over 20 years <strong>of</strong> extensive pr<strong>of</strong>essional experience in structuralengineering and natural hazard risk assessment and mitigation. As a Director for <strong>EQECAT</strong>, heprovides technical direction and support to a variety <strong>of</strong> key projects. He performed the QA257
The <strong>Florida</strong> Commission on Hurricane Loss Projection MethodologyAppendix 6 - Credentials <strong>of</strong> Selected Personnelverification <strong>of</strong> different USWIND modules through hand calculations, and participated in thedevelopment <strong>of</strong> the USWIND and USQUAKE vulnerability functions. He recentlyparticipated in the development <strong>of</strong> the USWildfire. Dr. Khemici is project manager for jobswith the primary insurance, reinsurance companies, and financial institutions. Dr. Khemicigraduated from Stanford University in 1982 and is a licensed Civil Engineer in California.Raymond Kincaid, Senior Vice President <strong>of</strong> <strong>EQECAT</strong>, has more than 20 years <strong>of</strong> experience innatural hazards risk management. For the last 10 years he has directed the GUI portion <strong>of</strong> thedevelopment <strong>of</strong> several s<strong>of</strong>tware products used to assess and manage insurance portfolio riskresulting from catastrophic events including hurricanes, earthquakes, high winds, and flood.Products developed under his guidance include USWIND, USQUAKE, UKWIND andUKFLOOD. He also has extensive experience in the design and analysis <strong>of</strong> structures to resistextreme loadings including earthquakes, hurricane, blast, and nuclear weapons effects. Mr.Kincaid has directed major natural phenomena and seismic hazard analysis programs fornumerous government, manufacturing and commercial clients. Representative clients include theDepartment <strong>of</strong> Energy, U.S. Postal Service, Allendale Insurance, Pacific Bell, Anheuser-Busch,3M, Northrop, Unisys, General Foods, Litton, Parker-Hannifin, and Rockwell International.Thomas I. Larsen, Senior Vice President <strong>of</strong> <strong>EQECAT</strong>, has more than 15 years <strong>of</strong> pr<strong>of</strong>essionalstructural engineering, research, computer programming, and project management experience.He participated in the development <strong>of</strong> the USWIND and USQUAKE natural catastrophefinancial risk assessment s<strong>of</strong>tware programs. This includes project management for analyses forselected clients, review <strong>of</strong> the s<strong>of</strong>tware methodology for consistency and completeness, andcompilation <strong>of</strong> post-earthquake/hurricane damage and loss experience data. Prior work at<strong>EQECAT</strong> includes natural catastrophe hazard (earthquake and related perils such as tsunami andfire following, hurricane and other windstorm, and volcano) and/or risk analysis for manydifferent regions including Australia, Chile, Iceland, Italy, New Zealand, Puerto Rico, theSakhalin Islands, and the Caspian Sea area. Mr. Larsen holds a M.Eng. in structural engineeringfrom the University <strong>of</strong> California in Berkeley and B.S. in structural engineering from StanfordUniversity. He is presently a licensed civil engineer in California.David F. Smith, Senior Vice President <strong>of</strong> <strong>EQECAT</strong>, has more than 10 years <strong>of</strong> pr<strong>of</strong>essionalexperience in hurricane model design, natural hazard research, s<strong>of</strong>tware development, andproject management. He participated in the development <strong>of</strong> the USWIND and USQUAKEnatural catastrophe financial risk assessment s<strong>of</strong>tware programs. This includes development <strong>of</strong>the hazard portions <strong>of</strong> both programs, risk analyses for selected clients, and review <strong>of</strong> thes<strong>of</strong>tware methodology for consistency and completeness. Mr. Smith also managed thedevelopment <strong>of</strong> the hazard portion <strong>of</strong> the <strong>EQECAT</strong> hurricane/typhoon models for Japan and theCaribbean. Prior work at <strong>EQECAT</strong> includes natural catastrophe hazard and/or risk analysis formany different regions including Puerto Rico, Jamaica, Costa Rica, the Philippines, and Japan.Mr. Smith holds a M.S. in geophysics from Yale University and a B.S. in mathematics from theUniversity <strong>of</strong> Chicago.258
The <strong>Florida</strong> Commission on Hurricane Loss Projection MethodologyAppendix 7 - Independent ReviewAppendix 7 - Independent Review259
The <strong>Florida</strong> Commission on Hurricane Loss Projection MethodologyAppendix 7 - Independent ReviewThe Engineering, Statistical, and Scientific Validity <strong>of</strong> <strong>EQECAT</strong>USWIND <strong>Model</strong>ing S<strong>of</strong>twareIMPLICATIONS FOR CATASTROPHE MODELING WITHIN THECOMMERCIAL HIGHLY PROTECTED RISK PROPERTY INSURANCE INDUSTRYPeter J. KellyLixin ZengArkwright Mutual Insurance CompanyAbstractThe validity <strong>of</strong> <strong>EQECAT</strong> USWIND 1 modeling s<strong>of</strong>tware is reviewed from several perspectives.Using several external sources for hurricane data, it is found that the storm data set represents thehistorical and expected long term storm patterns well and generally without bias. By reviewingstorm damage estimates against a theoretical understanding <strong>of</strong> the wind effects on structures aswell as actual experience, it was found that the model’s damage estimates reasonably reflect thephysical properties <strong>of</strong> force and damage and that the system has no systematic bias in its damageestimation logic. One minor shortcoming in damage estimation was uncovered in the manner thatUSWIND uses geocoding during initial data import, especially for areas with very large zipcodes. The vendor has corrected this problem in subsequent versions <strong>of</strong> the s<strong>of</strong>tware.All in all, the <strong>EQECAT</strong> modeling package represents a very well conceived and thoroughlyresearched natural disaster modeling environment for hurricanes. External data and expertopinion have been incorporated into the s<strong>of</strong>tware. Our independent experiments as well as theadvice <strong>of</strong> meteorological and structural experts lead us to conclude that the systems is anexcellent tool for managing the risk <strong>of</strong> natural disasters in the commercial property insuranceindustry.Presented November 7, 1996 at the ACI Conference for Catastrophe Reinsurance, New York,NY.Author information: peter_kelly@arkwright.com and lixin_zeng@arkwright.com1 USWIND is a trademark <strong>of</strong> <strong>EQECAT</strong>, Incorporated, headquartered in San Francisco.260
The <strong>Florida</strong> Commission on Hurricane Loss Projection MethodologyAppendix 7 - Independent ReviewIntroductionUse <strong>of</strong> natural disaster modeling s<strong>of</strong>tware for windstorm exposures has increased in recent yearswith the advent <strong>of</strong> improved s<strong>of</strong>tware and the increase in natural disaster-caused damage duringthe most recent 10 years. For insurers in the Highly Protected Risk (HPR) commercial propertymarketplace, these s<strong>of</strong>tware programs represent an important advance and a significantchallenge. While some insurers take the time to calibrate these systems by examining the damageestimates that come from s<strong>of</strong>tware, few take the time to review the probabilistic and scientificcontent <strong>of</strong> these systems in light <strong>of</strong> recent research and advances in the scientific community.This is unfortunate because based on our experience, the damage-based error to portfoliocalculations will generally be well less than one order <strong>of</strong> magnitude, but errors due to theprobabilistic and scientific components <strong>of</strong> the system can be several orders <strong>of</strong> magnitude.In this paper, we first survey the current research on the long term probabilistic characteristics <strong>of</strong>tropical cyclones conducted at governmental agencies and scientific community. The scientificbasis <strong>of</strong> the USWIND tropical cyclone modeling component <strong>of</strong> the s<strong>of</strong>tware are then assessed.Next, the design <strong>of</strong> the wind damage calculation is reviewed. Based on this assessment, thevalidity <strong>of</strong> the s<strong>of</strong>tware is tested and evaluated through a series <strong>of</strong> experiments; first to validatethe damage calculations and then to validate the probabilistic storm database, which because <strong>of</strong>its proprietary nature, requires a special simulation process.The s<strong>of</strong>tware that was used in all analysis presented in this paper is USWIND 3.07.05.I. An assessment <strong>of</strong> current scientific researchTropical cyclone (TC) is a generic term for hurricane, typhoon and other tropical vortices. Asevere TC is the most devastating natural disaster in terms <strong>of</strong> property damage and loss <strong>of</strong> life.Studying TC activity is therefore one <strong>of</strong> the most important objectives <strong>of</strong> meteorologicalagencies and scientific communities around the world. For insurers' underwriting and/orreinsurance decision making, accurate long term probabilistic characteristics <strong>of</strong> TC activity isneeded. Both observational and theoretical studies have been undertaken to address these issues:Direct historical observations: the National Hurricane Center (NHC) has archived reliableobservations <strong>of</strong> the North Atlantic basin (including the North Atlantic Ocean, Caribbean Sea, andGulf <strong>of</strong> Mexico) TC activity since 1886 and eastern Pacific observations since 1949. The datacaptured includes position <strong>of</strong> storm center, central pressure, and maximum sustained wind speedevery six hours. Based on the data, scientists at NOAA/National Weather Service calculated theprobability distributions <strong>of</strong> TC (in particular, hurricane) frequency, intensity and trackparameters along the 3000 miles coast line <strong>of</strong> the eastern and southeastern United <strong>State</strong>s [Ho etal., 1987; Neumann, 1987]. The results <strong>of</strong> these studies are widely used by storm-surgemodelers, climate researchers, and insurers.261
The <strong>Florida</strong> Commission on Hurricane Loss Projection MethodologyAppendix 7 - Independent ReviewGeneral circulation model (GCM) simulations: GCM is the numerical simulation <strong>of</strong> atmosphericand oceanic circulation based on our knowledge <strong>of</strong> dynamics and physics. High speed computersand advanced observing technology (e.g. environmental satellites) have enabled researchers tostudy TC activity with unprecedented detail. The latest work in this area has been undertaken byscientists at Max-Plank Institute for Meteorology in Germany [Bengtsson et al. 1995]. They runtheir GCM on time scales from five years to multi-decades, and have successfully simulatedrealistic TC activity globally. 2Observational study and GCM simulation have their respective advantages and shortcomings.The former is directly based on historical data but representativeness <strong>of</strong> the available data isuncertain and needs to be further assessed. The latter is based on physics and thus is more robust.However, GCM’s high computational demand limits its ability to fully resolve TC activity andkeeps it from being widely adopted.Bengtsson et al. [1995] compared a GCM simulation to the observations <strong>of</strong> TC experienceduring a period <strong>of</strong> twenty years. It was found that the GCM and observations reveal similarfrequency and geographical and seasonal distributions <strong>of</strong> TC activity. This comparison serves asan independent verification to the validity <strong>of</strong> the observational data. However, detailedexamination <strong>of</strong> the data set showed that the early observations are biased toward higher hurricaneactivity because the wind measurements were biased high prior to the 1960s. An empiricalcorrection was designed by Landsea [1993], and is used in our investigation.2 A GCM designed for regional climatology study is usually teamed with a nested LAM (limitedarea model) in order to obtain a resolution fine enough to describe the region <strong>of</strong> interest. Studieshave demonstrated encouraging results <strong>of</strong> the GCM/LAM simulation <strong>of</strong> regional climate inEurope [Giorgi et al., 1990] and North America [Hewitson and Crane, 1992]. The regionaldistribution <strong>of</strong> important climatic variables are shown to be realistically reproduced. Inparticular, Giorgi et al. [1990] illustrated the ability <strong>of</strong> the GCM/LAM to provide detailedfeatures <strong>of</strong> European winter storms.Admittedly, no attempt has yet to be made to simulate tropical cyclones with a GCM/LAM. As Bengtsson [1995]showed that a GCM itself can simulate the TC activities with reasonable accuracy, it is our belief that futureGCM/LAM work will substantially improve such simulations. We plan to work with experts in this field to initiatestudies along this path.262
The <strong>Florida</strong> Commission on Hurricane Loss Projection MethodologyAppendix 7 - Independent ReviewII. The scientific basis <strong>of</strong> the <strong>EQECAT</strong> s<strong>of</strong>tware USWINDUSWIND is a wind storm hazard modeling s<strong>of</strong>tware package developed by <strong>EQECAT</strong>, Inc. forthe eastern and southeastern United <strong>State</strong>s, Hawaii and Puerto Rico. Given detailed locationstructural information and insurance policy financial information (e.g. building location,construction and content type, total insured value, deductible, reinsurance, etc.), USWINDcalculates the annual expected damage in dollar amount and percentage. Additionally, itestimates non-exceedance damage at any given probability level (e.g. the 95% non-exceedancedamage). This program consists <strong>of</strong> three main steps: (1) construction <strong>of</strong> an applicable probabilitystorm data set, and (2) damage calculations based on this data set, and (3) financial analysis(which is not part <strong>of</strong> this study.)The scientific basis for the first step stems from the study by Ho et al. [1987, see section I],which is documented in NOAA Technical Report - NWS 38. The probability distributions <strong>of</strong>landfalling hurricanes along the eastern and southeastern United <strong>State</strong>s are calculated based onhistorical observations. Although the history <strong>of</strong> TC records is not long (about 100 years), theobservational data have been proven to be reasonably representative. An example <strong>of</strong> such proveis the agreement between the observations and GCM simulation [Bengtsson et al., 1995].The probability distributions <strong>of</strong> TC activity are then sampled by a computer simulation scheme(Latin-Hypercubic simulation with variance reduction) to create a data set including 465,000storms. The characteristics (such as location, intensity, etc.) <strong>of</strong> these storms is stochasticallyassigned. These storms are then imposed on an insurance portfolio.263
The <strong>Florida</strong> Commission on Hurricane Loss Projection MethodologyAppendix 7 - Independent ReviewIII. The damage estimation component <strong>of</strong> the <strong>EQECAT</strong> s<strong>of</strong>tware USWINDStorm damage is determined by accumulating site specific calculations. These calculationsincorporate wind field information from the probability storm data set and individual locationengineering considerations (e.g. construction, ro<strong>of</strong>ing, and cladding.) The damage calculationitself is a function <strong>of</strong> the projected maximum wind speed, peak gusts, and storm surge. Thefactors are the independent variables in a model for which the dependent variable is the percent<strong>of</strong> damage that results from a storm. The functions which relate wind speed to damage are called“vulnerability” curves within the industry. <strong>EQECAT</strong> provides a set <strong>of</strong> vulnerability functionswith its s<strong>of</strong>tware. Each curve represents a vulnerability function for different structure types.Customized vulnerability functions can also be created for unique locations by creating newcurves, or by combining the existing <strong>EQECAT</strong>’s curves.The resulting site damage is adjusted for the financial structure <strong>of</strong> the insurance policy includinglocal or policy deductible, limits, and site specific (“facultative”) reinsurance recoveries. Thesenet amounts are then accumulated and adjusted for portfolio level (“treaty”) reinsurancerecoveries.IV. Assessing the Simulated <strong>EQECAT</strong> USWIND Damage CalculationAs a 150 year old commercial property engineering company with an insurance capacity,Arkwright has developed a process for estimating individual site wind damage which is verycomplex. Initially, general storm parameters are taken into consideration. These stormparameters include wind speed, storm diameter and shape, forward speed and direction, centraland external barometric pressure, and rainfall. Before translating this data in localized forces,local terrain data are analyzed. This terrain information consists <strong>of</strong> elevation, distance fromcoast, roughness, drainage, nearby structures (as well as storage and vegetation), and local tidepatterns. The final component <strong>of</strong> input to the process is the local facility structural engineeringinformation. This structural information includes ro<strong>of</strong> construction (design, geometry, flashing,and anchorage), overall building envelope design and openings, wall construction (material,design, cladding, and glass), canopies and overhangs, and contents information (amount,susceptibility to water and wind damage, and desirability to looters.)From these inputs an Arkwright engineer can estimate the resulting forces that can be expectedto be exerted upon a building during a storm. These forces include the overall wind field, numberand speed <strong>of</strong> projectiles, storm and tidal surge, wind gusts (speed, pattern, and duration), and saltdeposit (for corrosion damage estimation.)For a given pr<strong>of</strong>ile <strong>of</strong> forces exerted upon a well defined structure, an experienced propertyengineer can then estimate (through theory and experience) resulting damage. This part <strong>of</strong> theprocess begins with identification <strong>of</strong> the likely initial failure mode (ro<strong>of</strong> uplift, balcony collapse,etc.) The likely failure mode is a function <strong>of</strong> the most exposed structural component. In additionto assessing what structural component will fail, the extent <strong>of</strong> failure must be estimated -- basedon the forces exerted upon the structure. Next, any subsequent or resulting failure must be264
The <strong>Florida</strong> Commission on Hurricane Loss Projection MethodologyAppendix 7 - Independent Reviewestimated in order to complete the chain <strong>of</strong> damage producing events. Lastly, based on manylosses and financial guidelines 3 , the financial extent <strong>of</strong> the event is determined.In an ideal modeling environment, this entire process would be represented in a detailedcalculation that would take place for every storm and for every structure. Based on computingpower, intended use, and inherent uncertainties in other parts <strong>of</strong> the model (the probabilisticstorm data set), such a detailed approach is simply not practical within an application such asUSWIND.The approach that <strong>EQECAT</strong> has chosen is to incorporate vulnerability curves for standardstructure types. These vulnerability curves were developed by <strong>EQECAT</strong> using research done byDr. Kishor Mehta (Director <strong>of</strong> the Wind Engineering Research Center) and Dr. James McDonald(Director <strong>of</strong> the Institute for Disaster Research) at Texas Tech University, where damageanalysis for storms for the last 25 years has been conducted. In addition to this work, <strong>EQECAT</strong>used claims data from all the major storms <strong>of</strong> the last 30 years that is contained in the NationalHurricane Research Project at Travelers. This data was analyzed by Dr. Don G. Friedman andJohn Mangano. Additionally, <strong>EQECAT</strong> used internal investigations <strong>of</strong> hurricanes Andrew, Iniki,Marilyn, Bob, Opal, and typhoon Angela as well as claims data from hurricanes Hugo, Andrew,Iniki, and Opal from companies that participated in the development <strong>of</strong> USWIND.While this research record is impressive, Arkwright also has extensive and well documented lossexperience. With this data in hand and since the vulnerability curves can be customized, the issue<strong>of</strong> validity testing for the vulnerability curves is not as important as it is for the mathematical andmeteorological content <strong>of</strong> the system. After an extensive calibration exercise, Arkwrightdeveloped a library <strong>of</strong> customized vulnerability curves. In addition to the customized curveshowever, Arkwright does use some curves that come directly form the <strong>EQECAT</strong> set, so theprovided vulnerability functions do warrant review.The first test used to validate the vulnerability curves was to compare the changes in damage tothe changes in the kinetic energy at different wind speeds. With all other things being equal, thedamage should be proportional to the square <strong>of</strong> the velocity (wind speed) because it is closelyrelated to the pressure that the wind exerts on a building. The well know formula for kineticenergy bears this out. The formula for kinetic energy isK.E. = 1/2 m v 2where m = mass <strong>of</strong> air, andv = velocity (wind speed)Since properties (especially commercial properties) withstand considerable force before anydamage results, the proportionality that we wish to test is:i. D = 0 ; for v d < v xii. D ~ 1/2 m (v x - v d ) 2 ; for v x > v dwhere D = damage to building,3 These guidelines include the standard regional costs <strong>of</strong> materials and labor as well as increased, or inflated, cost <strong>of</strong>construction after a natural disaster due to a high demand for construction materials and personnel265
The <strong>Florida</strong> Commission on Hurricane Loss Projection MethodologyAppendix 7 - Independent Reviewv x = velocity (wind speed), andv d = velocity (wind speed) where damage ceases to be zero.Focusing on equation ii and removing the constants (1/2, and m) which only affect the scale <strong>of</strong>the proportionality , we get:D ~ (v x - v d ) 2To test this comparison, we ran a simple test using individual facilities <strong>of</strong> varying structure typesusing the scenario storm capability <strong>of</strong> USWIND and compiled damage statistics for various windspeeds. One example <strong>of</strong> these analyses is presented in figure 1 where the damage estimates foran industrial high rise building with average cladding is reviewed.USWIND Damage Estimate CalculationFor a single facility at various wind speeds70758090100110120130140150160170180190Sq. <strong>of</strong> Wind Speed (Axis 1) /Facility Damage (Axis 2)Wind Speed (MPH)Square <strong>of</strong> Wind SpeedUSWIND DamageFigure 1. A comparison <strong>of</strong> the USWIND estimated wind damage at a commercialfacility versus the square <strong>of</strong> the difference between the wind speed and thepoint at which damage ceases to be zero (v d ); for this example, the point v dwas 70 mph. A constant or proportionality <strong>of</strong> .0018 was included forscaling.Visually, the test for proportionality is well met. A generally well held structural engineeringprinciple may explain the difference observed between the damage curve and the kinetic energycurve in the center <strong>of</strong> the chart. This principle relates to loss control -- mitigating factors thathelp to minimize the damage when a loss occurs. Loss control is especially effective incommercial properties where measures such as bracing, flashing, and protection for storage arelikely to be employed. Loss control measures tend to be effective at moderate to severe windspeeds (below 150 mph, for instance) and the damage falls below that expected from atheoretical kinetic energy standpoint as the loss control measures mitigate the damage. Atcatastrophic wind speeds however (above 150 mph), the loss control measures cease to be aseffective as the wind forces overcome the capability <strong>of</strong> the measures to withstand the energy,266
The <strong>Florida</strong> Commission on Hurricane Loss Projection MethodologyAppendix 7 - Independent Reviewgiving way, and allowing failure to such an extent that the damage appears far more consistentwith the theoretical kinetic energy curve.The next test was an analysis <strong>of</strong> actual losses to see if the damage calculations had anysystematic bias. To do this, 58 <strong>Florida</strong> locations were randomly chosen and damage fromhurricane Andrew from 1992 was adjusted for inflation and compared to the results from a“scenario storm” from the historical storm dataset <strong>of</strong> USWIND. When this was done, the totalswere very close. The actual losses after adjusting for inflation for these locations totaledapproximately $100 million and the estimate from USWIND was high by $14 million.Furthermore, <strong>of</strong> the 58 locations, 28 estimates were below the location damage and 30 wereabove the location damage. This data is presented graphically in figure 2. Here a 45-degree lineis drawn and the distribution pattern <strong>of</strong> USWIND/actual loss points can be observed. In a systemwith perfect prediction, all points would lie on the line. In a system with random error, the pointswill not lie on the line, but there will be equal numbers and an even pattern <strong>of</strong> points above theline and below.Hurricane Andrew Damage ComparisonUSWIND estimates versus actual lossesUSWIND Estimates100,000,00010,000,0001,000,000100,00010,0001,0001001011 100 10,000 1,000,000 100,000,000Actual LossesFigure 2. A comparison <strong>of</strong> actual versus USWIND modeled damage for 58 actuallocations within <strong>Florida</strong> using hurricane Andrew.Our conclusions from a damage perspective then is that USWIND properly models the physicalproperties <strong>of</strong> forces versus damage and that the system has no systematic bias in its damageestimation logic.267
The <strong>Florida</strong> Commission on Hurricane Loss Projection MethodologyAppendix 7 - Independent ReviewV. <strong>EQECAT</strong> USWIND - Validity <strong>of</strong> the probabilistic storm data setThe main challenge to the evaluation <strong>of</strong> the probabilistic storm data set is that the data are notavailable to the user due to their proprietary nature. To alleviate this problem, a specialsimulation experiment is designed.We created a uniform portfolio consisting <strong>of</strong> commercial buildings located 10 miles apart alongthe coast <strong>of</strong> the eastern and southeastern United <strong>State</strong>s. They have the same construction type,content and insurance policy. This portfolio is used as input to USWIND, whose probabilisticcalculation gives the annual expected and non-exceedance damage at these locations (Figure 3).Because the portfolio is uniform, all <strong>of</strong> the geographical variability in damage is due to theprobabilistic distribution <strong>of</strong> USWIND’s storm data set, and is independent <strong>of</strong> the damagecalculation. Therefore, a comparison <strong>of</strong> the damage variability with the geographical distribution<strong>of</strong> hurricane activity will independently verify whether or not the probabilistic storm data set isconsistent with observations.Damage Percentage3.532.521.510.5USWIND Damage DistributionFor an evenly distributed uniform portfolio010035060085011001350155018002050226025102760Milepost Location (every 10 miles) from Texas to Mainemean90th percentileFigure 3. USWIND estimated annual Damage (%) to the uniform portfolio. Thereis a building every 10 nautical miles. Solid line: expected; dashed line:90% non-exceedance.To compare this simulated damage calculation against historical data, actual storm experiencewill be reviewed. The two aspects <strong>of</strong> hurricane activity most relevant to wind damage arehurricane frequency and intensity, shown in Figures 4a and 4b, respectively. Data for thesegraphs comes from NOAA Technical Report - NWS 38.268
The <strong>Florida</strong> Commission on Hurricane Loss Projection MethodologyAppendix 7 - Independent ReviewUS Landfalling HurricanesActual experience 1886-1995Number <strong>of</strong> Hurricanes20181614121086420130310490670850103012101390157017501930211022902470Milepost Location (every 60 miles) from Texas to Maine26503010Figure 4a. Number <strong>of</strong> landfalling hurricanes along the eastern US coast (1886-1995). Data from NorthAtlantic Tropical Cyclone Best Track Data from National Hurricane Center.10090US Maximum Sustained 1-minute Wind SpeedsActual experience 1886-1995Wind Speed (MPH)807060504030130310490670850103012101390157017501930211022902470Milepost Location (every 60 miles) from Texas to Maine26503010Figure 4b. One-minute sustained maximum wind speed <strong>of</strong> landfalling along the easternand southeastern US coast (during the period <strong>of</strong> 1886-1995.) Data from NorthAtlantic Tropical Cyclone Best Track Data from National Hurricane Center.269
The <strong>Florida</strong> Commission on Hurricane Loss Projection MethodologyAppendix 7 - Independent ReviewThese two parameters (hurricane frequency and intensity) are combined to form an estimate <strong>of</strong>wind damage based on the fact that wind damage is proportional to the square <strong>of</strong> the wind speedand the associated kinetic energy (see section IV.) This estimate is then compared withUSWIND calculation (Figure 5a).2.5Mean Damage Comparison; USWIND vs Historical EstimateFor an evenly distributed uniform portfolioDamage Percentage21.510.5010035060085011001350155018002050226025102760Milepost Location (every 10 miles) from Texas to MaineUSWINDHistoricalFigure 5a. Annual expected wind damage (solid line: USWIND; dashed line:independent estimate based on historical data).The geographical distribution <strong>of</strong> their difference is shown in Figure 5b. The two estimatesgenerally agree well along about 70% <strong>of</strong> the coast line. USWIND estimates, however,demonstrate some noticeable difference from historical data: (1) much larger than expected localvariations <strong>of</strong> damage near miles post 1400 (southern <strong>Florida</strong>); (2) consistent underestimate at theeastern part <strong>of</strong> Gulf coast (mile post 100 - 600); (3) overestimate at west <strong>Florida</strong> and NewEngland coasts.Detailed analysis and investigation with <strong>EQECAT</strong> revealed that the cause for the difference isUSWIND’s inconsistent handling <strong>of</strong> user-supplied lat/lon coordinates during portfolio dataimport. Specifically, USWIND sometimes incorrectly assigns zip code centroid locations toproperties rather than using the user-supplied lat/lon coordinates. The problem generally occurswhen street address is missing. Because <strong>of</strong> this problem, USWIND’s probabilistic stormcalculation will effectively treat buildings as if they are at the center <strong>of</strong> the zip code zone inwhich they are located, unless users manually enter the distance to the coastline. As a result, abuilding in a larger zip code zone is treated as if it were farther from the coast than one in asmaller zip code zone, and consequently is expected to sustain less wind damage. For example,most <strong>of</strong> the Gulf coast states have larger zip code zones than New England states do, USWINDestimate tend to be lower in former than in the latter area. The sharp local minimums around milepost 1400 (Figure 5b) are also found to be located in large zip code zones <strong>of</strong> the Everglades.270
The <strong>Florida</strong> Commission on Hurricane Loss Projection MethodologyAppendix 7 - Independent ReviewMean Damage Difference; USWIND vs Historical EstimateFor an evenly distributed uniform portfolio200%Estimate Diff. (USW-Hist)/Hist150%100%50%0%-50%-100%10035060085011001350155018002050226025102760Milepost Location (every 10 miles) from Texas to MaineFigure 5b. Comparison <strong>of</strong> annual expected damage estimates by USWIND andhistorical data (USWIND estimates versus historical estimates; historicalestimates used as the basis.)<strong>EQECAT</strong> worked closely with Arkwright after Arkwright identified this problem to determinejust how and why the problem was occurring. Based on this work, <strong>EQECAT</strong> has indicated thatthey have corrected the problem in version 4.0 <strong>of</strong> the s<strong>of</strong>tware. An analysis <strong>of</strong> this correction isnot included in this report, but a preliminary test <strong>of</strong> the correction performed at <strong>EQECAT</strong>’sheadquarters and reviewed jointly by Arkwright and <strong>EQECAT</strong> indicates that the correction doesindeed fix the problem.VI. USWIND Summary and Implications for the Insurance IndustryOur simulation experiment confirms that the historical hurricane observations are an appropriatebasis for tropical cyclone disaster modeling. These observations are indeed reflected in theUSWIND probabilistic data base. Also, the damage calculations are reliable and generallywithout bias.As was mentioned in section V, <strong>EQECAT</strong> has listened to, help document, and correct the oneproblem encountered in this study. Based on early analysis, version 4.0 will correct the problemand for the time being (until upgrade to 4.0 is done at Arkwright), Arkwright will use anempirical correction for the lat/lon zip code centroid problem.The implications <strong>of</strong> this work for the commercial highly protected risk property insuranceindustry lie as much in the process <strong>of</strong> completing the work than in the conclusions. Certainly, thediscovery <strong>of</strong> any systematic bias would have been worthy <strong>of</strong> discovery. Since the natural hazard271
The <strong>Florida</strong> Commission on Hurricane Loss Projection MethodologyAppendix 7 - Independent Reviewmodeling s<strong>of</strong>tware is used to make multi-million dollar reinsurance decisions as well as capacityallocation decisions, any error or bias in the s<strong>of</strong>tware could prove extremely costly. However,based on our work, the s<strong>of</strong>tware is free <strong>of</strong> bias and as a result, Arkwright can confidentlyincorporate USWIND into decisions about capacity or reinsurance.The day-to-day operational implications for Arkwright that stem from the lessons learned incompleting this study are significant. They include the following:(1) The s<strong>of</strong>tware combines the expertise <strong>of</strong> structural engineering, meteorological, mathematical,statistical, and economic scientists with the expertise <strong>of</strong> finance, accounting, and insurancepr<strong>of</strong>essionals. Apparently because <strong>of</strong> the diversity <strong>of</strong> expertise in these disciplines among theirpotential customers, vendors <strong>of</strong> natural disaster modeling packages invest far too little indocumentation and as a result, validity assessment and damage calibration are activities that werevery difficult and time consuming. Whatever the reasons behind the documentation issue, theinsurer must take responsibility for creating a controlled production environment where tests canbe completed and analysis can be done. An insurer should also expect to invest significant timein building expertise in using a natural disaster modeling package.(2) Validating the s<strong>of</strong>tware is a very worthwhile exercise because it provides a benchmark fornew releases <strong>of</strong> the program. It also has the benefit <strong>of</strong> fostering a stronger relationship betweenthe designers <strong>of</strong> the s<strong>of</strong>tware and the scientists within the insurer’s organization. Doing thisrequires a significant investment in time, money, and people, but the alternative is to writeinsurance with less than complete understanding <strong>of</strong> the risks involved. The insight that is gainedby doing such an analysis is enormous. As a result <strong>of</strong> this work, new understandings and indeednew questions arose concerning the portfolio and the reinsurance program. For Arkwright,performing this study raised as many questions about the unique characteristics <strong>of</strong> the insuranceportfolio (to be addressed through subsequent research) as it settled about the s<strong>of</strong>tware.(3) The potential customer set for these packages is relatively small but the functionality isrelatively rich. Because <strong>of</strong> this, it is very likely that a customer will encounter (because <strong>of</strong> thecombinations <strong>of</strong> the structure, the storm, the policy, and the reinsurance) a situation that hasnever been seen in s<strong>of</strong>tware development. In light <strong>of</strong> this, the insurer must form and maintain astrong relationship with the support organization <strong>of</strong> the vendor. A validation exercise, by itsdesign is likely to manifest this situation. While the experience can be trying and even frustratingfor both parties, the long term result is well worth the effort as the insurer gains a greaterunderstanding <strong>of</strong> the peril and the s<strong>of</strong>tware and the vendor gains a better understanding <strong>of</strong> theclient.272
The <strong>Florida</strong> Commission on Hurricane Loss Projection MethodologyAppendix 7 - Independent ReviewReferencesBengtsson-L., Botzet-M. and Esch-M., Hurricane-type vortices in a general circulation model,Tellus, vol. 47A, no. 2, pp.175-196, Feb. 1995.Giorgi-F., Rosaria-M. and Visconti-G., Use <strong>of</strong> a limited-area model nested in a generalcirculation model for regional climate simulation over Europe, Journal <strong>of</strong> Geophysical Research,vol. 95, no. D11, pp. 18413-31, 20 Oct. 1990.Hewitson-B. and Crane-R-G., Regional climates in the GISS global circulation model: synopticscalecirculation, Journal <strong>of</strong> Climate, vol. 5, no. 9, pp. 1002-11, Sept. 1992.Ho-F., Su-J., Hanevich-K., Smith-R. and Richards-F., Hurricane climatology for the Atlantic andGulf Coast <strong>of</strong> The United <strong>State</strong>s, NOAA Technical Report NWS 38, April, 1987.Landsea-C-W., A climatology <strong>of</strong> intense (or major) Atlantic hurricanes, Monthly WeatherReview, vol. 121, no. 6, pp. 1703-13, June 1993.Nuemann, C., The National Hurricane Center risk analysis program, NOAA Technical MemoNWS NHC 38, November, 1987.273