Annual Report 2011 - Snam
Annual Report 2011 - Snam
Annual Report 2011 - Snam

You also want an ePaper? Increase the reach of your titles
YUMPU automatically turns print PDFs into web optimized ePapers that Google loves.
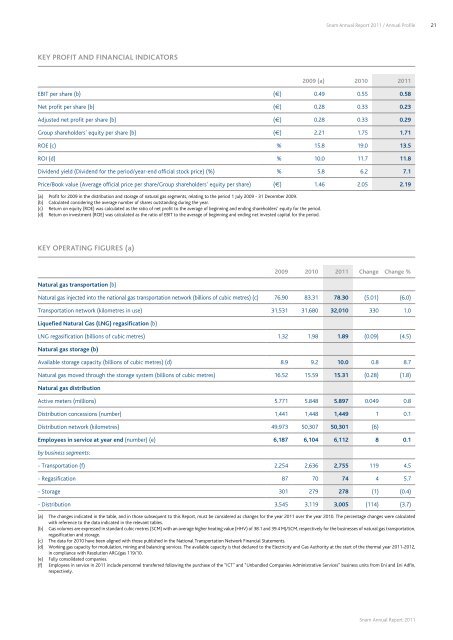
<strong>Snam</strong> <strong>Annual</strong> <strong>Report</strong> <strong>2011</strong> / <strong>Annual</strong> Profile21Key profit and financial indicators2009 (a) 2010 <strong>2011</strong>EBIT per share (b) (€) 0.49 0.55 0.58Net profit per share (b) (€) 0.28 0.33 0.23Adjusted net profit per share (b) (€) 0.28 0.33 0.29Group shareholders’ equity per share (b) (€) 2.21 1.75 1.71ROE (c) % 15.8 19.0 13.5ROI (d) % 10.0 11.7 11.8Dividend yield (Dividend for the period/year-end official stock price) (%) % 5.8 6.2 7.1Price/Book value (Average official price per share/Group shareholders’ equity per share) (€) 1.46 2.05 2.19(a) Profit for 2009 in the distribution and storage of natural gas segments, relating to the period 1 July 2009 - 31 December 2009.(b) Calculated considering the average number of shares outstanding during the year.(c) Return on equity (ROE) was calculated as the ratio of net profit to the average of beginning and ending shareholders’ equity for the period.(d) Return on investment (ROE) was calculated as the ratio of EBIT to the average of beginning and ending net invested capital for the period.Key operating figures (a)Natural gas transportation (b)2009 2010 <strong>2011</strong> Change Change %Natural gas injected into the national gas transportation network (billions of cubic metres) (c) 76.90 83.31 78.30 (5.01) (6.0)Transportation network (kilometres in use) 31,531 31,680 32,010 330 1.0Liquefied Natural Gas (LNG) regasification (b)LNG regasification (billions of cubic metres) 1.32 1.98 1.89 (0.09) (4.5)Natural gas storage (b)Available storage capacity (billions of cubic metres) (d) 8.9 9.2 10.0 0.8 8.7Natural gas moved through the storage system (billions of cubic metres) 16.52 15.59 15.31 (0.28) (1.8)Natural gas distributionActive meters (millions) 5.771 5.848 5.897 0.049 0.8Distribution concessions (number) 1,441 1,448 1,449 1 0.1Distribution network (kilometres) 49,973 50,307 50,301 (6)Employees in service at year end (number) (e) 6,187 6,104 6,112 8 0.1by business segments:- Transportation (f) 2,254 2,636 2,755 119 4.5- Regasification 87 70 74 4 5.7- Storage 301 279 278 (1) (0.4)- Distribution 3,545 3,119 3,005 (114) (3.7)(a) The changes indicated in the table, and in those subsequent to this <strong>Report</strong>, must be considered as changes for the year <strong>2011</strong> over the year 2010. The percentage changes were calculatedwith reference to the data indicated in the relevant tables.(b) Gas volumes are expressed in standard cubic metres (SCM) with an average higher heating value (HHV) of 38.1 and 39.4 MJ/SCM, respectively for the businesses of natural gas transportation,regasification and storage.(c) The data for 2010 have been aligned with those published in the National Transportation Network Financial Statements.(d) Working gas capacity for modulation, mining and balancing services. The available capacity is that declared to the Electricity and Gas Authority at the start of the thermal year <strong>2011</strong>-2012,in compliance with Resolution ARG/gas 119/10.(e) Fully consolidated companies.(f) Employees in service in <strong>2011</strong> include personnel transferred following the purchase of the “ICT” and “Unbundled Companies Administrative Services” business units from Eni and Eni Adfin,respectively.<strong>Snam</strong> <strong>Annual</strong> <strong>Report</strong> <strong>2011</strong>