Annual Report 2011 - Snam
Annual Report 2011 - Snam
Annual Report 2011 - Snam

Create successful ePaper yourself
Turn your PDF publications into a flip-book with our unique Google optimized e-Paper software.
<strong>Annual</strong> <strong>Report</strong><strong>2011</strong><strong>Snam</strong> <strong>Annual</strong> <strong>Report</strong> <strong>2011</strong>
DisclaimerThe annual report includes forward-looking statements, especially in the Outlook section, relatingto: natural gas demand, investment plans, dividend policy, future operating performance and projectexecution. Such statements are, by their very nature, subject to risk and uncertainty as they depend onwhether future events and developments take place. The actual results may therefore differ from thoseforecast as a result of several factors: trends in natural gas demand, supply and price, actual operatingperformance, general macro-economic conditions, geopolitical factors such as international tensions, theeffect of new energy and environmental legislation, the successful development and implementation ofnew technologies, changes in stakeholders’ expectations and other changes in business conditions.
<strong>Report</strong>s and consolidated financial statementsDirectors’ <strong>Report</strong>4 Letter to Shareholders7 Corporate officersSummary figures10 The <strong>Snam</strong> Group15 <strong>Annual</strong> Profile23 <strong>Snam</strong> and financial marketsBusiness segment operating performance28 Main factors of the pricing framework30 Natural gas transportation40 Liquefied Natural Gas (LNG) regasification44 Natural gas storage49 Natural gas distributionFinancial review and other information58 Financial review59 Income statement68 Reclassified consolidated balance sheet75 Reclassified consolidated statement of cash flows78 Elements of risk and uncertainty86 Outlook89 Other information97 Information on corporate governance and ownership structure115 Commitment to sustainable development130 GlossaryConsolidated financial statements138 Financial statements142 Notes to the consolidated financial statements215 Statement from management216 Independent auditors’ report<strong>Snam</strong> means <strong>Snam</strong> Rete Gas S.p.A. and the companies within its scope of consolidation.
Letter to Shareholders
<strong>Snam</strong> <strong>Annual</strong> <strong>Report</strong> <strong>2011</strong> / Letter to Shareholders5To our Shareholders and Stakeholders,Against the difficult economic scenario which characterised the past year and the extreme marketvolatility, in <strong>2011</strong> we achieved significant operating and financial results. Over the year the operatingprofit and pre-tax profit saw growth of 5.2% and 3.5% respectively compared with 2010.The constant focus on operating efficiency also enabled us to achieve the cost reduction goals announcedfor 2012 one year early, providing us with a significant means of creating value. The cost savings achievedwere approximately €80 million, calculated in real terms based on fixed controllable costs of 2008 andlike-for-like operations.The <strong>Snam</strong> share price closed <strong>2011</strong> at an official price of €3.39, down 9.1% from the €3.73 recordedat the end of the previous year. Affecting the annual trend of the share price was the general downturnin the financial markets in Italy and Europe, and in particular the extension of the ‘Robin Hood Tax’ tocompanies regulated by the national energy sector. During the year, the stock did however outperformthe Italian market (FTSE MIB -25.2%) and the European utilities sector (Stoxx Europe 600 Utilities-16.6%), confirming the interest in companies with solid business fundamentals and long-term visibilityof results and cash flows, in spite of increasing country risk and elevated volatility.In <strong>2011</strong> the stock, as well as having been confirmed among the primary sustainability indices, cameto form part of the Stoxx Global ESG Leaders Indices, a new group of indices based on a transparentperformance selection process, according to sustainability, of 1,800 businesses listed worldwide. All ofthis is testimony to <strong>Snam</strong>’s continuing commitment to achieving a sustainable growth that protects itsworking environment and fosters clear dialogue with all stakeholders.At the Shareholders’ Meeting for the approval of the <strong>2011</strong> financial statements, <strong>Snam</strong> intends to confirmits adoption of the Code of Corporate Governance of Listed Companies promoted by Borsa ItalianaS.p.A., as updated in December <strong>2011</strong>.December <strong>2011</strong> also saw the completion of the new corporate configuration, in effect from 1 January2012. The new structure places <strong>Snam</strong> S.p.A. at the head of the group, which holds 100% of the sharecapital of the four operating companies (<strong>Snam</strong> Rete Gas S.p.A., GNL Italia S.p.A., Stogit S.p.A. and ItalgasS.p.A.) which are responsible for the management and development of transportation, regasification,storage and distribution of natural gas respectively. It forms a fundamental step, which ratifies theadjustment to the EU provisions in the ‘Third Energy Package’ via the implementation of the ITO(Independent Transmission Operator) model, which provides for the operational and decision-makingseparation of the transporter from the vertically integrated business (i.e. Eni).EBIT for the year <strong>2011</strong> amounted to €1,958 million, an increase of €96 million (5.2%), compared to2010, mainly due to higher revenue from investment and to operating cost control. The increase reflectsthe improved performance recorded by the natural gas distribution (+22.9%) and storage (+17.0%)business segments. EBIT for the transportation segment recorded a decrease of 4.1% compared to theprevious year, mainly due to the lower volumes of natural gas transported (-6.0%), and to the entry,in 2010, of additional transportation revenue resulting from the recognition by the Electricity and GasAuthority of the additional expenses incurred for the acquisition of fuel gas from 1 October 2008 to 31December 2009.Net profit for <strong>2011</strong> of €790 million, down €316 million (28.6%) compared to 2010, was stronglypenalised by the government’s fiscal measures for restoring public finances and in particular, theextension of the application of additional IRES (‘Robin Hood Tax’) to companies operating in the natural<strong>Snam</strong> <strong>Annual</strong> <strong>Report</strong> <strong>2011</strong>
6 <strong>Snam</strong> <strong>Annual</strong> <strong>Report</strong> <strong>2011</strong> / Letter to Shareholdersgas transportation and distribution sectors. This was established in 2008 for companies producing ormarketing energy products or electricity.The application of the Robin Hood Tax more than absorbed the improvement of operating performance.The negative effect on the consolidated income statement from the greater level of income tax was€344 million, of which €188 million of greater taxation is associated with the one-off adjustment ofdeferred taxes as at 31 December 2010. Excluding this adjustment, the adjusted net profit amounted to€978 million, a fall of €128 million (11.6%) compared with 2010.The positive net cash flow from operations of €1.5 billion almost entirely covered the outflows associatedwith capital expenditure (€1.6 billion, net of disposals). The increase in net financial debt, following thepayment of dividends to shareholders (€0.8 billion, which includes the balance for 2010 and the interimdividend for <strong>2011</strong>) amounted to €0.9 billion. Net financial debt as at 31 December <strong>2011</strong> amounts to€11.2 billion.The results achieved allowed us to propose to the Shareholders’ Meeting a dividend of €0.24 per share(+4.3% compared to 2010), of which an interim payment of €0.10 was made in October <strong>2011</strong>.For the four-year period 2012-2015, we have confirmed our growth strategy with a €6.7 billionsignificant investment plan in the transportation, storage and distribution of gas, which will allow us torealise investments to increase the security and flexibility of the system, diversify supply sources andsatisfy requirements related to the development of gas demand over the medium- and long-term. In thisway <strong>Snam</strong> aspires to be a key player in the development of the more integrated European gas network,creating the conditions for the transport of gas from the south to Northern Europe, and reinforcing itscompetitive positioning through a strategy of development in Europe, including partnerships with otheroperators who own gas infrastructure, in line with the provisions of the Third Energy Package.To summarise, in <strong>2011</strong> <strong>Snam</strong> achieved robust financial and operating results. The increase of EBIT(+5.2%), pre-tax profit (+3.5%) and the low cost of debt (3.1%) confirm the strength of our businessmodel, which features a limited level of industrial and financial risk. The reduction in net income (-28.6%;-11.6% when adjusted) is entirely related to the increase in the tax charges after the introduction of theRobin Hood Tax. We maintain our continual attention to operating efficiency, strict financial disciplineand maintaining a strong capital structure. We remain focused on investing in profitable growth andremunerating our shareholders by confirming our investment plan and stated dividend policy.The significant results achieved, as well as those we wish to pursue, are based on a wealth of skills,implementation capabilities and human and financial resources, which for many years have allowed usto develop infrastructures for the market and the country as a whole. We wish to continue to pursuesustainable growth, with conviction and passion, through the excellent professional skills of the peoplewho work daily towards development with care for the environment and responsibility towards theterritory and its communities.Salvatore SardoChairmanCarlo MalacarneCEO12 March 2012for the Board of DirectorsThe ChairmanThe CEO
<strong>Snam</strong> <strong>Annual</strong> <strong>Report</strong> <strong>2011</strong> / Corporate officers7Corporate officersBOARD OF DIRECTORS (*)Salvatore SardoChairmanCarlo Malacarne CEO (1)Alessandro BerniniDirectorDavide CroffIndependent directorElisabetta Oliveri Independent director (2)Mario Stella Richter Independent director (2)Massimo MantovaniDirectorRenato SantiniIndependent directorRoberto Lonzar Independent director (2)BOARD OF STATUTORY AUDITORS (*)Massimo Gatto Chairman (2)Francesco Schiavone Panni Statutory auditorRoberto MazzeiStatutory auditorGiulio GambaAlternate auditorLuigi Rinaldi Alternate auditor (2)INTERNAL CONTROL COMMITTEE (**)Roberto Lonzar Chairman - Independent director (2)Mario Stella Richter Independent director (2)Renato SantiniIndependent directorCOMPENSATION COMMITTEE (**)Davide CroffChairman - Independent directorAlessandro BerniniDirectorElisabetta Oliveri Independent director (2)APPOINTMENTS COMMITTEE (***)Davide CroffChairman - Independent directorRenato SantiniIndependent directorRoberto Lonzar Independent director (2)INDEPENDENT AUDITORS (****)Reconta Ernst & Young S.p.A.(*) Appointed by the Shareholders’ Meeting on 27 April 2010 and in office until the approval of the financial statements forthe year ended 31 December 2012.(**) Committee established on 26 February 2002. Members appointed by the Board of Directors on 30 April 2010.(***) Committee established on 26 October <strong>2011</strong>.(****) Role appointed by the Shareholders’ Meeting on 27 April 2010 for the period 2010 - 2018.(1) Confirmed by the Board of Directors on 30 April 2010.(2) Appointed from the minority shareholders’ list.<strong>Snam</strong> <strong>Annual</strong> <strong>Report</strong> <strong>2011</strong>
<strong>Snam</strong> <strong>Annual</strong> <strong>Report</strong> <strong>2011</strong>
Summary figures<strong>Snam</strong> <strong>Annual</strong> <strong>Report</strong> <strong>2011</strong>
<strong>Snam</strong> <strong>Annual</strong> <strong>Report</strong> <strong>2011</strong>The <strong>Snam</strong> Group
12<strong>Snam</strong> <strong>Annual</strong> <strong>Report</strong> <strong>2011</strong> / The <strong>Snam</strong> GroupLNG REGASIFICATIONThe process for the extraction of natural gas from the fields, its liquefaction for transport by shipand subsequent regasification for use by the users, forms the ‘LNG chain’. The process begins in thecountry of the exporter, where the natural gas is brought to the liquid state by cooling it to -160° Cand subsequently loaded onto tankers for shipping to the destination terminal, the LNG regasificationterminal. At the regasification terminal, the LNG is unloaded, then heated and returned to the gaseousstate and is input into the natural gas transportation network.Natural gas is also injected into the National Transportation Network from the LNG terminal at Panigaglia(La Spezia), which is owned by GNL Italia and regasifies 17,500 cubic metres of LNG per day; thus whenoperating at maximum capacity the terminal can inject over 3.5 billion cubic metres of natural gas intothe transportation network annually.The regasification service includes unloading the LNG from the vessel, operating storage, i.e., the storagetime required for vaporising the LNG, regasifying it and injecting it into the national network at thePanigaglia entry point.STORAGEThe natural gas storage business in Italy is done under a concession regime and it serves to offset thevarious demands of gas consumption and supply. In fact, procurement has had a basically constantprofile throughout the year, while gas demand has been characterised by high seasonal variability withwinter demand significantly higher than summer.Essentially, there are two distinct phases in storage: (i) injection phase, generally concentrated betweenApril and October, consisting of injecting into storage the natural gas deriving from the nationaltransport network; and (ii) the extraction phase, usually concentrated between November and March ofthe following year, when the natural gas is extracted from the deposit, treated, and redelivered to usersby the transportation network.The storage business is carried out by making use of an integrated whole of infrastructures comprised ofdeposits, gas treatment plants, compression plants and the operational dispatching system.Stogit is the major Italian operator and one of the leading European natural gas storage operators, viaeight storage fields in Lombardy (four), Emilia Romagna (three) and Abruzzo (one).NATURAL GAS DISTRIBUTIONThe natural gas distribution business operates on a concession regime through the conferral of thisservice by local public entities; it consists of the service of gas distribution through local transportationnetworks from delivery points at the metering and reduction stations (city gates) to the gas distributionnetwork redelivery points at the end customers (households, businesses, etc.).Gas distribution service is carried out for sales companies authorised to market to end customers by thetransportation of the gas through city networks.Italgas undertakes natural gas distribution activities by making use of an integrated system of infrastructurescomprised of stations for withdrawing gas from the transport network, pressure reduction plants, local<strong>Snam</strong> <strong>Annual</strong> <strong>Report</strong> <strong>2011</strong>
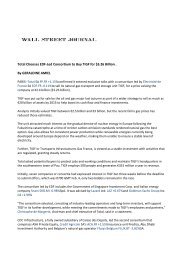
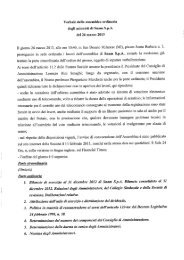
<strong>Snam</strong> <strong>Annual</strong> <strong>Report</strong> <strong>2011</strong> / The <strong>Snam</strong> Group13transportation and distribution network, user derivation plants and redelivery points comprised of technicalequipment featuring meters at the end customers.Italgas is the leading Italian operator in the natural gas distribution business in Italy with 1,449 municipalconcessions and more than 50,000 kilometres of medium- and low-pressure transportation network.<strong>Snam</strong>’s presence in the territoryInfrastructure as at 31 December <strong>2011</strong>GRIES PASSTARVISIOCAVARZEREGORIZIAPANIGAGLIASNAM RETE GASNational Transportation NetworkCompression stationsEntry pointsGNL ITALIARegasification terminalSTOGITStorage fieldsITALGASMunicipalities under concessionMAZARADEL VALLOGELA<strong>Snam</strong> <strong>Annual</strong> <strong>Report</strong> <strong>2011</strong>
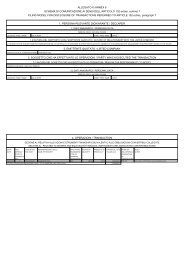
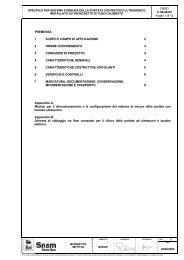
14<strong>Snam</strong> <strong>Annual</strong> <strong>Report</strong> <strong>2011</strong> / The <strong>Snam</strong> GroupScope of consolidation as at 31 December <strong>2011</strong>The <strong>Snam</strong> group scope of consolidation 2 as at 31 December <strong>2011</strong> 3 can be represented as follows:<strong>Snam</strong> Rete Gas S.p.A.TransportationRegasification 100% Storage 100%Distribution 100%Distribution 99.69%Consolidating company Shareholders % ownership<strong>Snam</strong> Rete Gas S.p.A.Eni S.p.A.<strong>Snam</strong> Rete Gas S.p.A.Other shareholders52.535.3942.08FULLY CONSOLIDATED SUBSIDIARIES SHAREHOLDERS % OWNERSHIPGNL Italia S.p.A. <strong>Snam</strong> Rete Gas S.p.A. 100Stogit S.p.A. <strong>Snam</strong> Rete Gas S.p.A. 100Italgas S.p.A. <strong>Snam</strong> Rete Gas S.p.A. 100Napoletana Gas S.p.A.Italgas S.p.A.Other shareholders99.690.312 The list of subsidiaries, associates and significant equity investments of <strong>Snam</strong> Rete Gas S.p.A. can be found in the appendix“Subsidiaries, associates and significant equity investments of <strong>Snam</strong> Rete Gas S.p.A. at 31 December <strong>2011</strong>” to the Notes tothe consolidated financial statements.3 On 1 January 2012, in implementing the draft of Legislative Decree no. 93 of 1 June <strong>2011</strong>, which encodes into nationallegislation EU Directives concerning the Third Energy Package, the new corporate structure of <strong>Snam</strong> came into being. Forfurther details on the new scope of consolidation as at 1 January 2012, please see the section, “<strong>Annual</strong> profile - Primarylegislative provisions”, below.<strong>Snam</strong> <strong>Annual</strong> <strong>Report</strong> <strong>2011</strong>
<strong>Annual</strong> Profile<strong>Snam</strong> <strong>Annual</strong> <strong>Report</strong> <strong>2011</strong>
16<strong>Snam</strong> <strong>Annual</strong> <strong>Report</strong> <strong>2011</strong> / <strong>Annual</strong> ProfileResultsIn <strong>2011</strong> <strong>Snam</strong> achieved EBIT of €1,958 million, an increase of 5.2% over 2010, which was primarilythe result of the increase of revenues from regulated activities and operating cost control. The increasereflects the improved performance recorded by the natural gas distribution (+€104 million; +22.9%)and storage (+€37 million; +17.0%) business segments. EBIT for the transportation business segment(€1,137 million) recorded a reduction compared with the previous year (-€48 million; -4.1%) mainlydue to lower volumes of natural gas transported (-6.0%) and to the recording, in 2010, of additionaltransportation revenue resulting from the recognition by the Electricity and Gas Authority of theadditional expenses incurred for the acquisition of fuel gas from 1 October 2008 to 31 December 2009(€55 million).Net profit for <strong>2011</strong> of €790 million, -28.6% compared to 2010, was strongly penalised by thegovernment’s fiscal measures for rebalancing public finances and in particular, the extension of theapplication of additional IRES (‘Robin Hood Tax’) to companies operating in the natural gas transportationand distribution sector. The negative effect on the consolidated income statement of the Robin HoodTax was €344 million, of which €169 million of greater current taxes and €175 million of greaterdeferred taxes, associated primarily with the one-off adjustment of deferred taxes as at 31 December2010. Excluding this adjustment, the adjusted net profit amounted to €978 million, a fall of €128million or 11.6% compared with 2010.The significant results from the cost reductions achieved enabled the realisation of the savings targetannounced for 2012, one year in advance. The accumulated cost savings at the end of <strong>2011</strong> were €81million, calculated in real terms based on fixed controllable costs of 2008 and like-for-like operations.The net cash flow from operations (€1,537 million) allowed us to cover almost entirely the outflowsassociated with net capital expenditure for the period of €1,589 million. The increase in net financialdebt, following the payment of the dividend to shareholders of €811 million, amounted to €856million.DividendsProfit and cash generation made it possible to distribute a dividend, subject to the approval of theShareholders’ Meeting, of €0.24 per share, of which €0.10 per share was distributed in October 2010as an interim dividend, and the balance of €0.14 per share will be made payable as of 24 May 2012 (exdividenddate of 21 May 2012).Natural gas transportationAn amount of 78.30 billion cubic metres of gas was injected into the transportation network, a reductionof 5.01 billion cubic metres (-6.0%) on 2010. This fall was attributable primarily to the reduction innatural gas demand in Italy (-6.3% compared to 2010), concentrated specifically in the residential andtertiary sector (-8.2%) and in the thermoelectric sector (-6.9%). Adjusted for weather effect, natural gasdemand decreased by approximately 3% compared with 2010.<strong>Snam</strong> <strong>Annual</strong> <strong>Report</strong> <strong>2011</strong>
<strong>Snam</strong> <strong>Annual</strong> <strong>Report</strong> <strong>2011</strong> / <strong>Annual</strong> Profile17Regasification of liquefied natural gas (LNG)In <strong>2011</strong>, 1.89 billion cubic metres of natural gas were regasified, slightly lower than the 2010 volumes(1.98 billion cubic metres).Natural gas storageDuring <strong>2011</strong>, 15.31 billion cubic metres of natural gas were moved through the <strong>Snam</strong> Rete Gas storagesystem, essentially in line with volumes handled during 2010.Available storage capacity at 31 December <strong>2011</strong> was 10.0 billion cubic metres, an increase of 8.7%compared with 2010 due to development and upgrade investments at the Fiume Treste, Minerbio andSettala concessions.Natural gas distributionAs at 31 December <strong>2011</strong>, the number of active meters located at end-user gas resupply points stood at5.897 million units, 0.8% higher than 31 December 2010.InvestmentsInvestment amounted to €1,585 million (€1,540 million in 2010) of which €1,155 million was throughincentives 4 (72.9% out of total investments).Primary legislative provisionsImplementation of the Third Energy Package adjustment projectThe Gazzetta Ufficiale of 28 June <strong>2011</strong> published Legislative Decree no. 93 of 1 June <strong>2011</strong>, which enactsEU Directives 2009/72/EC and 2009/73/EC (the Third Energy Package) concerning common rules forthe internal market in electricity and natural gas. The Decree sets <strong>Snam</strong> an obligation to conform, by 3March 2012, to the ITO (Independent Transmission Operator) model, which provides for the operationaland decision-making separation of the transporter from the vertically integrated business (i.e. Eni)marketing the gas.On 5 December <strong>2011</strong>, the Shareholders’ Meeting, in implementing the Community guidelines adoptedby the Decree, authorised, pursuant to Article 12.2 of the Articles of Association of <strong>Snam</strong> Rete Gas S.p.A.,the transfer of the “Transportation, dispatch, remote control and metering of natural gas” businessunit to <strong>Snam</strong> Trasporto S.p.A., a wholly-owned subsidiary which acts as operator of the transportationsystem continuously from 1 January 2012 5 .4 Including measurement investments. More details on investments in each business segment are given in the section “Businesssegment operating performance”.5 For more details on operation please see the section “Other information” of the Notes to the individual financial statementsof <strong>Snam</strong> Rete Gas S.p.A.<strong>Snam</strong> <strong>Annual</strong> <strong>Report</strong> <strong>2011</strong>
18<strong>Snam</strong> <strong>Annual</strong> <strong>Report</strong> <strong>2011</strong> / <strong>Annual</strong> ProfileThe same Shareholders’ Meeting also approved, with effect from 1 January 2012, the amendment tothe Articles of Association concerning the change in company name from “<strong>Snam</strong> Rete Gas S.p.A.” to“<strong>Snam</strong> S.p.A.”, corresponding to the abbreviated version of the previous name. This decision is due to theexpediency of giving “<strong>Snam</strong> Trasporto S.p.A.” the name “<strong>Snam</strong> Rete Gas S.p.A.”, taking into account thereputation of the brand, both in the specific business sector and in the market in general, as the leadingnational gas transportation operator.The enactment of the Third Energy Package also gave rise to:- the termination of the services agreements with Eni or with its subsidiaries;- the acquisition of the Eni subsidiary Adfin, dedicated to the accounting and administration of <strong>Snam</strong>and its subsidiaries (1 November <strong>2011</strong>);- the acquisition of the Eni subsidiary, dedicated to the ICT services of <strong>Snam</strong> and its subsidiaries (1November <strong>2011</strong>);The Electricity and Gas Authority is assessing the conformity of the model adopted by <strong>Snam</strong>, pursuantto the legal proThrough the effect of the above operations, the scope of consolidation and the new logosof the company and the group as at 1 January 2012 are as follows:Scope of consolidation as at 1 January 2012:<strong>Snam</strong> S.p.A.Transportation 100% Regasification 100% Storage 100% Distribution 100%Distribution 99.69%<strong>Snam</strong> <strong>Annual</strong> <strong>Report</strong> <strong>2011</strong>
<strong>Snam</strong> <strong>Annual</strong> <strong>Report</strong> <strong>2011</strong> / <strong>Annual</strong> Profile19Liberalisation DecreeDecree Law no. 1 of 20 January 2012 was published in the Gazzetta Ufficiale of 24 January 2012authorising “Urgent arrangements for competition, development of infrastructures and competitiveness”.Specifically, Article 15 “Arrangements on the subject of ownership unbundling” established that thePrime-Ministerial Decree pursuant to Article 1, paragraph 905 of Law no. 296 of 27 December 2006relating to the implementation of ownership unbundling between Eni and <strong>Snam</strong>, will be issued within sixmonths of the above-mentioned Decree Law coming into force.Decree-Law no. 138 of 13 August <strong>2011</strong> - Additional urgent measures for financial stabilityand developmentNet profit for <strong>2011</strong> was strongly penalised by the fiscal measures introduced by Decree Law no. 138of 13 August <strong>2011</strong>, converted into Law no. 148 of 14 September <strong>2011</strong>. Specifically, Article 7 of thisDecree amended Decree Law no. 112 of 25 June 2008 (converted into Law no. 133 of 6 August 2008)establishing an additional corporate income tax (Robin Hood Tax) for companies operating in the fieldsof hydrocarbons exploration and development, oil refining, production and sale of petrol, oil, diesel,lubricants, liquefied natural gas and natural gas, and the production or sale of electricity, makingprovision, from the current financial year, for:- extending the scope of the Decree to include companies operating in the fields of transmission,dispatch and distribution of electricity and transportation and distribution of natural gas;- for financial years <strong>2011</strong>, 2012 and 2013, the increase in the rate of additional tax from 6.5% to10.5%;- changes to the ceiling above which the additional tax applies, identified, with reference to theprevious financial year, as revenue of €10 million and taxable income of €1 million, to replace theprevious threshold of €25 million.As a result of the measures in question, <strong>Snam</strong> companies operating in the natural gas transportation anddistribution segment are subject to the additional corporate income tax (IRES) at a rate of 10.5% forfinancial years <strong>2011</strong>, 2012 and 2013 and 6.5% from 2014.Key figuresTo improve the economic and financial review, in addition to conventional IAS/IFRS indicators andfinancial statements, the directors’ report also contains reclassified financial statements and severalalternative performance indicators such as EBITDA, EBIT, net profit in the adjusted configuration andnet financial debt. The following tables, the explanatory notes thereto and the reclassified consolidatedfinancial statements illustrate these amounts; see the glossary for a definition of the terms used, wherethese are not specified.<strong>Snam</strong> <strong>Annual</strong> <strong>Report</strong> <strong>2011</strong>
20<strong>Snam</strong> <strong>Annual</strong> <strong>Report</strong> <strong>2011</strong> / <strong>Annual</strong> ProfileMain income statement data(€ million) 2009 (a) 2010 <strong>2011</strong>Core business revenue 2,438 3,475 3,539Core business revenue net of the effects of IFRIC 12 2,438 3,126 3,179Operating costs 581 968 993Operating costs net of the effects of IFRIC 12 581 619 633EBITDA 1,887 2,540 2,612EBIT 1,274 1,862 1,958Net profit (b) 732 1,106 790Adjusted net profit (c) 732 1,106 978(a)(b)(c)The 2009 income statement data include the impact of consolidating Italgas and Stogit from 30 June 2009, the date the acquisition transaction was completed.Net profit is attributable to <strong>Snam</strong>.For a definition of net profit and reconciliation with adjusted net profit, which excludes special items, see the section “Comments on the results – Reconciliation of net profit with theadjusted figure”.Key balance sheet and cash flow figures(€ million) 2009 2010 <strong>2011</strong>Investments (a) 1,254 1,540 1,585Net invested capital at 31 December 15,652 16,257 16,989Shareholders’ equity including minority interests at 31 December 5,703 5,916 5,792Group Shareholders’ equity at 31 December 5,702 5,915 5,791Net financial debt at 31 December 9,949 10,341 11,197Free Cash Flow (b) (4,489) 382 (52)(a) Investments for 2009 in the distribution and storage of natural gas segments, amounting to €172 and €149 million respectively, relate to the period 1 July 2009 - 31 December 2009.(b) Free cash flow for 2009 reflects the disbursement for the acquisition of Italgas and Stogit.Key share figures(€ million) 2009 2010 <strong>2011</strong>Number of shares of share capital (millions) 3,570.8 3,570.8 3,571.2Number of shares outstanding on 31 December (millions) 3,375.9 3,376.6 3,378.6Average number of shares outstanding during the year (millions) 2,579.3 3,376.2 3,378.0Year-end official stock price (€) 3.46 3.73 3.39Average official share price during the year (€) 3.22 3.59 3.75Market capitalisation (a) 11,681 12,595 11,454Dividend per share (€ per share) 0.20 0.23 0.24Dividends per period (b) 675 777 811Dividends paid in the year 450 776 811(a) The product of the number of shares outstanding (exact number) multiplied by the year-end official stock price.(b) The amount for <strong>2011</strong>, representing the balance, was estimated on the basis of the number of shares outstanding on 31 December <strong>2011</strong>.<strong>Snam</strong> <strong>Annual</strong> <strong>Report</strong> <strong>2011</strong>
<strong>Snam</strong> <strong>Annual</strong> <strong>Report</strong> <strong>2011</strong> / <strong>Annual</strong> Profile21Key profit and financial indicators2009 (a) 2010 <strong>2011</strong>EBIT per share (b) (€) 0.49 0.55 0.58Net profit per share (b) (€) 0.28 0.33 0.23Adjusted net profit per share (b) (€) 0.28 0.33 0.29Group shareholders’ equity per share (b) (€) 2.21 1.75 1.71ROE (c) % 15.8 19.0 13.5ROI (d) % 10.0 11.7 11.8Dividend yield (Dividend for the period/year-end official stock price) (%) % 5.8 6.2 7.1Price/Book value (Average official price per share/Group shareholders’ equity per share) (€) 1.46 2.05 2.19(a) Profit for 2009 in the distribution and storage of natural gas segments, relating to the period 1 July 2009 - 31 December 2009.(b) Calculated considering the average number of shares outstanding during the year.(c) Return on equity (ROE) was calculated as the ratio of net profit to the average of beginning and ending shareholders’ equity for the period.(d) Return on investment (ROE) was calculated as the ratio of EBIT to the average of beginning and ending net invested capital for the period.Key operating figures (a)Natural gas transportation (b)2009 2010 <strong>2011</strong> Change Change %Natural gas injected into the national gas transportation network (billions of cubic metres) (c) 76.90 83.31 78.30 (5.01) (6.0)Transportation network (kilometres in use) 31,531 31,680 32,010 330 1.0Liquefied Natural Gas (LNG) regasification (b)LNG regasification (billions of cubic metres) 1.32 1.98 1.89 (0.09) (4.5)Natural gas storage (b)Available storage capacity (billions of cubic metres) (d) 8.9 9.2 10.0 0.8 8.7Natural gas moved through the storage system (billions of cubic metres) 16.52 15.59 15.31 (0.28) (1.8)Natural gas distributionActive meters (millions) 5.771 5.848 5.897 0.049 0.8Distribution concessions (number) 1,441 1,448 1,449 1 0.1Distribution network (kilometres) 49,973 50,307 50,301 (6)Employees in service at year end (number) (e) 6,187 6,104 6,112 8 0.1by business segments:- Transportation (f) 2,254 2,636 2,755 119 4.5- Regasification 87 70 74 4 5.7- Storage 301 279 278 (1) (0.4)- Distribution 3,545 3,119 3,005 (114) (3.7)(a) The changes indicated in the table, and in those subsequent to this <strong>Report</strong>, must be considered as changes for the year <strong>2011</strong> over the year 2010. The percentage changes were calculatedwith reference to the data indicated in the relevant tables.(b) Gas volumes are expressed in standard cubic metres (SCM) with an average higher heating value (HHV) of 38.1 and 39.4 MJ/SCM, respectively for the businesses of natural gas transportation,regasification and storage.(c) The data for 2010 have been aligned with those published in the National Transportation Network Financial Statements.(d) Working gas capacity for modulation, mining and balancing services. The available capacity is that declared to the Electricity and Gas Authority at the start of the thermal year <strong>2011</strong>-2012,in compliance with Resolution ARG/gas 119/10.(e) Fully consolidated companies.(f) Employees in service in <strong>2011</strong> include personnel transferred following the purchase of the “ICT” and “Unbundled Companies Administrative Services” business units from Eni and Eni Adfin,respectively.<strong>Snam</strong> <strong>Annual</strong> <strong>Report</strong> <strong>2011</strong>
22<strong>Snam</strong> <strong>Annual</strong> <strong>Report</strong> <strong>2011</strong> / <strong>Annual</strong> ProfileNET PROFIT (€ million)20092010<strong>2011</strong>7321,106790ADJUSTED NET PROFIT (€ million)20092010<strong>2011</strong>7321,106978EBIT (€ million)20092010<strong>2011</strong>1,2741,8621,958<strong>Snam</strong> <strong>Annual</strong> <strong>Report</strong> <strong>2011</strong>
<strong>Snam</strong> and financial markets<strong>Snam</strong> <strong>Annual</strong> <strong>Report</strong> <strong>2011</strong>
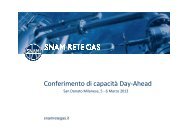
24<strong>Snam</strong> <strong>Annual</strong> <strong>Report</strong> <strong>2011</strong> / <strong>Snam</strong> and financial marketsDuring <strong>2011</strong> the European financial markets were affected by the escalation s of the problems associatedwith the sovereign debt of various countries in the euro area, including Italy.The possible incapacity to refinance the stock of debt due to the size of the debt itself and the increasingcost of debt gradually reduced the confidence of market operators, penalising all European markets,primarily those of countries with higher levels of debt.Furthermore, during the year the financial markets also suffered from the increasing need of variousbanks to recapitalise in order to rebalance their capital structure.Lastly, the austerity moves of various governments to tackle the problems of their public accounts gaverise to downward revisions of the forecasts for economic growth indices for 2012 with, in some cases,predictions of recession.This had an inevitable negative effect on the annual performance of the primary European markets: theLondon FTSE 100 index was down 5.6%, the Frankfurt DAX 14.7%, while the CAC 40 in Paris was down17%. The European Eurostoxx 50 index closed the year down 17%.During the year the Italian financial markets also sustained a fall in value: the FTSE MIB index, whichincludes Italy’s 40 largest listed companies by market capitalisation, dropped by 25.2%, while the FTSEItalia All-Share index, which includes all listed companies, was down 24.3%. These performances weremotivated by the fact that Italy represented, in the foreign debt crisis, one of the high risk situations forfinancial market operators, especially in the last part of the year, because of fears of the refinancing of thehigh public debt. Moreover it should be underlined that the trend of the national indices was influencedby their segmented composition, featuring a prevalence of companies belonging to the banking sector,which during the year recorded a significantly downward trend.The <strong>Snam</strong> stock, which also features on the leading international indices (Stoxx Europe, S&P Europe,MSCI Europe) as well as the Italian FTSE MIB index, closed <strong>2011</strong> at an official price of €3.39, down 9.1%from the €3.73 recorded at the end of the previous year. The annual performance of the stock was notonly affected by the negative trend of the financial markets in Italy and Europe, but also and especiallyby the extension of the application of the Robin Hood Tax in the second part of year to regulatednational energy companies, which involved an increase in the tax rates.During the year, the stock did however outperform the European utilities sector (Stoxx Europe 600Utilities -16.6%), confirmation of the interest in companies with solid business fundamentals and longtermvisibility of results and cash flows, in spite of increasing country risk and elevated volatility.In <strong>2011</strong> the Italian MTA (Mercato Telematico Azionario) saw approximately 2.4 billion <strong>Snam</strong> shareschange hands, with average daily exchanges of around 9.3 million shares, a fall compared to the 11.5million of 2010.ShareholdersAt 31 December <strong>2011</strong>, the fully subscribed and paid-up share capital of <strong>Snam</strong> Rete Gas S.p.A.totalled €3,571,187,994 and consisted of 3,571,187,994 ordinary shares with a nominal value of €1(3,570,768,494 shares with the same nominal value at 31 December 2010). The increase of €355,000over 31 December 2010 was due to the issue of 355,000 shares with a nominal value of €1, subscribedby executives entitled to participate in the 2003 and 2004 stock option plans.At year end, based on entries in the Shareholders’ Register and other information gathered, Eni S.p.A.held 52.53% of share capital, <strong>Snam</strong> Rete Gas S.p.A. held 5.39% in the form of treasury shares in theportfolio, and the remaining 42.08% was held by other shareholders.<strong>Snam</strong> <strong>Annual</strong> <strong>Report</strong> <strong>2011</strong>
<strong>Snam</strong> <strong>Annual</strong> <strong>Report</strong> <strong>2011</strong> / <strong>Snam</strong> and financial markets25SNAM - COMPARISON OF PRICES OF SNAM, FTSE MIB AND EURO STOXX 600 UTILITIES(31 December 2010 - 31 December <strong>2011</strong>)140120100806040200Volume <strong>Snam</strong> FTSEMIB Eurostoxx Utilities MlnJan-11 Feb-11 Mar-11 Apr-11 May-11 Jun-11 Jul-11 Aug-11 Sep-11 Oct-11 Nov-11 Dec-1180706050403020100Source: <strong>Snam</strong> calculations using BLOOMBERG data.SHAREHOLDER BASE OF SNAM BY TYPE OF INVESTOR11.94% Continental Europe institutions52.53% ENI9.59% Retail investors7.41% North America institutions5.39% Treasury shares4.97% UK & Ireland institutions4.10% Italy institutions2.56% Rest of the World institutions1.51% Banca d'ItaliaSNAM SHAREHOLDER BASE BY GEOGRAPHICAL AREA11.94% Continental Europe73.12% Italy (*)7.41% USA and Canada4.97% UK and Ireland2.56% Rest of the World(*) The total amount of retail investors and treasury sharesin the portfolio is included in the Italian percentageKey indices which include <strong>Snam</strong> stockFTSE MIBStoxx Europe 600Stoxx Europe 600 UtilitiesS&P EuropeSustainability indicesFTSE4Good Europe (as of 2002)FTSE4Good Global (as of 2002)DJSI World (as of 2009)ECPI Ethical Europe (as of 2009)ECPI Ethical Global (as of 2009)ECPI Ethical EMU (as of 2009)Stoxx Global ESG Leaders (as of <strong>2011</strong>)<strong>Snam</strong> <strong>Annual</strong> <strong>Report</strong> <strong>2011</strong>
<strong>Snam</strong> <strong>Annual</strong> <strong>Report</strong> <strong>2011</strong>
Business segmentoperating performance<strong>Snam</strong> <strong>Annual</strong> <strong>Report</strong> <strong>2011</strong>
Main factors ofthe pricing framework
<strong>Snam</strong> <strong>Annual</strong> <strong>Report</strong> <strong>2011</strong> / Main factors of the pricing framework29The transportation, regasification of LNG, storage and distribution of natural gas are regulated by theElectricity and Gas Authority, which has been operative since 1997, and is responsible for the regulationof the national electricity and natural gas markets. Among its functions are the calculation and updatingof the tariffs, and the provision of rules for access to infrastructures and for the delivery of the relativeservices. The following are the primary tariff components for each of the regulated activities carried outby <strong>Snam</strong>, based on the regulatory framework in force as at 31 December <strong>2011</strong>.TRANSPORTATION REGASIFICATION STORAGE DISTRIBUTIONEnd of regulatoryperiod• 31 December 2013 • 30 September 2012 • 31 December 2014 • 31 December 2012Calculation of netinvested capitalrecognised for regulatorypurposes (RAB)• Revalued historical cost • Revalued historical cost • Revalued historical cost• Deduction of restorationcosts recognised• Revalued historical cost• Parametric method forcentralised assetsReturn on net investedcapital recognisedfor regulatory purposes(pre-tax WACC)• 6.4% (transportation)• 6.9% (metering)• 7.6% • 6.7% • 7.6% (distribution)• 8% (metering)Incentives on newinvestments• 1% over 5 years(on safety investments)• 2% over 7/10 years(on capacity upgradeinvestments)• 3% over 10/15 years(on entry capacityupgrade investments)• 2% over 8 years(on expanding existingterminals by lessthan 30%)• 3% over 16 years(on expanding existingterminals by morethan 30%)• 4% over 8 years(on upgradingexisting capacity)• 4% over 16 years(on developing newstorage fields)• 2% over 8 years(on replacing cast-ironpipes and renovatingodorisation systems)Efficiency factor(X FACTOR)• 2.1% on operating costs • 0.5% on operating costs • 0.6% on operating costs • 3.2% on distributionoperating costs• 3.6% on meteringoperating costsGas demand• 15% of revenues exposedto change in demand• 10% of revenues exposedto change in demand• No exposure to changein demand• No exposure to changein demand<strong>Snam</strong> <strong>Annual</strong> <strong>Report</strong> <strong>2011</strong>
<strong>Snam</strong> <strong>Annual</strong> <strong>Report</strong> <strong>2011</strong>Natural gas transportation
<strong>Snam</strong> <strong>Annual</strong> <strong>Report</strong> <strong>2011</strong> / Natural gas transportation31Key performance indicators(€ million) 2009 2010 <strong>2011</strong> Change Change %Core business revenue (*) 1,865 1,929 1,945 16 0.8- of which natural gas transportation revenue 1,848 1,873 1,867 (6) (0.3)Operating costs (*) 399 343 387 44 12.8EBIT 974 1,185 1,137 (48) (4.1)Investments 926 902 892 (10) (1.1)- of which with incentives 793 763 709 (54) (7.1)- of which without incentives 133 139 183 44 31.7Net invested capital at 31 December 10,060 10,404 10,686 282 2.7Volumes of natural gas injected into the national transportation network(billions of cubic metres) (**) 76.90 83.31 78.30 (5.01) (6.0)Transportation network (kilometres in use) 31,531 31,680 32,010 330 1.0- of which national network 8,871 8,894 9,080 186 2.1- of which regional network 22,660 22,786 22,930 144 0.6Employees in service at 31 December (number) 2,254 2,636 2,755 119 4.5(*) Before consolidation adjustments.(**) The data for 2010 have been aligned with those published in the National Transportation Network <strong>Report</strong>.Financial resultsRevenue from transportation of natural gas amounted to €1,867 million, a reduction of €6 million,equal to 0.3%, compared with 2010. This decrease is due to the additional revenue (€55 million)recorded in the previous financial year, deriving from the recognition by the Electricity and Gas Authorityof additional expenses incurred for the acquisition of fuel gas in the period from 1 October 2008 to 31December 2009. Net of this effect, transportation revenue recorded an increase of €49 million, equalto 2.7%, essentially attributable to the contribution of investments made in 2009 (+€100 million),whose effects were partly absorbed by the tariff updating (-€52 million) and by lower volumes of gastransported (-€15 million). Higher revenue from tariff components offset in costs (+€13 million) alsocontributed to the increase in transportation revenue.EBIT for <strong>2011</strong> was €1,137 million, down by €48 million (4.1%), compared with 2010. The reduction ismainly due to: (i) the increase in operating costs (-€27 million, net of the components offset in revenue),essentially following increased expenses for legal disputes (-€37 million) due to provisions for risks(€9 million) in view of use recorded in the previous financial year (€10 million), and the unfavourableoutcome of disputes concluded during the year (-€18 million); and (ii) lower transportation revenue(-€19 million net of components which were offset in costs).<strong>Snam</strong> <strong>Annual</strong> <strong>Report</strong> <strong>2011</strong>
32<strong>Snam</strong> <strong>Annual</strong> <strong>Report</strong> <strong>2011</strong> / Natural gas transportationOperating reviewInvestments(€ million) 2009 2010 <strong>2011</strong> Change Change %Development 692 671 601 (70) (10.4)Investments with 3% incentive 451 456 356 (100) (21.9)Investments with 2% incentive 241 215 245 30 14.0Maintenance and other 234 231 291 60 26.0Investments with 1% incentive 101 92 108 16 17.4Investments with no incentives 133 139 183 44 31.7926 902 892 (10) (1.1)Investments in <strong>2011</strong> amounted to €892 million, a decrease of €10 million, or -1.1%, compared with2010 (€902 million).Investments were classified in accordance with Resolution ARG/gas 184/09 of the Electricity and GasAuthority, which identified various categories of project with different incentive levels.A total of 79% of these investments are expected to benefit from incentive-based return. The breakdownof investments in <strong>2011</strong> by category will be submitted to the Authority when the tariffs are approvedfor 2013.The main investments with a 3% incentive (€356 million) were:- the continuation of construction work on the main line of the Massafra-Biccari pipeline in Pugliaand Basilicata as part of the new transportation infrastructure project on the Adriatic coast (€101million);- the continuation of construction work on the Poggio Renatico-Cremona pipeline in Emilia-Romagnaand Lombardy as part of the project to upgrade the transportation infrastructure in the Po Valley(€91 million);- the continuation of construction work as part of the project to upgrade the import infrastructure inSicily and Calabria (€85 million): (i) renovation work and equipment at the Enna station in Sicily;(ii) the continuation of construction work and materials for the upgrading of the Montesano stationin Campania; and (iii) completion works on the sections already in service and construction of thetunnel section of the Montalbano-Messina pipeline in Sicily;- the construction of infrastructure to connect with the Offshore LNG Toscana (OLT) regasificationterminal at Livorno (€50 million) on the coast of Tuscany;The main investments with a 2% incentive (€245 million) were:- as part of the project to upgrade the transportation infrastructure in the Po Valley (€116 million): (i)the continuation of construction work on the Cremona-Sergnano pipeline in Lombardy; and (ii) thematerials and the continuing purchase of permits for the Zimella-Cervignano pipeline in Veneto andLombardy;- construction work on various pipelines and associated connections as part of the natural gasconversion project in Calabria (€23 million).The main investments with a 1% incentive (€108 million) involved several projects aimed at maintainingadequate safety and quality levels at the plants.<strong>Snam</strong> <strong>Annual</strong> <strong>Report</strong> <strong>2011</strong>
<strong>Snam</strong> <strong>Annual</strong> <strong>Report</strong> <strong>2011</strong> / Natural gas transportation33Investments with no incentives (€183 million) included projects to replace assets and plants, as wellas projects relating to the implementation of new IT systems, the development of existing ones and thepurchase of other key operating assets.SHARE OF INVESTMENTS BY INCENTIVE (% of total investments)14%15%21%Investments with no incentive11%26%10%24%12%27%Investments with a 1% incentiveInvestments with a 2% incentiveInvestments with a 3% incentive49% 51%40%2009 2010 <strong>2011</strong>National Gas Transportation Network <strong>Report</strong>Availability of natural gas(billions of m³) 2009 2010 (*) <strong>2011</strong> Change Change %From imports 68.67 75.17 70.27 (4.90) (6.5)Domestic output 8.23 8.14 8.03 (0.11) (1.4)Total gas injected into the network 76.90 83.31 78.30 (5.01) (6.0)Net balance of withdrawal/introduction into storage (**) 0.78 (0.64) (0.89) (0.25) 39.1Total availability of natural gas 77.68 82.67 77.41 (5.26) (6.4)(*) The figures for 2010 have been aligned with those published in the National Transportation Network <strong>Report</strong>.(**) The balance between the withdrawal from storage (+) and introduction into storage (-).Withdrawals of natural gas(billions of m³) 2009 2010 (*) <strong>2011</strong> Change Change %Redelivery to the domestic market 76.66 81.54 76.69 (4.85) (5.9)Exports 0.48 0.54 0.42 (0.12) (22.2)Consumption and emissions attributable to <strong>Snam</strong> Rete Gas 0.34 0.47 0.27 (0.20) (42.6)Gas not accounted for and other changes (**) 0.20 0.12 0.03 (0.09) (75.0)Total withdrawals of natural gas 77.68 82.67 77.41 (5.26) (6.4)(*) The figures for 2010 have been aligned with those published in the National Transportation Network <strong>Report</strong>.(**) Includes the change of the network capacity. For the definition of Unaccounted For Gas (UFG) please see the paragraph below titled “Withdrawals of natural gas”.<strong>Snam</strong> <strong>Annual</strong> <strong>Report</strong> <strong>2011</strong>
34<strong>Snam</strong> <strong>Annual</strong> <strong>Report</strong> <strong>2011</strong> / Natural gas transportationThe availability of natural gas in Italy in <strong>2011</strong> was 77.41 billion cubic metres, down by 5.26 billion cubicmetres (-6.4%) compared to 2010.The quantities of gas injected into the National Transportation Network was down by 6.0% to 78.30 billioncubic metres (83.31 billion cubic metres in 2010), through the effect of the lower imports (-4.90 billioncubic metres; -6.5%), as well as the reduction of national production (-0.11 billion cubic metres; -1.4%).The analysis of imports by entry point is:Imports by entry point(billions of m³) 2009 2010 <strong>2011</strong> Change Change %Entry pointsTarvisio 22.92 22.49 26.45 3.96 17.6Mazara del Vallo 21.66 26.29 21.55 (4.74) (18.0)Gries Pass 12.02 7.83 10.86 3.03 38.7Cavarzere (LNG) 1.53 7.04 7.02 (0.02) (0.3)Gela 9.17 9.41 2.34 (7.07) (75.1)Panigaglia (LNG) 1.32 1.98 1.89 (0.09) (4.5)Gorizia 0.05 0.13 0.16 0.03 23.168.67 75.17 70.27 (4.90) (6.5)Imports (70.27 billion cubic metres) recorded a reduction of 6.5% from 2010. Specifically, the lowervolumes injected from the Gela entry point (-7.07 billion cubic metres; -75.1%), following the effectsof the Libyan crisis, and Mazara del Vallo (-4.74 billion cubic metres; -18.0%), set against an increasein imports from the entry point of Tarvisio (+3.96 billion cubic metres; +17.6%) and Gries Pass (+3.03billion cubic metres; +38.7%) penalised in 2010 by the break, in Switzerland, in the import line whichconnects Italy with Northern Europe.NATURAL GAS INJECTED INTO THE NETWORK BY ENTRY POINT (% the total introduced)OtherGelaCavarzereGries PassMazara del Vallo2%13%2%18%32%3%13%9%10%35%3%3%10%15%31%Tarvisio33%30%38%2009 2010 <strong>2011</strong><strong>Snam</strong> <strong>Annual</strong> <strong>Report</strong> <strong>2011</strong>
<strong>Snam</strong> <strong>Annual</strong> <strong>Report</strong> <strong>2011</strong> / Natural gas transportation35Volumes of natural gas injected into the network per user(billions of m³) 2009 2010 (*) <strong>2011</strong> Change Change %Eni 39.58 35.45 35.12 (0.33) (0.9)Enel Trade 8.65 10.34 9.34 (1.00) (9.7)Other 28.67 37.52 33.84 (3.68) (9.8)76.90 83.31 78.30 (5.01) (6.0)(*) The figures for 2010 have been aligned with those published in the National Transportation Network <strong>Report</strong>.Withdrawals of natural gasThe natural gas withdrawn from the National Transportation Network in <strong>2011</strong> (77.41 billion cubicmetres) is mainly: (i) for redelivery to users at the network exit points (76.69 billion cubic metres); (ii)exports (0.42 billion cubic metres), mainly to Slovenia; and (iii) consumption by the compression stationsand the gas emissions from the network and the <strong>Snam</strong> Rete Gas S.p.A. plants (0.27 billion cubic metres).In the energy report compiled by <strong>Snam</strong> Rete Gas S.p.A. the natural difference between the quantity ofgas metered at the entrance to the network and the quantity of gas metered at the exit, due to thetechnical tolerance of the metering devices, is traditionally defined as the Unaccounted For Gas (UFG).Reconciliation of gas withdrawn from the Network and Italian demand(billions of m³) 2009 2010 (*) <strong>2011</strong> Change Change %Quantities withdrawn 77.68 82.67 77.41 (5.26) (6.4)Exports (-) (0.48) (0.54) (0.42) 0.12 (22.2)Gas injected into the regional networks of other operators 0.08 0.06 0.06Other consumption (**) 0.74 0.91 0.79 (0.12) (13.2)Total Italian demand 78.02 83.10 77.84 (5.26) (6.3)(*) The demand for gas has been aligned with that published by the Ministry of Economic Development.(**) Includes the consumption of the LNG terminal at Panigaglia, the consumption of the compression stations for storage and the production treatment stations.Demand for gas in Italy(billions of m³) 2009 2010 (*) <strong>2011</strong> Change Change %Residential and tertiary 31.60 33.91 31.14 (2.77) (8.2)Thermoelectric 29.02 30.06 27.97 (2.09) (6.9)Industrial (**) 16.07 17.36 17.03 (0.33) (1.9)Other 1.33 1.77 1.70 (0.07) (4.0)(*) The demand for gas has been aligned with that published by the Ministry of Economic Development.(**) Includes the consumption of the Industrial, Agricultural and Fishing, Chemical Synthesis and Automotive sectors.78.02 83.10 77.84 (5.26) (6.3)<strong>Snam</strong> <strong>Annual</strong> <strong>Report</strong> <strong>2011</strong>
36<strong>Snam</strong> <strong>Annual</strong> <strong>Report</strong> <strong>2011</strong> / Natural gas transportationThe demand for gas in Italy in <strong>2011</strong> was 77.84 billion cubic metres, down 5.26 billion cubic metres(-6.3%) compared to 2010, following the reduced consumption by the residential and tertiary sector(-8.2%), following the milder temperatures recorded in <strong>2011</strong>, and the thermoelectric sector (-6.9%).Adjusted for weather effect, natural gas demand decreased by 3.1% compared with 2010.GAS DEMAND BY SECTOR (% of total gas demand)Other 2%2%2%Industrial21%21%22%ThermoelectricResidential and tertiary37%36%36%40%41%40%2009 2010 <strong>2011</strong>Transportation capacity(billions of m³/day) Thermal year 2009-2010 Thermal year 2010-<strong>2011</strong> Thermal year <strong>2011</strong>-2012Entry pointsTransportationcapacityCapacitytransferredSaturation (%)TransportationcapacityCapacitytransferredSaturation (%)TransportationcapacityCapacitytransferredSaturation (%)Tarvisio 119.7 102.8 85.9 119.2 110.3 92.5 118.8 109.9 92.5Mazara del Vallo 103.6 98.7 95.3 105.0 98.9 94.2 105.0 88.2 84.0Gries Pass 64.9 59.0 90.9 64.8 55.0 84.9 64.4 61.7 95.8Gela 33.0 32.9 99.7 35.2 34.3 97.4 37.6 21.9 58.2Cavarzere (LNG) 26.4 21.0 79.5 26.4 24.6 93.2 26.4 24.6 93.2Panigaglia (LNG) 13.0 7.2 55.4 13.0 7.2 55.4 13.0 11.4 87.7Gorizia 4.8 4.8 0.5 10.4 4.8 0.6 12.5365.4 321.6 88.0 368.4 330.8 89.8 370.0 318.3 86.0At the start of thermal year <strong>2011</strong>-2012, the development and upgrading work on the transportationinfrastructures made it possible to increase the network’s transportation capacity to 370.0 million cubicmetres/day (+0.4% compared to the start of the 2010-<strong>2011</strong> thermal year).The increase is attributable to the increase in transportation capacity at Gela, following the deploymentof an upgrade on the infrastructures for the imports from North Africa.<strong>Snam</strong> <strong>Annual</strong> <strong>Report</strong> <strong>2011</strong>
<strong>Snam</strong> <strong>Annual</strong> <strong>Report</strong> <strong>2011</strong> / Natural gas transportation37The transportation capacity of the network has covered the entire demand of users also for thethermal year <strong>2011</strong>-2012. In addition to the aforementioned capacities which concern the entry pointsinterconnected with foreign countries and the LNG terminals, a transportation capacity totalling 34million cubic metres/day is available at the domestic production entry points.<strong>Snam</strong> Rete Gas put out its long-term plan for transportation capacity, which was disclosed to theMinistry of Economic Development on 30 June <strong>2011</strong> and published on the <strong>Snam</strong> Rete Gas website www.snamretegas.it in the Business & Services section.The document shows the capacity data on all entry points interconnected with foreign countries and theLNG terminals for the 2012-2013 thermal year and subsequent years up to 30 September 2021.GAS TRANSPORTATION CAPACITY AND SATURATIONAvailable capacity(millions of m 3 /day)Allocated capacity(millions of m 3 /day)365.4321.6368.4Saturation (%)Allocated capacity /Available capacity88.089.886.0330.8370.0318.32009-2010 2010-<strong>2011</strong> <strong>2011</strong>-2012RegulationResolution ARG/gas 184/09 - “Approval of part II – Regulation of the tariffs for the natural gas transportationand dispatch service for regulatory period 2010-2013 (RTTG), approval of part III - Regulation of tariffsfor the gas transportation metering service for regulatory period 2010-2013 (RMTG), provisions on thetransitory fee for the gas transportation metering service for 2010 and amendments to Attachment A ofResolution 11/07”.With Resolution ARG/gas 184/09, published on 2 December 2009, the Electricity and Gas Authorityissued the criteria for defining natural gas transportation and measuring tariffs on the National andRegional Transportation Network for the third regulatory period (1 January 2010 - 31 December 2013).The valuation of the net capital invested (RAB) is based on the revalued historic cost method. The returnrate (WACC) of net capital invested is set at a real rate of 6.4% before taxes.The incentives for new investments were confirmed and provide for a higher return compared to thevariable base rate (WACC), in relation to the type of investment, from 1% to 3% and for a periodfrom 5 to 15 years. The revenues associated with new investments are paid starting from the secondyear following that in which the costs were incurred (“spending”) and are guaranteed regardless of thevolumes transported.<strong>Snam</strong> <strong>Annual</strong> <strong>Report</strong> <strong>2011</strong>
38<strong>Snam</strong> <strong>Annual</strong> <strong>Report</strong> <strong>2011</strong> / Natural gas transportationThe method for updating the price cap tariffs is applied to revenue relating to operating costs and isequal to approximately 15% of the revenues in question, which are updated for inflation and decreasedby an annual recovery coefficient set at 2.1% (3.5% in the previous regulatory period). The revenuecomponents which are related to returns and amortisation and depreciation are determined on thebasis of the annual update of net capital invested (RAB). In particular, in the third regulatory period, theamortisation and depreciation is deducted from the price-cap mechanism and calculated on the basis ofthe useful economic and technical life of the transport infrastructure which is 50 years (40 years in theprevious regulatory period).The tariff structure is based on an entry/exit model and was confirmed for the third regulatory period aswell, together with the capacity fee for the metering service.Finally, fuel gas is treated as a pass-through cost which is payable in kind by the users and is excludedfrom the price cap mechanism.Resolution ARG/gas 218/10 - “Approval of the tariff proposals for natural gas transportation and dispatch,the transitory fee for the gas transportation metering service for <strong>2011</strong> in implementation of the provisionsset forth in Resolution ARG/gas 184/09 issued by the Electricity and Gas Authority on 1 December 2009.”Based on the criteria described, the Electricity and Gas Authority approved the transportation, dispatchand metering tariffs for <strong>2011</strong> with Resolution ARG/gas 218/10.The tariffs were determined on the basis of the base revenues which amounted to €1,817 million netof the third party portion (of which €113 million relate to development investment incentives andapproximately €36 million to revenues associated with system balancing costs).The revenues in effect from <strong>2011</strong> have taken into account the increase in volumes transported comparedto the base amount of 75.7 billion cubic metres.Furthermore, the amount payable to the company for higher costs incurred for the purchase of fuel gasfrom 1 October 2008 to 31 December 2009 was set at €54.9 million.The RAB as at 31 December 2009 for transportation, dispatch and metering amounts to €13.1 billion.Resolution ARG/gas 45/11 - “Regulation for the financial balancing of natural gas”.By this resolution, published on 14 April <strong>2011</strong>, the Authority intended to reform the regulation ofdispatch, transportation and storage of natural gas from 1 July <strong>2011</strong>, a date postponed to 1 December<strong>2011</strong> by Resolution ARG/gas 81/11 published on 23 June <strong>2011</strong>, by introducing a new balancing regimebased on market criteria and attributing <strong>Snam</strong> Rete Gas, as the majority transportation company, therole of company responsible for balancing. This role provides <strong>Snam</strong> Rete Gas with an obligation toacquire, according to criteria of financial merit, the resources necessary to guarantee the safety andefficient movement of gas from entry points to the withdrawal points, in order to maintain the constantequilibrium of the network.The provision provides for an initial phase of simplified balancing, which does not amend the currentmethods of physical dispatching on the network and is based on using the stock of users as the solebalancing resource, selected according to criteria of financial merit. Starting from early 2012, theresolution also set out an extension of the regulatory framework aimed at developing the discipline ofthe balancing service.<strong>Snam</strong> <strong>Annual</strong> <strong>Report</strong> <strong>2011</strong>
<strong>Snam</strong> <strong>Annual</strong> <strong>Report</strong> <strong>2011</strong> / Natural gas transportation39Resolution ARG/gas 178/11 - “Approval of the tariff proposals for natural gas transportation and dispatch,and the transitory fee for the gas transportation metering service for 2012 in implementation of theprovisions set forth in Resolution ARG/gas 184/09 issued by the Electricity and Gas Authority on 1 December2009”.The Authority approved the transportation, dispatch and metering tariffs for 2012 by Resolution ARG/gas 178/11.The tariffs were determined on the basis of the base revenues which amounted to €1,862 million netof the third party portion (of which approximately €113 million relate to development investmentincentives and approximately €41 million to revenues associated with system balancing costs).The revenues in effect in 2012 will have to take account of the increase in volumes transported comparedto the base amount of 75.7 billion cubic metres.The RAB as at 31 December 2010 for transportation, dispatch and metering amounts to €13.7 billion.<strong>Snam</strong> <strong>Annual</strong> <strong>Report</strong> <strong>2011</strong>
<strong>Snam</strong> <strong>Annual</strong> <strong>Report</strong> <strong>2011</strong>Liquefied Natural Gas (LNG)regasification
<strong>Snam</strong> <strong>Annual</strong> <strong>Report</strong> <strong>2011</strong> / Liquefied Natural Gas (LNG) regasification41Key performance indicators(€ million) 2009 2010 <strong>2011</strong> Change Change %Core business revenue (*) (**) 36 35 34 (1) (2.9)- of which LNG regasification revenue 21 24 23 (1) (4.2)Operating costs (**) 27 24 23 (1) (4.2)EBIT 5 7 7Investments 7 3 3Volumes of LNG regasified (billions of cubic metres) 1.32 1.98 1.89 (0.09) (4.5)Tanker loads (number) 38 54 50 (4) (7.4)Employees in service at 31 December (number) 87 70 74 4 5.7(*) Core business revenue includes the charging to the Customers of the charges relating to the natural gas transportation service supplied by <strong>Snam</strong> Rete Gas S.p.A. For the consolidated financialstatements this revenue was aggregated with the transportation costs, under GNL Italia S.p.A. in order to represent the substance of the operation.(**) Before consolidation adjustments.Financial resultsRevenue from transportation of LNG amounted to €23 million, a fall of €1 million compared with2010. The revenues relate to the capacity fees 6 (€21 million) and the variable fees associated with thevolumes of LNG reclassified (€2 million).EBIT amounted to €7 million, unchanged compared with 2010.Operating reviewQuantities of regasified LNG per user(billions of m³) 2009 2010 <strong>2011</strong> Change Change %Enel Trade 1.01 1.28 1.33 0.05 3.9Eni 0.10 0.22 0.02 (0.20) (90.9)Other 0.21 0.48 0.54 0.06 12.51.32 1.98 1.89 (0.09) (4.5)In <strong>2011</strong> the LNG terminal in Panigaglia (SP) regasified 1.89 billion cubic metres of natural gas (comparedwith 1.98 billion cubic metres in 2010), unloading 50 tankers of various types, including one spot load(compared with 54 tankers in 2010, including three spot loads).6 Capacity fees include revenue related to the regasification commitment for an annual volume of LNG and a share of revenue related to the activity ofdocking and unloading LNG tankers.<strong>Snam</strong> <strong>Annual</strong> <strong>Report</strong> <strong>2011</strong>
42<strong>Snam</strong> <strong>Annual</strong> <strong>Report</strong> <strong>2011</strong> / Liquefied Natural Gas (LNG) regasificationVOLUMES OF REGASIFIED LNG AND NUMBER OF LNG TANKER LOADSvolumes regasified(billions of m 3 )5450loads (number)381.981.891.322009 2010 <strong>2011</strong>InvestmentsInvestments in <strong>2011</strong> totalled €3 million (the same as 2010) and mainly involved projects for maintainingplant system safety.RegulationResolution ARG/gas 92/08 - “Criteria for the determination of the tariffs for the regasification service andamendments to Resolution 166/05 and Resolution 11/07”.With Resolution ARG/gas 92/08, published on 9 July 2008, the Electricity and Gas Authority defined thetariff criteria for the regasification service applicable for the third regulatory period (1 October 2008 – 30September 2012).The mechanisms already in effect in the second regulatory period were confirmed for determining thebase revenues, including the real return on net invested capital of 7.6% before taxes. In regard to thetariff structure, the breakdown of revenues into a regasification capacity component and a regasifiedvolumes component was maintained, at a ratio of 90/10 (80/20 in the second regulatory period).The tariffs are updated using the price cap methodology applied only to the component relating tooperating costs, with a productivity recovery coefficient of 0.5%.The revenue component relating to the return and amortisation and depreciation is updated on thebasis of an annual recalculation of invested capital and additional revenues from the incentives forinvestments realised in prior regulatory periods.Incentives for new investments involve the payment of a return increased by three percentage pointsover the base rate (WACC), for a duration up to 16 years. Both the increase in the rate of return and theduration are differentiated depending on the type of investment.Resolution ARG/gas 108/10 - “Approval of the tariff proposals for the regasification service for thermalyear 2010-<strong>2011</strong> for GNL Italia S.p.A. and Terminale GNL Adriatico S.r.l., in implementation of ResolutionARG/gas 92/08 issued by the Electricity and Gas Authority on 7 July 2008”.With this provision, which was published on 19 July 2010, the Electricity and Gas Authority approvedthe tariffs for the regasification service provided by GNL Italia for thermal year 2010-<strong>2011</strong>, pursuant toResolution ARG/gas 92/08.<strong>Snam</strong> <strong>Annual</strong> <strong>Report</strong> <strong>2011</strong>
<strong>Snam</strong> <strong>Annual</strong> <strong>Report</strong> <strong>2011</strong> / Liquefied Natural Gas (LNG) regasification43The tariffs were set on the basis of the base revenues of €25.6 million. The actual revenues for thermalyear 2010-<strong>2011</strong> have taken into account the regasified volumes and the contractual capacities. The netcapital invested as at 31 December 2009 (RAB) was equal to €109.7 million.Resolution ARG/gas 107/11 - “Approval of the tariff proposals for the regasification service for thermalyear <strong>2011</strong>-2012 for GNL Italia S.p.A. and Terminale GNL Adriatico S.r.l., in implementation of ResolutionARG/gas 92/08 issued by the Electricity and Gas Authority on 7 July 2008”.With this provision, which was published on 2 August <strong>2011</strong>, the Electricity and Gas Authority approvedthe tariffs for the regasification service provided by GNL Italia for thermal year <strong>2011</strong>-2012, pursuant toResolution ARG/gas 92/08.The tariffs were set on the basis of the base revenues of €26 million. The actual revenues must takeinto account the regasified volumes and the contractual capacities. The net capital invested as at 31December 2010 (RAB) was equal to €108 million.Impact on regasification activities from La Spezia-Cortemaggiore pipeline eventFollowing the event at the La Spezia-Cortemaggiore pipeline which took place on 18 January 2012, thebreak in the pipeline meant that the usual regasified quantities could not be injected into the network.Consequently, the amount injected by the Panigaglia LNG plant was about 10% of the nominal capacity.This meant that the two storage tanks could not be drained regularly, in order to create sufficient roomto receive the scheduled loads from tankers.It was therefore not possible to receive two loads of gas from tankers on the agreed dates. However,an agreement was reached with those involved to reschedule to later dates without any significanteconomic impact.The pipeline was operational again on 28 January 2012 and full regasification capacity was restored atthe terminal, meaning that all tankers scheduled for February can be unloaded.<strong>Snam</strong> <strong>Annual</strong> <strong>Report</strong> <strong>2011</strong>
<strong>Snam</strong> <strong>Annual</strong> <strong>Report</strong> <strong>2011</strong>Natural gas storage
<strong>Snam</strong> <strong>Annual</strong> <strong>Report</strong> <strong>2011</strong> / Natural gas storage45Key performance indicators(€ million) 2009 (*) 2010 <strong>2011</strong> Change Change %Core business revenue (**) 161 355 372 17 4.8- of which natural gas storage revenue 158 349 372 23 6.6Operating costs (**) 38 63 64 1 1.6EBIT 92 218 255 37 17.0Investments 282 252 296 44 17.5Net invested capital at 31 December 2,093 2,258 2,642 384 17.0Concessions (number) 10 10 10- of which operational (***) 8 8 8Natural gas moved through the storage system (billions of cubic metres) 16.52 15.59 15.31 (0.28) (1.8)- of which injected 7.81 8.00 7.78 (0.22) (2.8)- of which withdrawn 8.71 7.59 7.53 (0.06) (0.8)Available storage capacity (billions of cubic metres): 13.9 14.2 15.0 0.8 5.6- of which available (****) 8.9 9.2 10.0 0.8 8.7- of which strategic 5.0 5.0 5.0Employees in service at 31 December (number) 301 279 278 (1) (0.4)(*) The financial results for the year 2009 were disclosed from 30 June 2009, the date of completion of the operation to acquire Stogit from Eni.(**) Before consolidation adjustments.(***) Working gas capacity for modulation services.(****) Working gas capacity for modulation, mining and balancing services. The available capacity is that declared to the Electricity and Gas Authority at the start of thermal year <strong>2011</strong>-2012,in compliance with Resolution ARG/gas 119/10.Financial resultsRevenue from storage of natural gas amounted to €372 million 7 , an increase of €23 million, equal to6.6%, compared with 2010. The increase is essentially due to the contribution of investments made in2009 (+€29 million) and the volumes of gas moved (+€6 million), whose effects were partly absorbedby the tariff updating (-€15 million). Storage revenue refers to modulation storage (€303 million;+7.4%) and strategic storage (€66 million; -1.5%).EBIT in 2010 amounted to €255 million, an increase of €37 million, equal to 17.0%, compared with2010. This increase was mainly due to increased storage revenue (+€23 million), the operating efficiency,and the reduction in depreciation and amortisation (+€20 million) on discounted estimated costs to beincurred when the storage sites are dismantled. These effects are partly absorbed by less income (-€3million, net of the cost of gas sold) from the sale, in 2010, of some strategic gas no longer required forthe provision of storage services.The reduction in depreciation and amortisation is related to the adjustment, as of 1 January <strong>2011</strong>, ofthe future timing of expenditure relating to the estimated charges for storage site dismantling andrestoration, which increased by 20 years (corresponding to the duration of the two possible extensionsof 10 years each 8 ) in the estimated time required to extinguish the relevant obligations.7 Storage revenue for <strong>2011</strong> includes revenue from the User balance service – extra supply point fee – pursuant to the Electricityand Gas Authority Resolutions ARG/gas 165/09 and ARG/gas 119/10.8 Pursuant to Article 11, paragraph 1 of Legislative Decree no. 164/2000, the storage of natural gas in fields or deep geologicalstructures is carried out via concessions of no longer than 20 years. These concessions are granted by the Ministry ofEconomic Development, with the approval of the region concerned for onshore storage concessions. The concessionaire isentitled to a maximum of two ten-year extensions, provided it has carried out the storage programmes and fulfilled all otherobligations arising from the concession.<strong>Snam</strong> <strong>Annual</strong> <strong>Report</strong> <strong>2011</strong>
46<strong>Snam</strong> <strong>Annual</strong> <strong>Report</strong> <strong>2011</strong> / Natural gas storageThis adjustment is consistent with the remuneration paid for tariff purposes by the Electricity and GasAuthority, which, through Resolution ARG/gas 119/10, provided for a specific portion of revenue to bededicated to the payment of storage site restoration costs, taking into account the maximum durationof the concession (40 years from the date the concession was granted, including the two possibleextensions), so as to enable full recovery of costs.Operating reviewInvestments(€ million) 2009 2010 <strong>2011</strong> Change Change %Development of new fields (4% incentive over 16 years) 221 144 193 49 34.0Upgrading of capacity (4% incentive over eight years) 36 74 65 (9) (12.2)Maintenance and other 25 34 38 4 11.8282 252 296 44 17.5Investments in <strong>2011</strong> amounted to €296 million, an increase of €44 million, or 17.5%, compared with2010.Investments were classified in accordance with Resolution ARG/gas 119/10 of the Electricity and GasAuthority, which identified various categories of projects with different incentive levels.A total of 87% of these investments are expected to benefit from incentive-based return. The breakdownof investments in <strong>2011</strong> by category will be submitted to the Authority when the respective tariffs areapproved for 2013.Investments with a 4% incentive over 16 years (€193 million) relate to development activities inprogress in the Fiume Treste storage fields, as well as at the Bordolano storage field to develop thecushion gas injection programme 9 .Investments with a 4% incentive over eight years (€65 million) refer to ongoing activities related toprojects to increase pressure, mainly at the Minerbio, Sabbioncello and Settala storage fields.Maintenance and other investments (€38 million) mainly refer to works for maintaining suitable safetyand quality levels for plants and projects relating to the implementation of new information systems andadjustments to existing ones.Natural gas moved through the storage systemThe volumes of gas moved in the Storage System in <strong>2011</strong> stood at 15.31 billion cubic metres, a slightreduction (-0.28 billion cubic metres; -1.8%) compared with the volumes moved in 2010 (15.59 billioncubic metres). The reduction is mainly due to lower injections of gas for the replenishment of stocks(-0.22 billion cubic metres; -2.75%).The available storage capacity at 31 December <strong>2011</strong> was around 15 billion cubic metres, an increase of5.6% compared with 2010. The increase is associated with the expansion and development investmentsrealised in the Fiume Treste, Minerbio and Settala concessions.9 Cushion gas is the minimum quantity of gas present in or injected into reservoirs during storage, which enables the extractionof the remaining volumes of gas without affecting, over time, the mineral characteristics of the reservoirs themselves.<strong>Snam</strong> <strong>Annual</strong> <strong>Report</strong> <strong>2011</strong>
<strong>Snam</strong> <strong>Annual</strong> <strong>Report</strong> <strong>2011</strong> / Natural gas storage47SHARE OF INVESTMENTS BY INCENTIVE (% of total investments)9%14%13%Maintenance and other13%78%29%22%Increasing capacityDevelopment of new fields65%57%2009 2010 <strong>2011</strong>NATURAL GAS MOVED THROUGH THE STORAGE SYSTEM (billions of m 3 )16.5215.5915.3120092010<strong>2011</strong>8.717.597.537.818.007.78Extraction Injection TotalDecree extending the Fiume Treste storage concessionIn accordance with the Ministerial Decree of 6 June <strong>2011</strong> issued by the Directorate General for Energyand Mineral Resources, the Ministry of Economic Development granted the first ten-year extension ofthe natural gas storage concession at Fiume Treste.The application for extension was submitted by Stogit on 18 September 2009 to the Ministry ofEconomic Development which, in acknowledgement of the correct fulfilment of all obligations derivingfrom the concession, allowed the first ten-year extension envisaged by regulations, and extension willrun from 21 June 2012.<strong>Snam</strong> <strong>Annual</strong> <strong>Report</strong> <strong>2011</strong>
48<strong>Snam</strong> <strong>Annual</strong> <strong>Report</strong> <strong>2011</strong> / Natural gas storageRegulationResolution ARG/gas 119/10 - “Consolidating Act on the regulation of the quality and the tariffs for naturalgas storage services for the <strong>2011</strong>-2014 period (TUSG): approval of part II - Regulation of natural gasstorage service tariffs for the regulatory period <strong>2011</strong>-2014 (RTSG)”, measures on the transitory paymentfor the gas transportation metering service for <strong>2011</strong>.With this resolution, published on 5 August 2010, the Electricity and Gas Authority established thecalculation criteria for the storage tariffs for the third regulatory period (1 January <strong>2011</strong>-31 December2014).The valuation of the net capital invested (RAB) is based on the revalued historic cost method. The returnrate (WACC) of net capital invested is set at a real rate of 6.7% before taxes.The incentives for new investments were confirmed and provide for a higher return compared to thebase rate (WACC), amounting to 4% for a period of eight years for extending existing capacities and fora period of 16 years for developing new fields. The revenues associated with new investments are paidstarting from the second year following the one in which the costs were incurred (“spending”) and areguaranteed regardless of the volumes transported.The method for updating the price cap tariffs is applied to revenue relating to operating costs and isequal to approximately 18% of the revenues in question, which are updated for inflation and decreasedby an annual recovery coefficient set at 0.6% (2% on operating costs and 1.5% on amortisation anddepreciation in the previous regulatory period). The revenue components which are related to returnsand amortisation and depreciation are determined on the basis of the annual update of net capitalinvested (RAB). Specifically, in the third regulatory period, the amortisation is subtracted from the pricecapmechanism.With this resolution, for the purposes of applying the tariffs, the calendar year is taken as a referencerather than the thermal year and the single tariff is confirmed nationally along with the revenueequalisation mechanism.Resolution ARG/gas 202/10 “Approval of company payments and calculation of single payments for storageservices and of transitory payment for the gas transportation metering service for <strong>2011</strong>, implementingResolution ARG/gas 119/10 of the Electricity and Gas Authority of 3 August 2010”.With this resolution, published on 24 November 2010, the Electricity and Gas Authority approved thestorage tariffs and the transitory metering payments for <strong>2011</strong>, established on the basis of a RAB at 31December 2009 equivalent to €3.0 billion with associated revenue of €359.4 million.Resolution ARG/gas 106/11 “Approval of company payments and calculation of single payments for storageservices and of transitory payment for the gas transportation metering service for 2012, implementing theElectricity and Gas Authority Resolutions ARG/gas 119/10 of 3 August 2010 and ARG/gas 29/11 of 23March <strong>2011</strong>”.With this resolution, published on 2 August <strong>2011</strong>, the Electricity and Gas Authority approved the storagetariffs and the transitory metering payments for 2012, established on the basis of a RAB at 31 December2010 equivalent to €3.2 billion with associated revenue of €388.6 million.<strong>Snam</strong> <strong>Annual</strong> <strong>Report</strong> <strong>2011</strong>
Natural gas distribution<strong>Snam</strong> <strong>Annual</strong> <strong>Report</strong> <strong>2011</strong>
50<strong>Snam</strong> <strong>Annual</strong> <strong>Report</strong> <strong>2011</strong> / Natural gas distributionKey performance indicators(€ million) 2009 (*) 2010 <strong>2011</strong> Change Change %Core business revenue (**) 406 1,233 1,297 64 5.2- of which natural gas distribution revenue 394 1,197 1,263 66 5.5Core business revenue net of the effects of IFRIC 12 406 884 937 53 6.0- of which natural gas distribution revenue 394 848 903 55 6.5Operating costs (**) 147 640 633 (7) (1.1)Operating costs net of the effects of IFRIC 12 147 291 273 (18) (6.2)EBIT 203 455 559 104 22.9Investments 334 386 394 8 2.1Net invested capital at 31 December 3,419 3,519 3,589 70 2.0Gas distribution (millions of cubic metres) 7,537 7,953 7,450 (503) (6.3)Distribution network (kilometres) 49,973 50,307 50,301 (6)Active meters (millions) 5.771 5.848 5.897 0.049 0.8Employees in service at 31 December (number) 3,545 3,119 3,005 (114) (3.7)(*) The financial results for the 2009 period were disclosed from 30 June 2009, the date of completion of the operation to acquire Italgas from Eni.(**) Before consolidation adjustments.Financial resultsRevenue from natural gas distribution amounted to €1,263 million in <strong>2011</strong>, an increase of €66 million,equal to 5.5%, compared with 2010. Excluding revenue from the application of IFRIC 12, distributionrevenue recorded an increase of €55 million, or 6.5%. The increase is mainly due to the recognition,by the Electricity and Gas Authority, of higher revenue for natural gas distribution for the 2005-2006to 2007-2008 thermal years (€32 million) 10 and to the impact (20 million) of applying the ‘gradual’mechanism introduced by the Electricity and Gas Authority through Resolution ARG/gas 79/09 11 .EBIT for <strong>2011</strong> amounted to €559 million, an increase of €104 million, or 22.9%, compared with 2010.This increase is essentially attributable to: (i) increased revenue for the natural gas transmission service(+€55 million); (ii) the increase in other revenue and income (+€23 million), mainly following highercapital gains from the sale of plants transferred to municipalities granting the natural gas distributionservice (+€12 million); (iii) lower operating costs (+€18 million) essentially in view of the reduction inexpenses for early retirement incentives (+€17 million); and (iv) lower depreciation, amortisation andimpairment losses (+€10 million) following recovery of value (€9 million) of some assets impaired in2010 (€10 million), partly offset by the increase in depreciation and amortisation in the period.10 For more information please see the section “Regulation - Resolution ARG/gas 119/11”.11 In particular, with this resolution which amended the tariff criteria in effect under prior Resolution 159/08, the Authorityintroduced a gradual increase in the amortised tariff component for the new regulatory period, which is in addition to thatalready provided for returns on invested capital.<strong>Snam</strong> <strong>Annual</strong> <strong>Report</strong> <strong>2011</strong>
<strong>Snam</strong> <strong>Annual</strong> <strong>Report</strong> <strong>2011</strong> / Natural gas distribution51Operating review(€ million) 2009 2010 <strong>2011</strong> Change Change %Distribution 192 237 215 (22) (9.3)Network maintenance and development 158 196 171 (25) (12.8)Replacement of cast-iron pipes (2% incentive) 34 41 44 3 7.3Metering (8% return) 110 112 144 32 28.6Other investments 32 37 35 (2) (5.4)334 386 394 8 2.1Investments in distribution (€215 million) mainly relate to the renovation of sections of pipes byreplacing cast-iron pipes, and extending and upgrading the distribution network.Investments in metering (€144 million) mainly relate to the meter replacement programme andremote meter reading.Other investments (€35 million) mainly relate to investments in IT, property, and other operatingassets.Gas distributionDuring <strong>2011</strong>, 7,450 million cubic metres of gas were distributed, a decrease of 503 million cubic metres,or 6.3%, compared to 2010, mainly due to the milder temperatures recorded during the year.At 31 December <strong>2011</strong>, <strong>Snam</strong> had concessions for gas distribution services in 1,449 municipalities (1,448at 31 December 2010), of which 1,330 were in operation and 119 had to complete and/or create thenetworks. It had 5.897 million active meters at gas redelivery points to end users (households, businesses,etc.), compared with 5.848 million at 31 December 2010.SHARE OF INVESTMENTS BY INCENTIVE(% of total investments)ACTIVE METERS AND VOLUMESOF GAS TRANSPORTED9%5%28%10%7%29%9%37%Other investmentsMetering (8% investment)Replacement of cast-ironpipes (2% incentive)7,5377,9537,45058%54%11%Network maintenanceand development5,7715,8485,89743%Volumes distributed(million m 3 )active meters (thousands)2009 2010 <strong>2011</strong>2009 2010 <strong>2011</strong><strong>Snam</strong> <strong>Annual</strong> <strong>Report</strong> <strong>2011</strong>
52<strong>Snam</strong> <strong>Annual</strong> <strong>Report</strong> <strong>2011</strong> / Natural gas distributionDistribution networkAs at 31 December <strong>2011</strong>, the gas distribution network covered 50,301 kilometres (50,307 kilometres at31 December 2010). The slight reduction of six kilometres is due to the balance between the increasesand decreases in the network. The increases are primarily due to:- winning the tender for the Ussita (MC) concession;- construction of new networks, particularly in Calabria;- extensions of networks to meet commitments deriving from concession contracts.Ministerial Decree to determine the geographical areas in the natural gas distribution sector(“Areas Decree”)The first of four ministerial decrees on natural gas distribution reforms was published in the GazzettaUfficiale on 31 March <strong>2011</strong>.More specifically, the Areas Decree, which was issued by the Ministry of Economic Development incollaboration with the Ministry for Regional Relations and National Cohesion on 19 January <strong>2011</strong>,establishes multi-municipality minimum geographical areas (known as ATEMs) for which new gasdistribution concessions must be assigned.The Decree identifies 177 ATEMs relating to provinces, or divided provinces in the case of the mostpopulous ones or large towns and cities. Several neighbouring ATEMs may combine if they wish to do so.The subsequent Legislative Decree no. 93 of 1 June <strong>2011</strong> established that:- Local Authorities which, on the date the Legislative Decree, published in the Gazzetta Ufficiale of 28June <strong>2011</strong>, came into force, in the case of an open tender, published notices of invitations to tender,or, in the case of restricted tender processes, also asked for letters of invitation, in both cases includingthe definition of the bid evaluation criteria and the redemption value to the outgoing operator andhad not awarded the winning firm, can proceed with entrusting the natural gas distribution servicein accordance with the procedures applicable on the date of the call to tender;- otherwise, starting from that date, the tenders for entrusting the service will be carried out exclusivelyfor the provinces identified by the Areas Decree.Ministerial decree to protect jobs when there is a change of gas distribution operator(“Decree protecting employment levels”)The Decree on employment protection, adopted by the Ministry of Economic Development in conjunctionwith the Ministry of Work and Social Policy on 21 April <strong>2011</strong> and published in the Gazzetta Ufficiale on 4May <strong>2011</strong>, regulates the social effects associated with the granting of new gas distribution concessions.The provision includes the obligation, for the incoming operator, to take on the staff of the outgoingoperator for the running of gas distribution plants and a quota of the staff who carry out territorial andcentral functions.However, in order to avoid opportunistic behaviour by the outgoing operator and obstacles put in theway of operating efficiency, the obligation to hire the staff is limited to a number of employees that isless than a reference value.Ministerial decree for identifying Municipalities which are part of each of the 177multi-municipality minimum geographical areas (“Decree for Determining Municipalitiesfor each Area”)The Decree for determining the Municipalities coming under each Area, adopted by the Ministry forEconomic Development in conjunction with the Ministry for Regional Relations and National Cohesionon 18 October <strong>2011</strong> and published in the Gazzetta Ufficiale on 28 October <strong>2011</strong>, defines the list ofMunicipalities belonging to each geographical area of the natural gas distribution sector.<strong>Snam</strong> <strong>Annual</strong> <strong>Report</strong> <strong>2011</strong>
<strong>Snam</strong> <strong>Annual</strong> <strong>Report</strong> <strong>2011</strong> / Natural gas distribution53Moreover, when supplying the list of Municipalities, in addition to the name of the Area, indicated inAnnex 1 of the Area Decree, the Decree also adds a geographic characterisation, if absent, to facilitateidentification.Ministerial decree for identifying criteria through which area tenders will be held and awarded(“Tender criteria decree”)The Tender criteria decree, adopted by the Ministry of Economic Development in conjunction with theMinistry for Regional Relations and published in the Gazzetta Ufficiale on 27 January 2012, containsinstructions about the requirements for participation, bid evaluation criteria, the compensation figure topay to the outgoing operator, as well as the “type of call to tender”.The amount of payment to holders of concessions and licences, when the transition period set out inLegislative Decree no. 164 of 23 May 2000 expires, will be calculated on the basis of what has beenestablished in the agreements or, if this cannot be done, based on the criteria in Royal Decree no. 2578of 15 October 1925 (industrial value criterion). In the case of a dispute, the outgoing operator will bepaid the higher value between the RAB and the value estimated by the local authority, with possibleadjustments after the dispute has been resolved. The incoming operator will acquire ownership of thesystem by paying the outgoing operator the redemption value, with the exception of any parts ownedby the local municipality.Tenders will be awarded based on the most economically advantageous offer with regard to the followingcriteria:- economic conditions;- safety criteria;- quality of service criteria;- system development plans.Distribution concession in the Municipality of Rome CapitalItalgas manages distribution activities in the Municipality of Rome Capital which, at 31 December 2010,had 1.265 million end users.The related concession expired on 31 December 2009 and on 26 September <strong>2011</strong> the call for tenderswas published for the contracting of the gas distribution service in the Rome Capital area.Italgas appealed to the Lazio Regional Administrative Court against the call to tender, requesting anannulment because it was published after 29 June <strong>2011</strong>, the date defined by Legislative Decree no.93/<strong>2011</strong> as the deadline beyond which tenders for awarding gas distribution services should only be heldat the minimum geographical area level.Later, on 21 November <strong>2011</strong>, the following acts were displayed on the Rome Capital Municipal NoticeBoard containing “Errata corrige and call for tender integration”, “Errata corrige and tender documentsintegration” and “Errata corrige and specifications integration”.However, although these acts introduce amendments and additions, they confirmed the continuationof the tender launched and therefore they have been subject to appeal through reasons added to theoriginal appeal.Italgas appealed to the Council of State against the Lazio Regional Administrative Court ruling ofinadmissibility. The Council of State rejected the appeal on 29 February 2012 and confirmed the order.<strong>Snam</strong> <strong>Annual</strong> <strong>Report</strong> <strong>2011</strong>
54<strong>Snam</strong> <strong>Annual</strong> <strong>Report</strong> <strong>2011</strong> / Natural gas distributionRegulationResolution ARG/gas 159/08 - “Consolidated act on the regulation of the quality and tariffs for naturalgas metering and distribution services for the 2009-2012 regulatory period (TUDG): approval of part II,Tariff regulation for gas distribution and metering services for the 2009-2012 regulatory period (RTDG).Temporary measures for 2009”.With this resolution, published on 17 November 2008 (and subsequent amendments), the Authoritydefined the tariff criteria for the distribution and metering services for the third regulatory period, from1 January 2009 to 31 December 2012. In summary, the resolution provides for:- Recognition of the net capital invested for the site by the adjusted historical cost method and of thenet capital invested with respect to centralised operations (non-industrial buildings and other fixedassets) by the parametric method;- Recognition of the operating costs of distribution operations on a parametric basis and differentiateddepending on company size and density of the customers connected to the network;- Recognition of the operating costs of metering and sales operations using equal parametriccomponents for all companies;- Assessment, at standard cost, starting in <strong>2011</strong>, of all investments on the basis of a price list definedby the Authority (Modern Equivalent Asset Value (MEAV) method, based on the concept of newreplacement cost);- Calculation by the Authority of the reference tariffs for each company, corresponding to the costsrecognised for remunerating net invested capital, amortisation and depreciation, and operating costs;- Subdivision of the national territory into six tariff areas and calculation by the Authority of therespective mandatory tariffs that distributors must apply to users of their own networks;- Introduction of an equalisation mechanism, managed by the Authority through the Cassa ConguaglioSettore Elettrico (Electricity Equalisation fund), to guarantee equivalence between the revenue obtainedby each company by application of the mandatory tariff, which, naturally, does not reflect the specificcosts of each company, and the costs recognised for such company, using the reference tariff.The return rate (WACC) of net capital invested (RAB) is set at a real rate of 7.6% before taxes for thedistribution service and at 8% in real terms before taxes for the metering service.For the new investments relating to the modernisation of the odorisation system in the REMI cabinsand the replacement of the cast-iron pipes with hemp and lead sealed joints, commissioned following31 December 2008, a greater return of 2% over the base rate (WACC) was recognised for a period ofeight years.The method for updating the price cap tariffs is applied to revenue relating to operating costs, whichare indexed to inflation and reduced by a fixed annual productivity return coefficient set at 3.2% foroperating costs relating to distribution and 3.6% for operating costs relating to metering.The revenue components which are related to returns and amortisation and depreciation are determinedon the basis of the annual update of net capital invested (RAB). In particular, in the third regulatoryperiod, the amortisation and depreciation is deducted from the price-cap mechanism and calculated onthe basis of the useful economic and technical life of the distribution infrastructure which is 50 years.Resolution ARG/gas 235/10 – “Updating of mandatory tariffs for <strong>2011</strong> for providing natural gas distributionand metering services and tariff options for gas distribution and metering service other than natural gas bychannelled networks. Start-up of the procedure for re-exercising the power of tariff regulation pursuant tothe orders of the Regional Administrative Court of Lombardy, Sect. III, 11 October 2010, Nos. 6912, 6914,6915 and 6916. Provisions on tariff options for gas distribution and metering service other than natural gasby channelled networks for 2010”.<strong>Snam</strong> <strong>Annual</strong> <strong>Report</strong> <strong>2011</strong>
<strong>Snam</strong> <strong>Annual</strong> <strong>Report</strong> <strong>2011</strong> / Natural gas distribution55With this resolution, published on 16 December 2010, the Authority approved the mandatory tariffsfor <strong>2011</strong> and initiated a procedure to adopt modifications to the regulation in force on the subject ofcalculating tariffs for providing natural gas distribution and metering services and other gases in orderto comply with the orders of the Regional Administrative Court of Lombardy which partially grant theappeals brought by several operators against the Consolidated Act for the regulation of gas distributionand metering tariffs for the 2009-2012 period, approved by Resolution ARG/gas 159/08 and subsequentamendments and modifications.The Authority therefore started a procedure to assess the required modifications to the tariff regulationin force and, in the interim while the procedure is carried out, it has suspended calculation of thereference tariffs for <strong>2011</strong>.The final approval of the reference tariffs for 2009 and 2010 was deferred to a subsequent order.Lastly, the resolution provides for a one year postponement, starting in 2012, of the introduction of theMEAV method for assessing the standard costs of investments for tariff purposes, pending definition ofthe pertinent price list by the Authority.Resolution ARG/gas 119/11 – “Compliance with the decisions of the Council of the State no. 2242/07and no. 2243/07 of 10 May 2007 and of the Lombardy Regional Administrative Court no. 3517/09 andno. 3518/09 of 23 April 2009 regarding the calculation of the constraint on revenues from natural gasdistribution for the companies Napoletanagas S.p.A. and Toscana Energia S.p.A. for the thermal years from2004-2005 to 2007-2008 and closure of the process under Electricity and Gas Authority Resolution 171/05of 2 August 2005 implemented on the application of the company Italgas S.p.A. for the thermal year 2005-2006”.With this resolution, published on 13 September <strong>2011</strong>, the Authority recognised, on the closure ofthe process under Authority Resolution 171/05, as subsequently amended and updated by Resolution44/07, implemented on the application of the company Italgas S.p.A., the adjustment of the distributionrevenues for the thermal years between 2005-2006 and 2007-2008 by a total amount of €26.5 million.With the same decision, in accordance with the Council of State’s decisions 2242/07 and 2243/07 of 10May 2007 and of the Regional Administrative Court of Lombardy’s decisions 3517/09 and 3518/09 of23 April 2009, the Authority granted an adjustment to distribution revenues to the companies ToscanaEnergia S.p.A. and Napoletanagas S.p.A., for the 2004-2005 to 2007-2008 thermal years, restricted tothe Management Component (MC) of the Distribution Revenue Limit (DRL), respectively quantifiedat €5.4 million and €5.6 million. Lastly, the Authority commissioned the Cassa Conguaglio SettoreElettrico (Electricity Equalisation Fund) to liquidate the amounts relating to the applications presentedby the three companies through the gas distribution tariff equalisation account provided for in Article 93of Appendix A of Resolution ARG/gas 159/08.Resolution ARG/gas 195/11 – “Updating of mandatory tariffs for 2012 for providing natural gas distributionand metering services and tariff options for gas distribution and metering service other than natural gas bychannelled networks”.With this resolution, published on 30 December <strong>2011</strong>, the Authority approved the mandatory tariffs forthe year 2012 suspending the calculation of the reference tariffs for 2012, in anticipation of the processfor evaluating the amendments due to the tariff regulation in force implemented by Resolution ARG/gas 235/10.Lastly, the resolution provides for a one year postponement, starting in 2013, of the introduction of theMEAV method for assessing the standard costs of investments for tariff purposes, pending definition ofthe pertinent price list by the Authority.<strong>Snam</strong> <strong>Annual</strong> <strong>Report</strong> <strong>2011</strong>
Financial reviewand other information
Financial review
<strong>Snam</strong> <strong>Annual</strong> <strong>Report</strong> <strong>2011</strong> / Financial review59Income statement(€ million) 2009 (*) 2010 <strong>2011</strong> Change Change %Core business revenue 2,438 3,475 3,539 64 1.8Other revenue and income 30 33 66 33 100.0Total revenue 2,468 3,508 3,605 97 2.8Total revenue net of IFRIC 12 (**) 2,468 3,159 3,245 86 2.7Operating costs (***) (581) (968) (993) (25) 2.6Operating costs net of IFRIC 12 (**) (581) (619) (633) (14) 2.3EBITDA 1,887 2,540 2,612 72 2.8Depreciation, amortisation and impairment losses (613) (678) (654) 24 (3.5)EBIT 1,274 1,862 1,958 96 5.2Net financial expense (217) (271) (313) (42) 15.5Net income from equity investments 22 47 51 4 8.5Profit before taxes 1,079 1,638 1,696 58 3.5Income taxes (347) (532) (906) (374) 70.3Net profit (****) 732 1,106 790 (316) (28.6)Adjusted net profit (****) 732 1,106 978 (128) (11.6)(*) The 2009 results include the impact of consolidating Italgas and Stogit from 30 June 2009, the date the acquisition transaction was completed.(**) The application of international accounting standard IFRIC 12 “Agreements for service concession arrangements”, in force from 1 January 2010, has not had any effect on the consolidatedresults, except for the recording, in equal measure, of revenue and costs related to the construction and expansion of distribution infrastructures (€349 and €360 million, respectively, in2010 and <strong>2011</strong>).(***) Operating costs include the items “Purchases, services and other costs” and “Personnel expense” of the income statement included in the consolidated financial statements.(****) Net profit is attributable to <strong>Snam</strong>.Net profitNet profit achieved in <strong>2011</strong> amounted to €790 million, a decrease of €316 million, equal to 28.6%,compared with 2010. This reduction was due to an increase in income taxes (-€374 million) mainlyfollowing the higher tax charge (€344 million, of which €169 million of higher current taxes and €175million of higher deferred taxes, essentially from the adjustment of deferred tax at 31 December 2010)due to the application of the additional IRES (Robin Hood Tax) to the natural gas transportation anddistribution business segments. The reduction was also affected by increased net financial expenses(-€42 million) essentially following the increased cost of debt (3.1% in <strong>2011</strong> compared with 2.9% in2010) and the higher average debt in the period. These effects were partially offset by the increase inEBIT (+€96 million).The application of the Robin Hood Tax resulted in a significant increase in the consolidated tax rate, equalto 53.4%, including the effect resulting from the one-off adjustment of deferred tax at 31 December2010 (32.5% in 2010).<strong>Snam</strong> <strong>Annual</strong> <strong>Report</strong> <strong>2011</strong>
60<strong>Snam</strong> <strong>Annual</strong> <strong>Report</strong> <strong>2011</strong> / Financial reviewReconciliation of net profit with adjusted net profitThe management of <strong>Snam</strong> evaluates Group performance based on adjusted earnings, obtained byexcluding special items from reported profit.The income components classified as special items exclusively relate to the adjustment of deferredtax at 31 December 2010 for companies operating in the natural gas transportation and distributionbusiness segments, for which, starting from <strong>2011</strong>, an additional IRES of 10.5% is applied for three years(<strong>2011</strong>, 2012 and 2013) before moving to an additional corporate income tax rate of 6.5% in 2014.The adjustment of deferred tax at 31 December 2010 resulted in €188 million of higher income taxes.This cost, classified among the special items, was therefore excluded from the adjusted net profit.Income entries are classified as special items, if material, when: (i) they result from non-recurring eventsor transactions or from events which do not occur frequently in the ordinary course of business; or (ii)they result from events or transactions which are not representative of the normal course of business.The tax rate applied to the items excluded from the calculation of adjusted income is determined on thebasis of the nature of each revenue item subject to exclusion.Adjusted profit is not envisaged by the IFRS or by the US GAAP accounting standards. The managementconsider that this performance metric allows for analysis of the trends of the businesses, yielding bettercomparability of the results.The following table shows the reconciliation of net profit with adjusted net profit.(€ million) 2009 2010 <strong>2011</strong> Change Num. Change %Profit before taxes 1,079 1,638 1,696 58 3.5Income taxes (347) (532) (906) (374) 70.3Tax rate (%) 32.2 32.5 53.4 20.9 64.3- of which Robin Hood Tax total effects (344) (344)<strong>Report</strong>ed net profit 732 1,106 790 (316) (28.6)Excluding Special items:- One-off adjustment of deferred tax at 31.12.2010 188 188Income taxes (*) (347) (532) (718) (186) 35.0Adjusted Tax Rate (%) 32.2 32.5 42.3 9.8 30.2Adjusted net profit 732 1,106 978 (128) (11.6)(*) Excluding special items.Adjusted net profit in <strong>2011</strong>, which excludes special items, amounted to €978 million, a fall of €128million, or 11.6%, compared with 2010. The decrease is due to: (i) higher income taxes (-€186 million)following the application of the additional IRES (-€156 million, of which €169 million in additionalcurrent taxes and €13 million in lower deferred taxes); and (ii) an increase in net financial expenses(-€42 million), attributable to the higher cost of debt and higher average debt for the period. Theseeffects were partially offset by the increase in EBIT (+€96 million).The adjusted tax rate, calculated as the ratio between taxes net of special items and pre-tax profit, was42.3% (32.5% in 2010).<strong>Snam</strong> <strong>Annual</strong> <strong>Report</strong> <strong>2011</strong>
<strong>Snam</strong> <strong>Annual</strong> <strong>Report</strong> <strong>2011</strong> / Financial review61Analysis of income statement itemsTotal revenue(€ million) 2009 2010 <strong>2011</strong> Change Change %Core business revenue 2,438 3,475 3,539 64 1.8Business segmentsTransportation 1,865 1,929 1,945 16 0.8Regasification 36 35 34 (1) (2.9)Storage 161 355 372 17 4.8Distribution 406 1,233 1,297 64 5.2- of which effects of IFRIC 12 349 360 11 3.2Consolidation adjustments (30) (77) (109) (32) 41.6Other revenue and income 30 33 66 33 100.0Total revenue 2,468 3,508 3,605 97 2.8Core business revenue generated in <strong>2011</strong> (€3,539 million) rose by €64 million, 1.8% above the 2010figure and by €53 million, or 1.7%, net of the effects of applying IFRIC 12 (€360 and €349 million, in<strong>2011</strong> and 2010 respectively). The increase is due to the greater revenue recorded in all of the primarysegments of operation.Revenue from transportation 12 (€1,945 million) mainly includes payments for the natural gastransportation service (€1,867 million) and chargebacks to subsidiaries of the costs incurred for providingservices carried out centrally by <strong>Snam</strong> Rete Gas S.p.A. (€62 million).The increase by €16 million is due primarily to the greater chargebacks to subsidiaries of costs for servicesprovided (+€23 million), deriving from the situation where, following the corporate restructuring of theprevious period effective from 1 April 2010, the chargeback of costs for services conducted in 2010 referto the period from 1 April to 31 December. This increase was partly offset by the reduction in revenuefrom transportation (-€6 million) due to the additional revenue (€55 million) recorded in the previousyear, deriving from the recognition by the Electricity and Gas Authority of the additional expensesincurred for the acquisition of fuel gas in the period from 1 October 2008 to 31 December 2009 . Netof this effect, transportation revenue recorded an increase of €49 million, equal to 2.7%, essentiallyattributable to the contribution of investments made in 2009 (+€100 million), whose effects werepartly absorbed by the tariff updating (-€52 million) and by lower volumes of gas transported (-€15million) following a reduced demand for natural gas in Italy. Higher revenue from tariff componentsoffset in costs (+€13 million) also contributed to the increase in transportation revenue.12 Core business revenue by business segment is reported before consolidation adjustments.<strong>Snam</strong> <strong>Annual</strong> <strong>Report</strong> <strong>2011</strong>
62 <strong>Annual</strong> <strong>Report</strong> <strong>2011</strong> / Financial reviewRevenue from transportation (€1,867 million) is analysed below by user with indication of the primaryusers.(€ million) 2009 2010 <strong>2011</strong> Change Change %Eni 934 742 862 120 16.2Enel Trade 245 256 275 19 7.4Other 734 862 965 103 11.9Adjustment of revenue and penalties (47) (17) 47 64Additional fee to cover the greater charges for the purchase of gas 34 55 (55) (100.0)GS Tand RE Tfees as provided for by Resolutions ARG/com 93/10and ARG/gas 177/10 (*) (245) (245)Interruptibility fee as per Resolution 277/07 (42) (23) (35) (12) 52.2Regional network transportation fee as per Resolution 45/07 -Equalisation (10) (2) (2)1,848 1,873 1,867 (6) (0.3)(*) Electricity and Gas Authority Resolutions ARG/com 93/10 and ARG/gas 177/10 introduced, with effect from 1 January <strong>2011</strong>, the accessory tariff components GST and RET, intended tofinance, respectively, the “Account to offset subsidised tariffs for disadvantaged gas customers” (GS Account) and the “Fund for calculating and implementing energy savings and developingrenewable sources in the natural gas sector” (RE Account). Amounts collected from <strong>Snam</strong> Rete Gas are paid to the Electricity Equalisation Fund.Revenue from the regasification segment (€34 million) refers to LNG regasification service (€23 million;€24 million in 2010) done at the Panigaglia (SP) LNG terminal and to the chargebacks of expensesrelating to the natural gas transportation service provided by <strong>Snam</strong> Rete Gas S.p.A. (€11 million; sameamount in 2010).Revenue from natural gas storage segment refers to storage services, (€372 million 13 , of which €303million and €66 million relate to modulation storage and strategic storage respectively). The increase of€17 million for the 2010 period is essentially due to greater storage revenues (+€23 million) followingthe contribution of investments made in 2009 (+€29 million) and the volumes of gas transported (+€6million), whose effects were partly absorbed by the tariff updating (-€15 million).Revenue from the natural gas distribution segment of €1,297 million mainly relates to fees for thenatural gas distribution service (€1,263 million) and revenue pursuant to IFRIC 12 generated by theconstruction and upgrading of distribution infrastructure associated with the concession agreements(€360 million). The increase by €53 million, net of the impact of IFRIC 12, is due primarily to theacknowledgement, by the Electricity and Gas Authority, of the greater natural gas distribution revenuefor the thermal years 2005-2006 to 2007-2008 14 (€32 million) and the impact (20 million) of applyingthe ‘gradual’ mechanism introduced by the Electricity and Gas Authority through Resolution 79/09 of1 June 2009 15 .13 Storage revenue includes revenue from the User balancing service – extra supply point fee – pursuant to the Electricity andGas Authority Resolutions ARG/gas 165/09 and ARG/gas 119/10.14 For further information see the section “Regulation - Resolution ARG/gas 119/11” of this report, for the natural gas distributionbusiness segment.15 In particular, with this resolution which amended the tariff criteria in effect under prior Resolution 159/08, the Authorityintroduced a gradual increase in the amortised tariff component for the new regulatory period, which is in addition to thatalready provided for returns on invested capital.<strong>Snam</strong> <strong>Annual</strong> <strong>Report</strong> <strong>2011</strong>
<strong>Annual</strong> <strong>Report</strong> <strong>2011</strong> / Financial review63Revenue - Regulated and non-regulated activities(€ million) 2009 2010 <strong>2011</strong> Change Change %Regulated business revenue 2,423 3,442 3,522 80 2.3Transportation 1,848 1,873 1,870 (3) (0.2)Regasification 21 24 23 (1) (4.2)Storage 147 326 338 12 3.7Distribution 407 1,219 1,291 72 5.9- of which effects of IFRIC 12 349 360 11 3.2Revenue from non-regulated activities 45 66 83 17 25.82,468 3,508 3,605 97 2.8Regulated business revenue (€3,522 million, net of consolidation adjustments) relates to transportation(€1,870 million), distribution (€1,291 million; €931 million net of the effects of IFRIC 12), storage(€338 million) and regasification (€23 million).Revenue from non-regulated activities (€83 million, net of consolidation adjustments) mainlycomprises: (i) technical services (€26 million) relating essentially to the natural gas distributionbusiness segment; (ii) capital gains on transfers of assets (€17 million); (iii) income from the leasing andmaintenance of fibre-optic telecommunications cables (€10 million); and (iv) income from resolvingcontractual disputes (€10 million) 16 ; and (vi) income from property investments (€5 million).Operating costs(€ million) 2009 2010 <strong>2011</strong> Change Change %Business segmentsTransportation 399 343 387 44 12.8Regasification 27 24 23 (1) (4.2)Storage 38 63 64 1 1.6Distribution 147 640 633 (7) (1.1)- of which effects of IFRIC 12 349 360 11 3.2Consolidation adjustments (30) (102) (114) (12) 11.8581 968 993 25 2.6Operating costs (€993 million) increased by €25 million, equal to 2.6%, compared with 2010.Excluding the effects of applying IFRIC 12, operating costs are increased by €14 million compared with2010, equal to 2.3%.16 For more information see Note 28 “Guarantees, commitments and risks”, in the Notes to the consolidated financial statements.<strong>Snam</strong> <strong>Annual</strong> <strong>Report</strong> <strong>2011</strong>
64 <strong>Annual</strong> <strong>Report</strong> <strong>2011</strong> / Financial reviewOperating costs – Regulated and non-regulated activities(€ million) 2009 2010 <strong>2011</strong> Change Change %Regulated business costs 567 942 967 25 3Controllable fixed costs 352 465 456 (9) (1.9)Variable costs 117 19 18 (1) (5.3)Other costs 98 458 493 35 7.6- of which effects of IFRIC 12 349 360 11 3.2Non-regulated business costs 14 26 26581 968 993 25 2.6Regulated business operating costsControllable fixed costs 17 amounted to €456 million, a reduction of €9 million, or 1.9%, compared to2010 18 as a result of efficiency measures taken, which have allowed the target of approximately €80million in savings, compared to 2008 in real terms and on the same business perimeter, to be achievedone year ahead of schedule.Other costs, of €493 million, mainly consist of the costs of construction and upgrading of distributioninfrastructures (€360 million), entered pursuant to IFRIC 12, and expenses offset in income primarilyrelating to connection costs (€47 million). Net of the effects of IFRIC 12, other costs amounted to €133million, up €24 million, equal to 22%, from 2010 due primarily to the greater expenses for legal disputes(€30 million).The following table shows the workforce in service at 31 December <strong>2011</strong> (6,112 people) by businesssegment and professional status:(number) 2009 2010 <strong>2011</strong> Change Change %Business segmentsTransportation 2,254 2,636 2,755 119 4.5Regasification 87 70 74 4 5.7Storage 301 279 278 (1) (0.4)Distribution 3,545 3,119 3,005 (114) (3.7)6,187 6,104 6,112 8 0.1(number) 2009 2010 <strong>2011</strong> Change Change %Professional statusExecutives 121 116 118 2 1.7Managers 493 508 544 36 7.1Office workers 3,320 3,243 3,277 34 1.0Manual workers 2,253 2,237 2,173 (64) (2.9)6,187 6,104 6,112 8 0.117 Please refer to the “Glossary” in this report for the definition of controllable fixed costs.18 The reduction was €42 million compared with the combined 2008 controllable fixed costs (€458 million).<strong>Snam</strong> <strong>Annual</strong> <strong>Report</strong> <strong>2011</strong>
<strong>Annual</strong> <strong>Report</strong> <strong>2011</strong> / Financial review65Depreciation, amortisation and impairment losses(€ million) 2009 2010 <strong>2011</strong> Change Change %Depreciation 613 668 663 (5) (0.7)Business segmentsTransportation 499 430 435 5 1.2Regasification 4 4 5 1 25.0Storage 35 76 56 (20) (26.3)Distribution 75 158 167 9 5.7Impairment losses (Recovery of value) 10 (9) (19) (190.0)613 678 654 (24) (3.5)Depreciation, amortisation and impairment losses (€654 million) fell by €24 million compared with2010, due to: (i) lower amortisation and depreciation recorded in the storage segment (-€20 million)on the estimated (discounted) costs of dismantling storage sites 19 , and is attributable to the adjustment,as of 1 January <strong>2011</strong> with prospective effect, of the timing of expenditure relating to the dismantlingand restoration of the sites; (ii) the recovery of value (€9 million) on some impaired assets in thedistribution segment (€10 million) in 2010. These factors were partially offset by higher amortisationand depreciation in the natural gas transportation (+€5 million) and distribution (+€9 million) segments,due mainly to the entry into service of new infrastructure.EBit(€ million) 2009 2010 <strong>2011</strong> Change Change %Business segmentsTransportation 974 1,185 1,137 (48) (4.1)Regasification 5 7 7Storage 92 218 255 37 17.0Distribution 203 455 559 104 22.9Elimination of profit on stock (3) 3 (100.0)1,274 1,862 1,958 96 5.219 The current value of such costs is initially capitalised together with the cost of related activities as a counter-entry to specificprovisions. It is charged to the income statement through amortisation.<strong>Snam</strong> <strong>Annual</strong> <strong>Report</strong> <strong>2011</strong>
66 <strong>Annual</strong> <strong>Report</strong> <strong>2011</strong> / Financial reviewEBIT in 2010 amounted to €1,958 million, an increase of €96 million, or 5.2%, compared with 2010.The increase is due primarily to the performances recorded by the following segments:- Distribution (+€104 million; +22.9%). This increase was due mainly to: (i) increased revenuethrough the natural gas transmission service (+€55 million); (ii) the increase in other revenue andincome (+€23 million), mainly following higher capital gains from the sale of plants transferred tomunicipalities granting the natural gas distribution service (+€12 million); (iii) lower operating costs(+€18 million, net of the effects of IFRIC 12) essentially due to the reduction in expenses for earlyretirement incentives (+€17 million); and (iv) lower depreciation, amortisation and impairmentlosses (+€10 million) following recovery of value (€9 million) of some impaired assets in 2010 (€10million), partly offset by the increase in depreciation and amortisation in the period;- Natural gas storage (+€37 million; +17.0%). This increase was mainly due to increased storagerevenue (+€23 million), the operating efficiency, and the reduction in depreciation and amortisation(+€20 million) on discounted estimated costs to be incurred when the storage sites are dismantled.These effects are partly absorbed by less income (-€3 million, net of the cost of gas sold) from thesale, in 2010, of some strategic gas no longer required for the provision of storage services;- Transportation (-€48 million; -4.1%). This reduction was mainly due to: (i) the increase in operatingcosts (-€27 million, net of the components offset in revenue), essentially following increasedexpenses for legal disputes (-€37 million) due to provisions for risks (€9 million) in view of userecorded in the previous financial year (€10 million), and the unfavourable outcome of disputesconcluded during the year (-€18 million); and (ii) lower transportation revenue (-€19 million net ofcomponents which were offset in costs).ROI was 11.8% (11.7% in 2010).Net financial expense(€ million) 2009 2010 <strong>2011</strong> Change Change %Financial expense related to net financial debt 166 188 262 74 39.4- Charges on short- and long-term financial debt 166 188 262 74 39.4Loses (Gains) on derivative contracts 66 102 69 (33) (32.4)- Adjustment to fair value 2- Difference in interest accrued in the period 64 102 69 (33) (32.4)Other net financial expense 9 18 19 1 5.6- Accretion discount 11 15 12 (3) (20.0)- Other net financial (income) expense (2) 3 7 4 133.3Financial expense capitalised (24) (37) (37)217 271 313 42 15.5Net financial expense (€313 million) increased by €42 million compared with 2010, following thehigher cost of borrowing, which went from 2.9% in 2010 to 3.1% in <strong>2011</strong>, and the higher average debtfor the period.Financial expense of €37 million was capitalised in <strong>2011</strong> (same amount in 2010).<strong>Snam</strong> <strong>Annual</strong> <strong>Report</strong> <strong>2011</strong>
<strong>Annual</strong> <strong>Report</strong> <strong>2011</strong> / Financial review67Net income from equity investmentsThe table below illustrates net income from equity investments (€51 million):(€ million) 2009 2010 <strong>2011</strong> Change Change %Equity method valuation effect 21 47 45 (2) (4.3)Capital gains from sale of equity investments 3 4 4Net other income (expense) (2) 2 222 47 51 4 8.5Net income from equity investments (€51 million) comprised: (i) the share of the net results for theperiod of equity-accounted investments in the natural gas distribution segment (€45 million) primarilyrelated to the associates Azienda Energia e Servizi Torino S.p.A. (€24 million) and Toscana Energia S.p.A.(€15 million); and (ii) the capital gain (€4 million) from the transfer of 34.67% of the Italgas holding inAcqua Campania S.p.A.Income taxes(€ million) 2009 2010 <strong>2011</strong> Change % change %Current taxes 402 616 786 170 27.6(Prepaid) deferred taxesDeferred taxes (44) (74) (79) (5) 6.8Prepaid taxes (11) (10) 11 21(55) (84) (68) 16 (19.0)Deferred tax adjustment at 31.12.2010 (special item) 188 188Tax rate (%) 32.2 32.5 53.4 20,9 64.3347 532 906 374 70.3Income taxes (€906 million) rose by €374 million, or 70.3%, compared with 2010, owing mainly tohigher expenses from applying the Robin Hood Tax to the natural gas distribution and transportationsegments (€344 million, of which €169 million in higher current taxes and €175 million in higherdeferred taxes, owing mainly to the deferred tax adjustment at 31 December 2010).The tax rate was 53.4%. The difference between the effective tax rate (53.4%) and the theoretical taxrate (33.0%), equal to 20.4 percentage points, is due mainly to the effects of applying additional IRESto the natural gas distribution and transportation segments (+20.3%), and to the increased impact ofregional production tax (IRAP) rates applied in certain regions above the normal rate (+0.6%), offsetpartially by the effects of valuing equity investments using the equity method (-0.7%).The adjusted tax rate, calculated as the ratio between taxes for the year net of special items and pre-taxprofit, was 42.3% (32.5% in 2010).<strong>Snam</strong> <strong>Annual</strong> <strong>Report</strong> <strong>2011</strong>
68 <strong>Annual</strong> <strong>Report</strong> <strong>2011</strong> / Financial reviewReclassified consolidated balance sheetThe reclassified consolidated balance sheet combines the assets and liabilities of the compulsory formatincluded in the annual report and the half-year report based on how the business operates, usually splitinto the three basic functions: investment, operations and financing.Management believes that this format presents useful additional information for investors as it allowsidentification of the sources of financing (equity and third-party funds) and the application of suchfunds for fixed and working capital.Management uses the reclassified consolidated balance sheet to calculate the key profitability ratios(ROI and ROE).Reclassified consolidated balance sheet (*)(€ million) 31.12.2010 31.12.<strong>2011</strong> ChangeFixed capital 17,972 18,778 806Property, plant and equipment (**) 13,533 14,053 520Compulsory inventories 405 405Intangible assets 4,262 4,444 182Equity investments 319 319Financial receivables held for operations 2 2Net payables for investments (549) (445) 104Net working capital (**) (1,625) (1,698) (73)Provisions for employee benefits (105) (107) (2)Assets held for sale and directly related liabilities 15 16 1NET INVESTED CAPITAL 16,257 16,989 732Shareholders’ equity (including minority interests)- attributable to <strong>Snam</strong> 5,915 5,791 (124)- attributable to minority interests 1 15,916 5,792 (124)Net financial debt 10,341 11,197 856COVERAGE 16,257 16,989 732(*) Please see the paragraph below for the reconciliation of the reclassified consolidated balance sheets with the legally-required format.(**) The pseudo-working gas present in the storage fields that can no longer be supplied to users is classified under the item “Property, plant and equipment”. The corresponding value at 31December 2010 (€294 million) was reclassified from “Net working capital” to “Fixed capital – Property, plant and equipment”.Fixed capital (€18,778 million) rose by €806 million compared with 31 December 2010, owingessentially to the change in property, plant and equipment (+€520 million) and intangible assets(+€182 million), as well as to the reduction in net debt from investment activities (+€104 million).<strong>Snam</strong> <strong>Annual</strong> <strong>Report</strong> <strong>2011</strong>
<strong>Annual</strong> <strong>Report</strong> <strong>2011</strong> / Financial review69As of <strong>2011</strong>, “Property, plant and equipment” includes pseudo-working gas 20 which, following technicalstudies conducted together with the Ministry for Economic Development (MSE), can no longer besupplied and reinjected in an annual storage cycle without incurring stability risks for the plants, with anequivalent value of €294 million, corresponding to 3,632 million cubic metres.Changes in property, plant and equipment and intangible assets (+€702 million) are analysed below:(€ million)Property,plant andequipmentIntangibleassetsTotalBalance at 31 December 2010 (*) 13,533 4,262 17,795Investments 1,152 433 1,585Depreciation, amortisation and impairment losses (487) (167) (654)Transfers, eliminations and divestments (18) (37) (55)Other changes (127) (47) (174)Balance at 31 December <strong>2011</strong> 14,053 4,444 18,497(*) Includes the reclassification of the pseudo-working gas present in the storage plants.Other changes (-€174 million) relate essentially to: (i) the impact of adjusting the timing of expenditurerelating to estimated charges for storage site dismantling and restoration in line with the maximumduration of the concessions (-€135 million); and (ii) grants for the period (-€70 million). The effects ofthese changes have partly been offset by the change in stock of pipes and related accessory materialspurchased for investment purposes and not yet used in the construction of facilities (+€21 million).Investments(€ million) 2010 <strong>2011</strong>Business segmentsTransportation 902 892Regasification 3 3Storage 252 296Distribution 386 394Elimination of profit on stock (3)Investments 1,540 1,585Investments in <strong>2011</strong>, totalling €1,585 million 21 (€1,540 million in 2010), relate to the natural gastransportation (€892 million), distribution (€394 million), storage (€296 million) and regasification(€3 million) business segments.20 Working gas can be categorised into: (i) “Working gas that can be supplied”, which is the gas that is injected cyclically and supplied from the storage fieldduring the course of the storage cycle, i.e. gas which can be made available and reintegrated to be used for the purposes of storage service provision;and (ii) “Pseudo-working gas”, which is the gas in storage that can be likened to cushion gas because it is functional for the use of working gas that canbe supplied and is not subject to allocation to users.21 Analysis of the investments made by each business segment can be found in the “Business segment operating performance” section of this <strong>Report</strong>.<strong>Snam</strong> <strong>Annual</strong> <strong>Report</strong> <strong>2011</strong>
70 <strong>Annual</strong> <strong>Report</strong> <strong>2011</strong> / Financial reviewCompulsory inventoriesCompulsory inventories, at €405 million (unchanged from 31 December 2010), consist of theminimum quantities of natural gas that the storage companies are obliged to hold pursuant toPresidential Decree no. 22 of 31 January 2001. The inventories correspond to approximately 5 billionstandard cubic metres of natural gas, and the total quantity is determined annually by the Ministry ofEconomic Development.Equity investmentsThe item equity investments (€319 million) includes the valuation of equity investments using theequity method and refers in particular to the companies Toscana Energia S.p.A. (€155 million), AziendaEnergia e Servizi Torino S.p.A. (€108 million) and ACAM Gas S.p.A. (€48 million).Net working capital(€ million) 31.12.2010 31.12.<strong>2011</strong> ChangeTrade receivables 777 1,367 590Inventories (*) 147 235 88Tax receivables 18 47 29Other assets 98 133 35Deferred tax liabilities (853) (901) (48)Trade payables (468) (556) (88)Provisions for risks and charges (629) (527) 102Prepaid income from regulated activities (352) (358) (6)Derivatives (74) (266) (192)Tax payables (115) (230) (115)Other liabilities (174) (642) (468)(1,625) (1,698) (73)(*) Includes the reclassification of the pseudo-working gas present in the storage plants from “Inventories” to “Property, plant and equipment”.Net working capital (-€1,698 million) decreased by €73 million compared with 2010, owing mainly to:(i) the increase in other liabilities (-€468 million), due mainly to the effects of the failed reintegration,under the terms established by the storage code, of the strategic gas used by shippers 22 (-€296 million),to the higher charges from the Electricity Equalisation Fund relating essentially to the repayment ofaccessory tariffs for the transportation segment (-€107 million), and to the effects of returning tousers of the transportation service the gas granted by them in kind (-€53 million) 23 ; (ii) the reductionin the fair value of the derivative financial instruments (-€192 million), due essentially to the expected22 The present regulatory and legislative framework (see Resolution ARG/gas 119/10, Article 10, Paragraph 5 in Appendix A)leaves the storage company in a neutral position with regard to the effects of applying the fees for replenishing strategic gasreserves, providing for the distribution to users of the benefits/costs of applying the gas replenishment fees after use by theusers. The income from the use of strategic gas by the users has therefore been removed from the income statement, witha counter-entry made under “Other liabilities”.23 Resolution ARG/gas 184/09 of the Electricity and Gas Authority defined the method of payment in kind, by users of theservice to the leading transportation company, of the quantities of gas covering fuel gas, network losses and Unaccounted-For Gas (UFG). Specifically, this resolution provided: (i) for fuel gas, for the introduction of an adjustment mechanism fordifferences between the quantities allocated and effective consumption; (ii) for network losses, for the introduction of anadjustment mechanism for the difference between the estimated quantities to be allocated according to the Electricityand Gas Authority and the actual quantities allocated; and (iii) for Unaccounted-For Gas (UFG), to allocate the differencesbetween the quantities allocated from users and the actual consumption to the leading transportation company.<strong>Snam</strong> <strong>Annual</strong> <strong>Report</strong> <strong>2011</strong>
<strong>Annual</strong> <strong>Report</strong> <strong>2011</strong> / Financial review71reduction in market interest rates; and (iii) the increase in tax liabilities (-€115 million), owing mainlyto the application of the additional IRES (Robin Hood Tax) for companies operating in the natural gastransportation and distribution business segments (-€169 million).These factors were partly offset by: (i) the increase in trade receivables (+€590 million) relating to thenatural gas storage business segment (+€470 million), owing mainly to receivables from the use byshippers of the strategic gas not replenished under the terms established by the storage code, and to thenatural gas transportation segment (+€113 million), owing essentially to receivables from the balancingservice 24 ; and (ii) the reduction in the provisions for risks and charges (+€102 million), due mainly to adecrease in provisions for dismantling and restoring storage sites (+€125 million).Asset held for sale and directly related liabilitiesAssets held for sale and directly related liabilities relate to property owned by Italgas (€15 million,net of environmental provisions for charges relating to restoration work on the property) for whichnegotiations for a sale to Eni are ongoing 25 .Statement of comprehensive income(€ million) 2010 <strong>2011</strong>Net profit 1,106 790Other components of comprehensive incomeChange in fair value of cash flow hedge derivatives (effective share) 4 (194)Tax effects of the other components of comprehensive income (*) (1) 73Total other components of comprehensive income, net of tax effect 3 (121)Total comprehensive income 1,109 669attributable to:- <strong>Snam</strong> 1,109 669- Minority interests1,109 669(*) Includes the effects (€20 million) of adjusting prepaid IRES tax following application of the Robin Hood Tax.24 In application of Resolution ARG/gas no. 45/11 of the Electricity and Gas Authority, from 1 December <strong>2011</strong>, the leadingnatural gas transportation company (<strong>Snam</strong> Rete Gas S.p.A.) takes responsibility for the overall balancing of the natural gastransportation system, procures the necessary storage resources for covering imbalances for individual users and adjusts thebalance of income statement entries.25 For information on commitments made by the parties, see Note 28 “Guarantees, commitments and risks - Commitmentsderiving from the agreement to purchase Italgas and Stogit from Eni” in the Notes to the consolidated financial statements.<strong>Snam</strong> <strong>Annual</strong> <strong>Report</strong> <strong>2011</strong>
72 <strong>Annual</strong> <strong>Report</strong> <strong>2011</strong> / Financial reviewShareholders’ equity(€ million)Shareholders’ equity at 31 December 2010 5,916Increases owing to:- Comprehensive income for <strong>2011</strong> 669- Other changes 20689Decreases owing to:- Distribution of balance of 2010 dividend (473)- Distribution of interim <strong>2011</strong> dividend (338)- Other changes (2)(813)Shareholders’ equity including minority interests at 31 December <strong>2011</strong> 5,792attributable to:- <strong>Snam</strong> 5,791- Minority interests 15,792Other changes (+€18 million) relate essentially to: (i) the equity adjustment to <strong>Snam</strong> as a result of thepurchase agreements with Eni for Italgas and Stogit (+€12 million); and (ii) the exercise of 1,986,600stock option plans by <strong>Snam</strong> managers (+€7 million).At 31 December <strong>2011</strong>, <strong>Snam</strong> Rete Gas had 192,553,051 treasury shares 26 (compared with 194,184,651at 31 December 2010), equal to 5.39% of the share capital. Their market value at 31 December <strong>2011</strong>was €653 million 27 .Information about the individual equity items and changes therein compared with 31 December 2010 isgiven in Note 27 to the consolidated financial statements, “Shareholders’ Equity”.26 Information on treasury shares held at 31 December <strong>2011</strong> can be found in the “Other information - Treasury shares held bythe Company and by subsidiaries” section of this <strong>Report</strong>.27 Calculated by multiplying the number of treasury shares by the year-end official price of €3.39 per share.<strong>Snam</strong> <strong>Annual</strong> <strong>Report</strong> <strong>2011</strong>
<strong>Annual</strong> <strong>Report</strong> <strong>2011</strong> / Financial review73Reconciliation between the separate net income and shareholders’ equity of <strong>Snam</strong> Rete Gas S.p.A.and consolidated net income and shareholders’ equityNet incomeShareholders’ equity(€ million) 2010 <strong>2011</strong> 31.12.2010 31.12.<strong>2011</strong>Individual financial statements of <strong>Snam</strong> Rete Gas S.p.A. 902 693 7,204 6,999Net income for the year of companies included in the scope of consolidation 476 426Difference between the book value of equity investments in consolidatedcompanies and the shareholders’ equity on the individual financial statements,including the net result for the period (1,282) (1,205)Consolidation adjustments for:- Valuation of equity investments using the equity method 13 3 5 6- Elimination of intragroup profit on stock and other minor adjustments,net of tax effect (285) (332) (12) (9)(272) (329) (7) (3)Minority interests 1 1Consolidated financial statements 1,106 790 5,916 5,792Net financial debt(€ million) 31.12.2010 31.12.<strong>2011</strong> ChangeFinancial liabilities 10,350 11,199 849Short-term financial liabilities 1,844 2,787 943Current share of long-term financial liabilities 1,320 1,612 292Long-term financial liabilities 7,186 6,800 (386)Financial receivables and cash and cash equivalents (9) (2) 7Financial receivables not held for operations (1) 1Cash and cash equivalents (8) (2) 610,341 11,197 856Net financial debt was €11,197 million, compared with €10,341 million at 31 December 2010. The cashflow from operating activities (+€1,537 million) and the income from the exercise of 1,986,600 stockoptions (+€7 million) enabled <strong>Snam</strong> to cover almost all its net investment expense (-€1,589 million).The increase in net financial debt, after payment of the dividend balance for the year 2010 of €0.14 pershare, paid from 26 May <strong>2011</strong> onwards (-€473 million), and of the interim dividend for the year <strong>2011</strong>of €0.10 per share, paid from 27 October <strong>2011</strong> onwards (-€338 million), came to €856 million.Long-term financial liabilities of €6,800 million made up approximately 61% of financial debt (comparedwith 69% at 31 December 2010) and had an average duration of slightly over four years (compared withapproximately four years at 31 December 2010).All financial liabilities are owing to Eni 28 and denominated in Euros.28 Information on financial payables to the ultimate parent, Eni S.p.A., can be found in Note 22 “Long-term financial liabilitiesand short-term portions of long-term financial liabilities” of the Notes to the consolidated financial statements.<strong>Snam</strong> <strong>Annual</strong> <strong>Report</strong> <strong>2011</strong>
74 <strong>Annual</strong> <strong>Report</strong> <strong>2011</strong> / Financial reviewDecree Law no. 1 of 20 January 2012 was published in the Gazzetta Ufficiale of 24 January 2012authorising “Urgent arrangements for competition, development of infrastructure and competitiveness”.Specifically, Article 15 “Arrangements on ownership unbundling” established that the Prime-MinisterialDecree pursuant to Article 1, paragraph 905 of Law no. 296 of 27 December 2006, relating to theimplementation of ownership unbundling between Eni and <strong>Snam</strong>, shall be issued within six months ofthe above-mentioned Decree Law coming into force.In the case of a change of control at <strong>Snam</strong> by Eni S.p.A., existing agreements between the companiesgive Eni S.p.A. the right to extinguish the credit lines granted early. At present, <strong>Snam</strong> believes that cashflows from operations and its current financial and capital structure can reasonably allow access to awide range of financing from the capital markets and banks. However, there are no guarantees that<strong>Snam</strong> would be capable of obtaining loans and financing from other sources under the same conditionsas current ones.The breakdown of debt by type of interest rate at 31 December <strong>2011</strong> is as follows:(€ million) 31.12.2010 % 31.12.<strong>2011</strong> % ChangeFloating rate 2,144 21 2,587 23 443Fixed rate 8,206 79 8,612 77 40610,350 100 11,199 100 849Floating-rate financial liabilities (€2,587 million) increased by €443 million compared with 31 December2010 as a result of higher short-term floating rate debt.Fixed-rate financial liabilities were €8,612 million, up by €406 million compared with 31 December2010, essentially as a result of the balance between loans taken out (+€1,700 million) and repayments(-€1,300 million) in the period. Specifically, the loans taken out refer to: (i) two fixed-rate loans of €400million and €300 million; and (ii) three floating-rate loans of €200 million, €300 million and €500million, converted into fixed-rate loans by three interest rate swaps (IRS) derivative contracts.Fixed-rate financial liabilities at 31 December <strong>2011</strong> included 19 floating-rate loans converted into fixedrate loans through interest rate swaps for an overall notional amount of €6,435 million.There were no breaches of loan agreements at the reporting date.Covenants<strong>Snam</strong> has entered into a €300 million loan agreement with Eni funded by the European InvestmentBank (EIB), which is based on Eni maintaining a minimum rating. This condition has been met.<strong>Snam</strong> <strong>Annual</strong> <strong>Report</strong> <strong>2011</strong>
<strong>Annual</strong> <strong>Report</strong> <strong>2011</strong> / Financial review75Reclassified consolidated statement of cash flowsThe reclassified consolidated statement of cash flows set out below summarises the legally requiredformat. It shows the opening and closing cash and cash equivalents and the change in net financial debtduring the period. The two statements are reconciled through the free cash flow, i.e. the cash surplus ordeficit left over after servicing capital expenditure. The free cash flow closes either: (i) with the change incash for the period, after adding/deducting all cash flows related to financial liabilities/assets (taking out/repaying financial receivables/payables) and equity (payment of dividends/capital injections); or (ii) withthe change in net financial debt for the period, after adding/deducting the debt flows related to equity(payment of dividends/capital injections).Reclassified consolidated statement of cash flows (*)(€ million) 2009 2010 <strong>2011</strong>Net profit 732 1,106 790Adjusted by:- Amortisation, depreciation and other non-monetary components 595 630 611- Net capital losses on asset sales and eliminations 6 8 6- Dividends, interest and income taxes 550 788 1,205Change in working capital due to operating activities (117) 34 (122)Dividends, interest and income taxes collected (paid) (602) (791) (953)Net cash flows from operating activities 1,164 1,775 1,537Investments (1,221) (1,422) (1,576)Equity investments (1)Change in consolidation scope and business units (4,478) (137) 10Divestments 30 14 52Other changes relating to investment activities 16 152 (74)Free cash flow (4,489) 382 (52)Changes in short- and long-term financial debt 1,530 364 849Equity cash flows 2,995 (774) (804)Other changes relating to divestment activities 1Net cash flow for the period 36 (28) (6)(*) Please see the paragraph below for the reconciliation of the reclassified consolidated statement of cash flows with the legally-required formats.Change in net financial debt(€ million) 2009 2010 <strong>2011</strong>Free cash flow (4,489) 382 (52)Financial payables and receivables from acquired companies (2,219)Equity cash flows 2,995 (774) (804)Change in net financial debt (3,713) (392) (856)<strong>Snam</strong> <strong>Annual</strong> <strong>Report</strong> <strong>2011</strong>
76 <strong>Annual</strong> <strong>Report</strong> <strong>2011</strong> / Financial reviewReconciliation of the reclassified consolidated financial statements with the legally - required formatsReclassified consolidated balance sheet(€ million)Reclassified consolidated balance sheet items 31.12.2010 31.12.<strong>2011</strong>(Where not expressly stated, the component is takenReference to notes Partial amount Amount from Partial amount Amount fromto consolidated from legally reclassified from legally reclassifieddirectly from the legally required format)financial statements required format format required format formatFixed capitalProperty, plant and equipment (*) 13.533 14.053Compulsory inventories 405 405Intangible assets 4.262 4.444Equity investments 319 319Financial receivables held for operations (see note 7) 2 2Net payables for investments, consisting of: (549) (445)- Payables for investments (see note 18) (627) (486)- Receivables for investments/divestments (see note 7) 78 41Total fixed capital 17.972 18.778Net working capitalTrade receivables (see note 7) 777 1.367Inventories (*) 147 235Tax receivables, consisting of: 18 47- Current income tax assets 3- Other current tax assets 4 5- IRES receivables for national tax consolidation scheme (see note 7) 10 35- Group VAT receivables (see note 7) 4 4Trade payables (see note 18) (468) (556)Tax payables, consisting of: (115) (230)- Current income tax liabilities (11) (175)- Other current tax liabilities (20) (16)- IRES payables for national tax consolidation scheme (see note 18) (69) (19)- Group VAT payables (see note 18) (15) (20)Deferred tax liabilities (853) (901)Provisions for risks and charges (629) (527)Derivatives (see notes 15, 21, 26) (74) (266)Other assets, consisting of: 98 133- Other receivables (see note 7) 73 96- Other current assets (see note 10) 8 22- Other non-current assets (see note 15) 17 15Accruals and deferrals from regulated activities, consisting of: (352) (358)- Accrued income from regulated activities (see notes 10, 15) 80 77- Prepaid income from regulated activities (see notes 21, 26) (432) (435)Other liabilities, consisting of: (174) (642)- Other payables (see note 18) (143) (263)- Other current liabilities (see note 21) (4) (4)- Other non-current liabilities (see note 26) (27) (375)Total net working capital (1.625) (1.698)Provisions for employee benefits (105) (107)Assets held for sale and directly related liabilities consisting of: 15 16- Assets held for sale (see note 16) 25 25- Liabilities directly associated with assets held for sale (see note 16) (10) (9)NET INVESTED CAPITAL 16.257 16.989Shareholders’ equity including minority interests 5.916 5.792Net financial debtFinancial liabilities, consisting of: 10.350 11.199- Long-term financial liabilities 7.186 6.800- Current share of long-term financial liabilities 1.320 1.612- Short-term financial liabilities 1.844 2.787Financial receivables, cash and cash equivalents, consisting of: (9) (2)- Other financial assets (1)- Cash and cash equivalents (8) (2)Total net financial debt 10.341 11.197COVERAGE 16.257 16.989(*) The pseudo-working gas present in the storage fields that can no longer be supplied to users is classified under the item “Property, plant and equipment”. The corresponding amount at 31December 2010 was reclassified from “Inventories” to “Property, plant and equipment”.<strong>Snam</strong> <strong>Annual</strong> <strong>Report</strong> <strong>2011</strong>
<strong>Annual</strong> <strong>Report</strong> <strong>2011</strong> / Financial review77Reclassified consolidated statement of cash flows(€ million) 2010 <strong>2011</strong>Partial amount Amount from Partial amount Amount fromItems from the reclassified statement of cash flows and reconciliationfrom legally reclassified from legally reclassifiedwith the legally required formatrequired format format required format formatNet profit 1.106 790Adjusted by:Amortisation, depreciation and other non-monetary components: 630 611- Amortisation and depreciation 668 663- Net impairment losses (Recovery of value) 10 (9)- Equity method valuation effect (47) (45)- Change in provisions for employee benefits (1) 2- Other changesNet capital losses on asset sales and eliminations 8 6Interest, income taxes and other changes: 788 1.205- Dividends (2)- Interest income (4) (3)- Interest expense 260 304- Income taxes 532 906Changes in working capital due to operating activities: 34 (122)- Inventories (7) (22)- Trade receivables (39) (590)- Trade payables (3) 88- Change in provisions for risks and charges 18 8- Other assets and liabilities 65 394Dividends, interest and income taxes collected (paid): (791) (953)- Dividends collected 34 44- Interest collected 4 5- Interest paid (258) (305)- Income taxes (paid) received (571) (697)Net cash flows from operating activities 1.775 1.537Investments: (1.422) (1.576)- Property, plant and equipment (1.056) (1.160)- Intangible assets (366) (416)Investments in companies joining the scope of consolidation and business units: (137) 10Equity investments (1)Divestments: 14 52- Property, plant and equipment 4 1- Intangible assets 10 44- Equity investments 7Other changes relating to investment activities: 152 (74)- Change in net payables for investments 152 (74)- Other changes relating to divestment activities 1- Reclassification: Other changes relating to divestment activities (1)Free cash flow 382 (52)Change in financial payables: 364 850- Reclassification: divestments of financial receivables not held for operations 1- Taking on long-term financial debt 1.020 1.226- Repaying long-term financial debt (915) (1.320)- Increase (decrease) in short-term financial debt 259 943Equity cash flows (774) (804)Net cash flow for the period (28) (6)<strong>Snam</strong> <strong>Annual</strong> <strong>Report</strong> <strong>2011</strong>
Elements of riskand uncertainty
<strong>Snam</strong> <strong>Annual</strong> <strong>Report</strong> <strong>2011</strong> / Elements of risk and uncertainty79IntroductionThe main corporate risks identified, monitored and, where specified below, managed by <strong>Snam</strong> are asfollows: (i) market risk arising from exposure to fluctuations in interest rates and in the price of naturalgas; (ii) credit risk arising from the possible default of a counterparty; (iii) liquidity risk arising frominsufficient financial resources to meet short-term commitments; (iv) operational risk; (v) risks specificto the business segments in which the group operates.MARKET RISKInterest rate riskFluctuations in interest rates affect the market value of a company’s financial assets and liabilities as wellas its net financial expense. <strong>Snam</strong> aims to minimise interest rate risk while pursuing financial structureobjectives laid down in its business plans.The interest rates of some of <strong>Snam</strong>’s loans are indexed to benchmark rates, notably the Euro InterbankOffered Rate (Euribor). In order to limit interest rate risk, <strong>Snam</strong> uses derivative financial instruments –notably interest rate swaps (IRSs) – to manage the balance between fixed-rate and floating-rate debt.The IRSs implemented in this case convert floating-rate debt into fixed-rate debt.The fair value of derivative financial instruments, which is the estimated amount that <strong>Snam</strong> wouldbe expected to pay or receive to terminate the agreements at the end of the accounting period, issystematically calculated on the basis of market prices provided by specialist information providers.<strong>Snam</strong> does not have derivative contracts held for trading or speculative purposes.As described in the section “Liquidity risk”, <strong>Snam</strong> currently raises funds solely through its ultimate parent,Eni S.p.A. Should Eni S.p.A. sell its controlling stake in <strong>Snam</strong>, there is no guarantee that the latter wouldbe able to obtain loans and financing from other sources under the same conditions as those currentlyin force.Natural gas price riskUp to the end of the second regulatory period on 31 December 2009, the transportation costs incurredfor the acquisition of gas needed to operate the compression stations were included in overall operatingcosts and therefore updated using the price-cap 29 mechanism. As of the start of the third regulatoryperiod on 1 January 2010, the Electricity and Gas Authority, enacting the new tariff criteria laid downby Resolution ARG/gas 184/09, has defined methods for payment in kind, by shippers to transporters,of gas volumes to cover fuel gas, network losses and Unaccounted-For Gas, owed as a percentage of thevolumes respectively injected into and withdrawn from the transportation network. As a result of thesemeasures, and taking into account the mechanism for allocating gas to shippers, change in the price ofnatural gas for covering fuel gas no longer represents a risk factor for <strong>Snam</strong>. Price fluctuation risk remainsfrom excess quantities of Unaccounted-For Gas and network losses withdrawn vis-à-vis the quantitiespaid for in kind by shippers.29 Under this mechanism, core revenue components relating to operating costs, amortisation and depreciation are updatedwith financial statement figures at the start of a regulatory period, while they are updated with inflation and reduced by aproductivity coefficient in the subsequent years.<strong>Snam</strong> <strong>Annual</strong> <strong>Report</strong> <strong>2011</strong>
80<strong>Snam</strong> <strong>Annual</strong> <strong>Report</strong> <strong>2011</strong> / Elements of risk and uncertaintyCREDIT RISKCredit risk is the company’s exposure to potential losses arising from counterparties failing to fulfil theirobligations. Default or delayed payment may have a negative impact on the financial balance and resultsof <strong>Snam</strong>.<strong>Snam</strong> provides business services to a small number of operators in the gas sector, the largest of which byrevenue is Eni S.p.A. The rules for client access to the services offered are established by the Electricityand Gas Authority and set out in the Network Codes. For each type of service, these documents explainthe rules regulating the rights and obligations of the parties involved in providing said services and havecontractual conditions which minimise the risk of non-compliance by the clients. In particular, the Codesrequire guarantees to be provided to partly cover obligations where the client does not possess a creditrating issued by one of the leading international agencies.<strong>Snam</strong> provides its services essentially to counterparties considered solvent by the market. Ultimateparent Eni S.p.A. represents 28% of trade receivables. It cannot be ruled out, however, that <strong>Snam</strong> mayincur liabilities and/or losses due to its customers’ failure to perform payment obligations. Althoughnearly all receivables are with a small number of clients, there is no credit concentration risk becausethese clients are so reliable.LIQUIDITY RISKLiquidity risk is the risk that new financial resources may not be available (funding liquidity risk) or thecompany may be unable to convert assets into cash on the market (asset liquidity risk), meaning that itcannot meet its payment commitments. This may affect profit or loss should the company be obligedto incur extra costs to meet its commitments or, in extreme cases, lead to insolvency and threatenthe company’s future as a going concern. <strong>Snam</strong>’s objective is to have a financial structure (in termsof leverage ratio and ratios of medium- o long-term debt and fixed-/floating-rate debt to total debt),which ensures an adequate level of liquidity for the group, minimising the related cost and maintaininga balance between the term and composition of its debt in line with business objectives.Decree Law no. 1 of 20 January 2012, authorising “Urgent arrangements for competition, developmentof infrastructure and competitiveness”, was published in the Gazzetta Ufficiale of 24 January 2012.Specifically, Article 15 “Arrangements on ownership unbundling” established that the Prime-MinisterialDecree pursuant to Article 1, paragraph 905 of Law no. 296 of 27 December 2006, relating to theimplementation of ownership unbundling between Eni and <strong>Snam</strong>, shall be issued within six months ofthe above-mentioned Decree Law coming into force.<strong>Snam</strong> is currently financed entirely by its ultimate parent, Eni S.p.A. In the case of a change of control at<strong>Snam</strong> by Eni S.p.A., existing agreements between the companies give Eni S.p.A. the right to extinguishthe credit lines granted early. At present, <strong>Snam</strong> believes that cash flows from operations and its currentfinancial and capital structure can reasonably allow access to a wide range of financing from the capitalmarkets and banks. However, there are no guarantees that <strong>Snam</strong> would be capable of obtaining loansand financing from other sources under the same conditions as current ones.<strong>Snam</strong> <strong>Annual</strong> <strong>Report</strong> <strong>2011</strong>
<strong>Snam</strong> <strong>Annual</strong> <strong>Report</strong> <strong>2011</strong> / Elements of risk and uncertainty81OPERATIONAL RISK<strong>Snam</strong> is required to comply with rules and regulations at EU, national, regional and local level.The expenses associated with the actions required to fulfil its obligations constitute a significant costitem now and for the years ahead.Complying with rules and regulations, and minimising operational risk, is crucial for obtainingauthorisations and/or licences that require compliance with applicable laws on health, safety and theenvironment. Violation of current regulations may result in individual criminal and/or civil sanctions and,in specific cases where safety and environmental rules are violated, companies may be liable on the basisof a European objective liability model adopted in Italy through Legislative Decree no. 231/01. <strong>Snam</strong>may incur significant costs or liability.Current regulations highlight the value of organisational models aimed at preventing offences in theevent of violation of environmental and workplace health and safety laws, specifying corporate liability.<strong>Snam</strong> uses organisational instruments and internal regulations to establish the responsibilities andprocedures to be adopted when designing, constructing, operating and disposing of all company assets,thereby ensuring compliance with laws and internal regulations on health, safety and the environment.<strong>Snam</strong> has implemented environmental and workplace health and safety management systems based onthe principles of its own Health, Safety, Environment and Quality Policy, which has been developed atthe company for several years.The documentation and application of <strong>Snam</strong>’s management systems are certified in accordance withinternational standards. More specifically, the company has received ISO 14001 certification for themanagement process relating to its pipeline network and compression stations, as well as ISO 9001certification for the processes it uses to meter, dispatch and define transportation capacity for naturalgas. The Workplace Health and Safety Management System is certified in accordance with the BSOHSAS 18001 standard. In <strong>2011</strong>, work began on extending this system to <strong>Snam</strong> subsidiaries Stogit andGNL Italia, for which certification is expected before the end of 2012.By adopting management systems and procedures that take into account the specific characteristicsof its business, and by continually improving and modernising its facilities, <strong>Snam</strong> ensures that it canidentify, assess and mitigate risks as part of a cycle of continual improvement.<strong>Snam</strong> pays the utmost attention to all its operational processes: from designing and constructingplants to operating and maintaining them. For the purposes of business management and operationalcontrol, the company uses specific techniques that are continually being updated and are developed incompliance with international best practice.<strong>Snam</strong> develops and maintains technical regulations and management systems for the environment andworkplace health and safety based on an annual cycle of planning, implementation, control, reviewingresults and setting new objectives.Management system control is conducted through monitoring health, safety and environment indicators,periodic reporting and inspections of operating sites and the registered office, which involve:- a technical audit, designed to ensure that the management systems are applied correctly incompliance with the Code of Ethics and Organisational Model 231;- management system checks on certification, maintenance and renovation (conducted annually byan external certifying body);- health, safety and environment checks on outsourced activities.The findings are examined together with the results of the operating checks, providing basic informationfor planning future activities and setting new targets, in accordance with <strong>Snam</strong> principles.<strong>Snam</strong> has adopted organisational and regulatory measures for preventing (availability, goods andservices contracts, training, etc.) and managing operational crises that may impact assets, people andthe environment, identifying the actions required to limit damage.<strong>Snam</strong> <strong>Annual</strong> <strong>Report</strong> <strong>2011</strong>
82<strong>Snam</strong> <strong>Annual</strong> <strong>Report</strong> <strong>2011</strong> / Elements of risk and uncertainty<strong>Snam</strong> participates in international working groups that conduct benchmarking activities, draw upguidelines and carry out studies aimed at identifying ways in which gas transportation processes can beimproved.In addition to the risk response, monitoring and management system, as well as to the HSE measuresadopted across the group, <strong>Snam</strong> has taken out insurance to limit the possible negative effects on its assetsfrom damage caused to third parties and to industrial property, whether onshore or offshore (Messinastrait). This damage may occur during operations and/or investment works. The amount insured variesaccording to the type of event and is determined by current market best practice in risk assessment.Risks connected with failing to meet infrastructure development objectives<strong>Snam</strong>’s effective ability to develop its infrastructure is subject to many unforeseeable events linked tooperating, economic, regulatory, authorisation and competition factors which are outside its control.<strong>Snam</strong> is therefore unable to guarantee that the projects to upgrade and extend its network will bestarted, be completed or lead to the expected benefits in terms of tariffs. Additionally, the developmentprojects may require greater investments or longer timeframes than those originally planned, affectingthe company’s financial position and results.Risks deriving from malfunctioning of plantsManaging regulated gas activities involves a number of risks of malfunctioning and unforeseeableservice disruptions due to factors which are outside <strong>Snam</strong>’s control, such as accidents, breakdowns ormalfunctioning of equipment or control systems, the underperformance of plants and extraordinaryevents such as explosions, fires, earthquakes, landslides or other similar events beyond <strong>Snam</strong>’s control.These events could also cause significant damage to persons, property or the environment.Any service interruptions and subsequent compensation obligations could lead to a decrease in revenueand/or an increase in costs. Although <strong>Snam</strong> has taken out specific insurance policies to cover some ofthese risks, the related insurance cover could be insufficient to meet all the losses incurred, compensationobligations or cost increases.Risks deriving from the need to manage a significant flow of information to operate regulatedservicesThe regulatory framework in which <strong>Snam</strong> operates involves continually collecting and processing asignificant flow of information from its service clients. The information received by <strong>Snam</strong> includes,inter alia, capacity bookings, details of where gas is coming from and going to each day, physical andcommercial balancing mechanisms and forecasts on demand and transportation capacity usage. Thisflow of information, managed by extensive use of IT systems, is large and complex. Therefore, <strong>Snam</strong>cannot guarantee that its management will not lead to operating and planning difficulties which couldaffect its business.Risks deriving from the seasonal nature of the business<strong>Snam</strong>’s overall business is not affected by seasonal or cyclical factors which could have a significantimpact on its annual or interim financial position and results. Indeed, on the basis of current tariffs, onlya minimal part of <strong>Snam</strong>’s revenues is exposed to changes in gas demand (around 15% of natural gastransportation revenue and around 10% of LNG regasification revenue).<strong>Snam</strong> <strong>Annual</strong> <strong>Report</strong> <strong>2011</strong>
<strong>Snam</strong> <strong>Annual</strong> <strong>Report</strong> <strong>2011</strong> / Elements of risk and uncertainty83SPECIFIC RISKS RELATED TO THE BUSINESS SEGMENTS IN WHICH SNAM OPERATESRegulation<strong>Snam</strong> operates in the regulated gas sector. The relevant directives and legal provisions issued by theEuropean Union and the Italian government, and the resolutions of the Electricity and Gas Authority,may have a significant impact on operations, results and financial stability. More specifically, Decree Lawno. 138 of 13 August <strong>2011</strong>, which was converted into Law no. 148 of 14 September <strong>2011</strong>, extendedthe application of additional IRES to the natural gas transportation and distribution business segments,with a tax rise of 10.5% for <strong>2011</strong>-2013 and 6.5% as of 2014. Companies are not permitted to pass onthe tax rise to customers via a tariff increase, and the Electricity and Gas Authority has been mandatedto enforce this rule. Future changes to European Union or Italian legislative policies, which may haveunforeseeable effects on the relevant legislative framework and, therefore, on <strong>Snam</strong>’s operations andresults, cannot be ruled out.Risks associated with the end of gas distribution concessions held by Italgas and its subsidiariesand associatesRisks relating to tenders for new gas distribution concessionsAt 31 December <strong>2011</strong>, <strong>Snam</strong>, through Italgas, had a portfolio of approximately 1,450 natural gasdistribution concessions spread throughout Italy. On the basis of current regulations applicable to<strong>Snam</strong>’s concessions, new gas distribution contracts will be awarded not by individual municipality butexclusively by zones determined by the Ministerial Decrees of 19 January <strong>2011</strong> and 18 October <strong>2011</strong>,and also according to the timeframes indicated in Annex 1 of the Ministerial Decree on bid evaluationand auction criteria, issued on 12 November <strong>2011</strong>.As the tender process unfolds, <strong>Snam</strong> may not be awarded one or more of the new concessions,or it may be awarded them on less favourable terms than is currently the case. This could have anegative impact on <strong>Snam</strong>’s operations, results, balance sheet and cash flow, notwithstanding, shouldthe company not be awarded concessions for municipalities it currently manages, the reimbursementto the outgoing operator.Risks relating to the possible request from municipalities to acquire ownership of the gas distributionnetworks and to quantifying reimbursement to the outgoing operatorWith regard to the gas distribution concessions where <strong>Snam</strong>, through Italgas, also owns the networksand plants, regulatory changes in the sector determine the legal rules of ownership and the elementsrequired to calculate the amount to be reimbursed to the outgoing operator, both in the first period,i.e. at the end of the transition period referred to in Article 15 of Legislative Decree no. 164/100 assubsequently amended, and in subsequent periods.More specifically, the above-mentioned Decree on bid evaluation and auction criteria stipulates that:- in the first period, the amount to be reimbursed to existing concession and contract holders shall becalculated on the basis of what has been agreed, or, where this is not possible, on the basis of criteriaestablished in Royal Decree no. 2578 of 15 October 1925 (the “industrial value” criterion);- in the event of a dispute on the amount to be reimbursed to the outgoing operator, the call fortenders reports and the winning operator pays, upon transfer of ownership of the plants, the higherof the estimate by the awarding local authorities and the value of the local net fixed assets, netof government grants for capital expenditure and private contributions relating to local assets,recognised by the tariff system of the Electricity and Gas Authority (RAB). Once the dispute has beenresolved, any difference will be settled between the winning operator and the outgoing operator;<strong>Snam</strong> <strong>Annual</strong> <strong>Report</strong> <strong>2011</strong>
84<strong>Snam</strong> <strong>Annual</strong> <strong>Report</strong> <strong>2011</strong> / Elements of risk and uncertainty- the incoming operator will acquire ownership of the plant by paying the outgoing operator thereimbursement amount, with the exception of any parts owned by the local municipality;- in subsequent periods, the reimbursement to the outgoing operator shall be the value of local netfixed assets, net of government grants for capital expenditure and private contributions relating tolocal assets, calculated on the basis of criteria used by the Electricity and Gas Authority to determinedistribution tariffs (RAB).There is a risk that resolving the dispute with the local authorities on how to determine thereimbursement will lead to the amount being less than was indicated during the tender process andwas actually paid to <strong>Snam</strong>, which could have a negative impact on the company’s results, balancesheet and cash flow.Risks relating to gas storage concession ownershipThrough Stogit, <strong>Snam</strong> holds ten gas storage concessions. Of these, eight (Alfonsine, Brugherio,Cortemaggiore, Minerbio, Ripalta, Sabbioncello, Sergnano and Settala) expire in December 2016, one(Bordolano) expires in November 2021 and the other (Fiume Treste), which was extended for a decadefor the first time during <strong>2011</strong>, expires in June 2022. Each concession may be extended by the Ministryof Economic Development no more than twice for a duration of ten years at a time, pursuant to Article1, paragraph 61 of Law no. 239/2004. If <strong>Snam</strong> is unable to retain ownership of one or more of itsconcessions or if, at the time of the renewal, the concessions are awarded under terms less favourablethan the current ones, there may be negative effects on the company’s operations, results, balance sheetand cash flow.Risk relating to uncertainty about natural gas reservesThere are several uncertainties surrounding estimations of natural gas reserves in the storage fieldswhere <strong>Snam</strong> operates via its subsidiaries, and therefore their future use and necessary investments.The accuracy of these estimations depends on a certain number of factors, assumptions and variables,among which some of the most important are: (a) the quality of geological, technical and economic dataand their interpretation and evaluation; (b) projections for future usage and timeframes for the relevantinvestment; (c) the stability or otherwise of sector laws and regulations; (d) the actual results of drillingand general production activity in the fields for which <strong>Snam</strong> owns a concession which are subsequent tothe estimation date and which may cause said estimations to be raised or lowered.Factors other than those listed above which may influence reserve estimations are beyond <strong>Snam</strong>’scontrol and may therefore vary over time. As a result, there may be differences between estimatedreserves and those actually available for use, which may have negative effects on operations, results, thebalance sheet and cash flow.<strong>Snam</strong> <strong>Annual</strong> <strong>Report</strong> <strong>2011</strong>
<strong>Snam</strong> <strong>Annual</strong> <strong>Report</strong> <strong>2011</strong> / Elements of risk and uncertainty85Risks connected with certain socio-political situations in natural gas production and transitcountriesA large part of the natural gas which travels through the transportation network of <strong>Snam</strong> does, ormay, come from or travel through countries which present risks deriving from certain socio-politicalsituations. Importing and transiting natural gas from or through such countries may present riskssuch as: higher taxes and excise duties; production, export or transportation limits; enforced contractrenegotiations; nationalisation or renationalisation of assets; changes to national political and governingsystems; changes to commercial policies; monetary restrictions; and loss or damage owing to the actionsof rebel groups. If shippers are unable to access the natural gas available in these countries as a result ofthe aforementioned or similar situations or they are damaged in any other way by said situations, theymay be unable to fulfil their contractual obligations to <strong>Snam</strong> or there may be a reduction in volumes ofgas transported. Such events may therefore have a negative effect on operations, results, the balancesheet and cash flow.Quantitative information about risks arising from financial instruments as required by IFRS 7 “Financialinstruments: Notes to the financial statements” is provided in Note 28 to the consolidated financialstatements, “Guarantees, commitments and risks”.<strong>Snam</strong> <strong>Annual</strong> <strong>Report</strong> <strong>2011</strong>
Outlook
<strong>Snam</strong> <strong>Annual</strong> <strong>Report</strong> <strong>2011</strong> / Outlook87Management’s priorities are to develop significant new gas infrastructure in Italy in order to improvesupply security, flexibility and service quality throughout the gas system, which is necessary to createconditions for developing a gas hub.Gas demandThe most recent forecasts for the evolution of natural gas demand in Italy show moderate annual growthbetween 2012 and 2015, mainly as a result of the expected increase in the thermoelectric sector.Investments<strong>Snam</strong> is going ahead with a significant investment plan involving a total of around €6.7 billion at grouplevel for the years 2012 to 2015. The main investment plan guidelines for the company’s businesssegments are as follows:Transportation- satisfy requirements linked to medium- and long-term growth in demand for gas and increase theflexibility and safety of the gas transportation system in Italy;- continue to improve the quality of the transportation service;- contribute to the development of a European gas hub;- develop the gas balancing market.Over the period in question, the planned investments should allow the company to extend the totallength of the transportation network (32,010 km in <strong>2011</strong>) by around 3% and to increase the installedpower in the compression stations by around 4% (884 Megawatts in <strong>2011</strong>).RegasificationInvestments in 2012 are expected to be in line with those for <strong>2011</strong>.Storage- improve the overall safety and flexibility of the system by increasing the storage and delivery pointcapacity;- optimise balancing and promote the liquidity of the gas system in Italy.The projects included in the plan will deliver an increase in storage capacity of about 30% over theperiod in question (10 billion standard cubic metres in <strong>2011</strong>) and an increase of around 14% in deliverypoint capacity (271 million standard cubic metres in <strong>2011</strong>).Distribution- selectively manage the portfolio of concessions in order to maximise profitability;- continue to improve the level of safety, reliability and quality of the service;- continue to encourage the rising number of end users.The planned interventions will allow the company to continue to support the development of thebusiness by increasing the number of customers in 2015 by around 8% compared to <strong>2011</strong> (5.9 millioncustomers in <strong>2011</strong>).Efficiency<strong>Snam</strong> will continue to pay attention to operating efficiency in 2012 through initiatives designed to keepemerging costs under control, notably the reorganisation of the group which took place in <strong>2011</strong>.<strong>Snam</strong> <strong>Annual</strong> <strong>Report</strong> <strong>2011</strong>
Other information
90<strong>Snam</strong> <strong>Annual</strong> <strong>Report</strong> <strong>2011</strong> / Other informationTreasury shares held by the company and subsidiariesThe treasury shares held by the company at 31 December <strong>2011</strong> are analysed in the table below:PeriodNo. of sharesAverage cost (€)Total cost (€ million)Share capital(%) (*)Repurchases2005 800,000 4.399 3 0.042006 121,731,297 3.738 455 6.222007 73,006,653 4.607 336 3.73195,537,950 4.061 794Less treasury shares granted/sold:. granted under the 2005 stock grant plans (39,100). sold under the 2005 stock option plans (69,000). sold under the 2006 stock option plans (1,775,249). sold under the 2007 stock option plans (1,101,550)Treasury shares held by the company at 31 December <strong>2011</strong> 192,553,051(*) Refers to the share capital in existence at date of the last repurchase of the year.At 31 December <strong>2011</strong> the total number of treasury shares held by the company was 192,553,051, eachwith a par value of €1, equal to 5.39% of the share capital having a total book value of €783 million.No share repurchase plans have been in place since 2008.It is also noted that: (i) the subsidiaries of <strong>Snam</strong> Rete Gas S.p.A. do not hold, and have not beenauthorised by their shareholders to acquire, shares in <strong>Snam</strong> Rete Gas S.p.A.; (ii) <strong>Snam</strong> Rete Gas S.p.A. andits subsidiaries do not hold, and have not been authorised by their shareholders to acquire, shares in theultimate parent Eni S.p.A.Compensation paid to directors and statutory auditors, general managers and managers withstrategic responsibilities, and investments held by each of theseInformation on the compensation paid to directors and statutory auditors, general managers andmanagers with strategic responsibilities, and the investments held by each of these, can be found in theRemuneration <strong>Report</strong>, which is prepared in accordance with Article 123-ter of Legislative Decree no.58/1998 (TUF) and approved by the Board of Directors on 12 March 2012. The Remuneration <strong>Report</strong> isavailable in the “Governance” section of the website http://www.snam.it.Incentive plans for managers with <strong>Snam</strong> sharesAs of 2009, <strong>Snam</strong> discontinued the managers’ incentive plan based on grants of stock options to managersof <strong>Snam</strong> and its subsidiaries pursuant to Article 2359 of the Italian Civil Code. The stock option plans forthe preceding financial years are described below. At 31 December <strong>2011</strong>, there were a total of 3,151,851stock options for the purchase of 3,151,851 <strong>Snam</strong> ordinary shares at a par value of €1, fully exercisable.<strong>Snam</strong> <strong>Annual</strong> <strong>Report</strong> <strong>2011</strong>
<strong>Snam</strong> <strong>Annual</strong> <strong>Report</strong> <strong>2011</strong> / Other information91Incentive plans 2002-2004 and 2005In their meeting of 24 April 2002 and in accordance with Article 2443 of the Italian Civil Code,the shareholders authorised the Board of Directors to increase before 31 July 2004, in one or moreinstalments, the company’s share capital against payment by up to a maximum of €2,000,000 (equalto roughly 0.1023% of the share capital) by issuing a maximum of 2,000,000 ordinary shares with a parvalue of €1 each and regular rights to dividends, excluding options pursuant to the last paragraph ofArticle 2441 of the Italian Civil Code and Article 134, paragraphs two and three of Legislative Decreeno. 58/1998. These shares were offered for subscription to managers of <strong>Snam</strong> Rete Gas S.p.A. and itssubsidiaries in the three-year period from 2002 to 2004 pursuant to Article 2359 of the Italian CivilCode. In their meeting of 27 April 2005 the shareholders authorised the repurchase of 800,000 treasuryshares (0.04% of share capital) to service the 2005 stock option plan. The transaction was concluded on28 July 2005.In accordance with the powers assigned to it by the Shareholders’ Meeting, the Board of Directors decidedthat the options for the 2002-2004 and 2005 plans may be exercised three years after assignment (the‘vesting period’) and over five years. The options are personal, unavailable and non-transferable. Optionsnot exercised by the established expiry date are forfeited and therefore do not give the beneficiary anyrights.In the cases of: (i) the mutual termination of the employment of the beneficiary; (ii) loss of controlby <strong>Snam</strong> Rete Gas S.p.A. over the company in which the beneficiary works; (iii) sale to a third partyof the company (or business unit) in which the beneficiary works; or (iv) death of the beneficiary, thebeneficiary or their heirs maintain the right to exercise the options before 31 December of the year inwhich the vesting period ends. Should the employee or company unilaterally terminate the employmentcontract before the three years are up, the options are forfeited.The grants made between 2002 and 2005 and the related number of options in existence at31 December <strong>2011</strong> are summarised as follows:Year of assignmentNumber of managersStrike price (€)Number of optionsgrantedNumber of optionsexisting at 31.12.<strong>2011</strong>2002 15 2.977 (a) 608,500 -2003 17 3.246 (a) 640,500 -2004 19 3.53 (a) 677,000 148,5002005 19 4.399 (b) 658,000 538,000686,500(a)(b)The unit price is equal to the average of the official prices on the Mercato Telematico Azionario managed by Borsa Italiana S.p.A. in the month preceding the grant decision date.The unit price is equal to the average of the official prices on the Mercato Telematico Azionario managed by Borsa Italiana S.p.A. in the month preceding the grant date or, if greater, theaverage cost of the shares in the portfolio on the day before the grant date.<strong>Snam</strong> <strong>Annual</strong> <strong>Report</strong> <strong>2011</strong>
92<strong>Snam</strong> <strong>Annual</strong> <strong>Report</strong> <strong>2011</strong> / Other informationIncentive plans 2006-2008In their meeting of 10 November 2005 and in accordance with Article 2357 of the Italian Civil Code, theshareholders authorised the Board of Directors to repurchase a maximum of 194,737,950 ordinary <strong>Snam</strong>shares on the Mercato Telematico Azionario managed by Borsa Italiana S.p.A., within 18 months of thedate of the resolution, and for up to a maximum of €800 million 30 .In their meeting of 27 April 2006, the shareholders authorised the Board of Directors to make availablea maximum of 9,000,000 treasury shares (equal to 0.46% of the share capital) for stock option plans tobe offered in three annual grants during 2006, 2007 and 2008, respectively.Unlike the earlier plans, exercise of the options for the 2006-2008 stock option plan is tied to theachievement of performance targets. At the end of each three-year vesting period, the Board of Directorsdecides the number of options which can be exercised using a scale of between zero and 100 per centbased on the average Total Shareholders’ Return (TSR) of the <strong>Snam</strong> stock compared to that of thesix main European utilities companies listed and operating on regulated markets.The options may be exercised three years after their assignment (vesting period) and for a maximumof three years. Options which have not been exercised six years after their grant date are forfeited anddo not give the beneficiary any rights. In the cases of: (i) the mutual termination of the employment ofthe beneficiary; (ii) loss of control by <strong>Snam</strong> over the company in which the beneficiary works; (iii) saleof the company (or business unit) in which the beneficiary works to a third party; or (iv) death of thebeneficiary, the beneficiary or their heirs maintain the right to exercise the option before 31 Decemberof the year in which the vesting period ends, in proportion to the period of time between assignmentand the occurrence of these events. In the event that the employment contract is terminated unilaterallyduring the vesting period, the options are forfeited. If this event takes place during the exercise period,the options may be exercised within three months.On 29 July 2009, the Board of Directors updated the 2006-2008 stock option plan as a consequence ofthe paid share capital increase decided by the Extraordinary Shareholders’ Meeting of 17 March 2009and completed on 8 June 2009. In line with the provisions of the Regulations for implementing the Plan,the change made regards the technical adjustment of the strike price and the integration of the numberof options assigned to the recipients of the Plan, whose actual assignation is subject to the achievementof the required performance goals.The grants made between 2006 and 2008 (as amended) and the related number of options in existenceat 31 December <strong>2011</strong> are summarised as follows:Year of assignmentNumber of managersOriginal strike price(€) (a)New strike price(€) (a)Number of optionsinitially grantedNumber of newoptions grantedTotal number ofoptions grantedNumber of optionsexisting at 31.12.<strong>2011</strong>2006 18 3.542 2.905 2,597,500 336,075 2,933,575 96,8012007 20 4.322 3.545 2,326,500 456,300 2,782,800 637,3502008 19 4.222 3.463 2,235,000 491,000 2,726,000 1,731,2007,159,000 1,283,375 8,442,375 2,465,351(a)The unit price is equal to the average of the official prices on the Mercato Telematico Azionario managed by Borsa Italiana S.p.A. in the month precedingthe grant date or, if greater, the average cost of the shares in the portfolio on the day before the assignment date.30 The transaction was completed on 2 May 2007. The company repurchased 194,737,950 own shares for a total outlay of€791 million.<strong>Snam</strong> <strong>Annual</strong> <strong>Report</strong> <strong>2011</strong>
<strong>Snam</strong> <strong>Annual</strong> <strong>Report</strong> <strong>2011</strong> / Other information93Relationships with related partiesTransactions carried out during the financial year by <strong>Snam</strong> and by companies within its scope ofconsolidation with related parties mainly involve the exchange of goods, the provision of services, andthe provision and utilisation of financial resources, including the arrangement of derivative contracts tohedge interest rate risk with the ultimate parent Eni S.p.A. and its subsidiaries, as well as with Enel, astate-controlled company, and its subsidiaries.These transactions are part of ordinary business activities and are generally settled at market conditions,i.e. the conditions which would be applied for two independent parties. All the transactions carried outwere in the interest of the companies of the <strong>Snam</strong> group.Pursuant to the provisions of the relevant legislation, the company has adopted internal procedures toensure that transactions carried out by <strong>Snam</strong> or its subsidiaries with related parties are transparent andcorrect in their substance and procedure 31 .Directors and auditors declare their interests affecting the company and the group every six months,and/or when changes in said interests occur; they also inform the CEO (or the Chairman, in the case ofthe CEO), who in turns informs the other directors and the Board of Statutory Auditors, of individualtransactions that the company intends to carry out and in which they have an interest.The amounts involved in commercial, financial and other transactions with related parties, a descriptionof the nature of the key transactions, and their effect on the balance sheet, income statement and cashflow statement are given in Note 36 to the consolidated financial statements and, with regard to theparent company <strong>Snam</strong> Rete Gas S.p.A., in Note 32 of the individual financial statements.Relationships with the ultimate parent and companies managed and coordinated by it<strong>Snam</strong> is managed and coordinated by Eni S.p.A. Relationships with Eni S.p.A. and companies managedand coordinated by it are relationships with related parties and are disclosed in Note 36, “Relationshipswith related parties” of the Notes to the consolidated financial statements and Note 32 of the individualfinancial statements, respectively.Performance of subsidiariesFor performance information concerning the sectors in which the company operates wholly or inpart through subsidiaries, please refer to the sections “Business segment operating performance” and“Comments on the Results” within this <strong>Report</strong>.Branch officesAs required by Article 2428, paragraph 4 of the Italian Civil Code, it is noted that <strong>Snam</strong> does not havebranch offices.Research and DevelopmentResearch and development activities carried out by <strong>Snam</strong> are described by business segment in thesection “Commitment to sustainable development”.31 The procedure for transactions with related parties, pursuant to Article 4 of Consob Regulation 17221 of 12 March 2010 (asamended), as approved by the Board of Directors on 30 November 2010 can be consulted in the “Governance” section ofthe Company’s website at the address www.snam.it.<strong>Snam</strong> <strong>Annual</strong> <strong>Report</strong> <strong>2011</strong>
94<strong>Snam</strong> <strong>Annual</strong> <strong>Report</strong> <strong>2011</strong> / Other informationSignificant events after the end of the fiscal yearDevelopment initiatives in European gas infrastructureIn January 2012 <strong>Snam</strong> and Fluxys G signed an agreement for the evaluation of future joint strategiesaimed at taking advantage of potential opportunities for development in the European gas sector. Theagreement involves natural gas transportation, storage and regasification activities, through projectsdesigned to strengthen the flexibility and safety of current European infrastructure supplies. Theinitiatives also involve two-way flows, in line with the recommendations and guidelines of the third EUDirective for an integrated gas market, as adopted by the European Parliament and the Council, in orderto promote cross-border flows and connect the major gas exchange infrastructures in north-western andsouthern Europe.On 22 February 2012, <strong>Snam</strong> and Fluxys G entered into a joint agreement to purchase the followinginvestments from Eni: (i) 16.41% of Interconnector (UK) Ltd, the owner and operator of the underwaterpipeline between the United Kingdom (Bacton) and Belgium (Zeebrugge), enabling a strategic bidirectionalconnection between the United Kingdom and Europe’s biggest gas trading markets; (ii)51% of Interconnector Zeebrugge Terminal SCRL, which includes the terminal and the compressionplants that connect the Interconnector pipeline with the Belgian gas transportation system; (iii) 10% ofHuberator S.A., a subsidiary of Fluxys G that operates the gas trading hub in Zeebrugge. The transactioninvolves the two purchasers acquiring the aforesaid investments in equal shares, for a total considerationof €150 million.The transaction is expected to be completed by the second half of 2012, subject to the authorisation ofthe competent authorities.<strong>Snam</strong> <strong>Annual</strong> <strong>Report</strong> <strong>2011</strong>
<strong>Snam</strong> <strong>Annual</strong> <strong>Report</strong> <strong>2011</strong>
Informationon corporate governanceand ownership structure
98<strong>Snam</strong> <strong>Annual</strong> <strong>Report</strong> <strong>2011</strong> / Information on corporate governance and ownership structureINFORMATION ON CORPORATE GOVERNANCE<strong>Snam</strong> S.p.A. (hereafter also referred to as “<strong>Snam</strong>” or the “Company”) issues shares which are quoted onthe Mercato Telematico Azionario managed by Borsa Italiana S.p.A. and therefore fulfils all legislativeand regulatory obligations related to stock market listing.The overall framework of <strong>Snam</strong>’s corporate governance system is described in the “Corporate governanceand ownership structure report” prepared pursuant to Article 123-bis of Legislative Decree no. 58/1998(hereafter referred to as the “Consolidated Finance Act” or “TUF”) and approved by the Board of Directorson 12 March 2012.The information reported below, at 31 December <strong>2011</strong> unless otherwise indicated, aims to supply asummary of this report, bearing in mind the minimum content required by the aforesaid law and therecommendations of Borsa Italiana’s Code of Corporate Governance.The Corporate governance and ownership structure report is published (at the same time as this Director’s<strong>Report</strong>) in the “Governance” section of the company website: http://www.snam.it.SHARE CAPITAL AND OWNERSHIP STRUCTUREShare capital and key shareholdersThe share capital of <strong>Snam</strong> is composed of registered ordinary shares, which are indivisible and each conferthe right to one vote. At 31 December <strong>2011</strong> the share capital of <strong>Snam</strong> totalled €3,571,187,994.00,represented by 3,571,187,994 ordinary shares each with a par value of €1.<strong>Snam</strong> shares are listed in the FTSE MIB index of Borsa Italiana, on the main international indices (StoxxEurope, S&P Europe, MSCI Europe), and on the major sustainability indices Dow Jones SustainabilityWorld Index, FTSE4Good Index, Stoxx Global ESG Leaders, and the ECPI family of indices.The Board of Directors does not currently have authorisations to increase the share capital, pursuant toArticle 2443 of the Italian Civil Code.At 31 December <strong>2011</strong> the total number of treasury shares held by the company was 192,553,051, equalto 5.39% of the share capital. The proportion of floating capital was 42.08%.The company does not have any plans to repurchase treasury shares pursuant to Article 2357 et seq. ofthe Italian Civil Code.According to the information available and the communications received in accordance with Article 120of the Consolidated Finance Act and Consob Resolution 11971/1999 (Consob Issuer Regulation), theshareholders holding more than 2% of <strong>Snam</strong>’s share capital at 31 December <strong>2011</strong> are:Shareholders% of share capital31.12.2010% of share capital31.12.<strong>2011</strong>Eni S.p.A. 52.54 52.53<strong>Snam</strong> 5.44 5.39<strong>Snam</strong> is managed and coordinated by Eni S.p.A. and in turn <strong>Snam</strong> manages and coordinates itssubsidiaries. The company is not aware of any agreements among its shareholders, nor have any suchagreements been published pursuant to the law. The company has not issued shares which give specialcontrolling rights. The Articles of Association do not make any restrictions on the transfer of shares oron voting rights.<strong>Snam</strong> <strong>Annual</strong> <strong>Report</strong> <strong>2011</strong>
<strong>Snam</strong> <strong>Annual</strong> <strong>Report</strong> <strong>2011</strong> / Information on corporate governance and ownership structure99Change of control clauses and provisions of the Articles of Association on public share offeringsChange of control clauses<strong>Snam</strong> and its subsidiaries (hereafter, the “Subsidiaries”) 32 are parties to significant agreements (whichmay be disclosed without causing serious harm to the company) which become effective, are amendedor extinguished in the event of a change of control over <strong>Snam</strong> by Eni S.p.A. In particular:a) Agreements whereby the counterparty can terminate the contract early:- Short-term credit facilities with Eni S.p.A. (amounting to €2,787 million at 31 December <strong>2011</strong>);- Guarantees issued in the interests of <strong>Snam</strong> and its subsidiaries by Eni S.p.A. or banks against EniS.p.A. (amounting to a total of €85 million at 31 December <strong>2011</strong>);- Medium to long-term credit facilities with Eni S.p.A. (amounting to €8,085 million at31 December <strong>2011</strong>);- Derivatives hedging interest rate fluctuations (Interest Rate Swap - IRS) held with Eni S.p.A., for apar value of €6,435 million at 31 December <strong>2011</strong>;The acceleration of loan agreements, agreements for centralised treasury services, guarantees andderivatives would expose <strong>Snam</strong> and its subsidiaries to the risk of not being able to obtain financingfrom other sources under current conditions. Moreover, the early termination of fixed-rate loans andinterest rate swaps takes place at fair value, which may differ from their carrying amount at thetermination date.b) In the event of a change of control, agreements with Eni S.p.A. for services may need to be changedfor agreements with other counterparties.Provisions of Articles of Association on public share offeringsThe Articles of Association do not derogate from the provisions on the passivity rule set forth in Article 104,paragraphs 1 and 2 of the TUF and do not provide for the implementation of the neutralisation rulesdescribed in Article 104-bis, paragraphs 2 and 3 of the TUF.SYSTEM AND RULES OF CORPORATE GOVERNANCECompliance with the Code of Corporate Governance of Borsa Italiana S.p.A.In line with the values enshrined in the Code of Ethics, integrity and transparency are the principles that<strong>Snam</strong> pursues in formulating an administration and control structure that is suited to its size, complexityand operating structure, in adopting an effective internal control system, and in communicating withshareholders and other stakeholders, particularly by reviewing and updating the information availableon its website.32 The direct subsidiaries of <strong>Snam</strong> are: GNL Italia S.p.A.; <strong>Snam</strong> Rete Gas S.p.A.; Società Italiana per il Gas per azioni – Italgas;and Stoccaggi Gas Italia S.p.A. – Stogit; its indirect subsidiaries are: Compagnia Napoletana di Illuminazione e Scaldamentocol Gas S.p.A. – Napoletanagas; and Servizi Territori Aree Penisole S.p.A. – Seteap.<strong>Snam</strong> <strong>Annual</strong> <strong>Report</strong> <strong>2011</strong>
100<strong>Snam</strong> <strong>Annual</strong> <strong>Report</strong> <strong>2011</strong> / Information on corporate governance and ownership structure<strong>Snam</strong> has complied with Borsa Italiana’s Code of Corporate Governance for Listed Companies since itbecame listed in 2001. As a consequence of the decision of the Board of Directors of 19 December <strong>2011</strong>,<strong>Snam</strong> has implemented the recommendations on directors’ remuneration set forth in the Code ofCorporate Governance, as most recently amended in the latest edition of December <strong>2011</strong> (Article 6).In relation to compliance with the Code (as amended in December <strong>2011</strong>), the Board of Directors’meeting of 12 March 2012 examined the proposals made by the competent offices on the results of theanalyses conducted. The Board decided to conclude their evaluation of the necessary adjustments in themeeting preceding the Shareholders’ Meeting called to approve the financial statements for <strong>2011</strong>, forthe purposes of confirming compliance.The Code of Corporate Governance is available to the public on the website of Borsa Italiana S.p.A.,(www.borsaitaliana.it).The aim of the corporate governance system is to create value for shareholders, bearing in mind thecompany’s social importance, particularly with regard to protecting the environment, people’s healthand safety, workers’ rights, equal opportunities, working with the local and national communities inwhich the company is present, and the interests of all stakeholders.Corporate Governance StructureThe corporate governance structure of <strong>Snam</strong> follows the traditional model, which – notwithstanding thetasks to be carried out by the Shareholders’ Meeting 33 – assigns corporate management to the Boardof Directors, supervisory functions to the Board of Statutory Auditors, and auditing to the independentauditors appointed by the shareholders. The chosen model therefore establishes a clear distinctionbetween the functions of the Chairman and those of the Chief Executive Officer; pursuant to Article 19of the Articles of Association, both of them retain representative powers for the company.Please find below a graphic summary of the governance structure of the company 34 :33 For further information on the role of the Shareholders’ Meeting and the participation of shareholders, please refer to the“Governance” section of <strong>Snam</strong>’s website and the document “<strong>Report</strong> on Corporate Governance and Ownership Structure”.34 The structure shown is updated to 12 March 2012. Please refer to Note 39 on the office of General Operations Manager.<strong>Snam</strong> <strong>Annual</strong> <strong>Report</strong> <strong>2011</strong>
<strong>Snam</strong> <strong>Annual</strong> <strong>Report</strong> <strong>2011</strong> / Information on corporate governance and ownership structure101graphic summaryShareholders’ MeetingChairmanSalvatore SardoChairmanMassimo Gatto (c)Chief Executive OfficerCarlo MalacarneDirectorsAlessandro BerniniDavide Croff (b)Roberto Lonzar (a)(b)Massimo MantovaniElisabetta Oliveri (a)(b)Renato Santini (b)Mario Stella Richter (a)(b)Board DirectorSecretary of the BoardMarco ReggianiBoard ofStatutoryAuditorsStatutory AuditorsRoberto MazzeiFeancesco Schiavone PanniAlternate AuditorsGiulio GambaLuigi Rinaldi (c)Independent AuditorsRecontaErnst & Young S.p.A.Internal ControlRoberto Lonzar - ChairmanMario Stella RichterRenato SantiniRemuneration CommitteeDavide Croff - ChairmanAlessandro BerniniElisabetta OlivieriAppointments CommitteeCombined IndependentManagement CommitteeUnbundling Supervisor:Bruno Clerico TitinetDavide Croff - ChairmanRoberto LonzarRenato SantiniCarlo Malacarne - ChairmanPaolo BacchettaMarco GallettiFrancesco IovanePaolo MosaSupervisory Body 231Code of Ethics SupervisorMario Molteni - ChairmanSilvio BianchiBruno BuriganaGiovanni Maria GarignaniBruno Clerico TitinetInternal Auditor andHead of Internal ControlSilvio BianchiChief Financial OfficerAntonio Paccioretti(a)Directors appointed from the minority list(b)Independent directors(c)Auditors appointed from the minority list<strong>Snam</strong> <strong>Annual</strong> <strong>Report</strong> <strong>2011</strong>
102<strong>Snam</strong> <strong>Annual</strong> <strong>Report</strong> <strong>2011</strong> / Information on corporate governance and ownership structureArticles of AssociationOn 5 December <strong>2011</strong>, the <strong>Snam</strong> Extraordinary Shareholders’ Meeting amended the company’s nameto “<strong>Snam</strong> S.p.A.”. This followed the decision taken to give the wholly-owned subsidiary that carriesout the gas transportation, dispatch, remote control and metering business the name “<strong>Snam</strong> ReteGas S.p.A.” (or in abbreviated form, “<strong>Snam</strong> RG S.p.A.”) as of 1 January 2012, when the business unitwas transferred by <strong>Snam</strong>. The current name “<strong>Snam</strong> S.p.A.” is designed to ensure that the FTSE MIBlistedcompany is easily identifiable and does not break continuity with the past. Furthermore, on12 March 2012 the Board of Directors resolved to submit the changes to the company’s Articlesof Association to the next Extraordinary Shareholders’ Meeting of 26 and 27 April 2012, to ensurecompliance with the provisions of the TUF and those issued by Consob on gender representation inthe corporate bodies. These provisions will apply from the next replacement of the corporate bodies,which is currently scheduled to take place at the same time as the approval of the financial statementsup to 31 December 2012.Board of DirectorsPursuant to Article 13 of the Articles of Association, the Board of Directors has a variable number ofmembers ranging from five to nine, elected by list vote. Only those shareholders who 35 , severally orjointly, represent at least 1% of the share capital, as decided by Consob, shall have the right to submitlists. In their meeting of 27 April 2010, the shareholders decided that there would be nine directors, andappointed the Board of Directors 36 and the Chairman for three years, until the date of the Shareholders’Meeting called to approve the financial statements for financial year 2012.The Board of Directors is made up of nine members: Salvatore Sardo (Chairman), Carlo Malacarne (CEO),Alessandro Bernini, Davide Croff, Roberto Lonzar, Massimo Mantovani, Elisabetta Oliveri, Renato Santiniand Mario Stella Richter (directors).Directors Salvatore Sardo, Carlo Malacarne, Alessandro Bernini, Davide Croff, Massimo Mantovaniand Renato Santini were elected from the lists submitted by Eni S.p.A, while Roberto Lonzar,Elisabetta Oliveri and Mario Stella Richter were elected from the list presented by certain minorityshareholders.The Board of Directors is at the centre of the company’s corporate governance system. It has the broadestpossible powers for the ordinary and extraordinary management of the company and is specifically entitledto carry out all actions it deems useful to realise and reach the company objective, with the sole exclusionof actions reserved by law or by company Articles of Association, for the Shareholders’ Meeting.The Board of Directors in its decision on 30 April 2010, appointed Carlo Malacarne as Chief ExecutiveOfficer, thereby entrusting him with all the tasks and powers that are not reserved by law, companyArticles of Association, or by decision of the Board of Directors 37 itself, for the Board of Directors or theChairman.The Board also assigned the following tasks, powers and authorisations to the Chairman, SalvatoreSardo. In addition to the responsibilities attributed to him by law and by the Articles of Association, theChairman shall have the following powers:- he is the Company’s legal representative and deals with institutional bodies and authorities, togetherand in conjunction with the CEO;- calls and presides over board meetings and sets their agendas together with the CEO. Guides, overseesand coordinates the work of the board, ensuring its proper functioning and adequate disclosure bydirectors. Verifies the implementation of board decisions;35 Each shareholder may present or be involved in the presentation of only one list, and may vote for one list only.36 For further information on the personal and professional characteristics of the directors elected, please refer to the “Governance”section of the website of <strong>Snam</strong> S.p.A.37 These powers were later amended by the Board of Directors on 26 October <strong>2011</strong>.<strong>Snam</strong> <strong>Annual</strong> <strong>Report</strong> <strong>2011</strong>
<strong>Snam</strong> <strong>Annual</strong> <strong>Report</strong> <strong>2011</strong> / Information on corporate governance and ownership structure103- in consultation with the Internal Control Committee, assesses and contributes to the CEO’ssuggestions to the Board regarding the appointment, dismissal and remuneration of the head ofinternal control and the internal auditor;- assesses and contributes to the CEO’s suggestions to the Board regarding the appointment of generalmanagers, the chief financial officer, and members of the supervisory body, pursuant to LegislativeDecree no. 231 of 8 June 2001.During the same meeting, Marco Reggiani, the company’s Director of Corporate, Legal and ComplianceAffairs, was confirmed as the Secretary of the Board of Directors and on that same date the Boardintroduced a set of rules to regulate his work in this capacity.All candidates must also meet the honesty requirements provided for by current provisions.The Board shall periodically evaluate the independence and honesty of the directors, as well as the lackof grounds for ineligibility or conflict of interest.Pursuant to the terms of the company Articles of Association ‐ which are more favourable than thoseprovided for by law ‐ if there are no more than seven directors on the Board at least one must satisfythe independence criteria established for auditors of listed companies; however, with more thanseven directors on the board, at least three must satisfy the independence criteria.If one of the directors does not fulfil or no longer fulfils the established independence or integrityrequirements imposed by law, or if there are grounds for ineligibility or incompatibility, the Boardwill dismiss the director and arrange for him or her to be replaced, or will ask that the grounds ofincompatibility be removed within an established period of time, otherwise he or she must forfeit thepost.Directors’ independence and integrity as well as the inexistence of grounds for ineligibility andincompatibility is assessed following their appointment and at least once a year by the Board ofDirectors, based on information provided by the director himself or made available to the companyby other means. In its meeting of 13 February 2012, the Board of Directors noted that no grounds fordirector incompatibility or ineligibility existed and that the directors met the integrity requirements forsupervisory bodies established by Ministry of Justice Decree no. 162 of 30 March 2000.In the same meeting of 13 February 2012, the Board of Directors noted that the non-executive directorsDavide Croff, Roberto Lonzar, Renato Santini, Elisabetta Oliveri and Mario Stella Richter met theindependence requirements imposed by current legislation and the Code of Corporate Governance. TheBoard of Statutory Auditors also verified that the criteria and the assessment procedures adopted by theBoard of Directors were correctly applied.In accordance with the provisions of the Code of Corporate Governance, on 12 March 2012 the Board ofDirectors evaluated the size, composition and workings of the Board and its committees, using for thispurpose the services of Egon Zehnder International, an outside specialist.In the light of the results of Egon Zehnder International’s evaluation of the Board of Directors and itscommittees, the Board expressed a very positive opinion on the size, composition and workings of theBoard itself and its committees.The independent directors met in <strong>2011</strong>, in line with the Code of Corporate Governance, to approve thereport and discuss the issues of major importance. At the meeting, the plan for coming into line with theprovisions of Legislative Decree no. 93 of <strong>2011</strong> was outlined by the CEO and discussed. The statutoryauditors of <strong>Snam</strong> and the subsidiary <strong>Snam</strong> Rete Gas (then “<strong>Snam</strong> Trasporto”) were also invited to attendthe meeting. Meetings were also held with the managers of the company for directors and auditors inorder to examine specific issues regarding the business and relevant legislation. Lastly, the directors andthe auditors visited the storage plant in Sergnano (CR).<strong>Snam</strong> <strong>Annual</strong> <strong>Report</strong> <strong>2011</strong>
104<strong>Snam</strong> <strong>Annual</strong> <strong>Report</strong> <strong>2011</strong> / Information on corporate governance and ownership structureBoard of Statutory AuditorsIn compliance with the provisions of the law and the company Articles of Association, <strong>Snam</strong>’s Boardof Statutory Auditors is composed of three statutory auditors and two alternate auditors, who areappointed by the Shareholders’ Meeting for three-year terms and may be re-elected at the end oftheir term in office. Like the Board of Directors and in line with applicable provisions, the Articles ofAssociation provide for the auditors to be appointed by list vote, except when directors are replacedduring their term in office.On 27 April 2010 the Shareholders’ Meeting appointed the following auditors 38 for a period of three yearsor until the date of the Shareholders’ Meeting called to approve the 2012 financial statements: MassimoGatto (Chairman), Roberto Mazzei and Francesco Schiavone Panni (statutory auditors), and GiulioGamba and Luigi Rinaldi (alternate auditors). Roberto Mazzei, Francesco Schiavone Panni and GiulioGamba were elected from the list presented by Eni S.p.A.; Massimo Gatto and Luigi Rinaldi were electedfrom the list presented by a number of minority shareholders.Statutory auditors are chosen from among those who meet the professionalism and honesty requirementsindicated in Ministry of Justice Decree no. 162 of 30 March 2000. For the purposes of this decree, areasof the company’s business are commercial law, business administration and corporate finance. Likewise,the sector pertaining to its business is the engineering and geological sector.The Board of Statutory Auditors, based on its statements, has verified that all the members of the Boardsatisfy the independence requirements provided for by law, as well as those for directors contained inArticle 3 of the Code of Corporate Governance.Independent auditorsAs required by law, the company’s financial statements are audited by independent auditors includedin the relevant register and appointed by the Shareholder’s Meeting based on a proposal issued by theBoard of Statutory Auditors.On 27 April 2010, the Shareholders’ Meeting approved the proposal to revoke the appointment ofPricewaterhouseCoopers S.p.A. as auditors based on an “objective” and sound reason, in an effort toguarantee effective auditing of the company and avoid any misalignment in this role with respect to theultimate parent company Eni S.p.A.On the same date, the Shareholders’ Meeting appointed Reconta Ernst & Young S.p.A. to audit thecompany for the 2010-2018 period.RemunerationAs a consequence of the decision of the Board of Directors of 19 December <strong>2011</strong>, <strong>Snam</strong> has implementedthe recommendations on directors’ remuneration set forth in the Code of Corporate Governance, asmost recently amended in the latest edition of December <strong>2011</strong>, including the measure on the exemptionof vested rights deriving from contracts entered into or regulations approved prior to 31 March 2010.When adopting the new recommendations, <strong>Snam</strong>’s Board of Directors also:- amended the Regulation of the Compensation Committee, to bring the provisions on the compositionand duties of said committee into line with the new recommendations;- resolved to defer the approval of the Remuneration Policy until 12 March 2012, which is the date setfor the approval of the Remuneration <strong>Report</strong> as required by Article 123-ter of the TUF, consideringthat the first section of the <strong>Report</strong> describes the remuneration policy adopted and that, at the dateof the aforesaid board resolution, Consob’s guidelines detailing the specific content of the <strong>Report</strong>, inimplementation of the aforesaid Article 123-ter, had not yet been definitively published.38 For further information on the personal and professional characteristics of the statutory auditors elected, please refer to the“Governance” section of the <strong>Snam</strong> S.p.A. website.<strong>Snam</strong> <strong>Annual</strong> <strong>Report</strong> <strong>2011</strong>
<strong>Snam</strong> <strong>Annual</strong> <strong>Report</strong> <strong>2011</strong> / Information on corporate governance and ownership structure105At its meeting of 12 March 2012 the Board of Directors approved the Remuneration <strong>Report</strong> required byArticle 123-ter of the TUF, which will be submitted the Shareholders’ Meeting. The report contains, interalia, the Remuneration Policy for the Chairman, CEO and other managers with strategic responsibilities.The Remuneration <strong>Report</strong> prepared in accordance with Article 123-ter of the TUF can be found in the“Governance” section of the Company’s website.DECLARATION BY THE MANAGEMENT BODY REGARDING SATISFACTION OF THEREQUIREMENTS PROVIDED FOR IN ARTICLE 37 OF CONSOB REGULATION 16191/07At its meeting of 13 February 2012 the Board of Directors verified, as had already been done duringthe course of the previous year, that <strong>Snam</strong> satisfies the requirements listed in Article 37, paragraph 1 ofConsob Regulation 16191/07 and successive amendments and additions thereto for the admission, onan Italian regulated market, of the shares of subsidiaries subject to management and coordination byanother company. The statement by the Board of Directors that the centralised treasury arrangementbetween <strong>Snam</strong> and its ultimate parent Eni S.p.A. is in the company’s interest was confirmed by the Boardof Statutory Auditors.COMMITTEES ESTABLISHED BY THE BOARD OF DIRECTORSFor more efficient performance in its duties, in accordance with the Code of Corporate Governance theBoard of Directors has established three committees: The Compensation Committee, the AppointmentsCommittee and the Internal Control Committee The composition, duties and functioning of thecommittees are decided by the Board of Directors through specific regulations (available in the Governancesection of the Company’s website), in line with the requirements of the Code.Furthermore, pursuant to Article 16 of the Articles of Association, the Combined IndependentManagement Committee has been created.1) The Compensation Committee consists of three non-executive directors, two of whom areindependent, including the Chairman Davide Croff. The other members are Alessandro Bernini andElisabetta Oliveri. The Committee has the following responsibilities in terms of making proposals andproviding advice to the Board on directors’ remuneration:- to submit the Remuneration <strong>Report</strong> for the approval of the Board of Directors, with particularregard to the Remuneration Policy for directors and managers with strategic responsibilities, sothat it may be presented to the Shareholders’ Meeting called to approve the financial statementswithin the time limits set by law;- The Board shall periodically evaluate the independence and honesty of the directors, as well asthe lack of grounds for ineligibility or conflict of interest;- to make proposals relating to the remuneration of the Chairman and the Chief Executive Officer,concerning the various forms of compensation and remuneration;- to make proposals on the remuneration of the members of the directors’ committees establishedby the board;- to make proposals, having considered the recommendations of the CEO, regarding the generalcriteria for the remuneration of managers with strategic responsibilities, annual and long-termincentive plans including those based on equity; to define performance objectives and record theresults of performance plans in order to determine the variable remuneration of directors withspecific responsibilities and the implementation of incentive plans;- to monitor the implementation of the decisions taken by the Board of Directors;- to report to the Board on its activities every six months.The Committee also provides any procedurally required opinions on transactions with related partieswithin the time limits set forth in the relevant procedure.<strong>Snam</strong> <strong>Annual</strong> <strong>Report</strong> <strong>2011</strong>
106<strong>Snam</strong> <strong>Annual</strong> <strong>Report</strong> <strong>2011</strong> / Information on corporate governance and ownership structureIn accordance with the decision of the Board of Directors on 30 April 2010, each year the CompensationCommittee reviews the remuneration structure for the Head of Internal Control and the InternalAuditor, checking that it meets the general criteria approved by the Board for all managers andinforming the Chairman of the Internal Control Committee of its findings so that he, in turn, mayreport on the matter to the Board.2) The Appointments Committee, created by the Board on 26 October <strong>2011</strong>, is made up exclusivelyof non-executive and independent directors. Its members are: Davide Croff, Roberto Lonzar andRenato Santini. Davide Croff chairs the Committee. The Appointments Committee makes proposalsand provides advice to the Board of Directors.The Committee has the following tasks:- to submit to the Board of Directors, upon proposal of the CEO, the candidates for the replacementof the corporate bodies. The Committee’s proposal is binding;- to develop and propose: a) annual self-assessment procedures for the Board of Directors andits committees; b) directives on the limits and rules against the accumulation of positionsby the directors of <strong>Snam</strong> and its subsidiaries; c) criteria for assessing the professional andindependence requirements that apply to directors of <strong>Snam</strong> and its subsidiaries, and theircompetitive activities;- to report to the Board on its activities every six months.3) The Internal Control Committee, which is made up of three non-executive independent directors,as defined by the Code of Corporate Governance for Listed Companies, advises and assists the Boardof Directors with regard to overseeing the general performance of the company. Specifically, theCommittee’s tasks are, inter alia, as follows:- to evaluate, together with the Chief Financial Officer and the independent auditors, the properuse of accounting standards and their consistency for purposes of preparing the consolidatedfinancial statements;- on request from the Chairman or CEO, to express its opinion on specific aspects involved inidentifying the main business risks, as well as the planning, implementation and management ofthe internal control system;- to examine the work plan prepared by the Internal Auditor, as well as its periodic reports, at leastevery six months, on the activities carried out;- performs the other duties entrusted to it by the Board of Directors; in particular, it expresses anopinion on the transparency rules and substantial and procedural correctness of transactions withrelated parties and transactions in which a director has an interest either on his/her own behalfor that of third parties.4) Resolution ARG/com 57/2010 of the Electricity and Gas Authority, amending Resolution 11/07 onthe functional separation of regulated activities in the natural gas sector, established that, pursuantto and in accordance with Article 9 of Regulation 11/2007 (the “Consolidated Unbundling Act”), theactivities of natural gas storage, regasification, transportation, dispatch, distribution and meteringmay be managed jointly, and are not subject to functional unbundling obligations.Through the decision of 27 July 2010, the Board of Directors established the Combined IndependentManagement Committee (“the Management Committee”) pursuant to Article 9 of the ConsolidatedUnbundling Act. The Management Committee oversees the joint management of natural gastransportation and dispatch, distribution, storage and regasification activities, and is composed of thepersons who, pro tempore, fill the following positions:- CEO of <strong>Snam</strong>;<strong>Snam</strong> <strong>Annual</strong> <strong>Report</strong> <strong>2011</strong>
<strong>Snam</strong> <strong>Annual</strong> <strong>Report</strong> <strong>2011</strong> / Information on corporate governance and ownership structure107- CEO of <strong>Snam</strong> Rete Gas S.p.A. 39 ;- CEO of GNL Italia;- CEO of Italgas;- CEO of Stogit.The Board has conferred all powers on the Committee to perform its functions. The CombinedIndependent Management Committee has adopted its own operating regulations.The Chief Executive Officer of <strong>Snam</strong> chairs the Management Committee and represents the organisationalstructure within the Management Committee responsible for expressing opinions binding on the Boardof Directors in compliance with and for the purposes cited in Article 11.5, letter c) of the ConsolidatedUnbundling Act, for all decisions taken by the said body affecting the business’ managerial andorganisational aspects; on any decisions that could have a direct or indirect effect on the independenceof the transportation system; and to approve the development plan cited in paragraph 11.1, letter b),point i) of the Consolidated Unbundling Act.The Management Committee appointed the Supervisor, in the person of <strong>Snam</strong>’s Head of Complianceand Assurance, who is responsible for the correct management of commercially sensitive informationin the context of natural gas transportation, dispatch, distribution, storage and regasification activities,in line with his appointment as Head of Compliance at the subsidiary <strong>Snam</strong> Rete Gas, wherein he alsoensures that the Supervisor’s task are carried out.IMPLEMENTATION OF LEGISLATIVE DECREE NO. 93 OF 1 JUNE <strong>2011</strong> AND CONSEQUENTORGANISATIONAL STRUCTURE OF SNAM AND ITS SUBSIDIARIESLegislative Decree No. 93 of 1 June <strong>2011</strong> on the “Implementation of Directives 2009/72/EC, 2009/73/EC and 2008/92/EC concerning common rules for the internal market in electricity and natural gas and aCommunity procedure to improve the transparency of gas and electricity prices charged to industrial endusers, repealing Directives 2003/54/EC and 2003/55/EC” (the “Decree”) saw the transposition by Italianlegislation of Directive 2009/73/EC, which introduced new provisions on the separation of operators ofnatural gas transportation systems from the other activities in the gas supply chain.The Decree provides that the major transportation company shall comply with the rules governing an“Independent Transmission Operator” (ITO, hereinafter the “Operator”).According to the rules governing the ITO model, in order to demonstrate the separation of the Operatorfrom the vertically integrated corporation, the Operator’s compliance with the requirements of theDecree must be certified by the Electricity and Gas Authority.Furthermore, the Decree: (i) confirmed the system of commercial and functional unbundling of distributionactivities, as already provided by Directive 2003/55/EC; (ii) enforced the commercial unbundling of thetransportation network from the ownership structure in the cases where the transportation network hadadopted the ISO model (designed for minor transportation companies); and (iii) confirmed, with regardto regasification, the principle of unbundling the accounts of LNG activities from the other activities ofthe gas supply chain and identified the duties of the manager of the LNG system.Having obtained this certification, the Operator is approved and appointed by the Ministry for EconomicDevelopment as the “Manager of the Transportation System”. The appointment is notified to theEuropean Commission and published in the Official Journal of the European Union.39 From 1 January 2012, <strong>Snam</strong>’s Chief Operating Officer was replaced by the CEO of <strong>Snam</strong> Rete Gas S.p.A. The position ofChief Operating Officer was abolished on the same date.<strong>Snam</strong> <strong>Annual</strong> <strong>Report</strong> <strong>2011</strong>
108<strong>Snam</strong> <strong>Annual</strong> <strong>Report</strong> <strong>2011</strong> / Information on corporate governance and ownership structureIn order to comply with the Decree, <strong>Snam</strong>’s Board of Directors decided that the most efficientway to proceed was to transfer the transportation, dispatch, remote control and meteringbusiness unit to its wholly-owned subsidiary <strong>Snam</strong> Rete Gas S.p.A. (named “<strong>Snam</strong> Trasporto” until31 December <strong>2011</strong>), on behalf of which certification as an Independent Transmission Operator wasthen requested.The deed of transfer was signed on 21 December <strong>2011</strong>, which would take effect on 1 January 2012subject to the approval of the Shareholders’ Meeting held on 5 December <strong>2011</strong> pursuant to the Articlesof Association (Article 12.2).As a result of the ensuing corporate reorganisation, an organisational structure was created which, inorder to reinforce the functional unbundling from the vertically integrated company (Eni), is made up offour operating companies that are direct subsidiaries of <strong>Snam</strong> (GNL Italia, Italgas, <strong>Snam</strong> Rete Gas andStogit, alongside the indirect subsidiary Napoletanagas), which are focused on the management anddevelopment of their respective businesses, plus a corporate company (<strong>Snam</strong>), which is responsible for:(a) the strategy, management and control of the subsidiaries;(b) providing support services to the subsidiaries (including by taking over the services previouslyprovided by Eni and its subsidiaries) in accordance with the rules of the Decree, in order to retain thelevels of operating efficiency obtained following the acquisitions of Italgas and Stogit during 2009.In accordance with the provisions of the Decree, <strong>Snam</strong> Rete Gas has been given a system of governance 40 ,responsibilities and organisational structures that are in line with the Decree’s specific requirements,including in terms of personnel and asset ownership.INTERNAL CONTROL SYSTEM<strong>Snam</strong> has adopted an internal control system conforming to the prescriptions of the Code of CorporateGovernance for Listed Companies and in line with the current best practices. The purpose of the controlsystem is: (i) to ensure the suitability of various company processes in terms of effectiveness, efficiencyand affordability; (ii) to ensure the reliability and accuracy of accounting entries and the protection ofthe company’s assets; and (iii) to ensure that operating performance complies with internal and externalregulations, directives and company guidelines aimed at guaranteeing sound and proper businessmanagement.Responsibility for the internal control system lies with the Board of Directors which, with the assistanceof the Internal Control Committee, prepares guidelines for the system and periodically verifies that it isadequate and functioning efficiently, thereby ensuring that the principal business risks are identified andmanaged appropriately.40 <strong>Snam</strong> Rete Gas (like the other subsidiaries of <strong>Snam</strong>) retains the traditional governance model with the three basic functionsof supervision, management and compliance set out in its Articles of Association, which provide, inter alia, that:(i) the Board of Directors also acts as the Supervisory Body required by Article 14 of the Decree, taking decisions which havea significant impact on the value of shareholders’ equity. The number of members of the Board of Directors is set at five,the majority of whom meet the independence requirements set out in the Decree (including the Chairman of the Boardof Directors);(ii) The Chief Executive Officer and the General Manager (a Company director appointed by the Board of Directors in itsrole as Supervisory Board, upon proposal of the CEO) perform the functions reserved by the Decree to the Heads ofOperations.Furthermore, the Head of Compliance (who is appointed by the Board of Directors in its capacity as Supervisory Body,subject to the approval of the Electricity and Gas Authority) is charged with monitoring the Compliance Programme andthe ten-year infrastructure development plan and must report to the Electricity and Gas Authority.The task of auditing the company has been assigned to different independent auditors to those used by Eni and <strong>Snam</strong>, giventhe ban on the Management Committee having the same independent auditors as the vertically integrated company (Eni),as set out in the Decree.<strong>Snam</strong> <strong>Annual</strong> <strong>Report</strong> <strong>2011</strong>
<strong>Snam</strong> <strong>Annual</strong> <strong>Report</strong> <strong>2011</strong> / Information on corporate governance and ownership structure109The Chief Executive Officer is responsible for implementing the guidelines prepared by the Board ofDirectors by designing, managing and monitoring the internal control system. In accordance with theproposal put forth in this regard by the Code of Corporate Governance, on 11 December 2008 the Boardof Directors appointed the Chief Executive Officer as executive director responsible for overseeing thefunctionality of the internal control system.On 30 April 2010 the Board, complying with the recommendations of the Code of Corporate Governance,also confirmed the appointment of the head of internal auditing for the company as Head of InternalControl, reporting to the Chief Executive Officer. In order to ensure the necessary independence, theappointment, dismissal and remuneration of the Head of Internal Control are approved by the Board ofDirectors, which also approves the programme and budget for internal auditing activities.The Head of Internal Control reports regularly on his actions to the CEO, as well as every six months(unless circumstances require a more timely report) to the Internal Control Committee and the Boardof Statutory Auditors.Applying the control system is the primary responsibility of the functional management insofar ascontrol activities are an integral part of management procedures. Management must therefore foster anenvironment which encourages controls and must specifically manage “line controls,” consisting of allthe control activities that individual operating units or companies perform over their own procedures.The Internal Audit is responsible for verifying the adequacy of the internal control system and ensuringthat it provides reasonable guarantees that the organisation is able to pursue its objectives economicallyand efficiently; to this end, it monitors the effectiveness of the controls applied by proposing suggestionsand corrective actions to management to resolve any deficiencies identified.The Articles of Association also provide for the Board of Directors to appoint the Chief FinancialOfficer, on the proposal of the Chief Executive Officer, by agreement with the Chairman and based ona favourable opinion from the Board of Statutory Auditors.On 29 October 2007 the Board of Directors, in compliance with the professionalism requirementsestablished by the Articles of Association, on the proposal of the Chief Executive Officer, by agreementwith the Chairman and based on a favourable opinion from the Board of Statutory Auditors, appointedDr Antonio Paccioretti, Planning, Administration, Finance and Control Manager of <strong>Snam</strong>, as ChiefFinancial Officer. At a meeting on 12 March 2012, the Board of Directors also verified the adequacy ofthe powers and resources at the disposal of the CFO to perform the duties assigned, as well as to observethe existing administrative and accounting procedures.The internal control system is subject over time to verification and updating, in order to continuallyensure its suitability and protect the main areas of risk among the company’s activities, with respect tothe characteristics of its operating sectors and its organisational configuration, and in keeping with anynew legislative or regulatory developments.PRINCIPAL CHARACTERISTICS OF THE RISK MANAGEMENT AND INTERNAL CONTROL SYSTEM INTHE FINANCIAL REPORTING PROCESSThe financial information internal control system is the process aimed at providing a reasonablecertainty of the reliability 41 of said financial information and of the capability of the financial statementpreparation process to produce financial information in keeping with generally accepted accountingprinciples.41 Reliability (of the information): information characterised by accuracy and compliance with generally accepted accountingprinciples which meets the legal and regulatory requirements applied.<strong>Snam</strong> <strong>Annual</strong> <strong>Report</strong> <strong>2011</strong>
110<strong>Snam</strong> <strong>Annual</strong> <strong>Report</strong> <strong>2011</strong> / Information on corporate governance and ownership structure<strong>Snam</strong> has adopted a body of rules that define the standards, methodologies, roles and responsibilitiesfor designing, implementing and maintaining the system of internal controls over time on the corporatereporting of <strong>Snam</strong> and its subsidiaries, and on the evaluation of its efficacy.The body of procedures for the corporate reporting control system was defined in accordance with theprovisions of Article 154-bis of the TUF and takes into account the prescriptions of the U.S. Sarbanes-Oxley Act of 2002 (SOA), which apply to the ultimate parent Eni S.p.A. in its capacity as an issuerlisted on the New York Stock Exchange (NYSE) and which have repercussions for <strong>Snam</strong> as a significantsubsidiary.The internal control model for corporate information adopted by <strong>Snam</strong> is based on the COSO <strong>Report</strong>(“Internal Control – Integrated Framework” published by the Committee of Sponsoring Organisations ofthe Treadway Commission).In addition to <strong>Snam</strong>, the control model is applied to its subsidiaries pursuant to international accountingstandards and based on their relevance in the preparation of financial information. <strong>Snam</strong> subsidiariesadopt the control model defined as a reference to design and institute their own control system andtailor it to their size and the complexity of the activities they undertake.The design, institution and maintenance of the control system are ensured by risk assessment,identification and evaluation of controls, and reporting.Controls are subject to evaluation in order to verify the quality of their design over time and theiroperational effectiveness; to this end, line monitoring has been entrusted to the management responsiblefor significant processes/activities, and independent monitoring has been entrusted to the internal auditdepartment.The results of the monitoring activities form the subject of periodic reporting on the status ofthe control system, which involves all levels of <strong>Snam</strong>’s organisational structure and its significantsubsidiaries, from business operation heads and function heads to administrative directors and ChiefExecutive Officers.Evaluations of all the controls implemented within <strong>Snam</strong> and its subsidiaries are brought to the attentionof the Chief Financial Officer, who, on the basis of this information, prepares a half-yearly report on theadequacy and effective application of the control system, which is shared with the Chief ExecutiveOfficer.CODE OF ETHICSOn 12 June <strong>2011</strong>, the Board of Directors updated the Code of Ethics, which incorporates the mostmodern guidelines on business ethics and sustainability in a manner that is fully consistent with theobjective of including all the values that the Company recognises, accepts and shares, as well as theresponsibilities that it assumes inside and outside the company.The <strong>Snam</strong> Code of Ethics includes a special Addendum which considers the specifics of the activitiesengaged in by <strong>Snam</strong> and its Subsidiaries, which are subject to regulation by the Electricity and GasAuthority. Special emphasis is given to relationships with the Electricity and Gas Authority and tounbundling regulations.The functions of Supervisor of the Code of Ethics were assigned to the Supervisory Body, to which thefollowing may be submitted:- requests for clarification or interpretation of the principles and contents of the Code;- suggestions relating to the application of the Code;- reports of violations of the Code that have been determined directly or indirectly.<strong>Snam</strong> employees, without distinction or exception, have the duty to comply and ensure compliancewith these principles within the scope of their functions and responsibilities. Under no circumstancescan any conduct contrary to these principles be justified by the belief that one is acting in the company’sinterests.<strong>Snam</strong> <strong>Annual</strong> <strong>Report</strong> <strong>2011</strong>
<strong>Snam</strong> <strong>Annual</strong> <strong>Report</strong> <strong>2011</strong> / Information on corporate governance and ownership structure111MODEL 231Legislative Decree no. 231 of 8 June 2001 introduced the rules on the administrative liability ofcompanies under which they can be held liable, and consequently punished, for offences committedor attempted in the interest or for the benefit of the company by persons who are entrusted withthe representation, administration or management of the company or of a financially and functionallyautonomous subsidiary thereof, as well as by persons who exert management and control on a de factobasis (“top management”) or by persons who are subject to the authority of or control by one of theaforesaid persons (“persons subject to the management of others”). The Company is not liable if it hasadopted and effectively implemented, before the commission of the offences, appropriate organisation,management and control models to prevent such offences and has set up a body responsible foroverseeing the functioning of the models and compliance with them.In this regard, <strong>Snam</strong> and its subsidiaries have implemented the legal provisions by adopting its ownorganisation, management and control model commensurate with its particular nature, and byappointing for each of them a Supervisory Body responsible for monitoring the implementation andeffective application of the Model.A multi-functional “Team 231” was formed to identify and develop the activities necessary for updatingthe company and subsidiaries’ Model 231 by incorporating both new legislative developments in thefield of application of Legislative Decree no. 231 of 8 June 2001, as well as organisational changesresulting from the acquisition of Italgas and Stogit.Team 231, assisted by PriceWaterhouse Coopers as administrative liability and compliance expert andtechnical/methodological consultant, has updated the Model 231 of <strong>Snam</strong> S.p.A. and each of its subsidiaries.The Supervisory Body of <strong>Snam</strong> consists of the Head of HR, Organisation and Security, the Internal Auditor,the Head of Compliance and Assurance and two external members, one of whom acts as Chairman.ANTI-CORRUPTION GUIDELINES<strong>Snam</strong> has long attributed primary importance to the issue of fighting corruption, most recently with theapproval, by the Board of Directors, of the Anti-Corruption Guidelines aimed at enshrining the internalrules on fighting corruption – along with the procedures which govern in detail the “at-risk” activities(“Ancillary Anti-Corruption Procedures”) – within a systematic reference framework, ensuring maximumcompliance by <strong>Snam</strong> and its personnel with the Code of Ethics, Model 231 and national and internationalanti-corruption laws. In compliance with international best practices, two measures have been taken: ananti-corruption unit has been set up within <strong>Snam</strong>’s Legal and Corporate Affairs and Compliance Division,whose task is to provide support on this issue to the business units of <strong>Snam</strong> and its subsidiaries, and atargeted e-learning training initiative has been launched together with lectures on the subject for newlyhiredstaff.At a meeting on 10 February 2010, the <strong>Snam</strong> Board of Directors adopted the “Anti-CorruptionGuidelines” (incorporating the equivalent policy introduced by ultimate parent Eni). In the meeting of13 February 2012, the Board of Directors authorised the CEO to adopt and update the ManagementSystem Model on compliance, bearing in mind the incorporation of Eni’s equivalent policy (relating, interalia, to matters connected to combating corruption).PROCEDURE FOR “TRANSACTIONS IN WHICH DIRECTORS AND STATUTORY AUDITORS HAVE ANINTEREST, AND TRANSACTIONS WITH RELATED PARTIES”Through Resolution 17221 of 12 March 2010, amended by Resolution 17389 of 23 June 2010, Consobapproved the regulations on related-party transactions carried out, directly or through subsidiaries, bylisted companies and by public share issuers with persons with potential conflicts of interest, such asmajor or controlling shareholders, directors, statutory auditors and other executives, and their closefamily members.<strong>Snam</strong> <strong>Annual</strong> <strong>Report</strong> <strong>2011</strong>
112<strong>Snam</strong> <strong>Annual</strong> <strong>Report</strong> <strong>2011</strong> / Information on corporate governance and ownership structureThe reform of company law (Article 2391-bis of the Italian Civil Code) gave Consob, in its role as thesupervisory and regulatory body for the financial markets, the task of establishing general regulatoryprinciples in order to “ensure the transparency and substantial and procedural correctness of transactionswith related parties”.The measure aims to provide better protection to minority shareholders and other stakeholders bycombating any abuses which might arise from related-party transactions with a potential conflict ofinterest. These include, by way of example, mergers, acquisitions, disposals and reserved capital increases.In short, the regulation provides for:a) a stronger role for independent directors in all the decision-making processes of related-partytransactions;b) a system of transparency.On 30 November 2010, the Board of Directors approved the procedure on “Transactions in whichDirectors and Statutory Auditors have an interest, and Transactions with Related Parties”. The procedureapplies from 1 January <strong>2011</strong> and is adopted pursuant to Article 2391-bis of the Italian Civil Code andthe Consob Regulation 17221 “Regulation on transactions with related parties”, of 12 March 2010 (asamended).At the meeting of 13 February 2012, the Board of Directors made its first annual check on the effectivenessof the procedure, as required in said procedure and ahead of the three-year deadline set by Consob.The Board approved a number of amendments to take account of specific operating requirements thatemerged during the first year of its application, as well as the modified organisational structure of <strong>Snam</strong>and its subsidiaries.The procedure has been provisionally and unanimously approved by <strong>Snam</strong>’s Internal Control Committeewhich, pursuant to Borsa Italiana’s Code of Corporate Governance and the aforesaid Regulation, iscomposed entirely of independent directors.TREATMENT OF COMPANY INFORMATIONIn compliance with the legislative provisions on Market Abuse, on 13 February 2012 the Board of Directorsupdated the “Procedure for communication to the market of privileged information and documentsconcerning <strong>Snam</strong> and the financial instruments issued by it”, the “Procedure concerning the identificationof relevant persons and the communication of transactions carried out by them, including via nominees,in relation to shares issued by <strong>Snam</strong> or other financial instruments connected with such shares” (“InternalDealing Procedure”) and the procedure “Keeping and updating of the register of persons who have accessto privileged information within <strong>Snam</strong>”. 42 In particular, the Internal Dealing Procedure identifies (i) therelevant persons, (ii) the transactions subject to a communication requirement, and (iii) the conductrequirements for such communication.RIGHTS OF SHAREHOLDERSIn order to involve shareholders in company life, <strong>Snam</strong> has taken various measures designed to ease theparticipation of shareholders in making decisions reserved to the Shareholders’ Meeting, making it easierfor them to exercise their rights. Specifically, during 2010 <strong>Snam</strong> amended its Articles of Association inlight of the transposition in Italy of Directive 2007/36/EC, relating to the exercise of certain rights ofshareholders in listed companies (the “Shareholders’ Rights Directive”) 43 .By taking measures which the legislation leaves to companies’ choice, <strong>Snam</strong> aimed to provide its42 These procedures, which replace those adopted by the Board of Directors on 17 March 2006 and amended on 27 October2010, are published in the “Governance” section of the Company’s website at: http://www.snam.it.43 The Directive was transposed through Legislative Decree no. 27 of 27 January 2010.<strong>Snam</strong> <strong>Annual</strong> <strong>Report</strong> <strong>2011</strong>
<strong>Snam</strong> <strong>Annual</strong> <strong>Report</strong> <strong>2011</strong> / Information on corporate governance and ownership structure113shareholders with additional tools to encourage them to take part in shareholders’ meetings and exercisetheir voting rights (e.g. appointment of the Listed Company’s Proxy Holder).In 2010 the website was enhanced and now features the “Shareholders’ Guide” 44 , including an interactiveversion, which aims to provide a summary of useful information which will give all shareholders a moreactive experience in their <strong>Snam</strong> investment.44 The Shareholders’ Guide is published in the “Investor Relations” section of the Company’s website at: http://www.snam.it.<strong>Snam</strong> <strong>Annual</strong> <strong>Report</strong> <strong>2011</strong>
Commitment to sustainabledevelopment
116<strong>Snam</strong> <strong>Annual</strong> <strong>Report</strong> <strong>2011</strong> / Commitment to sustainable developmentTHE SUSTAINABILITY MODEL<strong>Snam</strong> considers sustainability to form an integral part of its business model. It is in fact a leading factorin defining the company’s strategic and operational decisions and a lever for long-term sustainablegrowth. Meanwhile it delivers the shareholders’ expected results, sharing the value generated with all ofits stakeholders including in terms of environmental and social issues.The Company bases the day-to-day conduct of its activities on the principles set out by internationalbodies and conventions on the protection of human rights, employment and trade union rights,health, safety and environmental rights, repudiation of forced labour, child labour and any form ofdiscrimination, and on conformity with values and principles concerning fairness, transparency andsustainable development. These principles are listed in the Code of Ethics adopted by all the companies,which are fundamental in orientating the conduct of personnel and for responsible management ofrelationships with the stakeholders.In order to give greater visibility to this commitment <strong>Snam</strong> is a signatory to the UN Global Compact.This international initiative upholds ten universal principles concerning human rights, employment, theenvironment and the fight against corruption, and brings together governments, businesses, UnitedNations agencies, labour organisations and civil associations, with the aim of contributing to thecreation of a more inclusive and sustainable global economy. <strong>Snam</strong>’s commitment to Global Compactalso continued in <strong>2011</strong> with numerous activities for engagement and proliferation of the ten principlesby participating both actively as a member of the Global Compact Network Italy in the meetings of theEnvironment and Human Rights Working Groups and in specific initiatives aimed at its stakeholders.The <strong>Snam</strong> sustainability management model extends to all group companies and is integrated into allphases of the corporate business process (Planning, Management, Control, <strong>Report</strong>ing and Communication).The Board of Directors takes on a central role in defining the policies, while the Sustainability objectives,submitted for the approval of top management, are pursued by means of specific short- and mediumtermprojects and initiatives included in the company’s action plan. All of the activities provided for bythe model are coordinated by the <strong>Snam</strong> sustainability office with the participation of the various <strong>Snam</strong>offices and subsidiaries.<strong>Snam</strong> publishes its sustainability balance sheet annually, which is considered to be an importantinstrument for strategic control and communication with stakeholders. The balance sheet, approved bythe Board of Directors at the same time as the annual financial report, examines the activities carriedout according to economic efficiency, environmental protection and social protection, providing theperformance indicators on which the business is measured and compared publicly.The results achieved and maintained over time have enabled the <strong>Snam</strong> stock to maintain its position inthe main ethical indices such as the Dow Jones Sustainability Index World, the FTSE4Good Europe Index,the FTSE4Good Global Index and the ECPI Ethical Index Euro. In <strong>2011</strong> the <strong>Snam</strong> stock came to formpart of the Stoxx Global ESG Leaders indices, a new group of indices based on a transparent process ofselection of the performance, in terms of sustainability, of 1,800 companies listed worldwide.PEOPLE AND ORGANISATIONDuring <strong>2011</strong> initiatives continued in support of the merger between <strong>Snam</strong> Rete Gas, Italgas, Stogit andGNL Italia, with the aim of improving the overall efficiency of the system, protecting and developingbusiness know-how in support of the business strategies.<strong>Snam</strong> <strong>Annual</strong> <strong>Report</strong> <strong>2011</strong>
<strong>Snam</strong> <strong>Annual</strong> <strong>Report</strong> <strong>2011</strong> / Commitment to sustainable development117June <strong>2011</strong> also featured the publication of Legislative Decree no. 93 of 1 June <strong>2011</strong>, which introduced EUDirectives concerning the Third Energy Package, for the creation of a continental network to guaranteesafety in gas supply.In <strong>2011</strong> initiatives were conceived and realised aimed at aligning the group’s corporate structure to theobligations set out in EU Directives, with the aim of reinforcing the know-how of the individual operatingcompanies.The group’s new configuration (in place from 1 January 2012), as well as delivering a series of centralisedservices, gave the <strong>Snam</strong> management the roles of strategically addressing, heading and coordinating thefollowing business activities: transportation, distribution and storage of natural gas and regasification ofliquefied natural gas.EmploymentAt 31 December <strong>2011</strong>, the <strong>Snam</strong> group had 6,112 employees in service. The analysis by contractualcategory and by companies included in the scope of consolidation is given in the tables below:Personnel by company (number) 2009 2010 <strong>2011</strong> Change<strong>Snam</strong> Rete Gas 2,254 2,636 2,755 119GNL Italia 87 70 74 4Italgas (*) 3,545 3,119 3,005 (114)Stogit 301 279 278 (1)6,187 6,104 6,112 8(*) Includes personnel in service at Napoletanagas, a wholly-owned subsidiary.Personnel by position (number) 2009 2010 <strong>2011</strong> ChangeExecutives 121 116 118 2Managers 493 508 544 36Office workers 3,320 3,243 3,277 34Manual workers 2,253 2,237 2,173 (64)6,187 6,104 6,112 8In <strong>2011</strong> personnel in service recorded an increase of eight employees, from 6,104 at 31 December 2010to 6,112 at 31 December <strong>2011</strong>. This trend shows that the rationalisation and efficiency measures madeto the organisational structures have offset the inclusions implemented throughout the group (fromthe labour market and for acquisition of business units) in the adjustment plan to the provisions ofLegislative Decree no. 93 of 1 June <strong>2011</strong>, in particular for ensuring the operations and services previouslyacquired from the vertically integrated company or from its subsidiaries.More specifically, the employment figures recorded during <strong>2011</strong> can be summarised as follows:- increase of 140 persons due to hirings coming in from the market (including 51 graduates);- increase of 108 persons through the acquisition of businesses (“Unbundled ICT” from Eni S.p.A.and “Unbundled Companies Administrative Services” from Eni Adfin S.p.A.) and as a result of themovements of managerial jobs in companies of Eni S.p.A. or subsidiaries of the <strong>Snam</strong> group;- reduction of 240 persons following termination of employment.Personnel on permanent contracts amount to 95% of the total, while 211 have an apprenticeship orinternship contract; 53% of the workforce is employed in northern Italy, 21% in the centre of thecountry and 26% in the south and Sicily.<strong>Snam</strong> <strong>Annual</strong> <strong>Report</strong> <strong>2011</strong>
118<strong>Snam</strong> <strong>Annual</strong> <strong>Report</strong> <strong>2011</strong> / Commitment to sustainable developmentDISTRIBUTION OF EMPLOYEES BY GEOGRAPHICAL AREA (number)NorthCentreSouth and Sicily3,2331,2731,606DISTRIBUTION OF EMPLOYEES BY AGE GROUP (number)< 2525-2930-3435-3940-4445-4950-5455-59> 601441901782536801,4981,8431,152174Personnel with degrees account for 10.5% of the total, and those with diplomas 51.7%; the average ageof employees of the group is 48 years, and the average length of service is around 23 years. Due to themanagement policies applied, these values are essentially stable.In 2010, 10.5% of all employees were women, a significant increase compared with 9.6% in 2010, whilethe percentage of female managers was 11.5%, an increase compared with 10% in 2010.PERCENTAGE OF FEMALE PERSONNEL (%)19.419.120.9managersexecutives5.86.06.810.311.212.5workers2009 2010 <strong>2011</strong><strong>Snam</strong> <strong>Annual</strong> <strong>Report</strong> <strong>2011</strong>
<strong>Snam</strong> <strong>Annual</strong> <strong>Report</strong> <strong>2011</strong> / Commitment to sustainable development119OrganisationThe principal organisational changes implemented during the course of <strong>2011</strong> were as follows:- a process for the reorganisation of Italgas operations, which involves the management of site anddistrict processes (guidance, monitoring, control) and of operational activities with multiple resourcesthroughout the territory;- based on the new concession regulations in the gas distribution market, a management reviewprocess was initiated which aims to configure the company according to new local areas;- the project for internalising and coordinating Stogit maintenance activities was brought to aconclusion.Based on the enactment of the Third Energy Package, a significant reorganisation of <strong>Snam</strong> and itssubsidiaries was implemented, and as a result the new corporate structure came into force with effectfrom 1 January 2012. The new structure places <strong>Snam</strong> S.p.A. at the head of the group, controlling thefour operating companies (<strong>Snam</strong> Rete Gas S.p.A., Gnl Italia S.p.A., Stogit S.p.A. and Italgas S.p.A.). Thisarrangement involves:- the transfer of the natural gas transportation, dispatch, remote control and metering business unitfrom <strong>Snam</strong> to <strong>Snam</strong> Rete Gas, with effect from 1 January 2012;- focus on <strong>Snam</strong> in the corporate role (strategic guidelines, coordination/control of group activitiesand provision of central services) and the reinforcement, for the subsidiaries, of the main supportprocesses, in addition to the traditional business management;- the termination of service agreements with Eni or with its subsidiaries;- acquisition of the Eni Adfin business unit which handles the accounting and administration of <strong>Snam</strong>and its subsidiaries (1 November <strong>2011</strong>);- acquisition of the Eni business unit which handles the ICT services of <strong>Snam</strong> and its subsidiaries (1November <strong>2011</strong>);- acquisition of the Eni servizi S.p.A. business unit operating in general services, in particular buildingservices (during 2012).The gas market balancing system launched on 1 December. The system is based on criteria of economicmerit, for the requirements of competition and flexibility of the gas system and is in line with thenational and European legislative framework.Involvement and participation initiativesEncouraging participation, which includes listening to people’s needs and their requests for improvement,fosters a positive internal climate. There are many channels and instruments by which <strong>Snam</strong> shares itsvalues, challenges, objectives and projects, increasing the level of employee satisfaction in carrying outtheir activities.The group’s intranet site is not only built as a tool for information but also as a place for sharing anddeveloping knowledge. In <strong>2011</strong> videos were used more frequently as tools for the immediate sharing ofinformation on crucial topics and to report significant events. To include all group personnel, includingthose difficult to reach using the information network, <strong>Snam</strong> realises and uses many paper products suchas posters, flyers, brochures and newsletters.The Sapernedi+ initiative provides a widespread structure for discovering and proliferating the company’svalues and strategies, as well as for sharing issues, problems and solutions for daily management. Thiswas rolled out in autumn <strong>2011</strong> to all organisational units, using a cascading process which reached all<strong>Snam</strong> personnel and became a significant opportunity to share new scenarios and the upcoming grouprestructuring, but also to compare activities and projects in each area of operations.<strong>Snam</strong> <strong>Annual</strong> <strong>Report</strong> <strong>2011</strong>
120<strong>Snam</strong> <strong>Annual</strong> <strong>Report</strong> <strong>2011</strong> / Commitment to sustainable developmentTrainingDevelopment and consolidation of the system of professional skills, in tune with trends in the environmentin which the business operates, are an integral part of the personnel development process.Training is an essential element for enriching the employment opportunities of personnel and forsupporting the processes of organisational integration and change management.Training by position (hours) 2009 2010 <strong>2011</strong> ChangeExecutives 3,143 3,734 2,369 (1,365)Managers 15,072 13,358 13,840 482Office workers 84,967 79,526 102,103 22,577Manual workers 50,828 52,206 68,822 16,616154,010 148,824 187,134 38,310In <strong>2011</strong> more than 187,000 hours of training were provided (amounting to 30.6 hours per employee) to16,437 participants.The company personnel involved in training initiatives amounted to 89.6%, a sure sign of the continualand all-encompassing commitment to update and develop the knowledge of all personnel.During the year many initiatives were undertaken in support of the organisational actions set out for theintegration process initiated in 2009. Among these were the training initiatives, achieved in collaborationwith the Polytechnic University of Milan, on “Economic and operational logics of regulated markets”,which were attended by group company managers and recently appointed graduates.Of particular significance was the commitment required from the Stogit maintenance internalisationproject, which involved more than 60,000 training hours for the personnel concerned.Following on from previous years, the commitment to professional training continued for thedevelopment and consolidation of the specialist technical know-how in health, safety and environment,with more than 33,000 hours of training.Initiatives in favour of employees<strong>Snam</strong> offers its employees and their families social initiatives for a better work/life balance to improvethe quality of the work environment, thus promoting well-being among personnel.Over the years, a detailed system of opportunities has been developed that includes supplementaryhealthcare benefits and insurance cover for working and non-working accidents, additional to thestatutory benefits or those provided by other public bodies. Employees can also access supplementarypension funds, company loyalty awards, healthcare prevention campaigns, sporting and recreationalinitiatives.The “Well-Being Programme” offers the opportunity to engage in physical activities at selected andapproved sports centres in the vicinity of the office blocks, at preferential membership rates.Additional conventions have also been instigated which allow access, under favourable conditions, topersonal loans, credit cards and the purchasing of goods and services at discounted prices (used cars, carrentals, branded products, holiday bookings).<strong>Snam</strong> <strong>Annual</strong> <strong>Report</strong> <strong>2011</strong>
<strong>Snam</strong> <strong>Annual</strong> <strong>Report</strong> <strong>2011</strong> / Commitment to sustainable development121Industrial relationsDuring <strong>2011</strong> relations with the unions were focused on the following: 1) the development of groupintegration processes, required in particular by the need to implement Legislative Decree no. 93 of 1 June<strong>2011</strong>, which set out the separation between the Vertically Integrated Business and the Major NaturalGas Transportation Operator, preventing the former from supplying services to the latter; 2) the entryinto force of the more recent regulations concerning Distribution which, with the introduction of newcriteria on the assignment of concessions and specific constraints on employment (cohesion clause),provide highly innovative regulation.This was debated both nationally and locally, and was subject to an agreement (as per the procedurepursuant to Article 47 of Law 428/90 as amended):- the acquisitions, pursuant to Article 2112 of the Italian Civil Code of the businesses “Unbundled ICT”and “Unbundled Companies Administrative Services” from Eni S.p.A. and Eni Adfin S.p.A. respectively;- the group restructuring, which saw the transfer to <strong>Snam</strong> Rete Gas of the natural gas transportation,dispatch, remote control and metering business unit in Italy, as well as the reallocation of certainactivities to Stogit (again via the transfer of business), Italgas and GNL Italia.In accordance with the entry into force of the aforesaid regulations, the Italgas agreement on the newoperating organisation was reached, aimed at improving protection of the territory.HEALTH, SAFETY, ENVIRONMENT AND QUALITYBy adopting a Health, Safety, Environment and Quality Policy, <strong>Snam</strong> is assuming a specific commitmentto civil society by recognising the essential value of the principles of protection and prevention.In terms of health, safety, environment and quality, the organisational structure provides for a distinctionbetween the duties of general management, which are centralised within <strong>Snam</strong>, and the duties ofspecial management, coordination and support for operating units, which are assigned to the individualcompanies.In particular, the centralised organisational structures ensure the management of know-how, assist thebusiness units in identifying the most efficient technical and organisational solutions, and define, for allcompanies, the guidelines, methodologies, standards and operating procedures to be applied. They alsotake care of the definition, implementation and maintenance of management systems, including bymeans of technical audits.The operating companies maintain an internal organisational structure which allows them to operatewith an adequate level of decision-making autonomy.Management systems<strong>Snam</strong> has specific certified Management Systems which aim to keep business processes and activitiesunder control, all in the quest for continual improvement of performance.In <strong>2011</strong> <strong>Snam</strong> Rete Gas achieved certification for the requirements of the standard for quality managementsystems, UNI-EN-ISO 9001, for the process of defining the network transportation capacity, confirmingthe company’s attention to quality, transparency and traceability.As part of the application of company management systems for the HSEQ issues, <strong>Snam</strong> continuallymonitors the implementation and efficacy of the related systems, including by regular auditing. In <strong>2011</strong>in particular, 359 inspections were carried out regarding health, safety and environment and quality.<strong>Snam</strong> <strong>Annual</strong> <strong>Report</strong> <strong>2011</strong>
122<strong>Snam</strong> <strong>Annual</strong> <strong>Report</strong> <strong>2011</strong> / Commitment to sustainable developmentThe table below details the certifications awarded to the various management systems:Company Activity Certification type<strong>Snam</strong> Rete Gas Compression plants (11 plants) ISO 14001<strong>Snam</strong> Rete GasPipeline network (8 districts, 54 maintenance centres,32,010 km of pipeline) ISO 14001<strong>Snam</strong> Rete Gas Dispatching of natural gas ISO 9001<strong>Snam</strong> Rete GasNatural gas metering service, transportation network, andmanagement of the design and construction of metering apparatus ISO 9001<strong>Snam</strong> Rete Gas Company OHSAS 18001<strong>Snam</strong> Rete Gas Definition of transportation network capacity ISO 9001STOGIT Company ISO 14001STOGIT Natural gas metering and accounting service ISO 9001GNL Italia Regasification plant ISO 14001ITALGASCompanyISO 14001-ISO9001-OHSAS 18001Health and safetyThe protection of health and safety in the workplace is one of <strong>Snam</strong>’s primary objectives.In <strong>2011</strong>, in addition to the requirements of Legislative Decree no. 81/08, the Objective Safety project,launched at the end of 2010, continued its significant initiatives which aim to act on the culture of theworkforce to improve attitudes, behaviour and personal responsibility with regard to health and safetyat work. The project was implemented to further reduce the number of incidents and accidents at work,including by unifying and improving best practices developed by the individual companies.The project also includes the initiatives “Safety Trophy” and “Zero Accidents Prize”, which are aimed atencouraging all employees to adopt safe and responsible behaviour, through a points-based competitionwith non-monetary prizes. The first of these initiatives mainly involves the personnel of outlyingoperating sites, while the second is aimed at all personnel.Featuring among the new initiatives introduced this year are the Safety Walks, where members of topmanagement, as the active sponsors of the project, meet with <strong>Snam</strong> personnel to support their activitiesand to reaffirm, by their presence, the importance of active involvement of the entire corporate structurein achieving effective safety at work.Internal communication and training act to consolidate knowledge and reinforce attention on the issue.Specifically, the selected channels for communication are as follows: the intranet portal, displays postedat all <strong>Snam</strong> sites and a new newsletter, created in mid-<strong>2011</strong>, which provides in-depth information on theissues, risks and tools associated with health and safety in the workplace. The news bulletin, produced inhard copy, is distributed to all personnel of the <strong>Snam</strong> group.With regard to safety in connection with contracted labour, special attention was paid to suppliers’qualifications and, subsequently, to evaluating suppliers through special inspections performed in thework execution phase. Suppliers also increased their involvement in issues of safety through specificawareness meetings.<strong>Snam</strong> <strong>Annual</strong> <strong>Report</strong> <strong>2011</strong>
<strong>Snam</strong> <strong>Annual</strong> <strong>Report</strong> <strong>2011</strong> / Commitment to sustainable development123The measures implemented in recent years have enabled us to obtain good results both at the grouplevel and for the individual companies, as shown by the trend of the following accident indicators.ACCIDENTS AT WORK - FREQUENCY INDEX*2.223.554.552009 2010 <strong>2011</strong>* number of injuries at work, causing an absence of at least one day, per millions of hours workedACCIDENTS AT WORK - SEVERITY INDEX*0.060.10.182009 2010 <strong>2011</strong>* number of working days lost relating to injuries at work, causing an absence of at least one day, per thousands of hours worked.The frequency index for <strong>Snam</strong> employees stood at 2.22 (-37.5% from 2010) and the severity index at0.06 (-40% from 2010). Once again in <strong>2011</strong> there were no fatal accidents.During the course of the year, the commitment to protect the health of employees was reaffirmed byfocusing on continually monitoring risk factors identified in the corporate processes and implementingsuitable prevention and protection measures. Work environment inspections were carried out in orderto evaluate adequate and appropriate working and environmental conditions and to identify possiblemeasures for prevention or improvement. In <strong>2011</strong> around 400 environmental inspections were carried out.<strong>Snam</strong> <strong>Annual</strong> <strong>Report</strong> <strong>2011</strong>
124<strong>Snam</strong> <strong>Annual</strong> <strong>Report</strong> <strong>2011</strong> / Commitment to sustainable developmentActivities were continued to support specific health protection initiatives, such as cancer prevention andflu vaccination campaigns, bans on smoking in company workplaces, and on the supply of alcohol incompany canteens.For the personnel exposed to specific risk factors we implement regular healthcare surveillance, recordingaround 2,200 medical visits by the Competent Doctors during the year.Environmental ProtectionProtection of the environment is of primary importance during all phases of <strong>Snam</strong> operations. Thecriteria and procedures adopted for the location, design, construction and management of the plantsmeet high environmental protection requirements.<strong>Snam</strong> is committed to providing Italy with a daily source of energy, natural gas, which owing to itschemical and physical properties and its ability to be used in highly efficient technologies in varioussectors (civil, industrial and thermoelectric), is able to provide a significant contribution to reducingatmospheric emissions of greenhouse gases (GHG), particles and sulphur oxides. In actual fact, using thesame amount of energy, the carbon dioxide (CO 2) generated by natural gas consumption is 25-30% lessthan that produced by oil products and 40-50% less than coal.The more significant environmental aspects of <strong>Snam</strong> operations are the temporary use of the soil duringthe construction of new transportation infrastructures and the atmospheric emissions from the use ofgas turbines installed in the gas compression plants (transportation and storage).When laying pipelines, the route is selected from a variety of alternatives according to environmentalimpact, transportation safety and technical and economic feasibility considerations. In particular,it seeks to avoid or to minimise the passage through areas of significant natural or cultural interest,archaeological areas, geologically unstable areas and inhabited areas where the construction of newdwellings is anticipated. When laying the pipelines technologies are used that interfere with thesurrounding environment as little as possible. Having completed the works, a careful environmentalrestoration operation is carried out to return the land to its original condition.During the year the environmental restoration activity concerned primarily regions of northern Italy (FriuliVenezia Giulia, Piedmont, Lombardy) and the South (Calabria, Puglia, Basilicata and Sicily). Restorationworks were carried out, along the paths of the pipelines, over a total distance of approximately 235 km,and new trees were planted along 43 km.During operation, the plants and pipelines periodically undergo inspections and maintenance toensure very high safety standards. Particular attention is paid to the section of lines that are inspectedregularly by vehicles, using helicopters and personnel on foot in order to detect potentially hazardoussituations caused, for example, by the works of third parties in the area of the pipelines. Similarly,any land slippage at specific points of the route is also kept under surveillance. The integrity of thepipelines is also inspected by passing devices along them known as “intelligent pigs”, which can detectany faults.In <strong>2011</strong> around 1,145 km of network were inspected with intelligent pigs and more than 14,000 kmusing helicopters.The use of natural gas, which meets almost all of the <strong>Snam</strong> energy requirement (more than 95%), allowsus to minimise sulphur oxides and particle emissions.To limit the emissions of nitrogen oxides generated by the gas turbines used in the compression plants,specific programmes have been defined over the years to modify the existing turbines and install newunits with low emission combustion (DLE) systems both in the gas compression and storage plants.During the year TC4 of the Montesano plant was commissioned, the TC3 turbocompressor at FiumeTreste was renovated to DLE and the modification to low emissions was implemented for the TC1turbocompressors at Settala, the TC1 at Sabbioncello and the TC1, Messina.<strong>Snam</strong> <strong>Annual</strong> <strong>Report</strong> <strong>2011</strong>
<strong>Snam</strong> <strong>Annual</strong> <strong>Report</strong> <strong>2011</strong> / Commitment to sustainable development125The greenhouse gases emitted into the atmosphere by <strong>Snam</strong> operations are CO 2and methane (CH 4), aprimary component of natural gas. The CO 2is a by-product of the combustion process and is directlyassociated with the consumption of fuels, while the emissions of natural gas, and therefore CH 4, derivepartly from the normal operation of the plants and partly from the atmospheric emissions due tothe connection of new pipelines and maintenance or to accidental events of the transportation anddistribution networks.<strong>Snam</strong> seeks to minimise its greenhouse gas emissions in its operations by implementing specificcontainment programmes such as:- the reduction of natural gas emissions (through the recompression of gas in pipelines, the replacementof pneumatic equipment and the replacement of cast-iron pipes in distribution networks);- the reduction of power consumption (using specific energy management measures);- the use of electricity produced from renewable energy sources (through specific purchase contractsand the installation of photovoltaic panels in building construction).The <strong>Snam</strong> plants subject to the Emissions trading Directive (2003/87/EC), which establishes the Emissionsmarket for greenhouse gases, are: the 11 gas compression plants and one entry point terminal of <strong>Snam</strong>Rete Gas, seven Stogit gas compression plants and one liquefied natural gas regasification plant of GNLItalia. In <strong>2011</strong>, total CO 2emissions certified by an accredited body according to the provisions of thecompetent national authority, amounted to 611,367 tonnes, out of a total of 1,001,177 annual sharesissued by the Ministry for the Environment, Land and Sea (positive balance of 390,210 shares). For thethree-year period 2009-<strong>2011</strong>, <strong>Snam</strong> will also be able to count on a financial payment by the competentnational authority, to be made in 2013, having exhausted the reserve of shares due to the New Entrantof the Malborghetto Plant (compression unit TC5).ETS PLANTS CO 2EMISSIONS (tonnes)Certified emissions1,001,577<strong>Annual</strong> emissions allocated709,869969,706611,3672009 2010 <strong>2011</strong>As regards the waste management, in <strong>2011</strong> the regulatory monitoring activity and the proliferationof technical and operational updates of Sistri (Waste Tracking Control System) continued, which wasintroduced by Ministerial Decree of 17 December 2009. During the year 16 training versions weredelivered, which involved around 180 people.<strong>Snam</strong> <strong>Annual</strong> <strong>Report</strong> <strong>2011</strong>
126<strong>Snam</strong> <strong>Annual</strong> <strong>Report</strong> <strong>2011</strong> / Commitment to sustainable developmentQualityWith regard to sales, in May <strong>2011</strong> ISO 9001 certification was obtained for the process for definingthe transportation capacities of the <strong>Snam</strong> Rete Gas network, with a view to ever-increasing attentionto the quality, transparency and traceability of its own procedures and to continual improvement ofinteractions with its stakeholders.The project, initiated in the second half of 2010, achieved the objective of obtaining quality certificationfrom an official accredited body starting from the capacity definition published for the thermal year<strong>2011</strong>-2012.This confirmed the quality certification for the natural gas dispatching processes on the transportationnetwork and the gas metering processes of <strong>Snam</strong> Rete Gas and Stogit.TECHNOLOGICAL INNOVATION AND RESEARCH<strong>Snam</strong> is directly involved in several innovative activities, especially to ensure increasing reliability in themanagement of the transportation of natural gas in Italy. In particular, several innovative technologies(panchromatic and multispectral optical sensors, altimetric laser sensors and hyperspectral scanners) arebeing developed to monitor the transportation network for external interference and areas of geologicalinstability using aerial surveillance and the digital processing of the signals received.In Europe, <strong>Snam</strong> is a member of GERG (European Gas Research Group, www.gerg.info), a group whereresearch and innovation projects can be proposed and shared in synergy with other European entitiesinterested in the same issues with the advantage of sharing costs, experience and results.For example, <strong>2011</strong> saw the final phase of an experimental assessment of two systems (acousticalsampling technologies) proposed by the industry for reporting and pinpointing in real time the impactof outside interference on pipelines.<strong>Snam</strong> is also a member of EPRG (European Pipeline Research Group, www.eprg.net), whose membersare entities which transport gas or manufacture pipelines in Europe. This group manages projects(broken down into three major areas: Design, Material and Corrosion) with an aim to constantlyimprove the knowledge and management of the integrity of gas pipelines throughout their life cycle(pipe manufacturing, pipeline construction and operation). In particular, an advanced model is beingstudied to assess the impact on pipe integrity of damage resulting from third party interference withpipelines (for this activity, experience and data are being shared with the PRCI – Pipeline ResearchCouncil International). A review has also been carried out (validated using experimental data) ofmodels for predicting the ability of pressurised pipelines subjected to combined external loads towithstand extreme conditions. The correlation between the composition of the mix of natural gas andthe effects of its expansion in pipelines of a known durability has been analysed, while an experimentalstudy is under way concerning the environmental impact on the residual mechanical strength ofdamaged pipes.<strong>Snam</strong> <strong>Annual</strong> <strong>Report</strong> <strong>2011</strong>
<strong>Snam</strong> <strong>Annual</strong> <strong>Report</strong> <strong>2011</strong> / Commitment to sustainable development127RELATIONSHIPS WITH STAKEHOLDERSStakeholder Engagement<strong>Snam</strong>’s engagement system is present at all levels of the business. The company regularly collaborateswith investors, government authorities, institutions and companies with the aim of offering a servicewhich is consistent with local and national needs and growth plans and makes available its expertiseto foster the development of activities to ensure ongoing improvements in the reliability of plants andthe quality of services offered, while placing a priority on the health and safety of its employees andcontractors.Shareholders and institutional investorsSince listing on the stock market in December 2001, <strong>Snam</strong> has endeavoured to build a corporate identitywhich expresses the objectives and spirit of the company’s management, including by way of financialreporting.<strong>Snam</strong> is known for the transparency of its relations with investors and the financial community, andprovides detailed reports of its goals and results to enable shareholders and the financial market toassess all the ways in which the company creates value.Based on assessments expressed by the financial community, <strong>Snam</strong> is a company with a limited industrialand financial risk profile, operating in a stable and transparent regulatory environment which guaranteesvisibility over its future earnings and cash flows.During the year, the company organised 20 road shows for the purpose of meeting shareholders andinstitutional investors in the major European and North American markets. In total, management metwith 140 investors in one-to-one meetings; around 15 of these were held at the San Donato Milanesesite, and about 20 group meetings were held with investors. Industry conferences provided a furtheropportunity to meet investors.When the company’s results are published (preliminary annual results, half-year results and quarterlyresults), the company organises conference calls which on average involve around 50 people, includingthe 28 analysts who publish research about the stock.During the year, management has taken part in round table discussions, seminars and conventions onsubjects relating to the utilities industry, stock markets and corporate governance. Special presentationsare prepared for every event, and they are subsequently published on a dedicated section of the website.The commitment towards sustainability was corroborated by ratings agencies which focus on corporatesocial responsibility, resulting in the company’s inclusion in <strong>2011</strong> in leading international ethical indicessuch as the Dow Jones Sustainability World Index, FTSE4Good, the ECPI Ethical Indices and the EthibelInvestment Register and Sustainability Indices. In <strong>2011</strong>, the stock was also added to the Stoxx GlobalESG Leaders indices, a new family of indices based on a transparent selection process, in terms ofsustainability performance, of 1,800 internationally listed companies.In <strong>2011</strong>, the company also participated in numerous other assessments requested by investment banks,financial intermediaries and international ratings agencies to monitor <strong>Snam</strong>’s commitment to social andenvironmental responsibility.<strong>Snam</strong> <strong>Annual</strong> <strong>Report</strong> <strong>2011</strong>
128<strong>Snam</strong> <strong>Annual</strong> <strong>Report</strong> <strong>2011</strong> / Commitment to sustainable developmentCommunities and local areasIn keeping with the principles of sustainable development and its strategic growth plans, <strong>Snam</strong> arrangessocial and cultural events. The company is involved in ongoing positive discussions with the localcommunities where it operates. It cooperates with local and national authorities, participates in thework of several associations and committees and provides its commitment and expertise to encourageimprovements in the area of corporate social responsibility.In <strong>2011</strong>, initiatives launched the previous year continued to involve schools, local residents andenvironmental associations in several areas where our plants are located.A study trip involving some 320 pupils from local primary schools was organised with a view to raisingawareness of <strong>Snam</strong>’s activities and the sustainability commitment of companies within the group. Localrepresentatives of Legambiente also participated in these meetings. They, in turn, described the purposesof the association’s activities and its various initiatives in the environmental area.To promote transparency and dialogue with local communities, open days were also held at some<strong>Snam</strong> Rete Gas, Stogit and GNL Italia plants, attended by local residents, schools and stakeholders inthe area. In addition, Stogit hosted an awareness-raising event at the local council offices in Bordolano(CR), which gave the public an opportunity to learn more about the proposed new storage facility inBordolano.During the year, institutional meetings continued with representatives of local government agenciesand local governments with the aim of greater sharing and the participation of local stakeholders in thecompany’s strategic decisions.Customers and Electricity and Gas Authority<strong>Snam</strong> has always placed special emphasis on its relationship with customers, with a view to satisfyingthe diverse needs resulting from the evolving gas market. This is done by monitoring the needs ofcustomers and identifying, and then introducing, tools and procedures which facilitate access to ourservices.Operating and commercial activities are carried out using increasingly advanced computer systems,with applications which can even be migrated to web systems and which also allow a high degree ofautomation in managing various contracts. These systems are implemented from time to time to improvecustomer communications. In this way, we also comply with Resolutions issued by the Electricity andGas Authority which regulates our services.In <strong>2011</strong>, both <strong>Snam</strong> Rete Gas and Stogit upgraded their IT systems and the related web interfaces withcustomers to manage, in a coordinated and efficient manner, the activities envisaged by the new gasbalancing system introduced on 1 December <strong>2011</strong> following a regulation by the Electricity and GasAuthority (ARG/gas 45/11, as subsequently amended).<strong>Snam</strong> Rete Gas has also guaranteed the allocation of transportation capacity to all candidate customersthis year and has continued to work to maximise that offering at entry points by increasing it from 368million cubic metres/day at the start of the 2010/<strong>2011</strong> thermal year to 370 million cubic metres/day atthe start of the <strong>2011</strong>/2012 thermal year.Following new expansion works, the storage system has also increased its capacity offering from 9.2billion cubic metres at the start of the 2010/<strong>2011</strong> thermal year to 10.0 billion cubic metres at the startof the <strong>2011</strong>/2012 thermal year, and offers industrial customers a new type of service in accordancewith the provisions of Legislative Decree no. 130/10. The total number of applications received has beenequivalent to around 9 billion cubic metres of capacity. Based on the applications received, the capacityoffering was fully allocated by 26 April <strong>2011</strong>.In order to proceed with the allocation of the new storage capacity in accordance with LegislativeDecree no. 130/10, Stogit has updated the Storage Code and the corresponding procedure governingthis process.<strong>Snam</strong> <strong>Annual</strong> <strong>Report</strong> <strong>2011</strong>
<strong>Snam</strong> <strong>Annual</strong> <strong>Report</strong> <strong>2011</strong> / Commitment to sustainable development129The relationship with the Electricity and Gas Authority plays a key role for those operating in the energybusiness. Over the years, <strong>Snam</strong> Rete Gas has established a constructive relationship and worked effectivelywith the Authority by continually maintaining an advisory role and providing substantial informationto support changes in the regulatory environment in the natural gas sector. In particular during theconsulting phase, it has always made a significant contribution to the preparation of resolutions andprovides support in response to all of the Authority’s requests for information, including in the form ofround table discussions and specific technical meetings.Suppliers<strong>Snam</strong> has adopted a procurement procedure based on transparency, impartiality and responsibility incompliance with the principle of free competition, and continues to achieve operating and performancetargets over the short and long term.Results are achieved based on the strategic planning of procurement activities and the preparationof a long-term procurement plan. The plan will be used to identify procurement targets, to maximiseoperating efficiency and to guarantee a high level of service, adhering at all times to the sustainabilityprinciples which <strong>Snam</strong> has adopted.Our activities have always emphasised the respect and protection of human and labour rights,environmental protection and the search for a sustainable development model. It is our wish to sharethese values with all our counterparties.In this respect, we ask suppliers to adopt Model 231 and to observe the principles of <strong>Snam</strong>’s Code ofEthics, to comply with legislation on occupational health and safety and with environmental laws, andto adhere to international standards in the field of labour laws.<strong>Snam</strong> is guiding its suppliers through a process of improvement and optimisation of the procedureswhich govern subcontracting, entailing greater subcontractor accountability while at the same timeensuring the growth of the supplier and improving the quality of work carried out for the company.To promote <strong>Snam</strong>’s sustainability culture, a workshop entitled “Suppliers’ Day for Sustainability” washeld over two days, attended by representatives from management and a significant sample of suppliersfrom the two categories of goods, works and services. During the event, <strong>Snam</strong>’s core sustainabilityprinciples were explained, in addition to the corresponding implementation programmes, highlightingthe supplier’s role in the new context and the consequent development of relations with <strong>Snam</strong> in termsof requirements and compliance.In <strong>2011</strong>, over 2,000 of <strong>Snam</strong>’s suppliers were awarded at least one contract by the company, representinga total of around €1,695 million in goods and services procured.Since <strong>2011</strong>, <strong>Snam</strong>’s contracts have been designed to convey the ten principles of the Global Compact, inthe hope that these principles will be increasingly shared throughout the supply chain.<strong>Snam</strong> <strong>Annual</strong> <strong>Report</strong> <strong>2011</strong>
Glossary
<strong>Snam</strong> <strong>Annual</strong> <strong>Report</strong> <strong>2011</strong> / Glossary131A glossary of financial, commercial and technical terms, as well as units of measurement, is availableonline at www.snamretegas.it. The most common terms are described below.Economic and financial termsExcise dutyIndirect tax for immediate payment, applied to the production or consumption of certain industrialgoods (including oil products and natural gas).AmortisationProcess by which the cost of fixed assets is spread over a certain period, usually the useful life of theasset.Non-Current AssetsBalance sheet item which shows long-lasting assets, net of amortisation, depreciation and impairmentlosses. These are divided into the following categories: “Property, plant and equipment”, “Compulsoryinventories”, “Intangible assets”, “Equity investments”, “Financial assets” and “Other non-current assets”.Net working capitalCapital which is invested in short-term assets and indicator of a company’s short-term financial position.Calculated using all short-term, non-financial assets and liabilities.Net invested capitalNet investments of an operational nature, represented by the sum of net working capital and fixedassets, provisions for employee benefits and assets and liabilities held for sale.Cash flowNet cash flow from operations is represented by the cash generated by an enterprise over a certainperiod of time. Specifically, the difference between current inflows (mainly cash revenue) and currentcash outflows (costs in the period that generated cash outflows).Controllable fixed costsFixed operating costs of regulated activities, represented by the sum of “Total recurring personnelexpense” and “Recurring external operating costs”.Operating costsCosts incurred in carrying out a company’s core business. These include purchases, services, energy,consumables, maintenance and personnel expense.DividendPayment to shareholders, voted for by the Shareholders’ Meeting and proposed by the Board of Directors.Dividend payoutRatio between the dividend and net profit for the period, and equal to the percentage of profits paid outto shareholders in the form of dividends.<strong>Snam</strong> <strong>Annual</strong> <strong>Report</strong> <strong>2011</strong>
132<strong>Snam</strong> <strong>Annual</strong> <strong>Report</strong> <strong>2011</strong> / GlossaryNet financial debtIndicator of the ability to meet financial obligations. Net financial debt is represented by gross financialdebt minus cash and cash equivalents as well as other financial receivables not held for operations.InvestmentsCosts incurred for the acquisition of long-term assets where the useful life does not expire over onereporting period.EBITDAUsed by <strong>Snam</strong> in its internal (business plan) and external (to analysts and investors) presentations. Unitof measurement to assess the group’s operating performance, as a whole and in the individual businesssegments, in addition to EBIT. Determined by the difference between revenue and operating costs.Net financial expenseNet cost incurred for using third-party capital. Includes other net expense related to financial operations.Shareholders’ equityTotal resources contributed by shareholders, plus retained profits and minus losses.Core business revenueIncome from selling goods and/or providing services that are integral to the core business, including allrecurring economic values linked to a company’s typical field of business.DerivativesA financial instrument is defined as a derivative when its price/yield profile derives from the price/yieldparameters of other major instruments – known as “underlying” – such as commodities, currencies,interest rates, securities and share indices.Comprehensive incomeIncludes both net income for the period and changes in equity, which are recognised in equity inaccordance with IFRSs (Other components of comprehensive income).Net profitEBIT minus result from financial operations and income taxes.EBITDifference in a given period between sales and services revenues, other revenues, operating costs,depreciation and amortisation and impairment losses over a given period. It is therefore the operatingresult before financial revenues and costs and taxes.<strong>Snam</strong> <strong>Annual</strong> <strong>Report</strong> <strong>2011</strong>
<strong>Snam</strong> <strong>Annual</strong> <strong>Report</strong> <strong>2011</strong> / Glossary133Transportation and regasificationCommercial termsThermal yearPeriod of time into which the regulatory period is divided. Since 1 January 2010, transport tariffshave referred to the calendar year (1 January to 31 December). For LNG regasification, we are in the<strong>2011</strong>/2012 thermal year, which runs from 1 October <strong>2011</strong> to 30 September 2012.Transportation capacityTransportation capacity is the maximum quantity of gas which can be injected into the system (orwithdrawn from it) during the course of a gas day, at a specific location, in compliance with the technicaland operating restrictions established for each section of pipeline and the maximum performance ofplants located along such pipelines.These capacities are assessed using hydraulic network simulations carried out in appropriate transportationscenarios and in accordance with recognised technical standards.Network codeDocument governing the rights and obligations of those involved in providing transportation andregasification services.Regulatory periodPeriod of time (usually four years) for which criteria are defined for setting tariffs for transporting anddispatching natural gas and for regasifying liquefied natural gas. For transportation, we are currently inthe third regulatory period, which runs from 1 January 2010 to 31 December 2013. For regasification,the third regulatory period runs from 1 October 2008 to 30 September 2012.Network entry pointEach point or a localised group of physical points on the gas transportation network at which gas isdelivered to the transporter.Redelivery pointThis is the physical network point, or local combination of physical points, at which the Transporterredelivers gas transported to the User, and where such gas is metered.Virtual exchange point (VEP)A virtual point located between the Points of Entry and Points of Exit of the National TransportationNetwork where users and other authorised entities may, on a daily basis, exchange and sell gas injectedinto the Network.Regasification TariffsUnit prices applied for regasification. These include capacity and commodity tariffs, related tothe required regasification capacity and to the volumes of gas actually unloaded from tankers,respectively.<strong>Snam</strong> <strong>Annual</strong> <strong>Report</strong> <strong>2011</strong>
134<strong>Snam</strong> <strong>Annual</strong> <strong>Report</strong> <strong>2011</strong> / GlossaryTransportation TariffsUnit prices applied for transporting and dispatching natural gas. These include capacity and commoditytariffs, related to the required transportation capacity and to the volumes of gas actually injected intothe network, respectively.UserThe user of the gas system, which, by confirming the capacity granted, acquires transportation capacityfor its own use or assignment to others.Technical termsNatural gasHydrocarbon mixture consisting mainly of methane, and to a lesser degree, ethane, propane and higherhydrocarbons. Natural gas injected in the gas pipeline network must comply with a single qualityspecification to ensure that the gas in transit is interchangeable.Liquefied natural gas (LNG)Natural gas comprised essentially of methane liquefied by cooling at around -160°C, at atmosphericpressure, to make it suitable for tanker transportation or reservoir storage. In order to be injected into thetransportation network, the liquid must be reconverted into a gas at regasification plants and brought tothe operating pressure of the pipelines.Natural gas transportation networkThe aggregate of gas pipelines, line plants, compression stations and infrastructure, which, at the nationaland regional level, provide the transportation of gas by interconnecting with international transportationnetworks, production and storage points and redelivery points for the purposes of distribution and use.Regional transportation networkThis consists of gas pipelines not included in the list in Article 2 of the Ministerial Decree of 22 December2000, as updated annually, and its main function is to move and distribute gas in demarcated local areas,which are typically regional in scale.National gas pipeline networkThis consists of the gas pipelines indicated in Article 2 of the Ministerial Decree of 22 December2000, as updated annually. It is the aggregate of gas pipelines and plants which have been assessedand checked taking into account restrictions imposed by imports, exports, key national production andstorage facilities, and is used to transfer significant quantities of gas from these network injection pointsto major areas of consumption. Several inter-regional gas pipelines as well as smaller pipelines whichserve to close network links formed by the above pipelines are also included for the same purpose.The National Transportation Network also includes compression stations and plants connected to thepipelines described above.LNG regasificationIndustrial process whereby natural gas is converted from a liquid to a gaseous state.<strong>Snam</strong> <strong>Annual</strong> <strong>Report</strong> <strong>2011</strong>
<strong>Snam</strong> <strong>Annual</strong> <strong>Report</strong> <strong>2011</strong> / Glossary135Natural gas storageCommercial termsThermal yearPeriod of time into which the regulatory period is divided. Since 1 January <strong>2011</strong>, storage tariffs havebeen based on the calendar year (1 January to 31 December).Withdrawal phasePeriod from 1 November of one year to 31 March of the following year.Injection phasePeriod from 1 April to 31 October of the same year.Regulatory periodPeriod of time (usually four years) for which criteria are defined for setting tariffs for natural gasstorage services. We are currently in the third regulatory period, which runs from 1 January <strong>2011</strong> to31 December 2014.Technical termsModulation storageAims to respond to changing hourly, daily and seasonal demands.Mining storageMining storage is necessary for technical and economic reasons in order to enable optimum cultivationof Italy’s natural gas fields.Strategic storageAims to provide for a lack of or reduction in supplies from non-EU imports or crises in the gas system.Natural gas distributionCommercial termsTariff areaThe tariff area is the area used to determine distribution tariffs and consists of all communities served bythe same distribution plant. If several local authorities collectively designate an operator to perform thedistribution service, or declare themselves a single tariff area, the tariff area coincides with the group ofmunicipalities served through several distribution plants by one or more operators.<strong>Snam</strong> <strong>Annual</strong> <strong>Report</strong> <strong>2011</strong>
136<strong>Snam</strong> <strong>Annual</strong> <strong>Report</strong> <strong>2011</strong> / GlossaryThermal yearPeriod of time into which the regulatory period is divided. Since 1 January 2009, distribution tariffs havebeen based on the calendar year (1 January to 31 December).End clientConsumer who buys gas for own use.Network codeDocument governing the rights and obligations of those involved in providing gas distribution services.ConcessionAct by which a local authority entrusts to a company the management of a service which falls within theremit of said authority and for which said company assumes the operational risk.Regulatory periodPeriod of time (usually four years) for which criteria are defined for setting tariffs for gas distributionservices. We are currently in the third regulatory period, which runs from 1 January 2009 to 31December 2012.Redelivery pointThis is the point of demarcation between the gas distribution plant and the plant owned or managedby the end customer at which the distribution company redelivers gas transported for supply to the endcustomer, and at which metering occurs.Gas distribution serviceService of transporting natural gas through networks of local pipelines from one or more delivery pointsto redelivery points, generally at low pressure and in urban areas, for delivery to end clients.Retail CompanyCompany which, by way of a contract giving it access to the networks managed by a distributor, sellsthe gas.Technical termsGas distributedAmount of gas delivered to users of the distribution network at the redelivery points.EqualisationDifference between revenues for the period (annual TRL) and those invoiced to retail companies on thebasis of volumes distributed. The net position with the Equalisation Fund is established at the end of thethermal year and settled over the course of the year on the basis of advanced payments.TRL (Total Revenue Limit)Total revenues allowed for distribution companies by the regulatory body to cover costs for providingdistribution and metering services.<strong>Snam</strong> <strong>Annual</strong> <strong>Report</strong> <strong>2011</strong>
<strong>2011</strong> Consolidatedfinancial statements<strong>Snam</strong> <strong>Annual</strong> <strong>Report</strong> <strong>2011</strong>
138<strong>Snam</strong> <strong>Annual</strong> <strong>Report</strong> <strong>2011</strong> / Consolidated financial statementsBalance sheet01.01.2010 31.12.2010 31.12.<strong>2011</strong>- of whichwith related- of whichwith related- of whichwith relatedTotal parties (€ million) Notes Total parties Total partiesASSETSCurrent assets36 Cash and cash equivalents (6) 8 2916 496 Trade and other receivables (7) 944 553 1,545 546117 Inventories (*) (8) 147 2352 Current income tax assets (9) 35 Other current tax assets (9) 4 567 1 Other current assets (10) 71 2 33 21,143 1,174 1,823Non-current assets12,978 Property, plant and equipment (*) (11) 13,533 14,053405 Compulsory inventories (12) 405 4054,082 Intangible assets (13) 4,262 4,444301 Equity-accounted investments (14) 319 3191 Other financial assets 134 3 Other non-current assets (15) 49 16 81 117,801 18,569 19,30225 Non-current assets held for sale (16) 25 2518,969 TOTAL ASSETS 19,768 21,150LIABILITIES AND SHAREHOLDERS’ EQUITYCurrent liabilities1,585 1,585 Short-term financial liabilities (17) 1,844 1,844 2,787 2,787Short-term portion of long-term915 914 financial liabilities (22) 1,320 1,320 1,612 1,6121,106 308 Trade and other payables (18) 1,322 537 1,344 2775 Current income tax liabilities (19) 11 17518 Other current tax liabilities (20) 20 16250 66 Other current liabilities (21) 221 58 211 783,879 4,738 6,145Non-current liabilities7,486 7,485 Long-term financial liabilities (22) 7,186 7,185 6,800 6,800576 Provisions for risks and charges (23) 629 527107 Provisions for employee benefits (24) 105 107934 Deferred tax liabilities (25) 853 901273 16 Other non-current liabilities (26) 331 31 869 1889,376 9,104 9,20411Liabilities directly associated with assetsheld for sale (16) 10 913,266 TOTAL LIABILITIES 13,852 15,358SHAREHOLDERS’ EQUITY (27)Equity attributable to <strong>Snam</strong>3,570 Share capital 3,570 3,5712,395 Reserves 2,332 2,551732 Net profit 1,106 790(792) Treasury shares (789) (783)(203) Interim dividend (304) (338)5,702 Total shareholders’ equity attributable to <strong>Snam</strong> 5,915 5,7911Capital and reserves attributable to minorityinterests 1 15,703 TOTAL SHAREHOLDERS’ EQUITY 5,916 5,79218,969 TOTAL LIABILITIES AND SHAREHOLDERS’ EQUITY 19,768 21,150(*) The pseudo-working gas no longer able to be supplied and reinjected into the annual storage cycle was classified under the item “Property, plant and equipment”. In line with the provisionsof IAS 1, the corresponding value at 31 December 2010 (3.632 million standard cubic metres for a book value of € 294 million) was reclassified from the “Inventories” to “Property, plant andequipment”. For further information, see Note 8, “Inventories”.<strong>Snam</strong> <strong>Annual</strong> <strong>Report</strong> <strong>2011</strong>
<strong>Snam</strong> <strong>Annual</strong> <strong>Report</strong> <strong>2011</strong> / Consolidated financial statements139Income statement2010 <strong>2011</strong>(€ million) Notes Totalof which withrelated partiesTotalof which withrelated partiesREVENUE (29)Core business revenue 3,475 1,994 3,539 2,061Other revenue and income 33 18 66 26Total revenue 3,508 3,605OPERATING COSTS (30)Purchases, services and other costs (623) (95) (659) (77)Personnel expense (345) (334)DEPRECIATION, AMORTISATIONAND IMPAIRMENT LOSSES (678) (654)EBIT 1,862 1,958FINANCIAL INCOME (EXPENSE) (31)Financial income 5 3Financial expense (174) (151) (247) (225)Derivatives (102) (102) (69) (69)(271) (313)INCOME FROM EQUITY INVESTMENTS (32) 47 51Equity method valuation effect 47 45Other income from equity investments 6PRE-TAX PROFIT 1,638 1,696Income taxes (33) (532) (906)Net profit 1,106 790Attributable to:- <strong>Snam</strong> 1,106 790- Minority interestsEarnings per share (€ per share) (34)- basic 0.33 0.23- diluted 0.33 0.23Statement of comprehensive income(€ million) Notes 2010 <strong>2011</strong>Net profit 1,106 790Other components of comprehensive incomeChange in fair value of cash flow hedge derivatives 4 (194)Tax effects of the other components of comprehensive income (effective share) (*) (1) 73Total other components of comprehensive income, net of tax effect (27) 3 (121)Total comprehensive income for the period 1,109 669Attributable to:- <strong>Snam</strong> 1,109 669- Minority interests1,109 669(*) Includes the effect (€20 million) deriving from the adjustment of prepaid IRES following application of the Robin Hood Tax.<strong>Snam</strong> <strong>Annual</strong> <strong>Report</strong> <strong>2011</strong>
140<strong>Snam</strong> <strong>Annual</strong> <strong>Report</strong> <strong>2011</strong> / Consolidated financial statementsStatement of changes in shareholders’ equity<strong>Snam</strong> shareholders’ equityShare capitalConsolidation reserveShare premium reserve(€ million)Shareholders’ equity at 31 December 2009 3,570 (1,586) 1,978 391 (52) 794 870 732 (792) (203) 5,702 1 5,703Transactions with shareholders:- Dividend distribution (€0.14 per share to balancethe 2009 interim dividend of €0.06 per share) (675) 203 (472) (472)- Allocation of 2009 residual net profit 27 30 (57)- 2010 interim dividend (€0.09 per share) (304) (304) (304)- Disposal of treasury shares for stock option plans 3 (3) 3 3 33 27 (3) 30 (732) 3 (101) (773) (773)Comprehensive income 2010 3 1,106 1,109 1,109Other changes in shareholders’ equity:- Impact of Italgas and Stogit acquisition (127) (127) (127)- Difference between book value of sharessold and strike price of stock optionsexercised by executives (1) (1) (1)- Equity method valuation effect5 5 5(127) 4 (123) (123)Shareholders’ equity at 31 December 2010 (Note 27) 3,570 (1,713) 1,981 418 (49) 791 904 1,106 (789) (304) 5,915 1 5,916Transactions with shareholders:- Dividend distribution (€0.14 per share to balancethe 2010 interim dividend of €0.09 per share) (777) 304 (473) (473)- Allocation of 2010 residual net profit 45 284 (329)- <strong>2011</strong> interim dividend (€0.10 per share) (338) (338) (338)- Capital increase for stock option plans 1 1 2 2- Disposal of treasury shares for stock option plans 6 (6) 6 6 61 7 45 (6) 284 (1,106) 6 (34) (803) (803)Comprehensive income <strong>2011</strong> (121) 790 669 669Other changes in shareholders’ equity:- Impact of Italgas and Stogit acquisition 12 12 12- Difference between book value of sharessold and strike price of stock optionsexercised by executives (1) (1) (1)- Acquisition of business units (2) (2) (2)- Adjustment for prepaid IRES (Robin Hood Tax)charges through increase of share capital 1 112 (2) 10 10Shareholders’ equity at 31 December <strong>2011</strong> (Note 27) 3,571 (1,701) 1,988 463 (170) 783 1,188 790 (783) (338) 5,791 1 5,792Legal reserveCash flow hedge reserveOther reservesRetained earningsNet profitTreasury sharesInterim dividendTotalCapital and reserves attributableto minority interestsTotal shareholders’ equity<strong>Snam</strong> <strong>Annual</strong> <strong>Report</strong> <strong>2011</strong>
<strong>Snam</strong> <strong>Annual</strong> <strong>Report</strong> <strong>2011</strong> / Consolidated financial statements141Statement of cash flows(€ million) Notes 2010 <strong>2011</strong>Net profit 1,106 790Adjustments for reconciling net profit for the year with cash flows from operating activities:Amortisation and depreciation (30) 668 663Net impairment losses (Recovery of value) of property, plant and equipment and intangible assets (30) 10 (9)Equity method valuation effect (32) (47) (45)Net capital losses on asset sales, cancellations and eliminations 8 6Dividends (2)Interest income (4) (3)Interest expense 260 304Income taxes (33) 532 906Changes in working capital:- Inventories (7) (22)- Trade receivables (39) (590)- Trade payables (3) 88- Provisions for risks and charges 18 8- Other assets and liabilities 65 394Working capital cash flows 34 (122)Change in provisions for employee benefits (1) 2Dividends collected 34 44Interest collected 4 5Interest paid (258) (305)Income taxes paid net of reimbursed tax credits (571) (697)Net cash flows from operating activities 1,775 1,537- of which with related parties (36) 1,663 1,718Investments:- Property, plant and equipment (11) (1,056) (1,160)- Intangible assets (13) (366) (416)- Change in scope of consolidation and business units (137) 10- Equity investments (1)- Change in payables and receivables relating to investments 152 (74)Cash flows from investment activities (1,407) (1,641)Divestments:- Property, plant and equipment 4 1- Intangible assets 10 44- Equity investments 7- Financial receivables not held for operations 1Cash flows from divestments 14 53Net cash flows from investment activities (1,393) (1,588)- of which with related parties (36) (220) (348)Taking on long-term financial debt 1,020 1,226Repaying long-term financial debt (915) (1,320)Increase (decrease) in short-term financial debt 259 943364 849Net equity capital injections 2 7Dividends paid to <strong>Snam</strong> shareholders (776) (811)Net cash flows from financing activities (410) 45- of which with related parties (36) (66) 399Net cash flow for the year (28) (6)Cash and cash equivalents at the beginning of the year (6) 36 8Cash and cash equivalents at the end of the year (6) 8 2<strong>Snam</strong> <strong>Annual</strong> <strong>Report</strong> <strong>2011</strong>
142<strong>Snam</strong> <strong>Annual</strong> <strong>Report</strong> <strong>2011</strong> / Notes to the consolidated financial statementsNotes to the consolidated financial statementsBackground information<strong>Snam</strong> is involved in the regulated transportation, storage and distribution of natural gas and the regasification of liquefiednatural gas (LNG). These activities are carried out through its integrated infrastructure in Italy.The parent company <strong>Snam</strong> Rete Gas S.p.A. (<strong>Snam</strong> S.p.A. from 1 January 2012) is an Italian company listed on the Milan StockExchange, with its registered office at Piazza Santa Barbara 7, San Donato Milanese (MI). It is controlled by Eni S.p.A., whichholds 52.53% of the share capital.1) Basis of presentationThe consolidated financial statements are prepared in accordance with International Financial <strong>Report</strong>ing Standards (hereinafter“IFRS” or “international accounting standards”) issued by the International Accounting Standards Board (IASB) and adoptedby the European Commission pursuant to Article 6 of Regulation (EC) No. 1606/2002 of the European Parliament and of theCouncil of 19 July 2002 and to Article 9 of Legislative Decree No. 38/2005.The consolidated financial statements are prepared in consideration of future continuing business using the historical costmethod, taking into account value adjustments where necessary, except the items which, according to IFRS, must be measuredat fair value, as described in the measurement criteria.The consolidated financial statements include the financial statements of <strong>Snam</strong> Rete Gas S.p.A. and of companies over whichthe company has the right to exercise direct or indirect control from the date of acquisition until the date when such controlis relinquished, determine financial and operational decisions, and obtain the benefits thereof.The exclusion from the scope of consolidation of some subsidiaries, which are significant neither individually nor collectively,has not had any significant effect 1 for the purposes of correctly representing the equity, financial and economic position of theGroup. These investments are valued according to the criteria indicated in the section “Equity investments”.Consolidated companies, non-consolidated subsidiaries, companies under joint control, associates and other significant equityinvestments, reporting for which is covered by Article 126 of Consob Regulation 11971 of 14 May 1999, as subsequentlyamended, are indicated separately in the annex “Significant shareholdings, associates and equity investments of <strong>Snam</strong> at 31December <strong>2011</strong>”, which is an integral part of these notes. The same annex also reports the change in the scope of consolidationwhich took place during the year.The financial statements of consolidated companies and the consolidated financial statements are audited by Reconta Ernst& Young S.p.A..The financial statements at 31 December <strong>2011</strong> were approved and authorised for publication by the <strong>Snam</strong> Board of Directorsat its meeting of 12 March 2012, in accordance with the law.Given their size, amounts in the financial statements and respective notes are expressed in millions of euros.2) Consolidation principlesEquity investments in consolidated companiesThe assets, liabilities, income and expenses of companies subject to line-by-line consolidation are incorporated fully in theconsolidated financial statements; the book value of the equity investments is eliminated against the corresponding portionof shareholders’ equity.1 According to the provisions of the Framework of international accounting standards, “the information is significant if its omission or incorrect disclosurecan influence the financial decisions of the end-users taken based on the financial statements”.<strong>Snam</strong> <strong>Annual</strong> <strong>Report</strong> <strong>2011</strong>
<strong>Snam</strong> <strong>Annual</strong> <strong>Report</strong> <strong>2011</strong> / Notes to the consolidated financial statements143The shareholders’ equity of these investee companies is determined by attributing to each asset and liability its current valueat the date of acquisition of control. If positive, any difference from the acquisition cost is posted to the asset item “Goodwill”;if negative, it is posted to the income statement.The shares of equity and profit attributable to minority interests are recorded in the appropriate items of shareholders’equity and the income statement. Where total control is not acquired, the share of equity attributable to minority interestsis determined based on the share of the current values attributed to assets and liabilities at the date of acquisition of control,net of any goodwill (partial goodwill method). Alternatively, the full amount of the goodwill generated by the acquisition isrecognised, therefore also taking into account the share attributable to minority interests (full goodwill method). In this regard,minority interests are expressed at their total fair value including their attributable share of goodwill 2 . The choice of how todetermine goodwill (partial goodwill method or full goodwill method) is made based on each individual business combinationtransaction.Where equity investments are acquired subsequent to the acquisition of control (acquisition of minority interests), any positivedifference between the acquisition cost and the corresponding portion of equity acquired is posted to shareholders’ equity.Similarly, the effects of selling minority interests without losing control are posted to shareholders’ equity.Business combinations whereby the investing companies are controlled by the same company or companies before and afterthe transaction, and where such control is not temporary, are classed as transactions under common control.Such transactions are not governed by IFRS 3 or by other IFRS. In the absence of a reference accounting standard, the selectionof an accounting standard for such transactions, for which a significant influence on future cash flows cannot be established,is guided by the principle of prudence, which dictates that the principle of continuity be applied to the values of the net assetsacquired. The assets are measured at the book values from the financial statements of the companies being acquired predatingthe transaction or, where available, at the values from the consolidated financial statements of the common ultimate parent.Where the transfer values are higher than such historical values, the surplus is eliminated by reducing the shareholders’ equityof the acquiring company.All financial statements of consolidated companies close at 31 December.Intragroup transactionsUnrealised gains from transactions between consolidated companies are eliminated, as are receivables, payables, income,expenses, guarantees, commitments and risks between consolidated companies.Intragroup losses are not eliminated because they effectively represent impairment of the asset transferred.3) Measurement criteriaThe major measurement criteria adopted for preparation of the consolidated financial statements are described below.CURRENT ASSETSRecording and elimination of financial assetsFinancial assets are recorded on the balance sheet when the company becomes a party to agreements related to such assets.Financial assets sold are eliminated from balance sheet assets when the right to receive cash flows is transferred together withall risks and benefits associated with ownership.Cash and cash equivalentsCash and cash equivalents include the cash on hand, on demand deposits, as well as other short-term financial investmentswith a term of under three months, which are readily convertible into cash and are subject to a negligible risk of variance oftheir value.2 The adoption of the partial or full goodwill method is also used in the business combinations, which involves the disclosure of the negative goodwill inthe income statement (gain or bargain purchase).<strong>Snam</strong> <strong>Annual</strong> <strong>Report</strong> <strong>2011</strong>
144<strong>Snam</strong> <strong>Annual</strong> <strong>Report</strong> <strong>2011</strong> / Notes to the consolidated financial statementsIf denominated in euros, these entries are recorded at nominal value, corresponding to fair value, and if in other currencies,they are recorded at the exchange rate in effect at the end of the period.Trade and other receivablesTrade and other receivables are initially measured at fair value inclusive of the transaction costs, and subsequently at amortisedcost 3 using the effective interest rate method. Where there is actual evidence of impairment, the write-down is calculated bycomparing the book value with the current value of anticipated cash flows discounted at the effective interest rate defined atthe time of the initial recognition, or at the time of its updating to reflect the contractually defined repricing. There is objectiveevidence of impairment when, among other things, there are significant breaches of contract, major financial difficulties orthe risk of the counterparty’s insolvency. Receivables are reported net of provisions for impairment losses. If the reasons for aprevious write-down cease to be valid, the value of the asset is restored up to the value of applying the amortised cost if thewrite-down had not been made.Trade receivables can be transferred through factoring operations. The transfers can be with or without recourse. Withoutrecourse has neither risk of recourse nor liquidity risk and therefore involves the write-off of receivables on transfer to thefactoring company. Transfers with recourse do not transfer the credit risk or liquidity risk; therefore the receivables remainentered in the balance sheet until payment of the due amount. In such case, any advanced payments made by the factoringcompany are entered under payables to other financial backers.InventoriesInventories, including compulsory inventories recorded under non-current assets in “Compulsory Inventories”, are recordedat the lower of purchase or production cost and the net realisation value represented by the amount the company expectsto receive from their sale in the normal course of business. The cost configuration used is determined in accordance with theweighted average cost method. The sale and purchase of strategic gas do not involve the effective transfer of risks and benefitsassociated with ownership, and thus do not result in a change in inventories.Current tax assets (liabilities)Current tax assets (liabilities) are recorded at the amount expected to be recovered (paid) from (to) tax authorities applyingcurrent tax rates, or those essentially enacted on the reporting date.Other current and non-current assetsOther current assets and non-current assets are initially measured at fair value, and subsequently at the amortised costpreviously described.NON-CURRENT ASSETSProperty, plant and equipmentProperty, plant and equipment are recognised at cost and recorded at the purchase or production cost including directly allocableancillary costs needed to make the assets available for use. When a significant period of time is needed to make the asset readyfor use, the purchase or production cost includes the financial expense which theoretically would have been saved during theperiod needed to make the asset ready for use, if the investment had not been made. If there are current obligations to dismantleand remove the assets and restore the sites, the book value includes the estimated (discounted) costs to be incurred at the timethe structures are abandoned, recognised as a counter-entry to a specific provision. The accounting treatment for revisions inthese cost estimates, the passage of time and the discount rate are indicated in the paragraph “Provisions for risks and charges”.3 According to the amortised cost method, the book value is adjusted to account for repayments of principal, any impairment losses and the amortisationof the difference between the repayment amount and initial recorded amount. Amortisation is carried out using the effective internal interest ratewhich represents the rate which would make the present value of projected cash flows and the amount recorded initially equal at the time of the initialrecording.<strong>Snam</strong> <strong>Annual</strong> <strong>Report</strong> <strong>2011</strong>
<strong>Snam</strong> <strong>Annual</strong> <strong>Report</strong> <strong>2011</strong> / Notes to the consolidated financial statements145Property, plant and equipment may not be revalued, even through the application of specific laws.Costs for improvements, upgrades and transformations of an incremental nature with respect to the property, plant andequipment are recognised under balance sheet assets.Starting at the time utilisation of the asset begins, or should have begun, property, plant and equipment are regularly depreciatedon a straight-line basis over their useful life defined as an estimate of the period the asset will be used by the company. Whenthe tangible asset consists of several major components, each with a different useful life, each component is depreciatedseparately. The amount to be depreciated is the book value reduced by the projected net sales value at the end of the asset’suseful life if this is significant and can be determined reasonably. Land is not depreciated, even if purchased in conjunction witha building; neither are property, plant and equipment held for sale (see the section below “Non-current assets held for sale”).Freely transferable assets are depreciated during the period of the concession or of the useful life of the asset if lower.The costs of replacing identifiable components of complex assets are allocated to balance sheet assets and depreciated overtheir useful life. The remaining book value of the component being replaced is allocated to the income statement. Ordinarymaintenance and repair expenses are posted to the income statement in the period when they incurred.When events occur leading to the assumption of an impairment of the property, plant and equipment, their recoverability istested by comparing the book value with the related recoverable value, which is the fair value adjusted for disposal costs orthe usage value, whichever is greater.In the absence of a binding sales agreement, fair value is estimated on the basis of values resulting from an active market,recent transactions or on the basis of the best information available to reflect the amount the company could obtain from thesale of the asset.Value in use is determined by discounting projected cash flows resulting from the use of the asset, and if they are significantand can be reasonably determined, from its sale at the end of its useful life, net of any disposal costs. Cash flows are determinedbased on reasonable, documentable assumptions representing the best estimate of future economic conditions which willoccur during the remaining useful life of the asset, with a greater emphasis on outside information. Discounting is done ata rate reflecting current market conditions for the time value of money and specific risks of the asset not reflected in theestimated cash flows.The valuation is done for single assets, or for the smallest identifiable aggregate of assets which generates independentincoming cash flow resulting from ongoing use (cash-generating units). If the reasons for impairment losses carried out nolonger apply, the assets are revalued and the adjustment is posted to the income statement as a revaluation (recovery of value).The revaluation is applied to the lower of the recoverable value and book value before any impairment losses previously carriedout, and reduced by depreciation provisions which would have been allocated if an impairment loss had not been recorded forthe asset.Compulsory inventories are included under non-current assets in the item “Compulsory inventories”.Assets under finance leases, or under agreements which may not take the specific form of a finance lease, but call for theessential transfer of the benefits and risks of ownership, are recorded at the lower of fair value less fees payable by the lesseeor the present value of minimum lease payments, under property, plant and equipment as a counter-entry to the financial debtto the lessor.The assets are depreciated using the criteria and rates used for property, plant and equipment. When there is no reasonablecertainty that the right of redemption can be exercised, the depreciation is made in the shortest period between the term ofthe lease and the useful life of the asset.Intangible assetsIntangible assets are those assets without identifiable physical form which are controlled by the company and capable ofproducing future economic benefits, as well as goodwill when purchased for consideration. The ability to identify these assetsrests in the ability to distinguish intangible assets purchased from goodwill. Normally this requirement is satisfied when: (i) theintangible assets are related to a legal or contractual right, or (ii) the asset is separable, i.e. it can be sold, transferred, leased orexchanged independently, or as an integral part of other assets. The company’s control consists of the power to utilise futureeconomic benefits deriving from the asset and the ability to limit their access to others.<strong>Snam</strong> <strong>Annual</strong> <strong>Report</strong> <strong>2011</strong>
146<strong>Snam</strong> <strong>Annual</strong> <strong>Report</strong> <strong>2011</strong> / Notes to the consolidated financial statementsIntangible assets are recorded at cost, which is determined using the criteria indicated for property, plant and equipment. Theymay not be revalued, even through the application of specific laws.Intangible assets with a finite useful life are regularly amortised over their useful life, meaning the estimate of the periodduring which the assets will be used by the company. The recoverability of their book value is tested by using the criteriaindicated under the paragraph “Property, plant and equipment”.Goodwill and other intangible assets with an indefinite useful life are not amortised. The recoverability of their book value istested at least annually, and in any case when events occur leading to an assumption of impairment. Goodwill is tested at thelevel of the smallest aggregate, on the basis of which the company’s management directly or indirectly assesses the returnon investment including goodwill. When the book value of the cash-generating unit, including the goodwill attributed to it,exceeds the recoverable value, the difference is subject to impairment, which is attributed by priority to the goodwill up to itsamount; any surplus in the impairment with respect to the goodwill is attributed pro rata to the book value of the assets whichconstitute the cash-generating unit. Impairment losses cannot be reversed.Technical development costs are allocated to the balance sheet assets when: (i) the cost attributable to the intangible assetcan be determined reliably; (ii) there is the intent, availability of financial resources and technical capability to make the assetavailable for use or sale; and (iii) it can be shown that the asset is capable of producing future economic benefits.Intangible assets also include service concession agreements between the public and private sectors for the development,financing, management and maintenance of infrastructures under concession in which: (i) the grantor controls or regulatesthe services provided by the operator through the infrastructure and the related price to be applied; (ii) the grantor controlsany significant remaining interest in the infrastructure at the end of the concession by owning or holding benefits, or in someother way.Based on the terms of the agreements, the operator holds the right to use the infrastructure, which is controlled by the grantor,for the purposes of providing the public service 4 .The value of storage concessions, which is determined as indicated by the Ministry of Production Activities in its decree of 3November 2005, is allocated to the item “Concessions, licences, trademarks and similar rights”, and is not amortised.GrantsCapital grants are recognised when there is reasonable certainty that the conditions imposed by the granting governmentagencies for their allocation will be met, and they are recognised as a reduction to the purchase price or production cost oftheir related assets. Operating grants are recognised in the income statement.Equity investmentsInvestments in subsidiaries not included in the scope of consolidation, in subsidiaries controlled jointly with other shareholdersand in associates are accounted for using the equity method 5 . If there is objective evidence of impairment (see also “Currentassets”), recoverability is tested by comparing the book value with the related recoverable value determined using the criteriaindicated in the section on “Property, plant and equipment”.When there is no significant impact on the balance sheet, financial position and income statement, subsidiaries not includedin the scope of consolidation, subsidiaries controlled jointly with other shareholders and associates are accounted for atcost adjusted for impairment. When the reasons for the impairment losses carried out no longer apply, equity investmentsaccounted for at cost are revalued up to the amount of the impairment losses applied with the impact posted to the incomestatement under “Other income (expense) from equity investments”.4 When the operator has the unconditional contractual right to receive cash or other financial assets from the grantor or entity identified by the grantor,the consideration received, or to be received, by the operator for infrastructure construction or improvements is recognised as a financial asset.5 In the case of entering into joint control in subsequent phases, the holding is entered in the amount deriving from the application of the equity methodas if applied since the outset; the effect of the revaluation of the book value of the shares held prior to entering into joint control is recognised inshareholders’ equity.<strong>Snam</strong> <strong>Annual</strong> <strong>Report</strong> <strong>2011</strong>
<strong>Snam</strong> <strong>Annual</strong> <strong>Report</strong> <strong>2011</strong> / Notes to the consolidated financial statements147Other equity investments are measured at fair value with allocation of the impact to the shareholders’ equity reserve for“Other components of comprehensive income”; changes in fair value which are recognised in shareholders’ equity are postedto the income statement at the time of write-down or sale. When equity investments are not listed in a regulated market,and fair value cannot be reliably determined, such investments are accounted for at cost adjusted for impairment; impairmentcannot be reversed. 6The amount of any impairment of the investment relating to the parent company, greater than the investment’s book value,is recognised in a special provision to the extent the parent company is committed to fulfilling its legal or implied obligationsto the subsidiary/associate, or, in any event, to covering its losses.Non-current assets held for saleNon-current assets and current and non-current assets of groups held for sale are classified as held for sale if the relative bookvalue will be recovered by the sale rather than through its continued use. Non-current assets held for sale, current and noncurrentassets related to disposal groups and directly related liabilities are recognised in the balance sheet separately fromthe company’s other assets and liabilities. Non-current assets held for sale are not depreciated, and are accounted for at thelower of book value and the related fair value reduced by any sales costs. The classification of investments valued using the netequity method as held for sale implies the suspension of the application of this measurement criterion.Any difference between the book value and fair value reduced by sales costs is posted to the income statement as animpairment loss; any subsequent recoveries in value are recognised up to the amount of the previously recognised impairmentlosses, including those recognised prior to the asset being classified as held for sale.Other non-current assetsOther current and non-current assets are initially measured at fair value, and subsequently at the amortised cost previouslydescribed.FINANCIAL LIABILITIES, TRADE AND OTHER PAYABLES, OTHER LIABILITIESFinancial liabilities, trade and other payables and other liabilities are initially recorded at fair value reduced by any transactionrelatedcosts; they are subsequently recognised at amortised cost using the effective interest rate for discounting.Recording and elimination of financial liabilitiesFinancial liabilities are recorded under balance sheet liabilities at the time the company becomes a party to agreements relatedto such liabilities. Financial liabilities sold are eliminated from balance sheet liabilities when the right to disburse cash flows istransferred together with all risks and benefits associated with ownership.PROVISIONS FOR RISKS AND CHARGESProvisions for risks and charges concern costs and charges of a certain nature which are certain or likely to be incurred, butwhose amount or date of occurrence cannot be determined at the end of the year. Provisions are recognised when: (i) theexistence of a current legal or implied obligation deriving from a past event is likely; (ii) it is likely that the fulfilment of theobligation will involve a cost; and (iii) the amount of the obligation can be reliably determined. Provisions are recorded ata value representing the best estimate of the amount that the company would reasonably pay to fulfil the obligation or totransfer it to third parties at the end of the reporting period. Provisions related to contracts with valuable consideration arerecorded at the lower of the cost necessary to fulfil the obligation, less the expected economic benefits deriving from thecontract, and the cost to terminate the contract.6 An impairment loss recognised in an interim period cannot be reversed even if, on the basis of conditions in a subsequent interim period, the impairmentloss would have been lower or not recognised.<strong>Snam</strong> <strong>Annual</strong> <strong>Report</strong> <strong>2011</strong>
148<strong>Snam</strong> <strong>Annual</strong> <strong>Report</strong> <strong>2011</strong> / Notes to the consolidated financial statementsWhen the financial impact of time is significant, and the payment dates of the obligations can be reliably estimated, theprovision is calculated by discounting the anticipated cash flows in consideration of the risks associated with the obligation atthe company’s average debt rate; the increase in the provision due to the passing of time is posted to the income statementunder “Financial income (expense)”.When the liability is related to property, plant and equipment (e.g. site dismantlement and restoration), the provisionis recognised as a counter-entry to the related asset; posting to the income statement is accomplished throughamortisation.The costs that the company expects to incur to initiate restructuring programmes are recorded in the period in whichthe programme is formally defined, and the parties concerned have a valid expectation that the restructuring will takeplace.Provisions are periodically updated to reflect changes in cost estimates, selling periods and the discount rate; revisions inprovision estimates are allocated to the same item of the income statement where the provision was previously reported or,when the liability is related to property, plant and equipment (e.g. site dismantlement and restoration), as a counter-entry tothe related asset.The notes to the financial statements describe contingent liabilities represented by: (i) possible (but not probable) obligationsresulting from past events, the existence of which will be confirmed only if one or more future uncertain events occur whichare partially or fully outside the company’s control; and (ii) current obligations resulting from past events, the amount of whichcannot be reliably estimated, or the fulfilment of which is not likely to involve costs.EMPLOYEE BENEFITSBenefits following termination of employment are defined according to plans, including non-formalised, which dependingon their characteristics are “defined-contribution” and “defined-benefit” plans. In defined-contribution plans the company’sobligation is calculated, limited to the payment of state contributions or to equity or a legally separate entity (fund), based oncontributions due.The liability relating to defined-benefit plans, excluding any assets servicing the plan, is calculated based on actuarialassumptions and recognised for each period according to the period of work necessary to obtain the benefits.Actuarial profits and losses relating to defined-benefit plans deriving from changes in the actuarial assumptions used oramendments to the conditions of the plan are recognised pro rata in the income statement, for the remaining average workinglife of the employees participating in the plan, if and insofar as their net value not recognised at the end of the previous periodexceeds the greater of 10% of the liabilities relating to the plan and 10% of the fair value of the assets servicing the plan(corridor method).The obligations relating to long-term benefits are calculated using actuarial assumptions; the effects deriving from theamendments to the actuarial assumptions or the characteristics of the benefits are recognised entirely in the income statement.TREASURY SHARESTreasury shares are recognised at cost and entered as a reduction of shareholders’ equity. The economic effect deriving fromany subsequent sales are recognised in shareholders’ equity.REVENUE AND COSTSRevenue from sales and the provision of services is recognised upon the effective transfer of the risks and benefits typicallyrelating to ownership or on the fulfilment of the service and when it is likely that the financial benefits deriving from thetransaction will be realised by the vendor or the provider of the service.As regards the activities carried out by <strong>Snam</strong> the moment of recognition of the revenue coincides with the provision of theservice.Revenue provisions relating to services partially rendered are recognised by the fee accrued, as long as it is possible to reliablydetermine the stage of completion and there are no significant uncertainties over the amount and the existence of the revenueand the relative costs, otherwise they are recognised within the limits of the actual recoverable costs.<strong>Snam</strong> <strong>Annual</strong> <strong>Report</strong> <strong>2011</strong>
<strong>Snam</strong> <strong>Annual</strong> <strong>Report</strong> <strong>2011</strong> / Notes to the consolidated financial statements149Property, plant and equipment, unlike assets used under concession, transferred from customers (or realised with the assetstransferred from customers) and functional to their connection to a network for the provision of a supply are recognised at fairvalue as a counter- entry to the revenue in the income statement. When the agreement stipulates the provision of multipleservices (e.g. connection and supply of goods) it is checked against which service provided the asset was transferred from thecustomer and, accordingly, the disclosure of the revenue is recognised on connection or along the lower of the term of thesupply and the useful life of the asset.Revenues are recorded net of returns, discounts, allowances and bonuses, as well as directly related taxes.Since they do not represent sales transactions, exchanges between goods or services of a similar nature and value are notrecognised in revenues and costs.The costs are recognised when they relate to goods and services sold or consumed during the period or by systematic allocation,or when it is not possible to identify their future use.Costs relating to emissions shares, calculated based on the average of the current prices on the main European markets at theclose of the period, are disclosed in the amount of the carbon dioxide emission share in excess of the shares assigned, the costsof the purchase of the emission rights are capitalised and disclosed as intangible assets net of any negative balance betweenemissions made and shares assigned. Earnings relating to emissions shares are disclosed at the point of realising the earningsby the transfer. In the case of transfers, if applicable, the emission rights purchased are considered sold first. The monetaryreceivables assigned in place of the free assignment of emissions shares are disclosed as a counter-entry to the item, “Otherincome” in the income statement.Fees relating to operating leases are charged to the income statement for the duration of the contract.Costs for the acquisition of new knowledge or discoveries, investigations into products or alternative processes, new techniquesor models, the design and construction of prototypes, or incurred for other scientific research or technological developments,which do not meet the conditions for disclosure under balance sheet assets are considered current costs and charged to theincome statement for the period they are incurred.Costs sustained for share capital increases are recorded as a reduction of shareholders’ equity, net of taxes.STOCK OPTIONSPersonnel expenses include, consistent with the substantial nature of the remuneration that they comprise, stock optionsassigned to executives. The cost is determined with reference to the fair value of the option assigned to the executive at thetime of making the commitment and is not subject to any subsequent adjustment; the portion due for the year is determinedpro rata temporis over the period to which the incentive refers (the vesting period) 7 . The fair value is represented by the valueof the option determined by applying appropriate valuation techniques which take account of the conditions of exercise ofthe option, the current share value, the expected volatility and the risk-free interest rate, and is recorded with offsetting in theitem “Other reserves”.EXCHANGE RATE DIFFERENCESThe assets and liabilities included in the balance sheet are represented in the currency of the main economic environment inwhich the company operates. The consolidated data are represented in Euros, which is the working currency of the companyand the group.Revenues and costs relating to transactions in currencies other than the working currency are recognised at the exchange ratein effect on the day when the transaction was carried out.Monetary assets and liabilities in currencies other than the working currency are converted into Euros by applying the exchangerate in effect on the reporting date, with attribution of the impact to the income statement. Non-monetary assets andliabilities in currencies other than the working currency and valued at cost are recognised at the initially recorded exchangerate; when the measurement is made at fair value or recoverable or realisable value, the exchange rate used is the one in effecton the date of determination of the value.7 The period between the date of making the commitment and the date on which the option may be exercised.<strong>Snam</strong> <strong>Annual</strong> <strong>Report</strong> <strong>2011</strong>
150<strong>Snam</strong> <strong>Annual</strong> <strong>Report</strong> <strong>2011</strong> / Notes to the consolidated financial statementsDIVIDENDS RECEIVEDDividends are recognised at the date of the resolution passed by the Shareholders’ Meeting, unless it is not reasonably certainthat the shares will be sold before the ex-dividend date.DISTRIBUTION OF DIVIDENDSThe distribution of dividends to the company’s shareholders entails the recording of a payable in the financial statements forthe period in which the distribution was approved by the company’s shareholders or, in the case of interim dividends, by theBoard of Directors.INCOME TAXESCurrent income taxes are calculated by estimating the taxable income. Receivables and payables for current income taxes arerecognised based on the amount which is expected to be paid/recovered to/from the tax authorities under the prevailing taxregulations and rates or those essentially approved at the reporting date.In particular, with regard to corporate income tax (IRES), since 2004 the company, jointly with Eni S.p.A., has exercised theoption offered by the national tax consolidation scheme, which allows IRES to be determined on a taxable base correspondingto the algebraic sum of the positive and negative taxable amounts of the individual companies included in the scope ofconsolidation.The economic relations, as well as the reciprocal responsibilities and obligations, between Eni S.p.A. and the other groupcompanies entering the scope of consolidation are defined in the “Regulations on participation in the national taxconsolidation scheme by companies of the Eni group”, under which: (i) subsidiaries with positive taxable income transferto Eni the financial resources corresponding to the additional tax payable by Eni due to their participation in the nationaltax consolidation scheme; and (ii) those with negative taxable income receive a payment equal to the relevant tax savingmade by Eni S.p.A. if and insofar as they have profitability prospects which would have made it possible, in the absence ofthe national tax consolidation scheme, to recognise prepaid tax assets. Consequently, the relevant tax, net of paymentsmade on account and withholdings applied, is recognised under the item “Trade and other payables”/“Trade and otherreceivables”.Regional production tax (IRAP), net of payments made on account, is recognised under the item “Current income taxliabilities”/“Current income tax assets”.Deferred and prepaid income taxes are calculated on the timing differences between the values of the assets and liabilitiesentered in the balance sheet and the corresponding values recognised for tax purposes. The recording of prepaid tax assets ismade when their recovery is regarded as probable.Prepaid tax assets and deferred tax liabilities are classified under non-current assets and liabilities and are offset at individualcompany level if they refer to taxes which can be offset. The balance of the offsetting, if it results in an asset, is recognisedunder the item “Prepaid tax assets”; if it results in a liability, it is recognised under the item “Deferred tax liabilities”.When the results of the operations are recorded directly under shareholders’ equity, the current taxes, prepaid tax assets anddeferred tax liabilities are also attributed to shareholders’ equity.DERIVATIVESDerivatives are assets and liabilities recognised at fair value. The fair value of the derivatives is calculated based on the marketlistings or, in their absence, is estimated based on appropriate valuation techniques which use financial variables updatedand used by market operators and, where possible, in consideration of the prices of recent transactions on similar financialinstruments. If there is objective evidence of impairment the derivatives are disclosed net of the allocation made to the relativeprovision for impairment losses.Derivatives are classified as hedging instruments when the relationship between the derivative and the hedged item is formallydocumented and the effectiveness of the hedge, verified periodically, is high. When hedging derivatives hedge the risk ofchanges in the fair value of the hedged instruments (“fair value hedge”; e.g. hedge of the risk of fluctuations in the fairvalue of fixed-rate assets/liabilities), the derivatives are recognised at fair value with attribution of the effects on the income<strong>Snam</strong> <strong>Annual</strong> <strong>Report</strong> <strong>2011</strong>
<strong>Snam</strong> <strong>Annual</strong> <strong>Report</strong> <strong>2011</strong> / Notes to the consolidated financial statements151statement; by the same token, the hedged instruments are adjusted to reflect the changes in fair value associated with thehedged risk. When derivatives hedge the risk of changes in cash flows from the hedged instruments (“cash flow hedge”; e.g.hedge of changes in cash flows from assets/liabilities due to fluctuations in interest rates), the changes in the fair value of thederivatives are initially recognised in shareholders’ equity and subsequently attributed to the income statement in the sameway as the economic effects produced by the hedged operation.Satisfaction of the requirements defined by IAS 39 for hedge accounting is verified periodically.Changes in the fair value of derivatives which do not satisfy the requirements to be classed as hedging instruments arerecognised in the income statement.SEGMENT INFORMATIONThe information about business segments has been prepared in accordance with the provisions of IFRS 8 “Operatingsegments”, which requires the information to be presented in a manner consistent with the procedures adopted by thecompany’s management when taking operational decisions. Consequently, the identification of the operating segments andthe information presented are defined on the basis of the internal reporting used by the company’s management for allocatingresources to the different segments and for analysing the respective performances.An operating segment is defined by IFRS 8 as a component of an entity: (i) that engages in business activities from which itmay earn revenues and incur expenses (including revenues and expenses relating to transactions with other components ofthe same entity); (ii) whose operating results are regularly reviewed by the entity’s most senior decision-makers for purposesof making decisions about resources to be allocated to the segment and assessing its performance; and (iii) for which separatefinancial information is available.The declared operating segments are as follows: (i) natural gas transportation; (ii) liquefied natural gas (LNG) regasification;(iii) natural gas storage; and (iv) natural gas distribution. They relate to activities carried out predominantly by <strong>Snam</strong> Rete Gas,GNL Italia, Italgas and Stogit, respectively.Financial statements 8The items on the balance sheet are classified as “current” and “non-current”, while those on the income statement areclassified according to their nature.The statement of comprehensive income shows the integrated income statement of income and expense which are discloseddirectly in shareholders’ equity through the express IFRS provisions.The statement of changes in shareholders’ equity reports the total comprehensive income (expense) for the period, shareholdertransactions and the other changes in shareholders’ equity.The statement of cash flows is prepared using the “indirect” method, adjusting the profit for the period from non-monetarycomponents.It is considered that these statements adequately represent the group’s situation with regard to its balance sheet, incomestatement and financial position.4) Use of estimatesThe application of generally accepted accounting principles for the preparation of financial statements and interim reportsinvolves management making accounting estimates based on complex and/or subjective judgements, estimates based on pastexperience and assumptions regarded as reasonable and realistic on the basis of the information known at the time of theestimate.The use of these accounting estimates has an influence on the book value of the assets and liabilities and on the informationabout potential assets and liabilities at the reporting date, as well as the amount of revenues and costs in the reference period.The actual results may differ from the estimated results owing to the uncertainty that characterises the assumptions and theconditions on which the estimates are based.8 The financial statements are the same as those adopted for the 2010 annual report.<strong>Snam</strong> <strong>Annual</strong> <strong>Report</strong> <strong>2011</strong>
152<strong>Snam</strong> <strong>Annual</strong> <strong>Report</strong> <strong>2011</strong> / Notes to the consolidated financial statementsDetails are given below about the critical accounting estimates involved in the process of preparing the financial statementsand interim reports, since they involve a high degree of recourse to subjective judgements, assumptions and estimationsregarding matters that are by nature uncertain. Any change in the conditions forming the basis of the judgements, assumptionsand estimations used could have a significant impact on subsequent results.Impairment lossesProperty, plant and equipment and intangible assets are impaired when events or changes in circumstances give cause tobelieve that the book value is not recoverable. The events which may give rise to an impairment of assets include changes inbusiness plans, changes in market prices or reduced use of plants. The decision on whether to apply an impairment and thequantification of any such impairment depend on the assessments of management concerning complex and highly uncertainfactors, such as future price trends, the impact of inflation and technological improvements on production costs, productionprofiles and conditions of supply and demand on a global or regional scale.The impairment is determined by comparing the book value with the related recoverable value, represented by the greater ofthe fair value, net of disposal costs, and the usage value, determined by discounting the expected cash flows deriving from theuse of the asset. The expected cash flows are quantified in light of the information available at the time of the estimate, onthe basis of subjective judgements regarding future trends in variables – such as prices, costs, the rate of growth of demand,production profiles – and are updated using a rate that takes account of the risk inherent in the asset concerned.Goodwill and other intangible assets with an indefinite useful life are not subject to amortisation; the recoverability of theirbook value is verified at least once a year and in any case whenever any event occurs which might involve impairment. Withreference to goodwill, the verification is carried out at the level of the smallest aggregate (cash-generating unit) to which thegoodwill can be reasonably and consistently attributed; this unit represents the basis on which management assesses, directlyor indirectly, the return on investment. When the book value of the cash-generating unit, including the goodwill attributed toit, exceeds the recoverable value 9 , the difference is subject to impairment, which is attributed by priority to the goodwill up toits amount; any surplus in the impairment with respect to the goodwill is attributed pro rata to the book value of the assetswhich constitute the cash-generating unit.Site dismantlement and restoration<strong>Snam</strong> incurs significant liabilities associated with obligations of removal and dismantlement of plants or parts of plants.Estimating future dismantlement and restoration costs is a complex process and requires the assessment and judgement ofthe company’s management in placing a value on the liabilities which will be incurred many years in the future for complyingwith dismantlement and restoration obligations, which often cannot be completely defined by laws, administrative regulationsor contractual clauses. In addition, these obligations are affected by constant changes in technology and in dismantlement andrestoration costs, as well as the constant growth of political and public awareness regarding matters of health and protectionof the environment.The criticality of estimates of dismantlement and restoration costs also depends on the accounting method used for thesecosts, whose current value is initially capitalised, along with the cost of the asset to which they relate, offset against theprovision for risks and charges. Subsequently, the value of the provision for risks and charges is increased to reflect the passingof time and any changes in the estimation as a result of changes in expected cash flows, the timing of their realisation andthe discount rates applied. The determination of the discount rate to be used both in the initial valuation of the cost and insubsequent valuations is the result of a complex process which involves subjective judgements on the part of the company’smanagement.Business combinationsThe reporting of business combination transactions involves the attribution, to the assets and liabilities of the acquiredcompany, of the difference between the acquisition cost and the net book value. For the majority of assets and liabilities, the9 For the definition of recoverable value see the section “Property, plant and equipment”.<strong>Snam</strong> <strong>Annual</strong> <strong>Report</strong> <strong>2011</strong>
<strong>Snam</strong> <strong>Annual</strong> <strong>Report</strong> <strong>2011</strong> / Notes to the consolidated financial statements153attribution of the difference is carried out by recognising the assets and liabilities at their fair value. The unattributed portion, ifpositive, is recognised as goodwill; if negative, it is attributed to the income statement. In the attribution process, <strong>Snam</strong> drawson the available information and, for the most significant business combinations, on external valuations.Environmental liabilities<strong>Snam</strong> is subject, in relation to its activities, to numerous laws and regulations on the protection of the environment at European,national, regional and local level, including the laws which implement international conventions and protocols relating to theactivities carried out. With reference to this legislation, when it is probable that the existence and amount of a large liabilitycan be reliably estimated, provisions are made for the associated costs.While the company does not currently believe that there will be any particularly significant negative effects on its financialstatements due to non-compliance with environmental legislation, including taking account of the interventions alreadymade, the possibility can nevertheless not be ruled out that <strong>Snam</strong> might incur substantial additional costs or responsibilities,since with the current state of knowledge it is impossible to foresee the effects of future developments, in view of factors suchas: (i) the potential for contaminations emerging; (ii) the refurbishment in progress and to be followed and the other possibleeffects arising from the application of Environmental Minister Decree No. 471/1999; (iii) the possible effects of new laws andregulations for environmental protection; (iv) the effects of any technological innovations for environmental cleansing; (v) thepossibility of disputes and the difficulty of determining the possible consequences, including in relation to the liability of otherparties and to possible compensation payments.Employee benefitsDefined-benefit plans are valued on the basis of uncertain events and actuarial assumptions which include, among other things,the discount rates, the expected returns on the assets servicing the plans, the level of future remuneration, the retirement ageand future trends in the healthcare expenses covered.The principal assumptions used for the quantification of post-employment benefits are determined as follows: (i) the discountand inflation rates representing the base rates at which the obligation to employees might actually be fulfilled are basedon the rates which mature on high-quality bonds (government bonds) and on inflation expectations; (ii) the level of futureremuneration is determined on the basis of elements such as inflation expectations, productivity, career advancement andseniority; (iii) the future cost of healthcare services is determined on the basis of elements such as present and past trends inhealthcare costs, including assumptions regarding the inflationary growth of costs, and changes in the health of the participatingemployees; (iv) the demographic assumptions reflect the best estimates of trends in variables such as mortality, turnover,invalidity and others in relation to the population of the participating employees; (v) the return on the assets servicing theplans is determined on the basis of the weighted average of the expected future yields, differentiated by class of investment(fixed income, equity, money market).The differences between the actual and expected costs and between the actual and expected returns on the assets servicingthe plan are verified in the normal manner and are defined as actuarial profits or losses. The actuarial profits and losses arerecognised pro rata in the income statement for the remaining average working life of the employees who take part in the plan,if and insofar as their net value not recognised at the end of the previous period exceeds the greater of 10% of the currentvalue of the liabilities relating to the plan and 10% of the fair value of the assets servicing the plan (the “corridor method”).Actuarial assumptions are also used for determining obligations relating to long-term benefits; to this end, the effects arisingfrom changes to the actuarial assumptions or the characteristics of the benefit are recognised entirely on the income statement.ProvisionsIn addition to recognising environmental liabilities and obligations to remove property, plant and equipment and restore sites,and liabilities relating to employee benefits, <strong>Snam</strong> makes provisions relating mainly to legal and tax disputes. The estimationof the provisions for these purposes is the result of a complex process involving subjective judgements on the part of thecompany’s management.<strong>Snam</strong> <strong>Annual</strong> <strong>Report</strong> <strong>2011</strong>
154<strong>Snam</strong> <strong>Annual</strong> <strong>Report</strong> <strong>2011</strong> / Notes to the consolidated financial statements5) Recently issued IFRSAccounting standards and interpretations issued by the IASB/IFRIC and endorsed by the European CommissionRegulation (EU) No. 1205/<strong>2011</strong> issued by the European Commission on 22 November <strong>2011</strong> harmonised the amendments toIFRS 7 “Financial instruments: Disclosures –Transfers of Financial Assets”, which provide for the additional disclosure of financialinstruments, with reference to transfers of financial assets, in order to describe the risks to which the company remainsexposed through the transferred assets. The new provisions require, among other things, additional disclosure in the event thata company makes significant transfers of financial assets near the end of the financial year. The new provisions are effectiveas of financial years beginning on or after 1 July <strong>2011</strong> (2012 financial statements for <strong>Snam</strong>).Accounting standards and interpretations issued by the IASB/IFRIC and not yet endorsed by the European CommissionOn 12 November 2009, the IASB issued IFRS 9 “Financial Instruments” (subsequently “IFRS 9”) which amends the criteriafor recognising and measuring financial assets and their respective classification on financial statements. In particular, thenew provisions stipulate, among other things, a model for classifying and measuring financial assets based exclusively on thefollowing categories: (i) assets measured at amortised cost; (ii) assets measured at fair value. The new provisions also providethat equity investments other than those in subsidiaries, jointly controlled entities or associates must be measured at fair valueand posted to the income statement. In the event that such equity investments are not held for trading purposes, changes in fairvalue may be recognised on the statement of comprehensive income, maintaining on the income statement solely the effectsassociated with dividend distributions; the amounts recognised on the statement of comprehensive income are not posted tothe income statement upon disposal of the equity investment. On 28 October 2010, the IASB supplemented the provisions ofIFRS 9 by including criteria for recognising and measuring financial liabilities. In particular, the new provisions require, amongother things, that if a financial liability is measured at fair value and posted to the income statement, the changes in fair valueassociated with changes in the issuer’s credit risk (i.e. own credit risk) are to be recognised in the statement of comprehensiveincome; this component is to be posted on the income statement to ensure symmetrical representation with other financialstatement items associated with the liability, avoiding an accounting mismatch. The document “Mandatory effective date andtransition disclosures”, issued by the IASB on 16 December <strong>2011</strong> postponed the entry into force of the provisions of IFRS 9 tothe periods that began on, or after, 1 January 2015 (the prior provisions referred to 1 January 2013).On 12 May <strong>2011</strong>, the IASB published IFRS 10, “Consolidated Financial Statements” (subsequently “IFRS 10”), together with theupdated version of IAS 27, “Separate Financial Statements” (subsequently “IAS 27”), which set out, respectively, the principlesto be adopted for the presentation and preparation of consolidated financial statements and individual financial statements.IFRS 10 provides, inter alia, a new definition of control to be applied uniformly to all companies (including holding companies).According to this definition, a company controls an associate when the company is exposed, or has rights, to variable returnsfrom its involvement with the associate and has the ability to affect those returns through its power over the associate. Thestandard lists the factors to be considered when assessing whether control exists, which include, inter alia, potential rights,protective rights, whether the investor acts as an agent or franchising arrangements. Furthermore, the new provisions alsorecognise the possibility of exercising control over an associate even without holding the majority of voting rights due to adispersed shareholder base or the passive attitude of other investors. The provisions of IFRS 10 and the new version of IAS 27will take effect from financial years starting on or after 1 January 2013.On 12 May <strong>2011</strong>, the IASB published IFRS 11, “Joint Arrangements” (subsequently “IFRS 11”), and the updated version of IAS28, “Investments in Associates and Joint Ventures” (subsequently “IAS 28”). IFRS 11 identifies two types of arrangement basedon the rights and obligations for participants: the joint operations and the joint ventures, and also sets out the accountingtreatment to be adopted for their recognition on financial statements. For the recognition of joint ventures, the new provisionsindicate the equity method as the only permitted treatment, removing the possibility of using proportional consolidation.The updated version of IAS 28 defines, inter alia, the accounting treatment to be adopted in the event of the total or partialdivestment of a holding in an associate or joint venture. The provisions of IFRS 11 and the new version of IAS 28 will take effectfrom financial years starting on or after 1 January 2013.<strong>Snam</strong> <strong>Annual</strong> <strong>Report</strong> <strong>2011</strong>
<strong>Snam</strong> <strong>Annual</strong> <strong>Report</strong> <strong>2011</strong> / Notes to the consolidated financial statements155On 12 May <strong>2011</strong>, the IASB issued IFRS 12, “Disclosure of Interests in Other Entities” (subsequently “IFRS 12”), which indicatesthe disclosures required in the consolidated financial statements concerning subsidiaries, joint ventures and associates, inaddition to structured entities not included within the scope of consolidation. The provisions of IFRS 12 will be in effectstarting from the periods beginning on or after 1 January 2013.On 12 May <strong>2011</strong>, the IASB published IFRS 13, “Fair Value Measurement” (subsequently “IFRS 13”), relating to the definitionof a single framework for fair value measurement, required or granted by other IFRSs, and financial disclosures. Fair value isdefined as the price that would be received to sell an asset or paid to transfer a liability in an ordinary transaction betweenmarket participants. The provisions of IFRS 13 will be in effect starting from the periods beginning on or after 1 January 2013.On 16 June <strong>2011</strong>, the IASB issued Amendments to IAS 1, “Presentation of Items of Other Comprehensive Income”, whichintroduce, inter alia, the obligation of consolidating components of comprehensive income based on the possibility of theirreclassification in the income statement according to the reference IFRSs (reclassification adjustments). The provisions willtake effect from financial years starting on or after 1 July 2012 (2013 for <strong>Snam</strong>).On 16 June <strong>2011</strong>, the IASB issued the new version of IAS 19 “Employee Benefits” which introduce, inter alia: (i) the obligationto recognise actuarial gains and losses in the statement of comprehensive income, removing the possibility of adopting thecorridor method. Actuarial gains and losses recognised in the statement of comprehensive income are not subsequentlyposted to the income statement; and (ii) the removal of the separate disclosure of cost components relating to defined-benefitliabilities, represented by the anticipated asset yield servicing the plan and the interest cost, and the replacement with theaggregate, “net interest”. This aggregate is calculated by applying the discount rate defined for liabilities to the liabilities, net ofthe assets servicing the plan. The new provisions also require additional disclosures to be provided, particularly with referenceto defined-benefit plans. The provisions will take effect from financial years starting on or after 1 January 2013.On 16 December <strong>2011</strong>, the IASB issued Amendments to IAS 32 “Offsetting Financial Assets and Financial Liabilities” (subsequentlythe “Amendments to IAS 32”) and Amendments to IFRS 7 “Disclosures – Offsetting Financial Assets and Financial Liabilities”(subsequently “Amendments to IFRS 7”), which provide criteria to be adopted for offsetting financial assets and liabilities andthe relative reporting obligations, respectively. More specifically, the Amendments to IAS 32 set out that: (i) for the purposesof offsetting, the right to offset must be legal in each circumstance or be within normal conduct of operations or in theevent of insolvency, default or bankruptcy of one of the contracting parties; and (ii) on determining certain conditions, thesimultaneous settlement of financial assets and liabilities on a gross basis with the consequent removal or significant reductionof credit and liquidity risk, can be considered equivalent to settlement on a net basis. The provisions of the Amendments toIAS 32 are in effect starting from periods beginning on or after 1 January 2014. The Amendments to IFRS 7 relating to financialreporting are in effect from period beginning on or after 1 January 2013.At present, <strong>Snam</strong> is analysing the standards mentioned and is assessing whether their adoption will have a significant impacton the financial statements.<strong>Snam</strong> <strong>Annual</strong> <strong>Report</strong> <strong>2011</strong>
156<strong>Snam</strong> <strong>Annual</strong> <strong>Report</strong> <strong>2011</strong> / Notes to the consolidated financial statementsCurrent assets6) Cash and cash equivalentsCash and cash equivalents of €2 million (€8 million at 31 December 2010) concern current account deposits at the ultimateparent, Eni. They are not subject to any usage restrictions.7) Trade and other receivablesTrade and other receivables of €1,545 million (€944 million at 31 December 2010) comprise:(€ million) 31.12.2010 31.12.<strong>2011</strong>Trade receivables 777 1,367Financial receivables:- Held for operations 2 2Other receivables 165 176944 1,545These are reported net of the provision for impairment losses of €39 million (€36 million at 31 December 2010). The activityin the provision for impairment losses on receivables during the year is shown below:(€ million)Balance at 1.1.<strong>2011</strong>ProvisionsOther changesBalance at 31.12.<strong>2011</strong>Trade receivables 33 4 (1) 36Other receivables 3 336 4 (1) 39The provision for the period of €4 million refers to the natural gas storage (€2 million) and distribution (€2 million) businesssegments.Trade receivables of €1,367 million (€777 million at 31 December 2010) mainly refer to the natural gas storage (€525million), transportation (€517 million) 10 and distribution (€316 million) business segments.For the storage business segment in particular, receivables mainly relate to fees charged on the use, by users, of strategicgas (gas not integrated by those users according to the terms of the Storage Code) which, when collected according tothe regulatory framework in force, will be reversed into the Electricity Equalisation Fund. Considering the current regulatoryframework (Resolution ARG/gas 119/10, Article 10, paragraph 5 in Appendix A) which leaves the storage company in a neutralposition with regard to the effects of the withdrawal of strategic gas by users, against credits for the use of strategic gas notreplenished, the recognition of a liability of equal amount was provided.During <strong>2011</strong>, <strong>Snam</strong> transferred trade receivables without recourse or notification, including not due, €55 million with an increaseof cash equivalents by the same amount. The transfer concerned trade receivables relating to the natural gas transportation10 With effect from 1 December <strong>2011</strong> the trade receivables include the receivables deriving from the provision of the natural gas balancing service (€120 million), in application of Electricity and Gas Authority Resolution ARG/gas 45/11. According to this provision, the larger natural gas transportationcompany assumes responsibility for the total balancing of the natural gas transportation system, procures the storage resources necessary to meet theimbalance of the individual users and settles the balances of the fees.<strong>Snam</strong> <strong>Annual</strong> <strong>Report</strong> <strong>2011</strong>
<strong>Snam</strong> <strong>Annual</strong> <strong>Report</strong> <strong>2011</strong> / Notes to the consolidated financial statements157segment. By virtue of the contractual provisions agreed, <strong>Snam</strong> provides for the cash management of the receivables transferredand, within the limits of these, the transfer of the amounts received to the factoring company.Other receivables of €176 million (€165 million at 31 December 2010) comprise:(€ million) 31.12.2010 31.12.<strong>2011</strong>Receivables from investment/divestment activities 78 41- IRES receivables for the national tax consolidation scheme 10 35- Group VAT credit 4 4Other receivables:- Cassa Conguaglio Settore Elettrico (Electricity Equalisation Fund) 44 26- VAT advance 7 26- Advances to suppliers 10 26- Other 12 1873 96165 176Receivables from investment/divestment activities (€41 million) concern receivables from disposal of property, plant andequipment and intangible assets (€22 million) and public and private grants entered against investment activities (€19million).IRES receivables for the national tax consolidation scheme (€35 million) concern: (i) greater advance tax payments (€28million), (ii) receivables with the ultimate parent Eni (€7 million) relating to the IRES refund request for 10% of the regionalproduction tax (IRAP) for the 2004, 2005, 2006 and 2007 tax years (pursuant to Article 6 of Legislative Decree No. 185 of 28November 2008, enacted by Law No. 2 of 28 January 2009).Receivables from the Cassa Conguaglio Settore Elettrico (Electricity Equalisation Fund) (€26 million) concern: (i) additionaltariff components in the distribution segment (€16 million); (ii) receivables for energy efficiency certificates 11 (€10 million).The residual item “Other”, in the amount of €18 million, essentially comprises receivables with government bodies.The fair value measurement of trade and other receivables has no material impact considering the short period of time fromwhen the receivable arises and its due date.All receivables are in Euros. Receivables from related parties are described in Note 36, “Related-party transactions”. Informationon credit risk can be found in Note 28 “Guarantees, commitments and risks – Credit risk”.8) InventoriesInventories of €235 million (€147 million at 31 December 2010) are analysed in the table below:31.12.2010 31.12.<strong>2011</strong>(€ million)GrossamountImpairmentlossesNetamountGrossamountImpairmentlossesNetamount ChangeRaw materials, consumables and supplies 101 (6) 95 194 (6) 188 93Finished products and goods 52 52 47 47 (5)153 (6) 147 241 (6) 235 8811 Legislative Decree No. 164 of 23 May 2000 stipulates that natural gas distribution firms set consumption reduction and energy savings targets tobe met through raising energy efficiency, and that they are awarded energy efficiency certificates (established by the Ministerial Decrees of 20 July2004) depending on the results achieved. The energy efficiency targets can be met either by implementing energy efficiency policies or by purchasingcertificates from other parties. Once the energy efficiency target is met, cancelling the excess certificates triggers repayment by the Cassa Conguagliodel Settore Elettrico (Electricity Equalisation Fund) on the basis of dedicated funds built up through distribution tariff increases.<strong>Snam</strong> <strong>Annual</strong> <strong>Report</strong> <strong>2011</strong>
158<strong>Snam</strong> <strong>Annual</strong> <strong>Report</strong> <strong>2011</strong> / Notes to the consolidated financial statementsInventories of raw materials, consumables and supplies (€188 million) primarily include: (i) natural gas used for transportationactivities (€121 million); (ii) stock materials relating to the pipeline network (€35 million), the distribution network (€23million) and storage plants (€6 million).The inventories of finished products and goods (€47 million) refer to the natural gas present in the storage system (585million standard cubic metres compared with 642 million cubic metres at 31 December 2010) and do not include compulsoryinventories 12 , recognised under non-current assets on the balance sheet.The change for the period (€88 million) refers essentially to the transportation segment (€86 million) and is attributableto the natural gas transferred by the users and used to conduct the service pursuant to Resolution ARG/gas 184/09 13 of theElectricity and Gas Authority.Pseudo-working gas 14 that could no longer be supplied and reinjected into an annual storage cycle (3,632 million standardcubic metres corresponding to €294 million) was classified under the item “Property, plant and equipment”. This classificationis the result of a recent technical analysis carried out with the collaboration of the Polytechnic of Turin and the Ministry forEconomic Development, which demonstrated that the above volume of natural gas, while having the necessary and consistentplant modifications, could not be supplied and reinjected into an annual storage cycle without inducing instability risks overtime. In line with the provisions of IAS 1, the corresponding value of the pseudo-working gas at 31 December 2010 wasreclassified from the item “Inventories” to the item “Property, plant and equipment”.Inventories are stated net of the provision for impairment losses of €6 million (unchanged from 31 December 2010), set upto account for slow-moving materials.Inventories are not collateralised. Inventories do not secure liabilities, nor are they recognised at net realisation value.9) Current income tax assets and other current tax assetsCurrent income tax assets of €3 million primarily concern the IRAP credit (€2 million).Other current tax assets, in the amount of €5 million (€4 million at 31 December 2010) primarily concern credits for gasconsumption tax (€2 million) and VAT refund credits (€2 million).Note 33 “Income taxes” provides information about taxes for the year.10) Other current assetsOther current assets of €33 million (€71 million at 31 December 2010) comprise:(€ million) 31.12.2010 31.12.<strong>2011</strong>Accrued income from regulated activities 63 1163 11Other current assets:- Prepayments 8 228 2271 3312 The compulsory inventories are described in Note 12 “Compulsory inventories”.13 Resolution ARG/gas 184/09 of the Electricity and Gas Authority defined the method of payment in kind, by users of the service to the leadingtransportation company, of the quantities of gas covering fuel gas, network losses and Unaccounted-For Gas (UFG). Specifically, this resolution provided:(i) for fuel gas, for the introduction of an adjustment mechanism for differences between the quantities allocated and effective consumption; (ii) fornetwork losses, for the introduction of an adjustment mechanism for the difference between the estimated quantities to be allocated according tothe Electricity and Gas Authority and the actual quantities allocated; and (iii) for Unaccounted-For Gas (UFG), to allocate the differences between thequantities allocated from users and the consumption to the leading transportation company.14 Working gas can be categorised into: (i) Working gas that can be supplied, which is the gas that is injected cyclically and supplied from the storage fieldduring the course of the storage cycle, i.e. gas which can be made available and reintegrated to be used for the purposes of storage service provision;and (ii) Pseudo-working gas, which is the gas in storage that can be likened to cushion gas, because it is functional for the use of working gas that canbe supplied and is not subject to allocation to users.<strong>Snam</strong> <strong>Annual</strong> <strong>Report</strong> <strong>2011</strong>
<strong>Snam</strong> <strong>Annual</strong> <strong>Report</strong> <strong>2011</strong> / Notes to the consolidated financial statements159Accrued income from regulated activities of €11 million relates to: (i) penalties for the 2007-2008 thermal year under theResolution ARG/gas 27/10, repaid to users of the transportation service during <strong>2011</strong> and to be recovered by tariff adjustment(€6 million); (ii) the current portion (€5 million) of assets recorded against the recognition by the Electricity and Gas Authority,of additional expenses borne during the second regulatory period (1 October 2005 - 31 December 2009) for the purchase offuel gas used in the transportation business 15 .Prepayments (€22 million) mainly refer to the settlement to be received in kind from the users of the natural gas transportationservice, calculated as the difference between the quantities of fuel gas used in 2010 for the provision of the service and thequantities allocated by the users in the same year, pursuant to Resolution ARG/gas 184/09 (€16 million).Non-current assets11) Property, plant and equipmentProperty, plant and equipment of €14,053 million (€13,533 million at 31 December 2010) comprise:31.12.2010(€ million)Net opening value (*)InvestmentsAmortisation anddepreciationDisposalsOther changesNet closing valueGross closing valueProvision for amortisation,depreciation andimpairment losses (**)Land 135 1 1 137 137Buildings 392 8 (12) (3) 7 392 593 201Plant and equipment (*) 10,702 28 (461) (5) 531 10,795 15,338 4,543Industrial and commercial equipment 63 17 (16) 1 65 206 141Other assets 14 1 (6) 3 12 85 73Non-current assets under construction andpayments on account 1,672 1,062 (1) (601) 2,132 2,13212,978 1,117 (495) (9) (58) 13,533 18,491 4,958(*) The net opening value of the item “Plant and equipment” (€10,702 million) includes the reclassification (€294 million) of pseudo-working gas. For further information, see Note 8“Inventories”.(**) Including impairment losses of €7 million.15 The recognition of such assets follows Resolutions VIS 8/09, ARG/gas 184/09 and ARG/gas 218/10, whereby the Electricity and Gas Authority recognisedthe additional expenses borne by the company respectively in the 2005-2006 and 2006-2007 thermal years (€45 million overall), the 2007-2008thermal year (€34 million) and the period from 1 October 2008 – 31 December 2009 (€ 55 million). Pursuant to article 6 of Resolution ARG/gas184/09, the recognition of the additional costs is subject to equalisation with the users through tariff adjustment: (i) starting from 1 January 2010for the additional costs sustained in thermal years 2005-2006, 2006-2007 and 2007-2008; (ii) starting from 1 January <strong>2011</strong> for the additional costssustained by the company during the period 1 October 2008 - 31 December 2009.<strong>Snam</strong> <strong>Annual</strong> <strong>Report</strong> <strong>2011</strong>
160<strong>Snam</strong> <strong>Annual</strong> <strong>Report</strong> <strong>2011</strong> / Notes to the consolidated financial statements31.12.<strong>2011</strong>(€ million)Net opening valueInvestmentsAmortisation anddepreciationDisposalsOther changesNet closing valueGross closing valueProvision for amortisation,depreciation andimpairment losses (*)Land 137 2 11 150 150Buildings 392 3 (12) 17 400 598 198Plant and equipment 10,795 136 (452) (15) 1,022 11,486 16,497 5,011Industrial and commercial equipment 65 16 (17) (3) 5 66 218 152Other assets 12 1 (6) 12 19 81 62Non-current assets under construction andpayments on account 2,132 994 (1,194) 1,932 1,932(*) Including impairment losses of €7 million.13,533 1,152 (487) (18) (127) 14,053 19,476 5,423Property, plant and equipment (€14,053 million) relate to natural gas transportation infrastructure (€11,755 million), storage(€1,984 million), distribution (€225 million) and regasification (€89 million).Investments of €1,152 million 16 refer to the natural gas transportation (€850 million), storage (€286 million), and distribution(€13 million) business segments, as well as to LNG regasification (€3 million).The financial expenses capitalised during the year amounted to €37 million (€37 million in 2010). The interest rate used forthe capitalisation of financial expenses is between 2.1% and 3.3% (between 2.6% and 3.1% in 2010).Depreciation (€487 million) refers to economic and technical depreciation determined on the basis of the useful life of theassets or their remaining possible use by the company.The main annual depreciation rates adopted are included in the following ranges:<strong>Annual</strong> depreciation rate (%)Buildings- Buildings 2-2.5 or more, depending on residual lifePlant and equipment - Transportation- Pipelines 2 or more, depending on residual life- Plants 5 or more, depending on residual life- Gas reduction/regulation plants 5 or more, depending on residual lifePlant and equipment – Storage- Pipes 2-2.5- Treatment and compression stations 4 - 5 or more, depending on residual life- Storage wells 1.66Plant and equipment – Regasification- LNG plants 4 or more, depending on residual lifeOther plant and equipment 2.5-12.5Metering devices 5 or more, depending on residual lifeIndustrial and commercial equipment 4-35Other assets 10-2516 The investments for the period are broken down by business segment in the “Business segment operating performance” section of the Directors’ report.<strong>Snam</strong> <strong>Annual</strong> <strong>Report</strong> <strong>2011</strong>
<strong>Snam</strong> <strong>Annual</strong> <strong>Report</strong> <strong>2011</strong> / Notes to the consolidated financial statements161Disposals of €18 million primarily concern sections of pipelines and some components of compression stations (€15 millionoverall).Other changes (-€127 million) relate to: (i) the adjustment of the timing of expenditure relating to charges for site dismantlingand restoration in the natural gas storage segment (-€135 million) which involved an upward adjustment of 20 years(corresponding to the duration of any possible extensions) of the estimate of the amount of time required to discharge allobligations 17 ; (ii) grants for the period (-€13 million); (iii) the change in inventory of piping purchased for investment purposesand not yet used in plant construction (€21 million).Government grants for capital expenditure and grants from other parties reducing the net value of property, plant andequipment amount respectively to €75 million (€76 million at 31 December 2010) and €220 million (€211 million at 31December 2010). At 31 December <strong>2011</strong>, there are no uncollected government grants (€5 million at 31 December 2010).The value of plant and equipment includes site dismantling and restoration costs totalling €22 million, relating mainly tonatural gas storage sites (€18 million).Summarised below are changes occurring in provisions for depreciation and impairment losses over the year:Provision for amortisation, depreciation and impairment losses(€ million)31.12.2010IncreasesOther changes31.12.<strong>2011</strong>Buildings 201 12 (15) 198Plant and equipment 4,543 452 16 5,011Industrial and commercial equipment 141 17 (6) 152Other assets 73 6 (17) 624,958 487 (22) 5,423Contractual commitments for the purchase of property, plant and equipment, and for the provision of goods and servicesrelated to their construction, are disclosed in Note 28 “Guarantees, commitments and risks”.17 Electricity and Gas Authority Resolution ARG/gas 119/10 provides for a specific portion of revenue to be set aside for the remuneration of storage siterestoration costs, taking into account the maximum duration of the concession (40 years from the date the concession was granted, including possibleextensions), so as to enable full recovery of costs. Based on the provisions of IFRIC 1, “Changes in liabilities recognised for dismantling and restorationand similar liabilities”, the company has adjusted the estimated time required to extinguish obligations relating to charges for site dismantling andrestoration to bring it into line with tariff remuneration. The impact of this adjustment on net profit, net of the tax effect, is around €20 million.<strong>Snam</strong> <strong>Annual</strong> <strong>Report</strong> <strong>2011</strong>
162<strong>Snam</strong> <strong>Annual</strong> <strong>Report</strong> <strong>2011</strong> / Notes to the consolidated financial statementsProperty, plant and equipment by business segmentProperty, plant and equipment are broken down by business segment as follows:(€ million) 31.12.2010 31.12.<strong>2011</strong>Gross property, plant and equipmentBusiness segments- Transportation 15,400 16,225- Regasification 124 128- Storage 2,497 2,643- Distribution 470 480Total 18,491 19,476Provision for amortisation, depreciation and impairment losses- Transportation (4,072) (4,470)- Regasification (35) (39)- Storage (608) (659)- Distribution (243) (255)Total (4,958) (5,423)Net property, plant and equipment- Transportation 11,328 11,755- Regasification 89 89- Storage 1,889 1,984- Distribution 227 22513,533 14,05312) Compulsory inventoriesCompulsory inventories, amounting to €405 million (€405 million at 31 December 2010), are made up of minimum quantitiesof natural gas that the storage companies are obligated to hold pursuant to Presidential Decree No. 22 of 31 January 2001.The inventories correspond to approximately 5 billion standard cubic metres of natural gas, the overall measurement of whichis determined annually by the Ministry for Economic Development.<strong>Snam</strong> <strong>Annual</strong> <strong>Report</strong> <strong>2011</strong>
<strong>Snam</strong> <strong>Annual</strong> <strong>Report</strong> <strong>2011</strong> / Notes to the consolidated financial statements16313) Intangible assetsIntangible assets of €4,444 million (€4,262 million at 31 December 2010) comprise:31.12.2010(€ million)Net opening valueInvestmentsAmortisation anddepreciationImpairment lossesDisposalsOther changesNet closing valueGross closing valueProvision for amortisation,depreciation andimpairment losses (*)Intangible assets with a finite useful life- Service concession agreements 3,341 349 (128) (10) (13) (48) 3,491 6,099 2,608- Industrial patent rights and rights to use intellectualproperty 55 4 (38) 51 72 548 476- Concessions, licences, trademarks and similar rights 663 (3) 2 662 820 158- Non-current assets under construction and paymentson account 14 66 (52) 28 28- Other intangible assets 4 (4) 44 44Intangible assets with an indefinite useful life4,073 423 (173) (10) (13) (47) 4,253 7,539 3,286- Goodwill 9 9 9(*) Including impairment losses of €10 million.4,082 423 (173) (10) (13) (47) 4,262 7,548 3,28631.12.<strong>2011</strong>(€ million)Net opening valueInvestmentsDepreciation, amortisationand impairment lossesRecovery of valueDisposalsOther changesNet closing valueGross closing valueProvision for amortisation,depreciation andimpairment losses (*)Intangible assets with a finite useful life- Service concession agreements 3,491 362 (137) 9 (37) (70) 3,618 6,251 2,633- Industrial patent rights and rights to use intellectualproperty 72 9 (35) 41 87 596 509- Concessions, licences, trademarks and similar rights 662 (2) 26 686 847 161- Non-current assets under construction and paymentson account 28 60 (44) 44 44- Other intangible assets 2 (2) 46 46Intangible assets with an indefinite useful life4,253 433 (176) 9 (37) (47) 4,435 7,784 3,349- Goodwill 9 9 9(*) Including impairment losses of €1 million.4,262 433 (176) 9 (37) (47) 4,444 7,793 3,349<strong>Snam</strong> <strong>Annual</strong> <strong>Report</strong> <strong>2011</strong>
164<strong>Snam</strong> <strong>Annual</strong> <strong>Report</strong> <strong>2011</strong> / Notes to the consolidated financial statementsService concession agreements (€3,618 million) relate to natural gas distribution activities carried out under the concessionsystem as assigned by local public authorities. With regard to the duration of the concessions, Legislative Decree No. 164/00(the “Letta Decree”) established that all contracts must be put out to tender by the expiry of the “transitional period” (for<strong>Snam</strong>, by 31 December 2012) and that the new duration of the concessions may not exceed 12 years. In accordance with theprovisions of the relevant legislation, tenders for new natural gas distribution concessions will no longer be issued by eachmunicipality but exclusively by the multi-municipality minimum geographical areas (known as ATEMs) 18 .Industrial patent rights and rights to use intellectual property of €87 million (€72 million at 31 December 2010) mainlyconcern information systems and applications in support of operating activities.Concessions, licences, trademarks and similar rights (€686 million) refer mainly to concessions for the natural gas storagebusiness (€655 million).Intangible assets with an indefinite useful life consist only of the goodwill recognised following the acquisition by Italgas of100% of the shares of Siciliana Gas (€9 million).For the purposes of calculating recoverable value, goodwill has been allocated to the cash-generating unit consisting of naturalgas distribution activities. The recoverable amount of the cash-generating unit was estimated by equity/income type valuationswith reference to the value of the asset recognised for tariff purposes (RAB – Regulated Asset Base), as well as to additionalincome components deriving from the regulation, and is greater than the carrying amount of the cash-generating unit.Investments in intangible assets of €433 million (€423 million at 31 December 2010) refer mainly to: (i) the constructionand upgrading of natural gas distribution infrastructure (€362 million); and (ii) investment projects in progress (€48 million).Recoveries of value (€9 million) have been recognised against some assets in the natural gas distribution segment on whichimpairment losses were recognised in 2010, due to the reduced cost of preparing plants for normal use.Other changes (-€47 million) essentially consist of grants during the period (-€57 million).Government grants for capital expenditure and grants from other parties reducing the net value of intangible assets amountedrespectively to €373 million (€374 million at 31 December 2010) and €383 million (€355 million at 31 December 2010) andessentially concern the natural gas distribution segment. At 31 December <strong>2011</strong>, uncollected government grants amounted to€6 million (€3 million 31 December 2010).The main amortisation rates adopted on an annual basis are the following:<strong>Annual</strong> amortisation rate (%)Infrastructure used in service concession agreements- Gas distribution network 2- Gas diversion plants 2- Distribution metering equipment 5-7.5 or more, depending on residual lifeIntangible assets- Industrial patent rights and intellectual property rights 20-33- Other intangible assets 20, or according to the duration of the contractExisting contractual commitments for the purchase of intangible assets, and of services related to their development, aredisclosed in Note 28, “Guarantees, commitments and risks”.18 For further information refer to the “Business segment operating performance” section of the Directors’ report.<strong>Snam</strong> <strong>Annual</strong> <strong>Report</strong> <strong>2011</strong>
<strong>Snam</strong> <strong>Annual</strong> <strong>Report</strong> <strong>2011</strong> / Notes to the consolidated financial statements165Intangible assets by business segmentIntangible assets are broken down by business segment as follows:(€ million) 31.12.2010 31.12.<strong>2011</strong>Gross intangible assetsBusiness segments- Transportation 389 431- Regasification 1 2- Storage 778 788- Distribution 6,380 6,572Total 7,548 7,793Provision for amortisation, depreciation and impairment losses- Transportation (335) (355)- Regasification (1) (2)- Storage (113) (117)- Distribution (2,837) (2,875)Total (3,286) (3,349)Net intangible assets- Transportation 54 76- Regasification- Storage 665 671- Distribution 3,543 3,6974,262 4,444The market value of fixed assets, including compulsory inventories and intangible assets, is estimated at €22 billion 19 andwas defined in keeping with the estimate of the value recognised (RAB) for such assets for purposes of compensation by theElectricity and Gas Authority.14) Equity-accounted investmentsEquity-accounted investments of €319 million (€319 million at 31 December 2010) refer to equity investments in thedistribution business segment and are broken down as follows:31.12.2010(€ million)Opening valueCapital gains frommeasurement usingthe equity methodDecrease owing todividendsOther changesClosing valueInvestments in entities under joint control 249 44 (32) 5 266Investments in associates 51 3 (2) 52Investments in subsidiaries 1 1301 47 (34) 5 31919 Estimated value at 31 December <strong>2011</strong>.<strong>Snam</strong> <strong>Annual</strong> <strong>Report</strong> <strong>2011</strong>
166<strong>Snam</strong> <strong>Annual</strong> <strong>Report</strong> <strong>2011</strong> / Notes to the consolidated financial statements31.12.<strong>2011</strong>(€ million)Opening valueCapital gains frommeasurement usingthe equity methodSales andrepaymentsDecrease owing todividendsOther changesClosing valueInvestments in entities under joint control 266 45 (42) 269Investments in associates 52 (4) 48Investments in subsidiaries 1 1 2319 45 (4) (42) 1 319Capital gains from measurement using the equity method of €45 million mainly relate to Azienda Energia e Servizi TorinoS.p.A. (€24 million) and Toscana Energia S.p.A. (€15 million).Sales (€4 million) relate to the sale of 1,716,064 shares in Acqua Campania S.p.A. held by Italgas and equal to 34.67% of itsshare capital, for a consideration of €8 million 20 .The net value of equity-accounted investments concerns the following companies:31.12.2010 31.12.<strong>2011</strong>(€ million)NetvalueShareholder %ownershipNetvalueShareholder% ownershipJointly controlled entities:- Toscana Energia S.p.A. 151 48.13% 155 48.08%- Azienda Energia e Servizi Torino S.p.A. 109 49% 108 49%- Metano Borgomanero S.p.A. 2 50% 2 50%- Metano S. Angelo Lodigiano S.p.A. 1 50% 1 50%- Metano Casalpusterlengo S.p.A. 1 50% 1 50%- Metano Arcore S.p.A. 1 50% 1 50%- Umbria Distribuzione Gas S.p.A. 1 45% 1 45%Total for jointly controlled entities 266 269Associates:- ACAM Gas S.p.A. 48 49% 48 49%- Acqua Campania S.p.A. 4 35.20%Total for associates 52 48Subsidiaries:- Servizi Territori Aree e Penisole S.p.A. 1 70% 1 70%- <strong>Snam</strong> Trasporto S.p.A. 1 100%Total for subsidiaries 1 2319 319Investments in subsidiaries, jointly controlled entities and associates can be found in the annex “Significant shareholdings,associates and equity investments of <strong>Snam</strong> at 31 December <strong>2011</strong>”, which is an integral part of these notes.20 The transaction also involved the sale of the investments in Acqua Campania S.p.A. held by Eni S.p.A. and Saipem S.p.A.<strong>Snam</strong> <strong>Annual</strong> <strong>Report</strong> <strong>2011</strong>
<strong>Snam</strong> <strong>Annual</strong> <strong>Report</strong> <strong>2011</strong> / Notes to the consolidated financial statements167Other information on equity investmentsThe amounts from the most recent financial statements available for non-consolidated subsidiaries, jointly controlled entitiesand associates, proportionately to the percentage of ownership, are as follows:31.12.2010 31.12.<strong>2011</strong>(€ million)Non-consolidatedsubsidiariesJointly controlledentitiesAssociatesNon-consolidatedsubsidiariesJointly controlledentitiesAssociatesTotal assets 3 589 264 4 651 61Total liabilities 2 275 209 3 335 9Net revenue 123 29 140 9EBIT 64 6 81 4Net profit for the year 41 4 41 115) Other non-current assetsOther non-current assets of €81 million (€49 million at 31 December 2010) break down as follows:(€ million) 31.12.2010 31.12.<strong>2011</strong>Accrued income from regulated activities 17 66Derivatives:- Fair value of derivatives 15Other non-current assets:- Prepayments 8 6- Security deposits 6 6- Other assets 3 317 1549 81Accrued income from regulated activities of €66 million relates to: (i) the non-current portion of natural gas transportationrevenues invoiced below the restriction established by the Regulator (€56 million); and (ii) the non-current portion (€10million) of the assets recorded against the recognition by the Electricity and Gas Authority of additional expenses borne duringthe second regulatory period (1 October 2005 – 31 December 2009) for the purchase of fuel gas used in the transportationbusiness 21 .16) Non-current assets held for sale and directly related liabilitiesNon-current assets held for sale of €25 million (unchanged from 31 December 2010) concern property owned by Italgas, forwhich sales negotiations are under way with Eni following the commitments arising from the Italgas purchase agreement 22 .Liabilities directly related to assets held for sale of €9 million (€10 million at 31 December 2010) include environmentalprovisions for expenses involved in the property’s restoration.21 For further information, see Note 10, “Other current assets”.22 For information on commitments made by the parties, see Note 28 “Guarantees, commitments and risks - Commitments deriving from the agreementto purchase Italgas and Stogit from Eni”.<strong>Snam</strong> <strong>Annual</strong> <strong>Report</strong> <strong>2011</strong>
168<strong>Snam</strong> <strong>Annual</strong> <strong>Report</strong> <strong>2011</strong> / Notes to the consolidated financial statementsCurrent liabilities17) Short-term financial liabilitiesShort-term financial liabilities of €2,787 million (€1,844 million as at 31 December 2010) are denominated entirely in Eurosand relate to credit lines with Eni S.p.A..Short-term financial liabilities include: (i) floating-rate loans (€2,287 million); and (ii) floating-rate loans of €500 million,converted into fixed-rate loans through an interest rate swap derivative contract 23 for an equal notional amount. The weightedaverage interest rate on short-term financial debt was 1.5% (0.7% at 31 December 2010).The market value of short-term financial liabilities is the same as their book value.At 31 December <strong>2011</strong>, there were no breaches of loan agreements.18) Trade and other payablesTrade and other payables of €1,344 million (€1,322 million at 31 December 2010) comprise:(€ million) 31.12.2010 31.12.<strong>2011</strong>Trade payables 468 556Payables for investments 627 486Other payables 227 3021,322 1,344Trade payables of €556 million (€468 million at 31 December 2010) mainly refer to the natural gas transportation (€300million), distribution (€219 million) and storage (€33 million) business segments.Payables for investment activities of €486 million (€627 million at 31 December 2010) refer mainly to the natural gastransportation (€362 million), storage (€65 million) and distribution (€57 million) business segments. The decrease of €141million compared to 31 December 2010 is due to changes in payments, including in particular the payment to Eni (€89million) for part of the payables recognised in relation to commitments deriving from the contracts for the acquisition ofItalgas and Stogit 24 .23 For information on derivative contracts, see Note 21 “Other current liabilities”.24 For more information, see Note 28 “Guarantees, commitments and risks - Commitments deriving from the agreement to purchase Italgas and Stogitfrom Eni”.<strong>Snam</strong> <strong>Annual</strong> <strong>Report</strong> <strong>2011</strong>
<strong>Snam</strong> <strong>Annual</strong> <strong>Report</strong> <strong>2011</strong> / Notes to the consolidated financial statements169Other payables of €302 million (€227 million at 31 December 2010) break down as follows:(€ million) 31.12.2010 31.12.<strong>2011</strong>Group VAT payables 15 20IRES payables for National tax Consolidation Scheme 69 19Other payables:- Payables to the Cassa Conguaglio Settore Elettrico (Electricity Equalisation Fund) 25 141- Payables to employees 43 51- Payables to pension and social security institutions 27 23- Payables to the government 16 20- Payments on account and advances 15 5- Other 17 23143 263227 302Payables to the Cassa Conguaglio Settore Elettrico (Electricity Equalisation Fund) (€141 million) concern accessory tariffcomponents that mainly relate to: (i) the transportation business segment (special tariffs for gas sector customers experiencinghardship and measures and steps for energy savings and the development of renewable sources in the natural gas sector),pursuant to Electricity and Gas Authority Resolutions ARG/com 93/10 and ARG/gas 177/10 (€108 million); (ii) to the storagesegment (coverage of the equalisation imbalances account), pursuant to Resolution 50/06 (€21 million); (iii) the distributionsegment (energy savings, gas service quality, equalisation imbalances and disadvantaged customers), mainly pursuant toResolution ARG/gas 159/08 (€12 million).Payables to the government (€20 million) primarily involve payables to municipalities for concession fees for the distributionbusiness.The fair value measurement of trade and other payables has no material impact given the short period of time between whenthe payable arises and its due date.Note 36 “Related-party transactions” contains information about payables due to related parties.19) Current income tax liabilitiesCurrent income tax liabilities of €175 million (€11 million at 31 December 2010) saw an increase of €164 million comparedto 31 December 2010, due mainly to additional IRES payables of €169 million (Robin Hood Tax). The implementation of thistax, which applies from <strong>2011</strong> to the natural gas transportation and distribution segments, follows the tax measures broughtin by Decree Law No. 138 of 13 August <strong>2011</strong>, converted into Law No. 148 of 14 September <strong>2011</strong>. In particular, Article 7 ofsaid Decree amended Decree Law No. 112 of 25 June 2008 (converted into Law No. 133 of 6 August 2008) establishing anadditional IRES (the Robin Hood Tax) for companies operating in the fields of hydrocarbons exploration and development,oil refining, production and sale of petrol, oil, diesel, lubricants, liquefied natural gas and liquefied petroleum gas, and theproduction or sale of electricity, making provision, from the current financial year, for:- extending the scope of the Decree to include companies operating in the fields of transmission, dispatch and distributionof electricity and transportation and distribution of natural gas for financial years <strong>2011</strong>, 2012 and 2013, and increasing inthe rate of additional tax from 6.5% to 10.5%;- changes to the ceiling above which the additional tax applies, identified, with reference to the previous financial year, asrevenue of €10 million and taxable income of €1 million, to replace the previous threshold of €25 million.As a result of the measures in question, <strong>Snam</strong> companies operating in the natural gas transportation and distribution segmentsare subject to the additional IRES at a rate of 10.5% for financial years <strong>2011</strong>, 2012 and 2013 and 6.5% from 2014.<strong>Snam</strong> <strong>Annual</strong> <strong>Report</strong> <strong>2011</strong>
170<strong>Snam</strong> <strong>Annual</strong> <strong>Report</strong> <strong>2011</strong> / Notes to the consolidated financial statements20) Other current tax liabilitiesOther current tax liabilities of €16 million (€20 million at 31 December 2010) mainly relate to IRPEF (personal income tax)withholdings for employees (€11 million) and deferred VAT payables to be paid to public authorities (€3 million).21) Other current liabilitiesOther current liabilities of €211 million (€221 million at 31 December 2010) comprise:(€ million) 31.12.2010 31.12.<strong>2011</strong>Prepaid income from regulated activities 159 129Derivatives:- Fair value of derivatives 52 75- Accrued interest differentials on derivatives 6 358 78Other current liabilities:- Deferred and prepaid revenue and income 4 4221 211Prepaid income from regulated activities of €129 million relates to: (i) the natural gas storage business segment (€84million) and concerns payments for balancing and stock replenishment, which are to be returned to service users based onthe provisions of Resolution 50/06 of the Electricity and Gas Authority; and (ii) the transportation business segment (€45million) and concerns the short-term portion of revenues invoiced in excess of the restriction established by the Electricity andGas Authority, and penalties charged to users who exceeded the committed capacity, which is to be returned through tariffadjustments pursuant to Resolution 166/05.Information on the fair value of derivatives at 31 December <strong>2011</strong> is summarised below.(€ million) 31.12.2010 31.12.<strong>2011</strong>Interest rate agreements Assets Liabilities Assets LiabilitiesFair Value Interest Rate Swap 15 (83) (263)Less:- Non-current share (15) 31 188Current share (52) (75)The fair value of hedging derivatives and their classification as an asset/liability over 12 months (non-current) or an asset/liability within 12 months (current) have been determined using generally accepted financial measurement models and marketparameters at the end of the year. At 31 December <strong>2011</strong>, <strong>Snam</strong> had 19 cash flow hedge derivatives in place.<strong>Snam</strong> <strong>Annual</strong> <strong>Report</strong> <strong>2011</strong>
<strong>Snam</strong> <strong>Annual</strong> <strong>Report</strong> <strong>2011</strong> / Notes to the consolidated financial statements171The characteristics of these contracts, as well as their market value, are shown below:(€ million)Type of contractStart of contract(date)End of contract(date)Duration (years)Nominal value(€ million)Sale ratePurchase rateMarket value(€ million)31.12.2010 31.12.<strong>2011</strong> 31.12.2010 31.12.<strong>2011</strong>Interest rate swap 24.11.2005 24.11.2015 10 500 500 Euribor fixed rate (26) (44)Interest rate swap 26.03.2007 26.03.2012 5 500 500 Euribor fixed rate (16) (3)Interest rate swap 20.03.2008 20.03.<strong>2011</strong> 3 300 Euribor fixed rate (2)Interest rate swap 30.06.2009 28.01.2016 7 700 700 Euribor fixed rate (24) (52)Interest rate swap 30.09.2009 30.09.<strong>2011</strong> 2 500 Euribor fixed rate (3)Interest rate swap 19.10.2009 19.10.<strong>2011</strong> 2 300 Euribor fixed rate (3)Interest rate swap 02.12.2009 02.12.2013 4 350 350 Euribor fixed rate (5) (9)Interest rate swap 02.12.2009 02.12.2015 6 200 200 Euribor fixed rate (3) (11)Interest rate swap 30.07.2010 31.07.2017 7 500 500 Euribor fixed rate 6 (25)Interest rate swap 02.08.2010 03.08.2015 5 300 300 Euribor fixed rate 2 (10)Interest rate swap 15.09.2010 15.12.2012 2 185 185 Euribor fixed rate (…) (1)Interest rate swap 16.09.2010 16.09.2015 5 200 200 Euribor fixed rate 2 (7)Interest rate swap 20.09.2010 9.05.2012 2 200 200 Euribor fixed rate (…)Interest rate swap 27.09.2010 28.09.2012 2 300 300 Euribor fixed rate (1) (1)Interest rate swap 27.09.2010 28.09.2012 2 300 300 Euribor fixed rate (…) (1)Interest rate swap 30.09.2010 28.09.2012 2 300 300 Euribor fixed rate (1) (1)Interest rate swap 4.10.2010 4.10.2012 2 300 300 Euribor fixed rate (…) (1)Interest rate swap 4.10.2010 4.10.2012 2 300 300 Euribor fixed rate (…)Interest rate swap 4.11.2010 7.05.2013 3 300 300 Euribor fixed rate (…) (1)Interest rate swap 16.09.<strong>2011</strong> 16.09.2018 7 200 Euribor fixed rate (20)Interest rate swap 30.09.<strong>2011</strong> 28.09.2018 7 500 Euribor fixed rate (52)Interest rate swap 19.10.<strong>2011</strong> 19.10.2016 6 300 Euribor fixed rate (27)6,535 6,435 (74) (266)The fair-value valuation of interest-rate derivatives is calculated on the basis of standard market valuation algorithms andmarket quotes/contributions provided by leading information providers.For these contracts, the company agrees with the counterparty to exchange, on fixed dates, the difference between thefloating-rate and fixed-rate calculated using the reference nominal value.Three derivatives contracts were entered into during <strong>2011</strong>, for €200 million, €500 million and €300 million respectively, andused to convert floating-rate loans into fixed-rate loans.Changes in fair value posted as a decrease in shareholders’ equity in <strong>2011</strong>, net of the related tax effect 25 , amount to -€121million (+€3 million at 31 December 2010).25 Includes the effect (€20 million) deriving from the adjustment of prepaid IRES taxes following the implementation of the Robin Hood Tax.<strong>Snam</strong> <strong>Annual</strong> <strong>Report</strong> <strong>2011</strong>
172<strong>Snam</strong> <strong>Annual</strong> <strong>Report</strong> <strong>2011</strong> / Notes to the consolidated financial statementsThe table below shows the swaps in place by type, the weighted average interest rate and the maturity of the transactions.The variable average rates are based on rates at year end; they are subject to changes which may significantly affect futurefinancial flows.2010 <strong>2011</strong>Purchase fixed rate/Sell fixed rate - Nominal value (€ million) 6,535 6,435- Weighted average interest rate purchased (%) 2.40 2.54- Weighted average interest rate sold (%) 1.01 1.47- Weighted average maturity (years) 2.93 2.98A comparison between the average rates bought and sold is not indicative of the result of the derivative contracts put in place;this result is determined taking into account the underlying transaction.Non-current liabilities22) Long-term financial liabilities and short-term portions of long-term liabilitiesBased on the table used in the Directors’ report, net financial debt can be broken down as follows:31.12.2010 31.12.<strong>2011</strong>(€ million) CurrentNoncurrentTotal CurrentNoncurrentTotalFinancial liabilities 10,350 11,199Short-term financial liabilities 1,844 1,844 2,787 2,787Long-term financial liabilities 1,320 7,186 8,506 1,612 6,800 8,412Financial receivables and cash and cash equivalents (9) (2)Financial receivables not held for operations (1) (1)Cash and cash equivalents (8) (8) (2) (2)3,156 7,185 10,341 4,397 6,800 11,197Long-term financial liabilitiesLong-term financial liabilities, including the short-term portions, of €8,412 million (€8,506 million at 31 December 2010)comprise:31.12.2010 31.12.<strong>2011</strong>(€ million)Short-termportionLong-termportionTotalShort-termportionLong-termportionTotalParents 1,320 7,185 8,505 1,612 6,800 8,412Other financial backers 1 11,320 7,186 8,506 1,612 6,800 8,412<strong>Snam</strong> <strong>Annual</strong> <strong>Report</strong> <strong>2011</strong>
<strong>Snam</strong> <strong>Annual</strong> <strong>Report</strong> <strong>2011</strong> / Notes to the consolidated financial statements173The breakdown of financial liabilities with parents, including the short-term portions, (€8,412 million) is as follows:(€ million)Lender Currency AmountFixed rate (F)Floating rate(V)Type ofrepaymentDisbursementdateMaturitydateResidualduration(years/months)Long-term loansEni (a) € 500 F On maturity 24.11.2005 24.11.2015 3y 11mEni (Credit line) (a) € 1,500 F Revolving (b) 24.11.2005 17.11.2014 2y 11mEni (a) € 185 F On maturity 15.12.2005 15.12.2012 1yEni (a) € 500 F On maturity 26.03.2007 26.03.2012 3mEni (Credit line) (a) € 200 F Revolving (b) 09.05.2007 09.05.2012 4mEni € 200 F On maturity 11.06.2007 11.06.2012 5mEni € 300 F On maturity 20.06.2007 20.06.2012 6mEni € 200 F On maturity 18.07.2007 18.07.2012 7mEni € 350 F On maturity 20.12.2007 14.11.2017 5y 10mEni € 400 F On maturity 28.10.2008 14.11.2013 1y 10mEni (a) € 700 F On maturity 30.06.2009 28.01.2016 4y 1mEni (a) € 350 F On maturity 02.12.2009 02.12.2013 1y 11mEni (a) € 200 F On maturity 02.12.2009 02.12.2015 3y 11mEni (a) € 300 F On maturity 30.06.2009 28.01.2016 4y 1mEni (a) € 500 F On maturity 30.07.2010 31.07.2017 5y 7mEni (a) € 300 F On maturity 02.08.2010 03.08.2015 3y 7mEni (a) € 200 F On maturity 16.09.2010 16.09.2015 3y 9mEni € 400 F On maturity 21.03.<strong>2011</strong> 20.12.2013 2yEni € 300 F On maturity 12.07.<strong>2011</strong> 12.07.2017 5y 6mEni (a) € 200 F On maturity 16.09.<strong>2011</strong> 16.09.2018 6y 9mEni (a) € 300 F On maturity 19.10.<strong>2011</strong> 19.10.2017 5y 10mTotal fixed rate 8,085Eni (c) € 300 V Amortised (d) 30.12.2009 15.12.2029 18yTotal floating rate 300Total long-term loans 8,385Accrued expenses 278,412(a)(b)(c)(d)Floating-rate loans converted by interest rate swaps into fixed-rate loans.Revolving credit lines are those which provide for the reconstitution of the credit limit in line with repayments.Borrowed from the European Investment Bank (EIB).Loan to be repaid in equal instalments with a grace period.At 31 December <strong>2011</strong> the revolving credit lines were fully drawn (the same as at 31 December 2010). There were no breachesof loan agreements at the reporting date.<strong>Snam</strong> has entered into a €300 million loan agreement with Eni funded by the European Investment Bank (EIB), which is basedon Eni maintaining a minimum rating. This condition has been met.<strong>Snam</strong> <strong>Annual</strong> <strong>Report</strong> <strong>2011</strong>
174<strong>Snam</strong> <strong>Annual</strong> <strong>Report</strong> <strong>2011</strong> / Notes to the consolidated financial statementsLong-term financial liabilities, including the short-term portions, are indicated below with their respective maturities:(€ million) MaturityValue at 31December<strong>2011</strong>Maturity2012Long-term maturity2013 2014 2015 2016After2016Totallong-termParents 2012-2029 8,412 1,612 1,150 1,500 1,200 1,000 1,950 8,412Long-term financial liabilities, including the short-term portions, are broken down below with an indication of the relatedaverage rate for the period. All financial liabilities are denominated in Euros.(€ million)Value at31.12.2010AveragerateValue at31.12.<strong>2011</strong>AveragerateLong-term financial liabilities 8,506 3.2% 8,412 3.5%The breakdown of long-term financial liabilities by type of interest rate is as follows:31.12.2010 31.12.<strong>2011</strong>(€ million) Amount % Amount %At fixed rate 8,206 96 8,112 96At floating rate 300 4 300 48,506 100 8,412 100Decree Law No. 1 of 20 January 2012 was published on the Gazzetta Ufficiale of 24 January 2012, authorising “Urgentarrangements for competition, development of infrastructures and competitiveness”. Specifically, Article 15 “Arrangements onthe subject of ownership unbundling” established that the Prime-Ministerial Decree pursuant to Article 1, paragraph 905 of LawNo. 296 of 27 December 2006 relating to the implementation of ownership unbundling between Eni and <strong>Snam</strong>, will be issuedwithin six months of the above-mentioned Decree Law coming into force.In the case of a change of control at <strong>Snam</strong> by Eni S.p.A., existing agreements between the companies give Eni S.p.A. the rightto extinguish the credit lines granted early. At present, <strong>Snam</strong> believes that cash flows from operations and its current financialand capital structure can reasonably allow access to a wide range of financing from the capital market and banks. However,there are no guarantees that <strong>Snam</strong> would be capable of obtaining loans and financing from other sources under the sameconditions as current ones.Below are details on net financial debt showing related-party transactions:31.12.2010 31.12.<strong>2011</strong>(€ million) Current Non current Total Current Non current TotalA. Cash and cash equivalents 8 8 2 2B. Securities not held for operationsC. Cash (A+B) 8 8 2 2D. Financial receivables not held for operations 1 1E. Short-term financial liabilities to banksF. Long-term financial liabilities to banksG. BondsH. Short-term financial liabilities to related parties 1,844 1,844 2,787 2,787I. Long-term financial liabilities to related parties 1,320 7,185 8,505 1,612 6,800 8,412L. Other short-term financial liabilitiesM. Other long-term financial liabilities 1 1N. Gross financial debt (E+F+G+H+I+L+M) 3,164 7,186 10,350 4,399 6,800 11,199O. Net financial debt (N-C-D) 3,156 7,185 10,341 4,397 6,800 11,197<strong>Snam</strong> <strong>Annual</strong> <strong>Report</strong> <strong>2011</strong>
<strong>Snam</strong> <strong>Annual</strong> <strong>Report</strong> <strong>2011</strong> / Notes to the consolidated financial statements17523) Provisions for risks and chargesProvisions for risks and charges of €527 million (€629 million at 31 December 2010) are illustrated in the table below:(€ million)31.12.2010Opening balanceProvisionsAccretion discountUtilisationsagainstexpenseforexcessOther changes31.12.2010Provision for site dismantlement and restoration 416 15 (2) 1 430Provision for litigation 73 16 (1) (19) 69Provision for environmental risk and expense 59 8 (7) 60Other provisions 28 18 (3) (2) 29 70576 42 15 (13) (21) 30 629(€ million)31.12.<strong>2011</strong>Opening balanceChanges in estimatesProvisionsAccretion discountUtilisationsagainstexpenseforexcessOther changes31.12.<strong>2011</strong>Provision for site dismantlement and restoration 430 (135) 12 (1) 306Provision for litigation 69 34 (9) (17) 77Provision for environmental risk and expense 60 11 (8) 63Other provisions 70 1 (13) (2) 25 81629 (135) 46 12 (31) (19) 25 527The provision for site dismantlement and restoration (€306 million) was recognised primarily due to expenses which areexpected to be borne for the removal of natural gas storage facilities and for site restoration (€294 million). Changes inestimates (-€135 million) are due mainly to an adjustment of the timing of expenditure related to future storage siterestoration charges, which increased the estimated time required for the extinguishment of the relevant obligations by 20years (corresponding to the duration of any possible extensions). This calculation method is consistent with the remunerationof costs for tariff purposes by the Electricity and Gas Authority, pursuant to Resolution ARG/gas 119/10 26 .The provision for litigation (€77 million) included costs which the company has estimated it will incur for existing lawsuits.The provision for environmental expense (€63 million) mainly included costs for environmental soil reclamation, which isrequired under Law No. 471/1999 (as amended), primarily for the disposal of solid waste, related to the distribution business.Other provisions (€81 million) relate essentially to: (i) costs (€54 million) recorded to offset the item covering changes ininventories resulting from the difference between estimated quantities of Unaccounted-For Gas (UFG) which is to be recordedin 2012 and 2013, and the amounts to be paid in kind by users to cover the quantities of UFG for the same year; and (ii) costsfor termination benefits (€4 million) for the planned termination of staff based on union agreements.26 Further information on this resolution is provided in Note 11 “Property, plant and equipment”.<strong>Snam</strong> <strong>Annual</strong> <strong>Report</strong> <strong>2011</strong>
176<strong>Snam</strong> <strong>Annual</strong> <strong>Report</strong> <strong>2011</strong> / Notes to the consolidated financial statements24) Provisions for employee benefitsProvisions for employee benefits of €107 million (€105 million at 31 December 2010) can be broken down as follows:(€ million) 31.12.2010 31.12.<strong>2011</strong>Employee severance pay (TFR) 81 82Supplemental healthcare provision for company executives of Eni (FISDE) 6 5Other employee benefit provisions 18 20105 107The provision for employee severance pay of €82 million is governed by Article 2120 of the Italian Civil Code and representsthe estimated liability determined on the basis of actuarial procedures for the amount to be paid to employees at the time theemployment is terminated. The principal amount of the benefit is equal to the sum of portions of the allocation calculated oncompensation items paid during the employment and revalued until the time such relationship is terminated. In accordance withchanges to the law introduced from 1 January 2007, severance pay to be accrued is earmarked for pension funds or the fundset up at the Istituto Nazionale Previdenza Sociale (INPS) [National Social Security Institute] or, for businesses with less than50 employees, may be kept within the business. This means that a significant part of severance pay to be accrued is classifiedas a defined-contribution plan since the company’s only obligation is to pay the contributions to the pension fund or to INPS.Liabilities related to severance pay pre-dating 1 January 2007 remains a defined-benefit plan to be valued using actuarial methods.The supplemental healthcare provision for company executives of Eni (FISDE) of €5 million includes the estimate of costsrelated to contributions to be paid to the supplemental healthcare provision benefiting current and retired executives. Theamount of the liability and the cost of care related to the supplemental healthcare provision for company executives of Eni aredetermined with reference to the contribution that the company pays to retired executives.Other employee benefit provisions of €20 million mainly concern long-term benefits connected with deferred cash incentiveplans, long-term cash incentive plans (€11 million in total) and seniority plans (€9 million).Deferred cash incentive plans involve the allocation of a basic incentive that will be paid out after three years in an amountdepending on the company’s performance.The long-term incentive plans replaced the preceding stock option allocations involve the payment, three years after beingassigned, of a variable cash bonus tied to a measure of company performance.Seniority bonuses are benefits paid upon reaching a minimum service period at the company, and are paid in kind.Employee benefit provisions, which are determined by applying actuarial methods, can be broken down as follows 27 :31.12.2010 31.12.<strong>2011</strong>(€ million) TFR FISDE Other Total TFR FISDE Other TotalPresent value of liabilities at the start of the year 85 6 19 110 85 6 18 109Current cost 4 4 5 5Interest cost 4 1 5 4 1 5Actuarial gain/(loss) 2 2 (3) 1 (2)Benefits paid (6) (6) (12) (5) (5) (10)Other changes 1 1Present value of liabilities at the end of the year 85 6 18 109 82 6 20 108Unrecorded actuarial gain/(loss) (4) (4) (1) (1)Cost related to unrecorded past work performedNet liabilities in provisions for employee benefits 81 6 18 105 82 5 20 10727 The table also provides a reconciliation of liabilities recorded for employee benefit provisions.<strong>Snam</strong> <strong>Annual</strong> <strong>Report</strong> <strong>2011</strong>
<strong>Snam</strong> <strong>Annual</strong> <strong>Report</strong> <strong>2011</strong> / Notes to the consolidated financial statements177Costs related to employee benefit liabilities, which are recorded in the income statement (€10 million), are broken down asfollows:2010 <strong>2011</strong>(€ million) TFR FISDE Other Total TFR FISDE Other TotalCurrent cost 4 4 5 5Interest cost 4 1 5 4 1 54 5 9 4 6 10The main actuarial assumptions used to determine liabilities at the end of the year and to calculate the cost for the followingyear are indicated below:% TFR FISDE Other2010Discount rates 4.75 4.75 2 - 4.75Inflation rate 2 2 2<strong>2011</strong>Discount rates 4.75 4.75 1.80-4.75Inflation rate 2 2 2Demographic tables prepared by the General State Accounting Department (RG48) were used for the actuarial assumptions.With respect to FISDE, the impact of a 1% change in the actuarial assumptions for costs related to medical care is notsignificant.The amount of contributions expected to be paid to the benefit plans established last year total €7 million.25) Deferred tax liabilitiesDeferred tax liabilities of €901 million (€853 million at 31 December 2010) are stated net of offsettable prepaid tax assets of€551 million (€463 million at 31 December 2010). There are no prepaid tax assets which cannot be offset.(€ million) 31.12.2010 Provisions Utilisations Other changes 31.12.<strong>2011</strong>Deferred tax liabilities 1,316 8 (87) 215 1,452Prepaid tax assets (463) (52) 63 (99) (551)853 (44) (24) 116 901Other changes (€116 million) relate essentially to: (i) the adjustment of deferred tax liabilities and prepaid tax assets at 31December 2010 to the new IRES rates following the implementation of the additional tax of 10.5% for <strong>2011</strong>, 2012 and 2013,and of 6.5% from 2014, applying to the natural gas transportation and distribution business segments 28 . This adjustmentresulted in greater deferred tax liabilities, amounting to €188 million; and (ii) prepaid taxes allocated to the change in the fairvalue of the hedging derivatives (€73 million) 29 .28 The adjustment results from the new tax measures introduced by Decree Law No. 138 of 13 August <strong>2011</strong> containing “Further urgent measures forfinancial stabilisation and development”, converted into Law No. 148 of 14 September <strong>2011</strong>. For further information see Note 20 “Current tax liabilities”.29 Includes the effect (€20 million) deriving from the adjustment of prepaid IRES taxes following the implementation of the Robin Hood Tax.<strong>Snam</strong> <strong>Annual</strong> <strong>Report</strong> <strong>2011</strong>
178<strong>Snam</strong> <strong>Annual</strong> <strong>Report</strong> <strong>2011</strong> / Notes to the consolidated financial statementsDeferred tax liabilities of €901 million are broken down as follows by type of tax:31.12.2010 31.12.<strong>2011</strong>(€ million) IRES IRAP Total IRES IRAP TotalDeferred tax liabilities 1,201 115 1,316 1,361 91 1,452Prepaid tax assets (415) (48) (463) (508) (43) (551)Net deferred tax liabilities 786 67 853 853 48 901Deferred and prepaid taxes are broken down below based on the nature of the most significant timing differences that resultedin the net deferred tax liabilities:(€ million)31.12.2010ProvisionsUtilisationsOther changes31.12.<strong>2011</strong>Deferred tax liabilities- Excess and advance amortisation and depreciation 933 (69) 197 1,061- Premium paid in Eni takeover of Italgas 231 (10) 49 270- Capitalisation of financial expenses 14 (1) 4 17- Capital gains subject to deferred taxation 4 5 (3) 2 8- Site dismantlement and restoration 41 (36) 5- Impairment losses on receivables in excess of tax deductibility 4 1 5- Financial leasing 2 2- Derivatives 4 (4)- Other 83 1 (2) 2 841,316 6 (85) 215 1,452Prepaid tax assets- Non-repayable and contractual grants (131) (1) 2 (27) (157)- Provision for risks and charges and other non-deductible provisions (101) (28) 40 (20) (109)- Site dismantlement and restoration (119) (5) 34 (90)- Derivatives (22) (69) (91)- Non-deductible amortisation and depreciation (44) (17) 5 (11) (67)- Employee benefits (6) (1) (1) (8)- Revenue adjustments (13) 1 8 (3) (7)- Other (27) (1) 8 (2) (22)(463) (52) 63 (99) (551)Net deferred tax liabilities 853 (46) (22) 116 901Prepaid tax assets and deferred tax liabilities are considered to be long term.Note 33 “Income taxes” provides information about taxes for the year.<strong>Snam</strong> <strong>Annual</strong> <strong>Report</strong> <strong>2011</strong>
<strong>Snam</strong> <strong>Annual</strong> <strong>Report</strong> <strong>2011</strong> / Notes to the consolidated financial statements17926) Other non-current liabilitiesOther non-current liabilities of €869 million (€331 million at 31 December 2010) comprise:(€ million) 31.12.2010 31.12.<strong>2011</strong>Prepaid income from regulated activities 273 306Derivatives:- Fair value of derivatives 31 18831 188Other non-current liabilities:- Deferred and prepaid revenue and income 23 317- Prepaid contributions for connecting to the transportation network 3 3- Other liabilities 1 5527 375331 869Prepaid income from regulated activities (€306 million) relates to: (i) the non-current portion of transportation revenuesinvoiced in excess of the restriction established by the Regulator and penalties charged to service users that exceeded thecommitted capacity (€173 million); this amount is to be adjusted based on the provisions of Resolution 166/05 of theElectricity and Gas Authority; and (ii) the non-current portion of payments for balancing and stock replenishment invoicedin <strong>2011</strong> (€133 million) to be returned to service users based on the provisions of Resolution 50/06 of the Electricity and GasAuthority.Deferred and prepaid revenue and income (€317 million) refer to: (i) fees for the use of strategic gas withdrawn and notreplenished under the terms of the Storage Code (€296 million); and (ii) the non-current portion of the prepaid fee for theconcession to use fibre-optic cables given to a telecommunications operator (€21 million).Other liabilities (€55 million) refer mainly to the non-current portion of the adjustment, to be repaid in kind to users of thenatural gas transportation service, of the quantity of fuel gas used in <strong>2011</strong> to operate the service with the quantities allocatedby users during the same year, pursuant to Resolution ARG/gas 184/09.For information about derivatives, see Note 21 “Other current liabilities”.<strong>Snam</strong> <strong>Annual</strong> <strong>Report</strong> <strong>2011</strong>
180<strong>Snam</strong> <strong>Annual</strong> <strong>Report</strong> <strong>2011</strong> / Notes to the consolidated financial statements27) Shareholders’ equityShareholders’ equity of €5,792 million at 31 December <strong>2011</strong> breaks down as follows:(€ million) 31.12.2010 31.12.<strong>2011</strong>Equity attributable to <strong>Snam</strong>Share capital 3,570 3,571Legal reserve 418 463Share premium reserve 1,981 1,988Consolidation reserve (1,713) (1,701)Cash flow hedge reserve (49) (170)Other reserves 791 783Retained earnings 904 1,188Net profit 1,106 790Less:- Treasury shares (789) (783)- Interim dividend (304) (338)5,915 5,791Capital and reserves attributable to minority interestsNapoletana Gas 1 15,916 5,792Share capitalAt 31 December <strong>2011</strong>, the fully subscribed and paid-up share capital of <strong>Snam</strong> Rete Gas S.p.A. consists of 3,571,187,994ordinary shares with a nominal value of €1 (3,570,832,994 shares at 31 December 2010). The increase of €355,000 over31 December 2010 was due to the issue of 355,000 shares with a nominal value of €1. These shares were subscribed byexecutives entitled to participate in the 2003 and 2004 stock option plans.Legal reserveThe legal reserve at 31 December <strong>2011</strong> totalled €463 million (€418 million at 31 December 2010), showing an increase of€45 million resulting from the allocation of 5% of the 2010 profit of parent company <strong>Snam</strong> Rete Gas S.p.A., in accordancewith Article 2430 of the Italian Civil Code.Share premium reserveThe share premium reserve at 31 December <strong>2011</strong> totalled €1,988 million (€1,981 at 31 December 2010). The increase of €7million is due to the exercise of stock options by eligible executives.Consolidation reserveThe negative consolidation reserve (€1,701 million compared with €1,713 million at 31 December 2010) includes the valuederived from the difference between the acquisition cost of the Italgas and Stogit holdings (€4,628 million, including theadditional transaction expenses and price adjustment following the agreements reached at transaction closing) and therelative shareholders’ equity attributable to the group on the transaction completion date (€2,004 million and €923 million,respectively, for Italgas and Stogit). The €12 million decrease over 31 December 2010 was due to the recognition of theimpact of the price adjustment reflecting agreements signed when the purchase contracts were signed for Italgas and Stogit 30 .30 For more information, see Note 28 “Guarantees, commitments and risks - Commitments deriving from the agreement to purchase Italgas and Stogitfrom Eni”.<strong>Snam</strong> <strong>Annual</strong> <strong>Report</strong> <strong>2011</strong>
<strong>Snam</strong> <strong>Annual</strong> <strong>Report</strong> <strong>2011</strong> / Notes to the consolidated financial statements181Cash flow hedge reserve(€ million) Gross reserve Tax effect (*) Net reserveReserve at 31.12.2010 (68) 19 (49)Transfer to income statement 69 (26) 43Changes in <strong>2011</strong> (263) 99 (164)Reserve at 31.12.<strong>2011</strong> (262) 92 (170)(*) Includes the effect (€20 million) deriving from the adjustment of prepaid IRES taxes following the implementation of the Robin Hood Tax.The cash flow hedge reserve (-€170 million) includes the valuation, net of the related tax effect, of the fair value of cash flowhedge derivatives relating to interest rate swaps used by the company to convert floating-rate loans into fixed-rate loans.Other reservesOther reserves of €783 million (€791 million at 31 December 2010) relate to the reserve created against the cost of192,553,051 treasury shares.Retained earningsRetained earnings totalled €1,188 million (€904 million at 31 December 2010) and rose by €284 million, due essentially to2010 retained earnings (€284 million).Treasury sharesThe treasury shares held at 31 December <strong>2011</strong> are broken down in the table below:YearNumberof sharesAveragecost (€)Total cost(€ million)Share capital(%) (**)Purchases2005 800,000 4.399 3 0.042006 121,731,297 3.738 455 6.222007 73,006,653 4.607 336 3.73Less treasury shares granted/sold:- assigned free of charge pursuant to 2005 stock grant plans (39,100)- sold pursuant the stock option plans 2005 (69,000)- sold pursuant the stock option plans 2006 (1,775,249)- sold pursuant the stock option plans 2007 (1,101,550)Treasury shares held at 31 December <strong>2011</strong> (*) 192,553,051(*) For a book value of €783 million.(**) Share capital in existence at the last repurchase date of the year.195,537,950 4.061 794At 31 December <strong>2011</strong> the total number of treasury shares held by the company was 192,553,051, equal to 5.39% of theshare capital.At 31 December <strong>2011</strong>, the company had commitments to grant 3,003,351 shares under stock option plans. At the same date,the market value of the shares totalled approximately €653 million 31 .31 Calculated by multiplying the number of treasury shares by the official share price at 31 December <strong>2011</strong> (€3.39 per share).<strong>Snam</strong> <strong>Annual</strong> <strong>Report</strong> <strong>2011</strong>
182<strong>Snam</strong> <strong>Annual</strong> <strong>Report</strong> <strong>2011</strong> / Notes to the consolidated financial statementsInterim dividendsInterim dividends of €338 million refer to the interim dividend for <strong>2011</strong> of €0.10 per share, as decided by the Board ofDirectors in the meeting of 27 July <strong>2011</strong>, pursuant to Article 2433-bis, paragraph 5, of the Italian Civil Code. The advancedividend was payable from 27 October <strong>2011</strong>, with an ex-dividend date of 24 October <strong>2011</strong>.DividendsOn 27 April <strong>2011</strong> the Ordinary Shareholders’ Meeting of <strong>Snam</strong> Rete Gas S.p.A. authorised the distribution of an ordinarydividend of €0.23 per share. The dividend of €0.14 per share to balance the 2010 interim dividend of €0.09 (€473 million)was made payable from 27 May <strong>2011</strong>, with an ex-dividend date of 24 May <strong>2011</strong>.At its meeting of 12 March 2012, the Board of Directors proposed to the Shareholders’ Meeting convened for 26 and 27 April2012 at first and second call, respectively, to distribute an ordinary dividend of €0.24 per share. The dividend of €0.14 pershare to balance the <strong>2011</strong> interim dividend of €0.10 per share, will be payable from 24 May 2012, with an ex-dividend dateof 21 May 2012.28) Guarantees, commitments and risksGuarantees, commitments and risks of €4,181 million (€3,676 million at 31 December 2010) comprise:31.12.2010 31.12.<strong>2011</strong>(€ million)OtherpersonalguaranteesCommitmentsand risksTotalOtherpersonalguaranteesCommitmentsand risksTotalOther personal guarantees givenon its own behalf:- Parents 51 51 65 65- Other 11 11 8 862 62 73 73CommitmentsCommitments for the purchase of goods and services 1,732 1,732 1,723 1,723Commitments for the purchase of equity investments 75 75Other 1 1 4 41,733 1,733 1,802 1,802Risks:- Third-party assets on deposit 1,877 1,877 2,300 2,300- Litigation 4 4 6 61,881 1,881 2,306 2,30662 3,614 3,676 73 4,108 4,181GuaranteesOther personal guarantees given on own behalf of €73 million (€62 million at 31 December 2010) essentially relate to: (i) holdharmlessletters issued to Eni S.p.A. (€41 million) and third parties (€7 million) for sureties issued in favour of <strong>Snam</strong>, mainlyperformance bonds and to participate in tenders; (ii) hold-harmless letters issued to Eni S.p.A. (€19 million) for guaranteesissued in favour of <strong>Snam</strong> for equity investments and concessions relating to the natural gas distribution service; (iii) guaranteesissued to the Municipality of San Donato Milanese (€4 million) to cover the commitments deriving from a project to constructa property complex in San Donato Milanese for office use.<strong>Snam</strong> <strong>Annual</strong> <strong>Report</strong> <strong>2011</strong>
<strong>Snam</strong> <strong>Annual</strong> <strong>Report</strong> <strong>2011</strong> / Notes to the consolidated financial statements183CommitmentsAt 31 December <strong>2011</strong>, commitments with suppliers to purchase property, plant and equipment and provide services relatingto investments in property, plant and equipment and intangible assets under construction totalled €1,723 million (€1,732million at 31 December 2010).The commitments to purchase equities (€75 million) relate to the commitment deriving from a joint agreement between<strong>Snam</strong> and Fluxys G to purchase the following investments from Eni: (i) 16.41% of Interconnector (UK) Ltd, the owner andoperator of the underwater pipeline between the United Kingdom (Bacton) and Belgium (Zeebrugge), enabling a strategicbi-directional connection between the United Kingdom and Europe’s biggest gas trading markets; (ii) 51% of InterconnectorZeebrugge Terminal SCRL, which includes the terminal and the compression plants that connect the Interconnector pipelinewith the Belgian gas transportation system; (iii) 10% of Huberator S.A., a subsidiary of Fluxys G that operates the gas tradinghub in Zeebrugge. The transaction involves the two purchasers acquiring the aforesaid investments in equal shares, for a totalconsideration of €150 million.The transaction is expected to be completed by the second half of 2012, subject to the authorisation of the competentauthorities.Other commitments (€4 million) relate to commitments made to the Municipality of San Donato Milanese and Eni ServiziS.p.A. regarding the project to build a property complex in San Donato Milanese for office use.RisksRisks related to third-party assets on deposit, equal to €2,300 million (€1,877 million at 31 December 2010) relate to about6.7 billion cubic metres of natural gas deposited in the storage plants by customers of the service. This amount was determinedby applying the estimated unit repurchase cost of approximately €0.34 per standard cubic metre to the quantities of gasdeposited.Risks related to compensation and litigation (€6 million) relate to possible (but not probable) claims for compensation arisingfrom ongoing litigation, with a low probability that the pertinent economic risk will arise.Financial risk managementIntroductionThe main financial risks identified, monitored and, to the extent described below, managed by <strong>Snam</strong> are as follows:market risk deriving from exposure to fluctuations in interest rates and the price of natural gas;credit risk deriving from the possibility of counterparty default;liquidity risk deriving from a possible lack of financial resources required to meet short-term commitments.This section describes the policies and principles used by <strong>Snam</strong> to manage and control risks deriving from financial instruments(interest rate risk, credit risk and liquidity risk). The nature and scale of these risks are also described, in accordance withdisclosure rules pursuant to IFRS 7.Information on other risks affecting the company’s business (natural gas price risk, operational risk and segment-specific risks)can be found in the “Elements of risk and uncertainty” section of the Directors’ <strong>Report</strong>.MARKET RISKInterest rate riskFluctuations in interest rates affect the market value of a company’s financial assets and liabilities as well as its net financialexpense.<strong>Snam</strong> <strong>Annual</strong> <strong>Report</strong> <strong>2011</strong>
184<strong>Snam</strong> <strong>Annual</strong> <strong>Report</strong> <strong>2011</strong> / Notes to the consolidated financial statementsThe interest rates of some of the <strong>Snam</strong>’s loans are indexed to benchmark rates, namely the Euro Interbank Offered Rate(Euribor). Interest rate risk is hedged by limiting the risk associated with interest rate volatility, in accordance with the financialstructure objectives established in the company’s business plans. To this end, <strong>Snam</strong> uses derivative financial instruments,namely interest rate swaps (IRSs) to control the balance between fixed- and floating-rate debt. Hedging operations arequalified pursuant to IAS 39 “Cash Flow Hedge”. <strong>Snam</strong> holds no derivative contracts for trading purposes and no interest ratederivatives for speculative purposes 32 .The table below shows the breakdown of gross financial debt by fixed- and floating-rate debt, including the effects of hedging.31.12.2010 31.12.<strong>2011</strong>(€ million) Amount % Amount %At fixed rate 8,206 79 8,612 77At floating rate 2,144 21 2,587 2310,350 100 11,199 100Exposure to interest rate risk at 31 December <strong>2011</strong> was around 23% of the group’s total exposure (21% at 31 December2010). The hedging activities conducted during the year enabled <strong>Snam</strong> to achieve the financial structure objectives establishedin the company’s business plans.The effects on shareholders’ equity and profit at 31 December <strong>2011</strong>, compared with the situation a year earlier, are shownbelow, assuming a hypothetical change of +/-10% in interest rates applied over the course of <strong>2011</strong>.Profit for the period2010Shareholders’ equity31.12.2010(€ million) +10% -10% +10% -10%Floating-rate loansEffect of interest rate change (1) 1Floating-rate loans converted by IRSs into fixed-rate loansEffect of interest rate change on the fair value of hedging derivativespursuant to IAS 39 - effective share 38 (42)Effect on pre-tax profit (1) 1 38 (42)Tax effect (10) 12(1) 1 28 (30)Profit for the period<strong>2011</strong>Shareholders’ equity31.12.<strong>2011</strong>(€ million) +10% -10% +10% -10%Floating-rate loansEffect of interest rate change (4) 4Floating-rate loans converted by IRSs into fixed-rate loansEffect of interest rate change on the fair value of hedging derivativespursuant to IAS 39 - effective share 20 (27)Effect on pre-tax profit (4) 4 20 (27)Tax effect 2 (2) (7) 10(2) 2 13 (17)32 More information on the derivative contracts can be found in Note 21 “Other current liabilities”.<strong>Snam</strong> <strong>Annual</strong> <strong>Report</strong> <strong>2011</strong>
<strong>Snam</strong> <strong>Annual</strong> <strong>Report</strong> <strong>2011</strong> / Notes to the consolidated financial statements185<strong>Snam</strong> is funded entirely through its ultimate parent, Eni S.p.A.. Should Eni S.p.A. sell its controlling stake in <strong>Snam</strong>, there is noguarantee that the latter would be able to obtain loans and financing from other sources under the same conditions as thosecurrently in force.CREDIT RISKCredit risk is the company’s exposure to potential losses arising from counterparties failing to fulfil their obligations. Defaultor delayed payment may have a negative impact on the financial balance and results of <strong>Snam</strong>.<strong>Snam</strong>’s exposure to credit risk is associated with the natural gas transportation, regasification, distribution and storage servicesprovided by its companies. More specifically, <strong>Snam</strong> provides business services to a small number of operators in the gas sector,the largest of which by revenue is Eni S.p.A.. The rules for client access to the services offered are established by the Electricityand Gas Authority and set out in the Network Codes. For each type of service, these documents explain the rules regulatingthe rights and obligations of the parties involved in providing said services and have contractual conditions which minimisethe risk of non-compliance by the clients. In particular, the Codes provide for guarantees to partly cover obligations where theclient does not possess a credit rating issued by one of the leading international agencies.<strong>Snam</strong>’s maximum exposure to credit risk at 31 December <strong>2011</strong> is the book value of the financial assets on its balance sheet.An analysis of overdue and non-impaired receivables is shown below:31.12.2010 31.12.<strong>2011</strong>(€ million)TradereceivablesOtherreceivablesTotalTradereceivablesOtherreceivablesTotalNon-overdue and non-impaired receivables 685 128 813 784 136 920Impaired receivables net of provisions 23 16 39 63 10 73Overdue and non-impaired receivables:- 0-3 months overdue 31 3 34 135 2 137- 3-6 months overdue 11 2 13 195 1 196- 6-12 months overdue 13 1 14 180 1 181- more than 12 months overdue 14 15 29 44 5 49Total overdue and non-impaired receivables 69 21 90 554 9 563777 165 942 1,401 155 1,556Overdue and non-impaired receivables totalled €563 million (€90 million at 31 December 2010). The receivables include€461 million relating to the use of strategic gas withdrawn and not replenished by users under the terms of the Storage Code.When these receivables are collected, they will be paid to the Electricity Equalisation Fund in accordance with the regulationsin force. There is no credit risk in this instance because current regulations stipulate a neutral position for the storage companyin terms of the effects arising from the use of strategic gas 33 .There are no significant credit risks. It should be noted that, at 31 December <strong>2011</strong>, around 47% of trade receivables (76% at 31December 2010) were with extremely reliable clients, including the ultimate parent Eni S.p.A., which represents 29% of totaltrade receivables (48% at 31 December 2010).33 More information can be found in Annex A, Article 10, paragraph 5 of Electricity and Gas Authority Resolution ARG/gas 119/10.<strong>Snam</strong> <strong>Annual</strong> <strong>Report</strong> <strong>2011</strong>
186<strong>Snam</strong> <strong>Annual</strong> <strong>Report</strong> <strong>2011</strong> / Notes to the consolidated financial statementsLIQUIDITY RISKLiquidity risk is the risk that new financial resources may not be available (funding liquidity risk) or the company may be unableto convert assets into cash on the market (asset liquidity risk), meaning that it cannot meet its payment commitments. Thismay affect profit or loss should the company be obliged to incur extra costs to meet its commitments or, in extreme cases,lead to insolvency and threaten the company’s future as a going concern. <strong>Snam</strong>’s objective is to have a financial structure (interms of leverage ratio and ratio of medium-to-long-term debt to total debt), which ensures an adequate level of liquidity forthe group, minimising the related opportunity cost and maintaining a balance in terms of the duration and composition of itsdebt in line with business objectives.<strong>Snam</strong> is currently financed entirely by its ultimate parent, Eni S.p.A..Decree Law No. 1 of 20 January 2012 was published on the Gazzetta Ufficiale of 24 January 2012, authorising “Urgentarrangements for competition, development of infrastructures and competitiveness”. Specifically, Article 15 “Arrangements onthe subject of ownership unbundling” established that the Prime-Ministerial Decree pursuant to Article 1, paragraph 905 of LawNo. 296 of 27 December 2006 relating to the implementation of ownership unbundling between Eni and <strong>Snam</strong>, will be issuedwithin six months of the above-mentioned Decree Law coming into force.In the case of a change of control at <strong>Snam</strong> by Eni S.p.A., existing agreements between the companies give Eni S.p.A. the rightto extinguish the credit lines granted early. At present, <strong>Snam</strong> believes that cash flows from operations and its current financialand capital structure can reasonably allow access to a wide range of financing from the capital market and banks. However,there are no guarantees that <strong>Snam</strong> would be capable of obtaining loans and financing from other sources under the sameconditions as current ones.Future payments for financial liabilities, trade and other payablesThe table below shows the amounts of payments contractually owed for financial payables, including interest payments andthe timing of expenditure related to trade and other payables.Year of maturity(€ million) 2012 2013 2014 2015 2016 Over 2016 TotalFinancial liabilitiesLong-term financial liabilities 1,585 1,150 1,510 1,220 1,020 1,900 8,385Short-term financial liabilities 2,787 2,787Derivative liabilities/(assets) 40 85 54 36 10 5 230Interest on financial debt 245 160 155 141 91 152 9444,657 1,395 1,719 1,397 1,121 2,057 12,346Trade and other payablesTrade payables 556 556Other payables and advances 749 7491,305 1,3055,962 1,395 1,719 1,397 1,121 2,057 13,651Other information on financial instrumentsIn relation to the categories mentioned in IAS 39, <strong>Snam</strong> has no financial assets held to maturity, available for sale or held fortrading. With the exception of hedging derivatives, therefore, financial assets and liabilities all come under the category offinancial instruments measured at amortised cost.<strong>Snam</strong> <strong>Annual</strong> <strong>Report</strong> <strong>2011</strong>
<strong>Snam</strong> <strong>Annual</strong> <strong>Report</strong> <strong>2011</strong> / Notes to the consolidated financial statements187The book value of financial instruments and the relative effects on results and the balance sheet can be seen below:Income (expense)Book value Income statement Shareholders’ equity (*)(€ million) 2010 <strong>2011</strong> 2010 <strong>2011</strong> 2010 <strong>2011</strong>Financial instruments measured at fair valueNet liabilities for hedging derivatives (**) (68) (263) (102) (69) 3 (121)Receivables, payables and other assets/liabilities measuredat amortised costTrade and other receivables (***) 929 1,486 (6) (4)Financial receivables 2 2Trade and other payables (**) (1,238) (1,305)Financial payables (**) (10,350) (11,199) (151) (225)(*) Net of tax effect.(**) The effects on the income statement are recorded under “Financial income/(expense)”.(***) The effects on the income statement are recorded under “Purchases, services and other costs” and “Financial income/(expense)”.Below is a comparison between the book value of long-term financial liabilities and their respective fair value. This informationis not reported for other financial assets/liabilities because the book value is almost equivalent to the fair value.31 December 2010 31 December <strong>2011</strong>(€ million) Book value Market value Book value Market valueFinancial liabilities 8,506 8,646 8,412 8,589The market value was determined on the basis of the current value of future cash flows, using discount rates between 1.0%and 1.9% (0.8% and 2.9% at 31 December 2010). This information is not reported for other financial assets/liabilities becausethe book value is almost equivalent to the market value.Market value of financial instrumentsBelow is the classification of financial assets and liabilities measured at fair value on the balance sheet in accordance with thefair value hierarchy defined on the basis of the significance of the inputs used in the measurement process. More specifically, inaccordance with the characteristics of the inputs used for measurement, the fair value hierarchy comprises the following levels:a) level 1: prices quoted (and not amended) on active markets for the same financial assets or liabilities;b) level 2: measurements made on the basis of inputs differing from the quoted prices referred to in the previous point, which,for the assets/liabilities submitted for measurement, are directly (prices) or indirectly (price derivatives) observable;c) level 3: inputs not based on observable market data.With regard to the above, the classification of the financial assets and liabilities measured at fair value on the balance sheetaccording to the fair value hierarchy concerned derivative financial instruments at 31 December <strong>2011</strong> classified at level 2 andentered under “Other current liabilities” (€75 million) and “Other non-current liabilities” (€188 million).<strong>Snam</strong> <strong>Annual</strong> <strong>Report</strong> <strong>2011</strong>
188<strong>Snam</strong> <strong>Annual</strong> <strong>Report</strong> <strong>2011</strong> / Notes to the consolidated financial statementsLitigation<strong>Snam</strong> is involved in civil, administrative and criminal cases and legal actions related to its normal business activities. Accordingto the information currently available and considering the existing risks, <strong>Snam</strong> believes that these proceedings and actions willnot have material adverse effects on its consolidated financial statements. The following is a summary of the most significantcases; unless indicated otherwise, no allocation has been made for the litigation described below because the company believesit improbable that these proceedings will have an unfavourable outcome or because the amount of the allocation cannot bereliably estimated.Criminal casesItalgas S.p.A. – Judiciary investigations into gas meteringIn May 2007 Italgas received notice of a local search and seizure proceeding within the framework of Case No. 11183/06 RGNRbrought by the public prosecutor of the Milan district court. The document was also served upon the Chairman of the company.The charge alleged unlawful conduct starting in 2003 relating to the use of gas metering equipment, the payment of exciseduties, the billing of customers and relations with the supervisory authority.Among other things, the charges relate to offences established in Legislative Decree No. 231 of 8 June 2001, which providesfor administrative liability of a company for crimes committed by its employees in the interest or to the advantage of thecompany itself.In December 2010 a notice of conclusion of preliminary investigations was received relating only to the specific matterof using Venturi-type metering equipment installed in various Milan municipalities, at the connection stations between thenational natural gas transportation networks and the local natural gas distribution networks. It should be noted that the publicprosecutor of Milan presented (under the scope of case No. 11183/06) a Request for Dismissal.At the same time it was learnt that the Milan public prosecutor transferred the jurisdiction of the prosecution relating to themetering systems installed in the province of Monza (alleged violation pursuant to Article 472 of the Italian Criminal Code) tothe Monza public prosecutor. Lastly, the Judge for the preliminary investigations at the Court of Monza extended the term forthe preliminary investigations (criminal case No. 14477/10 RGNR).The company is cooperating with the appropriate authorities in this investigation.<strong>Snam</strong> Rete Gas S.p.A. – Judiciary investigations into gas meteringThe public prosecutor at the Milan district court has commenced a criminal case on the issue of gas metering and the legitimacyand reliability of what are referred to as the Venturi meters. This has involved several companies in the gas sector.<strong>Snam</strong> Rete Gas and some of its managers are also involved in the case and the Mazara del Vallo metering system has beenplaced under precautionary seizure; the company is under investigation pursuant to Articles 24 and 25-ter of Legislative DecreeNo. 231/2001.In November 2009, notice of conclusion of preliminary investigations was received, within the context of the aforementionedbroader criminal case relating to the gas metering system, concerning a matter pertaining particularly to tax issues deemed ofa criminal nature.Some managers and department heads (including some no longer employed by the company) are under investigation withregard to various matters.The period under investigation is a time span that, in total, covers the years from 2003 to 2007, relating primarily to annualnatural gas consumption reports and to assessment and/or payment of excise duties on natural gas, as well as to possibleobstruction of supervisory duties.On 31 May <strong>2011</strong> the public prosecutor at the Milan district court put forward a request for dismissal pursuant to Article 425of the Italian Code of Criminal Procedure in relation to indictment No. 6 of the request to trial.The act refers specifically to disputed offences under Articles 472 and 110 of the Italian Criminal Code with regard to certain<strong>Snam</strong> managers and subject of the Request for Dismissal relating to the CEO.<strong>Snam</strong> <strong>Annual</strong> <strong>Report</strong> <strong>2011</strong>
<strong>Snam</strong> <strong>Annual</strong> <strong>Report</strong> <strong>2011</strong> / Notes to the consolidated financial statements189On 5 October <strong>2011</strong> the public prosecutor of Milan presented a further request to the judge at the preliminary hearing not toproceed, with regard to the CEO, with reference to the disputed violation of the provisions in Article 2638, paragraph 2 of theItalian Civil Code, restricted to the failed notification of the AEEG (Electricity and Gas Authority) as per Resolution 137/02,Article 7, paragraph 4, letter b.At the outcome of the preliminary hearing held on 24 January 2012, the preliminary hearing judge (G.U.P.) did not find theexistence of facts to support the case and acquitted all the <strong>Snam</strong> S.p.A. and <strong>Snam</strong> Rete Gas S.p.A. (or former <strong>Snam</strong> Rete GasS.p.A.) employees/managers with regard to all counts which were the subject of this dispute.The assistant public prosecutor has filed for an appeal before the Court of Cassation at the Milan district court. The appealrelates to only some of the acquitted defendants.Civil and administrative litigation<strong>Snam</strong> Rete Gas S.p.A. – Dispute concerning Impresa Unione S.p.A., in liquidationBy sentence numbers 20153/11 and 20154/11 handed down on 3 October <strong>2011</strong>, the Supreme Court of Cassation, ruling on twoappeals submitted in 2006 by Impresa Unione S.p.A., in liquidation, concerning the execution of works relating to the project toupgrade the “Algerian” pipeline, against Eni S.p.A. and <strong>Snam</strong> Rete Gas S.p.A. (RG numbers 18592/06 RG and 18593/06), upheldthe first grounds for these appeals and declared inadmissible the previous appeal submitted by <strong>Snam</strong> Rete Gas.The Court of Cassation thereby overturned, without adjournment, Milan Appeal Court sentence numbers 1032/05 and 1033/05,thus making absolute the sentences of the court of first instance which ordered <strong>Snam</strong> S.p.A. (subsequently incorporated intoEni S.p.A.) to pay L14.8 billion and L16.4 billion respectively, plus costs, to Impresa Unione.Following the judgment by the Court of Cassation, <strong>Snam</strong> Rete Gas S.p.A. made a payment of €19.6 million within the limitsof the amounts allocated to the provision for risks and charges at the time of the transfer, suitably adjusted.<strong>Snam</strong> Rete Gas S.p.A. – Recovery of amounts for improper withdrawals of gasEni S.p.A. has involved <strong>Snam</strong> Rete Gas S.p.A. in civil proceedings against end customers for the recovery of amounts forimproper withdrawals of gas by said end customers, asserting that they did not behave in compliance with the role attributedto them by the Network Code.Eni S.p.A. also challenged Resolution 268/05 of the Electricity and Gas Authority, which introduced into the provisions of the<strong>Snam</strong> Rete Gas Network Code the mandatory presence of a representative of the end customer in order to be able to carryout the so-called “dumping” of pipes at the redelivery points under safe conditions. With a ruling on 1 December <strong>2011</strong>, theLombardy Regional Administrative Court upheld the appeal and annulled the part of said Resolution that imposed the abovementionedobligation. In accordance with the procedure for amending the Network Code, <strong>Snam</strong> Rete Gas has drafted theresulting changes to the Code. These must be submitted to the Electricity and Gas Authority for approval.<strong>Snam</strong> Rete Gas believes that it has always acted correctly and in full compliance with the terms of the transportation agreement,the Network Code, related application procedures and, in general, the legal and technical rules of conduct. Having consulted anindependent legal expert, who claims that the compensation claim is unlikely to be upheld, <strong>Snam</strong> Rete Gas remains convincedthat any criticism of its conduct is unfounded.Competition AuthorityItalgas S.p.A. – Investigation of the gas distribution sector in ItalyThe Competition Authority, in its session of 13 October 2010, started an investigation to determine whether Italgas hadabused its dominant position, obstructing the Municipalities of Rome and Todi in preparing their calls for tenders for thecontracting of gas distribution services.The decision was taken in light of indications sent to the regulator by two local entities accusing the company, as gas distributionservice concessionaire, of having delayed or refused to give the necessary information to the authorities to prepare calls fortenders for contracting the service.<strong>Snam</strong> <strong>Annual</strong> <strong>Report</strong> <strong>2011</strong>
190<strong>Snam</strong> <strong>Annual</strong> <strong>Report</strong> <strong>2011</strong> / Notes to the consolidated financial statementsItalgas contested the Competition Authority’s charges, justifying its behaviour, both with regard to the delay or the refusal tosend certain data and information, and with reference to the existence of a plan to shut out its competitors.Through measures taken on 14 December <strong>2011</strong>, the Competition Authority imposed a penalty on Italgas of approximately €5million, for having conducted supposedly abusive practices in the context of tenders for the allocation of the gas distributionservices held by the Municipality of Rome and the Municipality of Todi.Within the time limits prescribed by law, the Company will pay the penalty and will appeal to the administrative courts againstthe Competition Authority’s penalty.Electricity and Gas Authority<strong>Snam</strong> Rete Gas S.p.A. – Investigation into violations on the subject of natural gas metering with regard to <strong>Snam</strong> Rete Gas S.p.Aand request for informationThrough Resolution VIS 97/11, notified on 15 November <strong>2011</strong>, the Electricity and Gas Authority, following a report from anatural gas distribution company, started proceedings to look into whether there were any violations with regard to naturalgas metering, relating to alleged irregularities in gas metering with reference to 45 systems owned by the distributor.On 14 December <strong>2011</strong>, <strong>Snam</strong> Rete Gas sent the required documents to the Authority. The time limit for the investigation is180 days from the notification date.<strong>Snam</strong> Rete Gas S.p.A. - Investigation into violation of the regulation on availability of natural gas higher heating valuemeasurementsAs a result of the formal investigation initiated by Resolution VIS 85/09, the Electricity and Gas Authority, by Resolution VIS12/11, issued a fine of €580,000 against <strong>Snam</strong> Rete Gas for violating the rules imposed on gas transportation companies withrespect to the proper measurement and use of natural gas higher heating values (hereinafter HHV). That parameter is neededto determine the actual energy provided to operators on the market or individual sellers.Specifically, the Authority saw fit to penalise temporary interruption, in limited cases, of the mechanical and chemical readingof the HHV, even though <strong>Snam</strong> had replaced readings with manual samplings. The Authority also found that the violationdid not involve any billing infraction and, when determining the amount of the fine, it took into consideration the correctiveactions taken by <strong>Snam</strong> in order to improve the measurement service and to avoid similar negative reflections on its operationsin the future.In conjunction with payment of the fine, subject to an appeal, <strong>Snam</strong> has urged the competent court to review the measure inprotection of its corporate interests.A date is yet to be set for a merit hearing before the Lombardy Regional Administrative Court.Italgas S.p.A. - Investigation into breaches with regard to information flows relating to gas metering dataWith Resolution VIS 73/11 published on 18 July <strong>2011</strong> and notified to Italgas on 16 September <strong>2011</strong>, the Italian Electricityand Gas Authority commenced proceedings against three distribution companies, including Italgas, to investigate an allegedbreach of provisions on information flows caused by attempts to collect metering data in the sellers’ favour, impose therelevant fines and adopt the necessary prescriptive actions.The time limit for the investigation is 180 days from the notification date.Italgas S.p.A. – Investigation into gas distribution service quality violationsOn 18 September 2009, the Electricity and Gas Authority, by Resolution VIS 92/09, started a formal investigation for theissuance of an administrative fine for violations of gas distribution service quality.With respect to these proceedings, it is necessary to note that: (i) they derived from a report by the Electricity and GasAuthority on absolution of the obligation, imposed on distributors which operate cast-iron pipe networks with fittings ofhemp and lead (not yet reconditioned), to replace, recondition or decommission them by 31 December 2008, to a minimumextent of 30%; and (ii) this investigation had the purpose of determining whether there was violation of Article 2, paragraph<strong>Snam</strong> <strong>Annual</strong> <strong>Report</strong> <strong>2011</strong>
<strong>Snam</strong> <strong>Annual</strong> <strong>Report</strong> <strong>2011</strong> / Notes to the consolidated financial statements1911 and Article 11, paragraph 7 of the Authority’s consolidated act of measures on the quality of gas distribution, meteringand sale services (Resolution 168/2004) and of issuing an administrative fine under Article 2, paragraph 20, letter c) of LawNo. 481/95.The investigation found that Italgas had complied with its replacement obligation across Italy, but that the company wasresponsible for failing to comply with said obligation in relation only to the distribution network in Venice. An administrativefine of €51,000 was handed down.Italgas believes it was justified in not complying with the obligation in relation to the Venice network. It has made provisionfor payment of the fine subject to an appeal, which was submitted promptly to the Lombardy Regional Administrative Court.A date is yet to be set for the merit hearing.Tax disputeGNL Italia S.p.A. – Local property tax (ICI)Following the change in classification and the reassessment of real estate income performed by the La Spezia territorial agency,with reference to the Panigaglia property complex, the Municipality of Porto Venere has challenged higher ICI sums owing forthe years 2001 to 2009.The relevant assessments, also relating to fines for each year – for which provision has been made in the amount of the highertax figures disputed – and interest, are the subject of as many disputes pending before the Tax Commissions of first or secondinstance, in accordance with fiscal periods.In order to avoid prolonging these disputes and an uncertain outcome for both parties, an agreement was signed on 25January 2012 for the definition of the disputes pending, preceded by an irrevocable offer to settle the dispute formalised bythe company on 30 December <strong>2011</strong> and by the authorisation resolution of the Municipal Council of 12 January 2012, whichprovides for:- recognition by GNL Italia S.p.A. of the correctness of the conduct of the territorial agency with regard to the classification ofthe property complex at the centre of the dispute in category D and the fairness of the revenue determined by said agency;- GNL Italia S.p.A. dropping its actions against the territorial agency and the Municipality of Porto Venere;- the Municipality of Porto Venere cancelling the tax assessments relating to 2001-2004 and adjusting the assessmentsrelating to the subsequent years;- the company paying the outstanding balance of tax payables plus interest for 2005, 2006 and 2007, and a fine solely for2005;- the voiding of any outstanding ICI payable from GNL Italia S.p.A. to the Municipality of Porto Venere for the years 2007,2008, 2009, 2010 and <strong>2011</strong>, in consideration of payments already made by the company, following notification of taxinjunctions for 2007, 2008 and 2009 and payments made relating to 2010 and <strong>2011</strong>.Based on the contents of the irrevocable offer formulated for the Municipality of Porto Venere, the company, at 31 December<strong>2011</strong>, used the risk provision already made on the balance sheet.Environmental regulationsThe risks related to the impact of the activities of <strong>Snam</strong> on the environment, on health and on safety are described in the“Operational risk” section of the Directors’ <strong>Report</strong>. In particular, with respect to environmental risk, while <strong>Snam</strong> believesthat it operates in substantial compliance with the laws and regulations and considering the adjustments to environmentalregulations and actions already taken, it cannot be ruled out that <strong>Snam</strong> may incur costs or liabilities, which could even besignificant.It is difficult to foresee the repercussions of any environmental damage, partially due to new laws or regulations that may beintroduced for environmental protection, the impact of any new technologies for environmental clean-ups, possible litigationand difficulty in determining the possible consequences, also with respect to other parties’ liability and any possible insurancecompensation.<strong>Snam</strong> <strong>Annual</strong> <strong>Report</strong> <strong>2011</strong>
192<strong>Snam</strong> <strong>Annual</strong> <strong>Report</strong> <strong>2011</strong> / Notes to the consolidated financial statementsOther commitments and risksThe other unevaluated commitments and risks are:Commitments arising from the contract for the acquisition of Italgas and Stogit from EniAcquisition of ItalgasThe price determined for the acquisition of Italgas and Stogit is subject to adjustment mechanisms based on commitmentsmade when the transaction was completed which were also intended to apply after the date of execution.The Italgas acquisition price may be adjusted in order to pay: (i) Eni part of the profits from selling properties owned by Italgasthat are no longer part of operations; and (ii) <strong>Snam</strong> the amount arising from any compensation claims relating to the provisionfor environmental risks.Acquisition of StogitThe Stogit acquisition price may be adjusted to take into account the different amount that might be recognised by theElectricity and Gas Authority for the tariff period 1 April 2014 - 31 March 2018 relating to the volumes of natural gas ownedby Stogit on the share transfer date and which are part of RAB assets.The purchase agreement also provides for hedging mechanisms aimed at ensuring Eni keeps the risks/benefits that may arisefrom any sale of storage capacity which is no longer regulated and which may become freely available following negotiations,or from the sale of concessions held by Stogit when the share transfer took place which may be mainly dedicated to storageactivities that are no longer regulated.Developments over the course of <strong>2011</strong> are reported below.ItalgasAs settlement of asset adjustments in its favour, <strong>Snam</strong> Rete Gas S.p.A. paid its ultimate parent Eni S.p.A. €86 million, the netbalance between:- €145 million in favour of Eni for the difference between the provisional estimated aggregate value of the RAB (regulatedasset base) of Italgas and some of its subsidiaries and associates and the aggregate RAB value defined by the Electricity andGas Authority;- €59 million in favour of <strong>Snam</strong> relating mainly to estimated liabilities on events pre-dating the signing of the contract.Stogit<strong>Snam</strong> Rete Gas S.p.A. paid Eni S.p.A. €3 million as its share of the capital gain on the sale of natural gas no longer needed forthe functioning of the storage system.Metropolitan area of Rome and the “Romana Gas” business unitFollowing the sale by French company Suez S.A. (now GdF Suez S.A. after a merger) of its Belgian subsidiary Distrigaz, theultimate parent Eni, on the basis of preliminary agreements with Italgas, agreed to sell to Suez, together with other gas andelectricity assets, the distribution business of Italgas in the metropolitan area of Rome.The subject of the sale was the business unit responsible for distributing gas to the municipalities of Rome, Fiumicino, Ciampino,Marino, Grottaferrata, Rocca di Papa and Frascati, including the distribution networks (around 5,300 km in length) and relevantplants, around 1.3 million delivery points (approximately 28% of users served) and some 800 staff.The contract provided for completion of the transaction through the transfer by Italgas of said business unit into Rete GasRoma S.r.l. (an ad hoc company set up on 26 November 2008 and wholly owned by Italgas) and for the transaction to besuspended pending approval from the Municipality of Rome on the transfer of the concession by 30 June 2009, with the buyerable to extend this deadline to 31 August 2009.<strong>Snam</strong> <strong>Annual</strong> <strong>Report</strong> <strong>2011</strong>
<strong>Snam</strong> <strong>Annual</strong> <strong>Report</strong> <strong>2011</strong> / Notes to the consolidated financial statements193By executive order No. 1231 of 25 June 2009, the Municipality of Rome gave its approval to the transfer of the concessionagreement for the distribution of gas in the municipality to the above-mentioned Rete Gas Roma, recognising the will ofItalgas to sell the entire share capital of Rete Gas Roma to GdF Suez.By communication of 6 July 2009, the Mayor of Rome then specified that said executive order was the only act able tolegitimately and effectively express the approval of the municipal authorities to the transfer, and that said transfer shall benotified to the Municipal Council.However, on 13 July 2009, GdF Suez informed Italgas that it did not consider the conditions for the transfer of the gasdistribution business in the metropolitan area of Rome to be satisfied within the agreed timeframe, and that it would thereforenot complete the acquisition pursuant to the contract signed by the two parties on 30 October 2008.Following extensive and detailed negotiations with GdF Suez, on 13 December <strong>2011</strong> Eni announced it had signed a settlementagreement with GdF Suez, in which the latter agreed to pay Eni €40 million to suppress any claim and/or damage that mayarise from the previous agreements, including the above-mentioned contract to which Italgas was party. In relation to this, andto Italgas’ involvement in said agreements, Eni paid Italgas €10 million to fully cover any claim.Other commitmentsOther commitments include the commitment deriving from an option for the banks (the lending banks) to sell to Italgasand Iren (the grantors) the loans awarded by said banks to associate company AES Torino S.p.A.. The put option of thelending banks, separately and each limited to its own share of the loan, is subordinate to AES S.p.A. losing the gas distributionconcession in the municipality of Turin, which expires in 2012. If the option is exercised, the grantors must pay the totalnominal loan amount of €250 million, plus interests and auxiliary expenses. At present, it is not thought likely that said optionwill be exercised.Emissions tradingLegislative Decree No. 216 of 4 April 2006 transposed Emissions Trading Directive 2003/87/EC on greenhouse gas emissionand Directive 2004/101/EC on the use of carbon credits arising from projects in respect of the Kyoto Protocol’s flexiblemechanisms. In relation to the EU Emissions Trading System, which has been in force since 1 January 2005, on 27 November2008 the national committee on emissions trading issued Resolution 20/2008 on allocating emission permits for the 2008-2012 period to existing plants. <strong>Snam</strong> was allocated emission permits equivalent to around 4.4 million tonnes of carbon dioxide(approximately 0.88 million tonnes per year from 2008 to 2012), in addition to permits for around 0.6 million tonnes for plantsentering into service between 2008 and 2012. Quotas relating to these new plants include only those physically allocated andrecorded in the emissions register.In <strong>2011</strong>, the carbon dioxide emissions from <strong>Snam</strong> facilities were, overall, lower than the emission permits allocated. Some0.6 million tonnes of carbon dioxide was emitted into the atmosphere, whereas about 1 million tonnes had been allocated inemission permits, including permits for new plants. This meant a surplus of 0.4 million tonnes.29) RevenueThe key items comprising revenue are described below. The reasons for the most significant changes are given in the “Financialreview and other information” section of the Directors’ report.(€ million) 2010 <strong>2011</strong>Core business revenue 3,475 3,539Other revenue and income 33 663,508 3,605<strong>Snam</strong> <strong>Annual</strong> <strong>Report</strong> <strong>2011</strong>
194<strong>Snam</strong> <strong>Annual</strong> <strong>Report</strong> <strong>2011</strong> / Notes to the consolidated financial statementsCore business revenue (€3,539 million) is reported net of the following items:(€ million) 2010 <strong>2011</strong>Additional fees for the distribution service 207 208Additional fees for the transportation service:- GST and RET fees referred to in Resolutions ARG/com 93/10 and ARG/gas 177/10 (*) 245- Variable interruptibility fee as per Resolution 277/07 23 35- Regional network capacity fee per Resolution 45/07 -Equalisation 2 2232 490(*) Electricity and Gas Authority Resolutions 93/10 and 177/10 introduce, with effect from 1 January <strong>2011</strong>, the additional tariff components GST and RET, intended to finance, respectively, the“Account to offset subsidised tariffs for disadvantaged gas customers” (GS Account) and the “Fund for calculating and implementing energy savings and developing renewable sources in thenatural gas sector” (RE Account). Amounts received from <strong>Snam</strong> are paid in full to the Electricity Equalisation Fund.Core business revenue includes revenue from the construction and upgrading of natural gas distribution infrastructure linkedto concession agreements (€360 million; €349 million at 31 December 2010).Core business revenue is analysed by business segment in Note 35, “Segment information”. <strong>Snam</strong> generates all of its revenuein Italy.Other revenue and incomeOther revenue and income (€66 million) break down as follows:(€ million) 2010 <strong>2011</strong>Capital gains from disposals of property, plant and equipment and intangible assets 4 17Income from property investments 6 5Plant safety inspection fee 4 3Insurance compensation 2 3Contractual penalties and other income relating to commercial contracts 3 1Revenues from the sale of energy efficiency certificates (*) 2 1Other income 12 3633 66(*) Revenue from the sale of energy efficiency certificates is shown net of the acquisition costs of the certificates.Capital gains from the disposal of property, plant and equipment and intangible assets of €17 million relate to the transfer ofplants to local councils awarding the contract for the natural gas distribution service.Other income (€36 million) relates essentially to: (i) the payment by Eni to Italgas of a €10 million share of the compensationreceived from Gaz De France Suez (GDF Suez) following the settlement of disputes over contracts signed in 2008, concerning,inter alia, the transfer to GDF Suez of the natural gas distribution business in the City of Rome and in certain adjacent districts,held by Italgas S.p.A. 34 ; (ii) income paid by the Electricity and Gas Authority linked with the achievement of quality standardsin the performance of gas distribution services (€6 million).34 For further information, see Note 28 “Guarantees, commitments and risks”.<strong>Snam</strong> <strong>Annual</strong> <strong>Report</strong> <strong>2011</strong>
<strong>Snam</strong> <strong>Annual</strong> <strong>Report</strong> <strong>2011</strong> / Notes to the consolidated financial statements195Revenues from regulated and non-regulated activitiesThe analysis of revenues from regulated activities (€3,522 million) and non-regulated activities (€83 million) is reportedbelow:(€ million) 2010 <strong>2011</strong>Natural gas transportation 1,873 1,870Liquefied Natural Gas (LNG) regasification 24 23Natural gas distribution (*) 1,219 1,291Natural gas storage 326 338Revenue from regulated activities 3,442 3,522Revenue from non-regulated activities 66 833,508 3,605(*) Including revenues from the construction and upgrading of natural gas distribution infrastructure.Revenue from regulated activitiesNatural gas transportationRevenue from regulated activities (€1,870 million) mainly relates to fees for transportation activities and essentially concernsEni S.p.A. (€862 million) and Enel Trade S.p.A. (€275 million).Revenue includes the chargeback to users of the costs of connecting the company’s network to that of other operators (€47million) 35 .During the course of <strong>2011</strong>, <strong>Snam</strong> provided transportation services to 90 companies (82 companies in 2010).Natural gas distributionRevenue from regulated activities (€1,291 million) relates essentially to: (i) fees for natural gas distribution services (€903million) and mainly concerns Eni S.p.A. (€695 million) and Enel Energia S.p.A. (€47 million); (ii) revenue deriving from theconstruction and upgrading of distribution infrastructures (€360 million), recognised in application of international accountingstandard IFRIC 12; and (iii) technical services relating to the gas distribution service (€18 million).During the course of <strong>2011</strong>, <strong>Snam</strong> used its networks to distribute the gas of 194 commercial companies (169 companies at 31December 2010).Natural gas storageRevenue from regulated activities (€338 million) mainly relates to fees for modulation (€269 million) and strategic (€65million) storage, and mainly concerns Eni S.p.A. (€88 million) and Enel Trade S.p.A. (€48 million).During the course of <strong>2011</strong>, <strong>Snam</strong> provided natural gas storage services to 104 companies (60 companies at 31 December2010).Liquefied Natural Gas (LNG) regasificationRevenue from regulated activities (€23 million) relates to fees for liquefied natural gas (LNG) regasification, carried out at thePanigaglia (SP) LNG terminal, and mainly concerns Enel Trade S.p.A. (€15 million) and Eni S.p.A. (€4 million).35 Where the provision of the transportation service involves the networks of multiple operators, Resolution 166/05 of the Electricity and Gas Authority,as subsequently amended, allows the principal operator to invoice users for the service, transferring to other network operators the portion attributableto them.<strong>Snam</strong> <strong>Annual</strong> <strong>Report</strong> <strong>2011</strong>
196<strong>Snam</strong> <strong>Annual</strong> <strong>Report</strong> <strong>2011</strong> / Notes to the consolidated financial statementsRevenue from non-regulated activitiesRevenue from non-regulated activities (€83 million) mainly concerns: (i) technical services (€26 million) chiefly relatingto the natural gas distribution business segment; (ii) capital gains from the disposal of property, plant and equipment andintangible assets (€17 million); (iii) income from the settlement of contractual disputes (€10 million); (iv) the leasing of fibreoptictelecommunications cables (€10 million) from a telecommunications operator, maintenance of which is also <strong>Snam</strong>’sresponsibility; and (v) income from property investments (€5 million).30) Operating costsThe key items under operating costs are described below. The reasons for the most significant changes are given in the“Financial review and other information” section of the Directors’ report.(€ million) 2010 <strong>2011</strong>Purchases, services and other costs 623 659Personnel expense 345 334968 993Operating costs include the costs arising from the construction and upgrading of the natural gas distribution infrastructurelinked to concession agreements (€360 million; €349 million in 2010), of which €70 million relates to the costs of rawmaterials, consumables and supplies, €192 million to service costs and €93 million to personnel expense.Purchases, services and other costsPurchases, services and other costs (€659 million) break down as follows:(€ million) 2010 <strong>2011</strong>Costs incurred for raw materials, consumables, supplies and goods 156 222Costs for services 482 473Costs for the use of third-party assets 54 52Change in raw materials, consumables, supplies and goods 30 (44)Net accrual to provisions for risks and charges 6 27Other operating expenses 42 71770 801Less:Raw materials, consumables, supplies and goods:Increase on internal work - purchases (120) (106)(120) (106)Services:Increase on internal work - services (27) (36)(27) (36)623 659<strong>Snam</strong> <strong>Annual</strong> <strong>Report</strong> <strong>2011</strong>
<strong>Snam</strong> <strong>Annual</strong> <strong>Report</strong> <strong>2011</strong> / Notes to the consolidated financial statements197Costs for services amount to €437 million and comprise the following:(€ million) 2010 <strong>2011</strong>Construction, planning and coordination of work 183 175Purchase of transportation capacity (interconnection) 46 47Technical, legal, administrative and professional services 42 45Maintenance 46 42IT (information technology) services 32 37Personnel-related services 27 28Utilities 21 21Telecommunications services 17 21Insurance 17 16Other services 51 41482 473Less:Increase on internal work capitalised in non-current assets - services (27) (36)(27) (36)455 437Development costs which do not satisfy the conditions for recognition under assets in the balance sheet amount to less than€1 million.Costs for the use of third-party assets (€52 million) break down as follows:(€ million) 2010 <strong>2011</strong>Fees, patents and licences 38 40Leases and rentals 16 1254 52Fees, patents and licences (€40 million) mainly concern fees for the operation of natural gas distribution concessions andeasement concessions relating to the transportation activity.Leases and rentals (€12 million) mainly relate to charges for operating leases of office buildings and occupancy of public land.Future minimum payments due for non-cancellable operating leases break down as follows:(€ million) 2010 <strong>2011</strong>Payable in1 year 1 2from 2 to 5 years 2 5more than 5 years3 7The positive change in raw materials, consumables, supplies and goods (€44 million) is mainly due to: (i) the gas used for theprovision of the natural gas transportation service (€21 million); and (ii) the increase in materials inventory (€29 million)mainly relating to spare parts for the natural gas transportation network.<strong>Snam</strong> <strong>Annual</strong> <strong>Report</strong> <strong>2011</strong>
198<strong>Snam</strong> <strong>Annual</strong> <strong>Report</strong> <strong>2011</strong> / Notes to the consolidated financial statementsThe net accrual to provisions for risks and charges (€27 million, net of surplus utilisation) concerns the provision for risks andcharges for litigation (€17 million) and the provision for environmental charges (€10 million). Information on provisions forrisks and charges can be found in Note 23 “Provisions for risks and charges”.Other operating expenses (€71 million) break down as follows:(€ million) 2010 <strong>2011</strong>Capital losses on the cancellation of property, plant and equipment and intangible assets 12 27Indirect taxes and duties 11 14Accrual to the provision for impairment losses on receivables 6 4Methane gas consumption tax 4 2Other expenses 9 2442 71Other expenses (€24 million) mainly concern charges arising on litigation cases concluded during the period (€21 million) 36 .Personnel expenseThe personnel expense of €334 million breaks down as follows:(€ million) 2010 <strong>2011</strong>Wages and salaries 266 271Social security contributions (pensions and healthcare assistance) 83 86Other employee benefits 9 10Other expenses 39 20Less:Increase on internal work - personnel expense (52) (53)345 334The average number of payroll employees included in the scope of consolidation, broken down by status, is as follows:Professional status 31.12.2010 31.12.<strong>2011</strong>Executives 120 119Managers 502 516Office workers 3,279 3,227Manual workers 2,226 2,2076,127 6,069The average number of employees is calculated on the basis of the monthly number of employees for each category.36 A summary of the key proceedings can be found in Note 28 “Guarantees, commitments and risk – Litigation”.<strong>Snam</strong> <strong>Annual</strong> <strong>Report</strong> <strong>2011</strong>
<strong>Snam</strong> <strong>Annual</strong> <strong>Report</strong> <strong>2011</strong> / Notes to the consolidated financial statements199Incentive plans for executives with <strong>Snam</strong> sharesAt 31 December <strong>2011</strong> there were 3,151,851 options outstanding for the purchase of 3,151,851 <strong>Snam</strong> ordinary shares witha nominal value of €1. The options relate to the 2004 allocation of 148,500 shares with a strike price of €3.53, the 2005allocation of 538,000 shares with a strike price of €4.399, the 2006 allocation of 96,801 shares with a strike price of €2.905,the 2007 allocation of 637,350 shares with a strike price of €3.545, and the 2008 allocation of 1,731,200 shares with a strikeprice of €3.463. No new stock option plans have been issued since 2009.Changes in the stock option plans at 31 December <strong>2011</strong> are as follows:2010 <strong>2011</strong>No. ofsharesAverage strikeprice (€)Marketprice(€) (a)No. ofsharesAverage strikeprice (€)Marketprice(€) (a)Options existing at 1 January 7,510,700 3.46 3.46 5,949,951 3.49 3.73New options assigned (b)Options exercised during the period (766,074) 3.13 3.61 (1,986,600) 3.28 3.98Options expired during the period (c) (794,675) 3.54 3.47 (811,500) 3.46 3.82Options existing at period end 5,949,951 3.49 3.73 3,151,851 3.63 3.39of which exercisable 3,407,251 3.50 3,151,851 3.63(a) The market price of shares relating to options assigned, exercised or expired in the year corresponds to the weighted average for the number of shares, their market value (average officialprice on the Mercato Telematico Azionario in the previous month: (i) the date of the Board of Directors’ allocation resolution; (ii) the date of issue into the beneficiary’s securities accountfor the issue/transfer of shares; (iii) the unilateral termination date of employment for expired options; (iv) the date of expiry due to non-exercise under the terms of the Board of Directors’allocation resolution; (v) the date on which the Board of Directors determines the TSR positioning at the end of the vesting period). The market price of shares relating to options existing atthe start and end of the period is correct at period end.(b) Figures relate to the new options assigned during 2009 following the modification of the 2006-2008 stock option plan, approved by the board of directors on 29 July 2009.(c) Figures include options expired due to the TSR positioning at the end of the vesting period and options expired due to termination of employment.The breakdown of options by year of allocation is as follows:Year of assignment Options assigned Options expired Options exercisedExisting options at31 December <strong>2011</strong>2002 608,500 (21,000) (587,500)2003 640,500 (640,500)2004 677,000 (30,000) (498,500) 148,5002005 658,000 (51,000) (69,000) 538,0002006 2,933,575 (1,061,525) (1,775,249) 96,8012007 2,782,800 (1,043,900) (1,101,550) 637,3502008 2,726,000 (994,800) 1,731,20011,026,375 (3,202,225) (4,672,299) 3,151,851More information about the incentive plans for executives with <strong>Snam</strong> shares can be found in the “Other information” sectionof the Directors’ report.At 31 December <strong>2011</strong>, the average residual life of the options was 0.6 years for the 2004 plan, 1.6 years for the 2005 plan, 0.6years for the 2006 plan, 1.6 years for the 2007 plan and 2.6 years for the 2008 plan.The unit fair value of the options allocated in 2003, 2004 and 2005 was €0.4206, €0.174 and €0.382 per share, respectively.Following the modifications made to the 2006-2008 stock option plan, approved by the Board of Directors on 29 July 2009,the unit fair value of the options allocated in 2006, 2007 and 2008 is €0.3973, €0.2127 and €0.2535 per share, respectively.<strong>Snam</strong> <strong>Annual</strong> <strong>Report</strong> <strong>2011</strong>
200<strong>Snam</strong> <strong>Annual</strong> <strong>Report</strong> <strong>2011</strong> / Notes to the consolidated financial statementsThe assumptions used to determine the fair value of the options are given below:2003 2004 2005 2006 2007 2008Risk-free interest rate (%) 3.54 4.20 3.15 2.16 2.52 2.78Duration (years) (years) 8 8 8 6 6 6Implicit volatility (%) 20.02 11.27 14.88 20.94 20.94 20.94Estimated dividends (%) 4.80 5.64 4.55 5.72 5.65 5.54Remuneration due to key management personnelThe remuneration due to persons with powers and responsibilities for the planning, management and control of the company,i.e. executive and non-executive directors, general managers and managers with strategic responsibilities (“key managementpersonnel”), in office at 31 December of each financial year, amounts to €7 million (€6 million in 2010) and breaks down asfollows:(€ million) 2010 <strong>2011</strong>Short-term benefits (wages and salaries) 4 4Post-employment benefits 1 1Other long-term benefits 1 1Employment termination pay 16 7Remuneration due to Directors and Statutory auditorsThe remuneration due to directors totalled €3 million for both the <strong>2011</strong> and 2010 financial years. The remuneration due tostatutory auditors came to €0.2 million both in 2010 and in <strong>2011</strong>.The remuneration includes emoluments and any other amounts relating to pay, pensions and healthcare due for theperformance of duties as a director or statutory auditor in <strong>Snam</strong> and in other companies included in the scope of consolidation,giving rise to a cost for <strong>Snam</strong>, even if not subject to personal income tax.Depreciation, amortisation and impairment lossesDepreciation, amortisation and impairment losses amount to €654 million and break down as follows:(€ million) 2010 <strong>2011</strong>Depreciation and amortisationProperty, plant and equipment 495 487Intangible assets 173 176668 663Impairment lossesIntangible assets 1010Less:Recovery of value (9)678 654<strong>Snam</strong> <strong>Annual</strong> <strong>Report</strong> <strong>2011</strong>
<strong>Snam</strong> <strong>Annual</strong> <strong>Report</strong> <strong>2011</strong> / Notes to the consolidated financial statements201Depreciation of property, plant and equipment (€487 million) relates to natural gas transportation (€415 million), storage(€51 million), distribution (€16 million) and regasification (€5 million) activities.Amortisation of intangible assets (€176 million) relates to natural gas distribution (€151 million), transportation (€20million) and storage (€5 million) activities.Recovery of value (€9 million) relate to assets in the natural gas distribution segment, on which impairment losses wererecognised in 2010 (€10 million), due to the reduced cost of adapting plants for normal use.A more thorough analysis of depreciation, amortisation and impairment losses can be found in Note 11 “Property, plant andequipment” and Note 13 “Intangible assets”.31) Financial expenses (income)Financial expenses (income) amount to €313 million, broken down as follows:(€ million) 2010 <strong>2011</strong>Financial income (5) (3)Financial expense 174 247169 244Derivatives 102 69271 313The net value of financial income and expense (€244 million) breaks down as follows:(€ million) 2010 <strong>2011</strong>Financial expense related to net financial debt 188 262- Interest and other expenses from banks and other lenders 188 262Other financial (income) expense- Accretion discount (*) 15 12- Other financial expense: 8 10- Other financial income (5) (3)18 19Financial expense capitalised (37) (37)169 244(*) This item refers to the increase in provisions for risks and charges, which are reported at discounted value under non-current liabilities on the balance sheet.Expenses associated with net financial debt (€262 million) relate to interest on loans received from the ultimate parent, EniS.p.A. 37 .Other financial expense (income) of €19 million relates mainly to the accretion discount (€12 million) and to interest incomeand expense accrued on prepayments and accruals from regulated activities.Financial expenses capitalised (€37 million) relate to the part of financial expense absorbed by investment activities. Theinterest rate used for the capitalisation of financial expenses is between 2.1% and 3.3% (between 2.6% and 3.1% in 2010).37 The financial debt analysis can be found in Note 22 “Long-term financial liabilities and short-term portion of long-term liabilities”.<strong>Snam</strong> <strong>Annual</strong> <strong>Report</strong> <strong>2011</strong>
202<strong>Snam</strong> <strong>Annual</strong> <strong>Report</strong> <strong>2011</strong> / Notes to the consolidated financial statementsDerivativesDerivatives expenses (income) amount to €69 million and break down as follows:(€ million) 2010 <strong>2011</strong>Losses on derivative contracts:- Interest accrued during the period 102 70Gains on derivative contracts:- Interest accrued during the period (1)102 69All derivative contracts existing at 31 December <strong>2011</strong> were entered into with the ultimate parent, Eni S.p.A., and relate tointerest rate swaps. Information about the characteristics of these contracts is provided in Note 21 “Other current liabilities”.The average cost of borrowing, including the effects produced by derivative contracts, stands at 3.1% (2.9% in 2010).32) Income from equity investmentsIncome from equity investments (€51 million) is analysed below.(€ million) 2010 <strong>2011</strong>Capital gains from measurement from equity method 47 45Other Income from equity investments:- Capital gains on disposal 4- Dividends 247 51The analysis of capital gains from measurement by the equity method (€45 million) can be found in Note 14 “Equityinvestments”.Capital gains on disposal (€4 million) concern the disposal of 34.67% of the share capital of Acqua Campania S.p.A. held byItalgas for a total valuable consideration of €8 million 38 .38 The operation as a whole also involved the simultaneous disposal of equity investments held in Acqua Campania S.p.A. by Eni S.p.A. and Saipem S.p.A.<strong>Snam</strong> <strong>Annual</strong> <strong>Report</strong> <strong>2011</strong>
<strong>Snam</strong> <strong>Annual</strong> <strong>Report</strong> <strong>2011</strong> / Notes to the consolidated financial statements20333) Income taxesIncome taxes (€906 million) break down as follows:(€ million) 2010 <strong>2011</strong>Current taxes:- IRES 494 660- IRAP 122 126616 786Deferred and prepaid taxes:- Deferred (74) (79)- Prepaid (10) 11(84) (68)- Adjustment of deferred taxes at 31 December 2010 188532 906Income taxes of €906 million have increased by €374 million compared with the previous financial year, mainly due to theincreased charges arising from the application of additional corporate income tax (the “Robin Hood Tax”) to the natural gastransportation and distribution segments (€344 million, of which €169 million is in higher current taxes and €175 million inhigher deferred taxes, essentially linked to the adjustment of deferred taxes at 31 December 2010).Specifically, Article 7 of Decree Law No. 138 of 13 August <strong>2011</strong>, converted into Law No. 148 of 14 September <strong>2011</strong>, amendedDecree Law No. 112 of 25 June 2008 (converted into Law No. 133 of 6 August 2008), introducing an additional IRES (the RobinHood Tax) for companies operating in the fields of hydrocarbons exploration and development, oil refining, production andsale of petrol, oil, diesel, lubricants, liquefied natural gas and liquefied petroleum gas, and the production or sale of electricity,making provision, from the current financial year, for:- extending the scope of the Decree to include companies operating in the fields of transmission, dispatch and distributionof electricity and transportation and distribution of natural gas;- for the <strong>2011</strong>, 2012 and 2013 tax periods only, the rise in the rate of additional tax from 6.5% to 10.5%;- changes to the ceiling above which the additional tax applies, identified, with reference to the previous financial year, asrevenue of €10 million and taxable income of €1 million, to replace the previous threshold of €25 million.As a result of the measures in question, <strong>Snam</strong> companies operating in the natural gas transportation and distribution segmentsare subject to the additional IRES at a rate of 10.5% for financial years <strong>2011</strong>, 2012 and 2013 and 6.5% from 2014.The impact of taxes on pre-tax profit for the period is 53.4% (32.5% in 2010) in view of the theoretical tax rate of 33% (thesame as in 2010), which is obtained by applying the statutory tax rate of 27.5% (IRES) to pre-tax profit and 3.9% (IRAP) tothe net value of production.The analysis of the difference between the theoretical and actual tax rates is as follows:(%) 2010 <strong>2011</strong>Theoretical rate 33.0 33.0Increases (decreases) in theoretical rate:- Impact of the application of the Robin Hood Tax (Decree Law No. 138/<strong>2011</strong>, converted into Law No. 148/<strong>2011</strong>) 20.3- Permanent differences and other factors (0.5) 0.1(0.5) 20.4Effective rate 32.5 53.4<strong>Snam</strong> <strong>Annual</strong> <strong>Report</strong> <strong>2011</strong>
204<strong>Snam</strong> <strong>Annual</strong> <strong>Report</strong> <strong>2011</strong> / Notes to the consolidated financial statementsThe effective rate for the <strong>2011</strong> financial year is 53.4%. The increase is mainly due to the application of the additional IRES(Robin Hood Tax), which resulted in an increase of 20.3 percentage points (€344 million).Permanent differences and other factors include:- increase: (i) 0.9 percentage points (€16 million) in the different rates of regional production tax (IRAP); (iii) 0.3 percentagepoints (€5 million) for the 5% tax on dividends received;- decrease: (i) 0.7 percentage points (€12 million) in the valuation of equity investments using the equity method; (ii) 0.1percentage points (€2 million) in the effects of Article 1 of Decree Law No. 201/<strong>2011</strong>, converted by Law No. 214/<strong>2011</strong> oneconomic growth subsidies relating to the allocation to non-distributable reserves; (iii) 0.1 percentage points (€2 million)in the deduction for IRES purposes of 10% regional production tax (IRAP).The analysis of deferred and prepaid taxes based on the nature of the most significant temporary differences is given in Note25 “Deferred tax liabilities”, to which we refer.34) Earnings per shareBasic earnings per share are determined by dividing net profit by the weighted average number of outstanding <strong>Snam</strong> Rete Gasshares during the year, excluding treasury shares.Diluted earnings per share are determined by dividing net profit by the weighted average number of outstanding shares duringthe period, excluding treasury shares, increased by the number of shares which could potentially be issued following theallocation or disposal of treasury shares held under stock option plans.The weighted average number of outstanding shares used to calculate diluted earnings per share is 3,376,590,852 and3,378,055,326 for 2010 and <strong>2011</strong>, respectively.The reconciliation of the weighted average number of outstanding shares used to determine basic and diluted earnings pershare is set out below:2010 <strong>2011</strong>Weighted average number of outstanding shares used to calculate basic earnings per share 3,376,205,870 3,378,041,501Number of potential shares following stock option plans 384,982 13,825Weighted average number of outstanding shares used to calculate diluted earnings per share 3,376,590,852 3,378,055,326Net profit attributable to <strong>Snam</strong> (€ million) 1,106 790Basic earnings per share (€ per share) 0.33 0.23Diluted earnings per share (€ per share) 0.33 0.23<strong>Snam</strong> <strong>Annual</strong> <strong>Report</strong> <strong>2011</strong>
<strong>Snam</strong> <strong>Annual</strong> <strong>Report</strong> <strong>2011</strong> / Notes to the consolidated financial statements20535) Segment informationThe business segments in which <strong>Snam</strong> operates have been identified on the basis of the criteria adopted for the preparation ofoperational reporting by senior management when taking business decisions. The segments identified are as follows: (i) naturalgas transportation; (ii) LNG regasification; (iii) natural gas distribution; and (iv) natural gas storage. They relate to the activitiescarried out, predominantly, by <strong>Snam</strong> Rete Gas, GNL Italia, Italgas and Stogit, respectively.(€ million)Transportationand dispatchDistributionStorageRegasificationProfits on stockTotal2010Net core business revenue (a) 1,929 1,233 355 35 3,552Less: inter-segment revenue (41) (2) (23) (11) (77)Revenue from third parties 1,888 1,231 332 24 3,475Other revenue and income 6 28 2 (3) 33Net accrual to provisions for risks and charges (10) 15 1 6Depreciation, amortisation and impairment losses (430) (168) (76) (4) (678)EBIT 1,185 455 218 7 (3) 1,862Equity method valuation effect 47 47Directly attributable current assets (b) 621 394 142 17 1,174Directly attributable non-current assets (b) 11,421 4,097 2,961 90 18,569Of which:- Equity-accounted investments 319 319Directly attributable current liabilities 3,291 730 695 22 4,738Directly attributable non-current liabilities 6,244 1,481 1,362 17 9,104Capital expenditure 902 386 252 3 (3) 1,540<strong>2011</strong>Net core business revenue (a) 1,945 1,297 372 34 3,648Less: inter-segment revenue (62) (1) (35) (11) (109)Revenue from third parties 1,883 1,296 337 23 3,539Other revenue and income 13 49 3 1 66Net accrual to provisions for risks and charges 10 18 (1) 27Depreciation, amortisation and impairment losses (435) (158) (56) (5) (654)EBIT 1,137 559 255 7 1,958Equity method valuation effect 45 45Directly attributable current assets 754 454 602 13 1,823Directly attributable non-current assets 11,905 4,248 3,060 89 19,302Of which:- Equity-accounted investments 1 318 319Directly attributable current liabilities 3,797 984 1,098 16 5,895Directly attributable non-current liabilities 6,390 1,293 1,469 15 9,167Capital expenditure 892 394 296 3 1,585(a)(b)Before elimination of intra-segment dealings.The pseudo-working gas present in the storage fields that can no longer be supplied to users is classified under the item “Property, plant and equipment”. Consistent with this, thecorresponding value at 31 December 2010 (€294 million) was reclassified from “Current assets” to “Non-current assets”.<strong>Snam</strong> <strong>Annual</strong> <strong>Report</strong> <strong>2011</strong>
206<strong>Snam</strong> <strong>Annual</strong> <strong>Report</strong> <strong>2011</strong> / Notes to the consolidated financial statementsRevenue is generated by applying regulated tariffs or market conditions. Revenue of the company is generated entirely in Italy;costs are incurred almost entirely in Italy.36) Related party transactions<strong>Snam</strong> Rete Gas S.p.A. is a subsidiary of Eni S.p.A., which holds 52.53% of its shares.The related party transactions conducted by <strong>Snam</strong> and by the companies included in the scope of consolidation mainly involvethe provision of services, the exchange of goods, the provision and utilisation of financial resources and the hedging of interestrate risk with the ultimate parent Eni S.p.A. and its subsidiaries and associates, as well as with associates and entities undercommon control, and with Enel S.p.A., a state-controlled company, and its subsidiaries.All transactions are part of ordinary business activities and are generally settled on the basis of market conditions, i.e. underconditions that would be applied for two independent parties, and are performed in the interests of <strong>Snam</strong> companies.In accordance with the disclosure requirements introduced by Consob Regulation 17221 of 12 March 2010, the followingrelated party transactions were conducted in <strong>2011</strong>:- on 13 April <strong>2011</strong>, a “Forward Start” interest rate swap (IRS) derivative contract for <strong>Snam</strong> was arranged between <strong>Snam</strong>and its ultimate parent, Eni S.p.A., with a notional value of €300 million and a reference period of 19 October <strong>2011</strong> – 19October 2016. The contractual fixed base rate is 3.356% per annum;- on 19 April <strong>2011</strong>, a “Forward Start” interest rate swap (IRS) derivative contract for <strong>Snam</strong> was arranged between <strong>Snam</strong> andits ultimate parent, Eni S.p.A., with a notional value of €500 million and a reference period of 30 September <strong>2011</strong> – 28September 2018. The contractual fixed base rate is 3.458% per annum;- on 27 April <strong>2011</strong>, a “Forward Start” interest rate swap (IRS) derivative contract for the subsidiary Stogit S.p.A. was arrangedbetween Stogit S.p.A. and its ultimate parent, Eni S.p.A., with a notional value of €200 million and a reference period of 16September <strong>2011</strong> – 16 September 2018. The contractual fixed base rate is 3.367% per annum;- on 11 July <strong>2011</strong>, an agreement was signed between <strong>Snam</strong> and its ultimate parent, Eni S.p.A., concerning a loan from Eni for€300 million to be disbursed on 12 July <strong>2011</strong> and maturing on 12 July 2017. The interest rate, fixed for the entire term ofthe agreement, is 4.05% per annum;- on 16 September <strong>2011</strong>, a contract was signed between the subsidiary Stogit S.p.A. and its ultimate parent, Eni S.p.A.,concerning a loan from Eni for €200 million to be disbursed on 16 September <strong>2011</strong> and maturing on 16 September 2018.For the calculation of the interest rate, reference is made to the 3-month Euribor (ACT/360) recorded by the Euribor PanelSteering Committee on the interbank deposit market and denominated in Euros at 11:00 (Central European Time) for avalue date of the first day of each interest period and published by Reuters on its “EURIBOR01” page, plus a spread of 2.8%per annum;- on 23 September <strong>2011</strong>, natural gas transport capacity commitments were agreed between <strong>Snam</strong> and the related partyEnel Trade S.p.A. on <strong>Snam</strong>’s natural gas pipeline network in favour of Enel Trade S.p.A. for the <strong>2011</strong>-2012 thermal year (1October <strong>2011</strong> to 30 September 2012). These commitments are assumed in accordance with the procedures defined in the<strong>Snam</strong> Network Code approved by the Electricity and Gas Authority with its Resolution ARG/gas 75/2003, as subsequentlyamended. According to the contractual agreements, the finalisation of these commitments entails the calculation of a feefor services rendered by applying, for each thermal year, the natural gas transportation and dispatching tariffs approved bythe Electricity and Gas Authority Resolution. The fee for the <strong>2011</strong>-2012 thermal year is estimated at around €186 million;- on 23 September <strong>2011</strong>, natural gas transport capacity commitments were agreed between <strong>Snam</strong> and the ultimate parent EniS.p.A. on <strong>Snam</strong>’s natural gas pipeline network in favour of Eni S.p.A. for the <strong>2011</strong>-2012 thermal year (1 October <strong>2011</strong> to 30September 2012). These commitments are assumed in accordance with the procedures defined in the <strong>Snam</strong> Network Codeapproved by the Electricity and Gas Authority with its Resolution ARG/gas 75/2003, as subsequently amended. Accordingto the contractual agreements, the finalisation of these commitments entails the calculation of a fee for services renderedby applying, for each thermal year, the natural gas transportation and dispatching tariffs approved by the Electricity andGas Authority Resolution. The fee for the <strong>2011</strong>-2012 thermal year is estimated at around €690 million;<strong>Snam</strong> <strong>Annual</strong> <strong>Report</strong> <strong>2011</strong>
<strong>Snam</strong> <strong>Annual</strong> <strong>Report</strong> <strong>2011</strong> / Notes to the consolidated financial statements207- on 28 September <strong>2011</strong>, an agreement was signed between <strong>Snam</strong> and its ultimate parent, Eni S.p.A., concerning a loan fromEni for €500 million to be disbursed on 30 September <strong>2011</strong> and maturing on 30 December <strong>2011</strong>. The loan is renewablefor a further three months subject to conditions to be agreed based on the market conditions in force at the time of therenewal. For the calculation of the interest rate, reference is made to the 3-month Euribor (ACT/360), recorded by theEuribor Panel Steering Committee on the interbank deposit market and denominated in Euros at 11:00 (Central EuropeanTime) for a value date of the first day of each interest period and published by Reuters on its “EURIBOR01” page, plus aspread of 130 basis points for the first three months;- on 19 October <strong>2011</strong>, an agreement was signed between <strong>Snam</strong> and its ultimate parent, Eni S.p.A., concerning a loan fromEni for €300 million to be disbursed on 19 October <strong>2011</strong> and maturing on 19 October 2017. For the calculation of theinterest rate, reference is made to the 3-month Euribor (ACT/360), recorded by the Euribor Panel Steering Committee onthe interbank deposit market and denominated in Euros at 11:00 (Central European Time) for a value date of the first dayof each interest period and published by Reuters on its “EURIBOR01” page, plus a spread of 3.04% per annum calculatedtaking into account the spread and financial costs of the Eni debenture loan entitled “Eni TV <strong>2011</strong>/2017”.Under Article 13 of the aforementioned Consob Regulation, these agreements are classed as ordinary transactions concludedunder market-equivalent or standard conditions since, pursuant to Article 3 of the Procedure: (i) they fall within the scope ofnormal business operations and the associated financial activities; (ii) the terms are similar to those usually practised with nonrelatedparties for transactions of an equivalent nature, size and risk.The amounts of related party transactions of a commercial and financial nature for the 2010 and <strong>2011</strong> financial years arereported below. The nature of the most significant transactions is also stated.<strong>Snam</strong> <strong>Annual</strong> <strong>Report</strong> <strong>2011</strong>
208<strong>Snam</strong> <strong>Annual</strong> <strong>Report</strong> <strong>2011</strong> / Notes to the consolidated financial statementsCommercial and other transactionsName 31 December 2010 2010Receivables Payables Guarantees Costs (a) Revenue (b)(€ million) Goods Services Other Goods Services OtherParentEni S.p.A. 451 355 52 33 42 2 1,623 14Eni subsidiaries451 355 52 33 42 2 1,623 14- Eni Adfin S.p.A. 5 6 13 1- Eni Hellas S.p.A. 3- Eni Insurance Ltd 2 8- Enicorporate University S.p.A. 1 2- EniServizi S.p.A. 4 13 1 19 1 1- Saipem Energy Services S.p.A. 12 2 23- Saipem S.p.A. 98 154- Serfactoring S.p.A. 21- Syndial S.p.A. 1- Other (c) 2 2 1 2 1Entities under common controland associates of Eni14 156 3 220 1 2 3- Transitgas AG 1- Transmediterranean Pipeline Co Ltd 2 1- Other (c) (..) (..) (..) (..)Entities under common controland associates- A.E.S. S.p.A. 1 3- Servizi Territori Aree Penisole S.p.A. 12 (..) (..) (..) 1 1- Toscana Energia S.p.A. 4 2- Other (c) 2 1 1State-owned or -controlledcompanies8 3 1 3- Anas group 2 5 1- Enel group 73 16 2 361- Ferrovie dello Stato group 2 1 2- Other (c) 1 2 1 178 23 3 2 363 1Total 553 537 52 36 265 5 2 1,992 18(a)(b)(c)Includes costs for goods and services to be used in investing activities.Before tariff components which are offset in costs.Individually less than €1 million.<strong>Snam</strong> <strong>Annual</strong> <strong>Report</strong> <strong>2011</strong>
<strong>Snam</strong> <strong>Annual</strong> <strong>Report</strong> <strong>2011</strong> / Notes to the consolidated financial statements209Name 31 December <strong>2011</strong> <strong>2011</strong>Receivables Payables Guarantees Costs (a) Revenue (b)(€ million) Goods Services Other Goods Services OtherParentEni S.p.A. 452 121 65 148 31 1 1,668 21Eni subsidiaries452 121 65 148 31 1 1,668 21- Eni Adfin S.p.A. (c) 10 12 12 1- Eni Hellas S.p.A.- Eni Insurance Ltd 6 1- Enicorporate University S.p.A. 3 3- EniServizi S.p.A. 3 14 1 17 1 1- Saipem Energy Services S.p.A. 1- Saipem S.p.A. 64 74- Serfactoring S.p.A. 40- Syndial S.p.A. 1- Other (d) 2 2 1 1 2Entities under common controland associates of Eni- Cepav (Consorzio Eni per l’Alta Velocità) 215 136 1 114 1 2 4- Other (d) 1 1 (..) (..)Entities under common controland associates- A.E.S. S.p.A. 1 3- Servizi Territori Aree Penisole S.p.A. 23 1 (..) (..)- Toscana Energia S.p.A. 2 1 1 1- Other (d) 3 2State-owned or -controlledcompanies8 4 1 3- Anas group 3 5 1 2- Enel group 64 5 1 385 1- Ferrovie dello Stato group 1 4 3 1- Enel group 1- Other (d) 168 15 1 5 388 1Total 546 277 65 149 147 7 2,061 26(a)(b)(c)(d)Includes costs for goods and services to be used in investing activities.Before tariff components which are offset in costs.As of 1 November <strong>2011</strong>, <strong>Snam</strong> acquired the business unit “Unbundled Companies Administrative Services” from Eni Adfin S.p.A. The administrative services provided by Eni Adfin for the<strong>2011</strong> financial year cover the period from 1 January <strong>2011</strong> to 31 October <strong>2011</strong>. Eni Adfin S.p.A. is responsible for providing certain ancillary administrative services (dispatching of financialdocuments, electronic invoicing, submission of electronic tax returns).Individually less than €1 million.<strong>Snam</strong> <strong>Annual</strong> <strong>Report</strong> <strong>2011</strong>
210<strong>Snam</strong> <strong>Annual</strong> <strong>Report</strong> <strong>2011</strong> / Notes to the consolidated financial statementsUltimate parentCommercial transactionsThe most important active commercial transactions with the ultimate parent, Eni S.p.A., concern the provision of regulated gasservices relating to transportation, regasification, distribution and storage, on the basis of tariffs established by the Electricityand Gas Authority.The principal passive commercial transactions mainly concern the supply of electricity used for business activities and naturalgas used for storage infrastructure. These transactions are governed by contracts entered into under normal market conditions.<strong>Snam</strong> also has transactions in place in connection with contracts for the provision of consultancy and technical/operationalsupport services relating to storage fields. These transactions are governed by service agreements on the basis of the costsincurred.A contract was in force at 31 December <strong>2011</strong> between Eni S.p.A. and <strong>Snam</strong> which governed the use and management of aseries of services rendered by Eni S.p.A. central divisions to <strong>Snam</strong> and its subsidiaries. In particular, the services provided relatedto the following areas: (i) human resources; (ii) corporate affairs and governance; (iii) health, safety and environment; (iv) ICT 39 ;(v) institutional relations and communication. These transactions were governed on the basis of the costs actually incurred forthe provision of the related services.Note that, following the transposition of Legislative Decree No. 93 of 1 June <strong>2011</strong> (the “Third Energy Package”), activities areunder way to cease the service agreements in place with Eni or its subsidiaries.Other transactionsAs established by the contract for the purchase of Italgas and Stogit from Eni, signed on 30 June 2009, the price determined forthe acquisition of the two companies is subject to adjustment mechanisms, to be applied if necessary after the date of executionof the contract, based on commitments assumed when the acquisition was finalised 40 . As a result of such commitments, in<strong>2011</strong> asset adjustments in favour of <strong>Snam</strong> (owed by Eni) were recognised in the amount of €12 million in relation to themeasurement of liabilities on events already in existence on the contract completion date.Furthermore, in <strong>2011</strong>, <strong>Snam</strong> also paid the ultimate parent, Eni S.p.A., the amount of €89 million, as partial settlement of theasset adjustments in its favour.Finally, transactions exist with Eni within the context of the national tax consolidation scheme, which is subscribed to by allcompanies within the scope of consolidation of the <strong>Snam</strong> group, and the VAT consolidation scheme. These transactions aregoverned by the appropriate legally binding contracts.Subsidiaries of EniThe key transactions with Eni’s subsidiaries relate to:- Saipem S.p.A., for design and project supervision services in relation to the construction of natural gas transportationinfrastructure, governed by contracts entered into under normal market conditions;- Serfactoring S.p.A. for factoring transactions performed by <strong>Snam</strong> Rete Gas suppliers.<strong>Snam</strong> also has commercial transactions with special-purpose entities which provide services to Eni group companies, including:(i) EniServizi S.p.A., which provides real estate management services such as maintenance of buildings, fixtures and associatedplants, transportation services, sanitation services, catering, caretaking, supply of non-strategic assets and centralisedmanagement of the company’s archives; and (ii) Eni Adfin S.p.A. (formerly Sofid S.p.A.), which provides administrative services 41 .These transactions are governed on the basis of the costs incurred for the provision of the related services.39 Effective as of 1 November <strong>2011</strong>, Eni acquired the business unit “Unbundled IT Services”.40 For more information, see Note 28 “Guarantees, commitments and risks - Commitments deriving from the agreement to purchase Italgas and Stogitfrom Eni”.41 Effective as of 1 November <strong>2011</strong>, the business unit “Unbundled Companies Administrative Services” was acquired from Eni Adfin.<strong>Snam</strong> <strong>Annual</strong> <strong>Report</strong> <strong>2011</strong>
<strong>Snam</strong> <strong>Annual</strong> <strong>Report</strong> <strong>2011</strong> / Notes to the consolidated financial statements211Entities under common control and associatesTransactions with entities under common control and associates relate to the provision of IT services governed by contractsentered into under normal market conditions.State-owned or -controlled companiesTransactions with state-owned or -controlled companies relate mainly to the Enel Group and concern natural gas transportation,regasification, distribution and storage services. These transactions are governed on the basis of tariffs established by theElectricity and Gas Authority.Financial transactionsName 31.12.2010 2010(€ million)Other assets (a)PayablesOther liabilities (a)Expense (b) (c)IncomeParent- Eni S.p.A. 15 10,349 89 29015 10,349 89 290(a)(b)(c)Includes assets and liabilities deriving from the measurement of derivatives.Includes financial expense for investments.Includes €102 million relating to expenses on derivatives.Name 31.12.<strong>2011</strong> <strong>2011</strong>(€ million)PayablesOther liabilities (a)Expense (b) (c)IncomeParent- Eni S.p.A. 11,199 266 331 111,199 266 331 1(a)(b)(c)Includes assets and liabilities deriving from the measurement of derivatives.Includes financial expense for investments.Includes €70 million relating to expenses on derivatives.Ultimate parentTransactions with the ultimate parent, Eni S.p.A., relate to the coverage of financial requirements, utilisation of liquidity andinterest rate risk hedging, through the use of derivative contracts, classified pursuant to IAS 39 as cash flow hedge derivatives.These transactions are governed by contracts entered into under normal market conditions.For transactions with directors, auditors and key managers, please refer to the information contained in the paragraph onremuneration in Note 30 “Operating costs”.<strong>Snam</strong> <strong>Annual</strong> <strong>Report</strong> <strong>2011</strong>
212<strong>Snam</strong> <strong>Annual</strong> <strong>Report</strong> <strong>2011</strong> / Notes to the consolidated financial statementsImpact of related party transactions or positions on the balance sheet, income statement and statement of cashflowsThe impact of related party transactions or positions on the balance sheet is summarised in the following table:31.12.2010 31.12.<strong>2011</strong>(€ million) TotalRelatedpartiesShare(%) TotalRelatedpartiesShare(%)Trade and other receivables 944 553 58.6 1,545 546 35.3Other current assets 71 2 2.8 33 2 6.1Other non-current assets 49 16 32.7 81 1 1.2Short-term financial liabilities 1,844 1,844 100.0 2,787 2,787 100.0Long-term financial liabilities 8,506 8,505 100.0 8,412 8,412 100.0Trade and other payables 1,322 537 40.6 1,344 277 20.6Other current liabilities 221 58 26.2 211 78 37.0Other non-current liabilities 331 31 9.4 869 188 21.6The impact of related party transactions or positions on the income statement is summarised in the following table:2010 <strong>2011</strong>(€ million) TotalRelatedpartiesShare(%) TotalRelatedpartiesShare(%)Core business revenue 3,475 1,994 57.4 3,539 2,061 58.2Other revenue and income 33 18 54.5 66 26 39.4Purchases, services and other costs 623 95 15.2 659 77 11.7Financial expense 174 151 86.8 247 225 91.1Losses on derivative contracts 102 102 100.0 69 69 100.0Transactions with related parties are generally governed on the basis of market conditions, i.e. the conditions which would beapplied between two independent parties.<strong>Snam</strong> <strong>Annual</strong> <strong>Report</strong> <strong>2011</strong>
<strong>Snam</strong> <strong>Annual</strong> <strong>Report</strong> <strong>2011</strong> / Notes to the consolidated financial statements213The principal cash flows with related parties are shown in the following table:(€ million) 2010 <strong>2011</strong>Revenue and income 2,012 2,087Cost and expense (95) (77)Change in trade and other receivables (13) (15)Change in trade and other payables (17) (26)Dividends collected 34 44Interest collectedInterest paid (258) (295)Net cash flows from operating activities 1,663 1,718Investments:- Property, plant and equipment and intangible assets (248) (229)- Companies entering the scope of consolidation (127) 11- Change in payables and receivables relating to investments 155 (137)Cash flows from investment activities (220) (355)Divestments:- Equity investments 7Cash flows from divestments 7Net cash flows from investment activities (220) (348)Taking on of long-term financial debt 1,020 1,226Repaying of long-term financial debt (914) (1,320)Increase (decrease) in short-term financial debt 259 943Dividends paid (431) (450)Net cash flows from financing activities (66) 399Total cash flows with related parties 1,377 1,769The effect of cash flows with related parties is shown in the following table:31.12.2010 31.12.<strong>2011</strong>Total Related Share Total Related Share(€ million) Parties % Parties %Cash flow from operating activities 1,775 1,663 93.7 1,537 1,718Cash flow from investment activities (1,393) (220) 15.8 (1,588) (348) 21.9Cash flow from financing activities (410) (66) 16.1 45 399<strong>Snam</strong> <strong>Annual</strong> <strong>Report</strong> <strong>2011</strong>
214<strong>Snam</strong> <strong>Annual</strong> <strong>Report</strong> <strong>2011</strong> / Notes to the consolidated financial statements37) Significant non-recurring events and transactionsDuring the course of <strong>2011</strong>, there were no significant non-recurring events and transactions.38) Positions or transactions deriving from atypical and/or unusual transactionsNo positions or transactions deriving from atypical and/or unusual transactions are reported.39) Publication of the financial statementsThe financial statements were authorised for publication by <strong>Snam</strong>’s Board of Directors at its meeting of 12 March 2012, inaccordance with the law. The Board of Directors authorised the Chairman and the Chief Executive Officer to make any changeswhich might be necessary or appropriate for finalising the format of the document during the period between 12 March 2012and the date of approval by the Shareholders’ Meeting.40) Significant events after the end of the fiscal yearSignificant events after the reporting date are described in the section “Other information” contained in the Directors’ report.<strong>Snam</strong> <strong>Annual</strong> <strong>Report</strong> <strong>2011</strong>
215Certification of the consolidated financial statements pursuant to Article 154-bis,paragraph 5 of Legislative Decree No. 58/98 (Testo Unico della Finanza)1. The undersigned Carlo Malacarne and Antonio Paccioretti, as Chief Executive Officer and Chief Financial Officer of <strong>Snam</strong>S.p.A. respectively, certify, taking into account Article 154-bis, paragraphs 3 and 4 of Legislative Decree No. 58 of 24February 1998:- the adequacy, considering the group’s characteristics, and- the effective implementation of the administrative and accounting procedures for the preparation of the consolidatedfinancial statements during the course of <strong>2011</strong>.2. The administrative and accounting procedures for the preparation of the consolidated financial statements at 31 December<strong>2011</strong> were defined and their adequacy was assessed using the rules and methods in line with the Internal Control –Integrated Framework model issued by the Committee of Sponsoring Organisations of the Treadway Commission, whichrepresents a benchmark framework for the internal control system generally accepted at international level.In this regard it is noted that, following the acquisition by <strong>Snam</strong> on 1 November <strong>2011</strong> of the business units “UnbundledCompanies Administrative Services” from Eni Adfin S.p.A. and “Unbundled IT Services” from Eni S.p.A., <strong>Snam</strong>’s accounting andadministrative procedures have been updated.3. It is also certified that:3.1 The consolidated financial statements at 31 December <strong>2011</strong>:(a) were prepared in accordance with the applicable international accounting standards recognised in the EuropeanCommunity pursuant to Regulation (EC) No 1606/2002 of the European Parliament and of the Council of 19 July2002;b) are consistent with the accounting records and ledgers;c) are able to provide a true and fair view of the financial position, results of operations and cash flows of the issuerand of the companies included in the scope of consolidation.3.2 The Directors’ report includes a reliable analysis of the operating performance and results, as well as the position of theissuer and of all the companies included in the scope of consolidation, together with a description of the principal risksand uncertainties to which they are exposed.12 March 2012/Signature/Carlo Malacarne___________________Carlo MalacarneChief Executive Officer/Signature/Antonio Paccioretti_____________________Antonio PacciorettiDirector of Planning, Administration, Finance and Control<strong>Snam</strong> <strong>Annual</strong> <strong>Report</strong> <strong>2011</strong>
216Independent auditors’ report<strong>Snam</strong> <strong>Annual</strong> <strong>Report</strong> <strong>2011</strong>
<strong>Snam</strong> <strong>Annual</strong> <strong>Report</strong> <strong>2011</strong>217