- Page 1 and 2: Annual Report2011Snam Annual Report
- Page 3 and 4: Reports and consolidated financial
- Page 5 and 6: Snam Annual Report 2011 / Letter to
- Page 7 and 8: Snam Annual Report 2011 / Corporate
- Page 9 and 10: Summary figuresSnam Annual Report 2
- Page 12 and 13: 12Snam Annual Report 2011 / The Sna
- Page 14 and 15: 14Snam Annual Report 2011 / The Sna
- Page 16 and 17: 16Snam Annual Report 2011 / Annual
- Page 18 and 19: 18Snam Annual Report 2011 / Annual
- Page 20 and 21: 20Snam Annual Report 2011 / Annual
- Page 22 and 23: 22Snam Annual Report 2011 / Annual
- Page 24 and 25: 24Snam Annual Report 2011 / Snam an
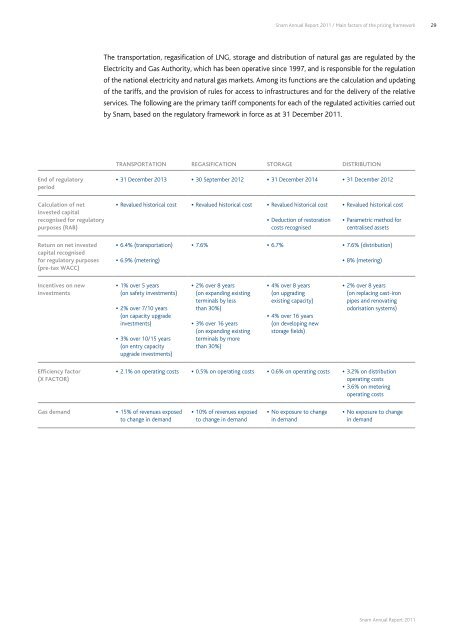
- Page 26 and 27: Snam Annual Report 2011
- Page 30 and 31: Snam Annual Report 2011Natural gas
- Page 32 and 33: 32Snam Annual Report 2011 / Natural
- Page 34 and 35: 34Snam Annual Report 2011 / Natural
- Page 36 and 37: 36Snam Annual Report 2011 / Natural
- Page 38 and 39: 38Snam Annual Report 2011 / Natural
- Page 40 and 41: Snam Annual Report 2011Liquefied Na
- Page 42 and 43: 42Snam Annual Report 2011 / Liquefi
- Page 44 and 45: Snam Annual Report 2011Natural gas
- Page 46 and 47: 46Snam Annual Report 2011 / Natural
- Page 48 and 49: 48Snam Annual Report 2011 / Natural
- Page 50 and 51: 50Snam Annual Report 2011 / Natural
- Page 52 and 53: 52Snam Annual Report 2011 / Natural
- Page 54 and 55: 54Snam Annual Report 2011 / Natural
- Page 57 and 58: Financial reviewand other informati
- Page 59 and 60: Snam Annual Report 2011 / Financial
- Page 61 and 62: Snam Annual Report 2011 / Financial
- Page 63 and 64: Annual Report 2011 / Financial revi
- Page 65 and 66: Annual Report 2011 / Financial revi
- Page 67 and 68: Annual Report 2011 / Financial revi
- Page 69 and 70: Annual Report 2011 / Financial revi
- Page 71 and 72: Annual Report 2011 / Financial revi
- Page 73 and 74: Annual Report 2011 / Financial revi
- Page 75 and 76: Annual Report 2011 / Financial revi
- Page 77 and 78: Annual Report 2011 / Financial revi
- Page 79 and 80:
Snam Annual Report 2011 / Elements
- Page 81 and 82:
Snam Annual Report 2011 / Elements
- Page 83 and 84:
Snam Annual Report 2011 / Elements
- Page 85 and 86:
Snam Annual Report 2011 / Elements
- Page 87:
Snam Annual Report 2011 / Outlook87
- Page 90 and 91:
90Snam Annual Report 2011 / Other i
- Page 92 and 93:
92Snam Annual Report 2011 / Other i
- Page 94 and 95:
94Snam Annual Report 2011 / Other i
- Page 97 and 98:
Informationon corporate governancea
- Page 99 and 100:
Snam Annual Report 2011 / Informati
- Page 101 and 102:
Snam Annual Report 2011 / Informati
- Page 103 and 104:
Snam Annual Report 2011 / Informati
- Page 105 and 106:
Snam Annual Report 2011 / Informati
- Page 107 and 108:
Snam Annual Report 2011 / Informati
- Page 109 and 110:
Snam Annual Report 2011 / Informati
- Page 111 and 112:
Snam Annual Report 2011 / Informati
- Page 113:
Snam Annual Report 2011 / Informati
- Page 116 and 117:
116Snam Annual Report 2011 / Commit
- Page 118 and 119:
118Snam Annual Report 2011 / Commit
- Page 120 and 121:
120Snam Annual Report 2011 / Commit
- Page 122 and 123:
122Snam Annual Report 2011 / Commit
- Page 124 and 125:
124Snam Annual Report 2011 / Commit
- Page 126 and 127:
126Snam Annual Report 2011 / Commit
- Page 128 and 129:
128Snam Annual Report 2011 / Commit
- Page 130 and 131:
Glossary
- Page 132 and 133:
132Snam Annual Report 2011 / Glossa
- Page 134 and 135:
134Snam Annual Report 2011 / Glossa
- Page 136 and 137:
136Snam Annual Report 2011 / Glossa
- Page 138 and 139:
138Snam Annual Report 2011 / Consol
- Page 140 and 141:
140Snam Annual Report 2011 / Consol
- Page 142 and 143:
142Snam Annual Report 2011 / Notes
- Page 144 and 145:
144Snam Annual Report 2011 / Notes
- Page 146 and 147:
146Snam Annual Report 2011 / Notes
- Page 148 and 149:
148Snam Annual Report 2011 / Notes
- Page 150 and 151:
150Snam Annual Report 2011 / Notes
- Page 152 and 153:
152Snam Annual Report 2011 / Notes
- Page 154 and 155:
154Snam Annual Report 2011 / Notes
- Page 156 and 157:
156Snam Annual Report 2011 / Notes
- Page 158 and 159:
158Snam Annual Report 2011 / Notes
- Page 160 and 161:
160Snam Annual Report 2011 / Notes
- Page 162 and 163:
162Snam Annual Report 2011 / Notes
- Page 164 and 165:
164Snam Annual Report 2011 / Notes
- Page 166 and 167:
166Snam Annual Report 2011 / Notes
- Page 168 and 169:
168Snam Annual Report 2011 / Notes
- Page 170 and 171:
170Snam Annual Report 2011 / Notes
- Page 172 and 173:
172Snam Annual Report 2011 / Notes
- Page 174 and 175:
174Snam Annual Report 2011 / Notes
- Page 176 and 177:
176Snam Annual Report 2011 / Notes
- Page 178 and 179:
178Snam Annual Report 2011 / Notes
- Page 180 and 181:
180Snam Annual Report 2011 / Notes
- Page 182 and 183:
182Snam Annual Report 2011 / Notes
- Page 184 and 185:
184Snam Annual Report 2011 / Notes
- Page 186 and 187:
186Snam Annual Report 2011 / Notes
- Page 188 and 189:
188Snam Annual Report 2011 / Notes
- Page 190 and 191:
190Snam Annual Report 2011 / Notes
- Page 192 and 193:
192Snam Annual Report 2011 / Notes
- Page 194 and 195:
194Snam Annual Report 2011 / Notes
- Page 196 and 197:
196Snam Annual Report 2011 / Notes
- Page 198 and 199:
198Snam Annual Report 2011 / Notes
- Page 200 and 201:
200Snam Annual Report 2011 / Notes
- Page 202 and 203:
202Snam Annual Report 2011 / Notes
- Page 204 and 205:
204Snam Annual Report 2011 / Notes
- Page 206 and 207:
206Snam Annual Report 2011 / Notes
- Page 208 and 209:
208Snam Annual Report 2011 / Notes
- Page 210 and 211:
210Snam Annual Report 2011 / Notes
- Page 212 and 213:
212Snam Annual Report 2011 / Notes
- Page 214 and 215:
214Snam Annual Report 2011 / Notes
- Page 216 and 217:
216Independent auditors’ reportSn