Annual Report 2011 - Snam
Annual Report 2011 - Snam
Annual Report 2011 - Snam

You also want an ePaper? Increase the reach of your titles
YUMPU automatically turns print PDFs into web optimized ePapers that Google loves.
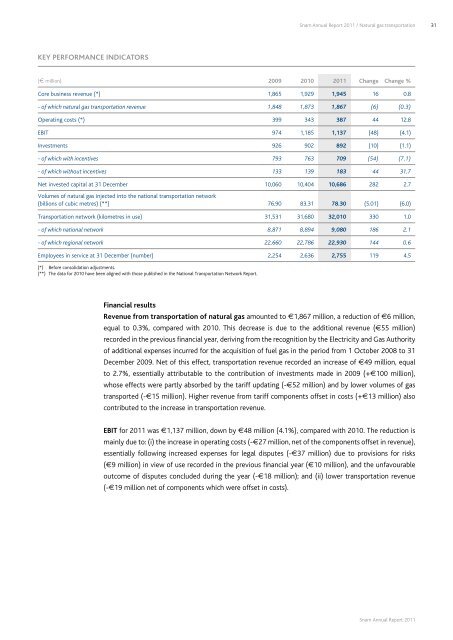
<strong>Snam</strong> <strong>Annual</strong> <strong>Report</strong> <strong>2011</strong> / Natural gas transportation31Key performance indicators(€ million) 2009 2010 <strong>2011</strong> Change Change %Core business revenue (*) 1,865 1,929 1,945 16 0.8- of which natural gas transportation revenue 1,848 1,873 1,867 (6) (0.3)Operating costs (*) 399 343 387 44 12.8EBIT 974 1,185 1,137 (48) (4.1)Investments 926 902 892 (10) (1.1)- of which with incentives 793 763 709 (54) (7.1)- of which without incentives 133 139 183 44 31.7Net invested capital at 31 December 10,060 10,404 10,686 282 2.7Volumes of natural gas injected into the national transportation network(billions of cubic metres) (**) 76.90 83.31 78.30 (5.01) (6.0)Transportation network (kilometres in use) 31,531 31,680 32,010 330 1.0- of which national network 8,871 8,894 9,080 186 2.1- of which regional network 22,660 22,786 22,930 144 0.6Employees in service at 31 December (number) 2,254 2,636 2,755 119 4.5(*) Before consolidation adjustments.(**) The data for 2010 have been aligned with those published in the National Transportation Network <strong>Report</strong>.Financial resultsRevenue from transportation of natural gas amounted to €1,867 million, a reduction of €6 million,equal to 0.3%, compared with 2010. This decrease is due to the additional revenue (€55 million)recorded in the previous financial year, deriving from the recognition by the Electricity and Gas Authorityof additional expenses incurred for the acquisition of fuel gas in the period from 1 October 2008 to 31December 2009. Net of this effect, transportation revenue recorded an increase of €49 million, equalto 2.7%, essentially attributable to the contribution of investments made in 2009 (+€100 million),whose effects were partly absorbed by the tariff updating (-€52 million) and by lower volumes of gastransported (-€15 million). Higher revenue from tariff components offset in costs (+€13 million) alsocontributed to the increase in transportation revenue.EBIT for <strong>2011</strong> was €1,137 million, down by €48 million (4.1%), compared with 2010. The reduction ismainly due to: (i) the increase in operating costs (-€27 million, net of the components offset in revenue),essentially following increased expenses for legal disputes (-€37 million) due to provisions for risks(€9 million) in view of use recorded in the previous financial year (€10 million), and the unfavourableoutcome of disputes concluded during the year (-€18 million); and (ii) lower transportation revenue(-€19 million net of components which were offset in costs).<strong>Snam</strong> <strong>Annual</strong> <strong>Report</strong> <strong>2011</strong>