Annual Report 2011 - Snam
Annual Report 2011 - Snam
Annual Report 2011 - Snam

You also want an ePaper? Increase the reach of your titles
YUMPU automatically turns print PDFs into web optimized ePapers that Google loves.
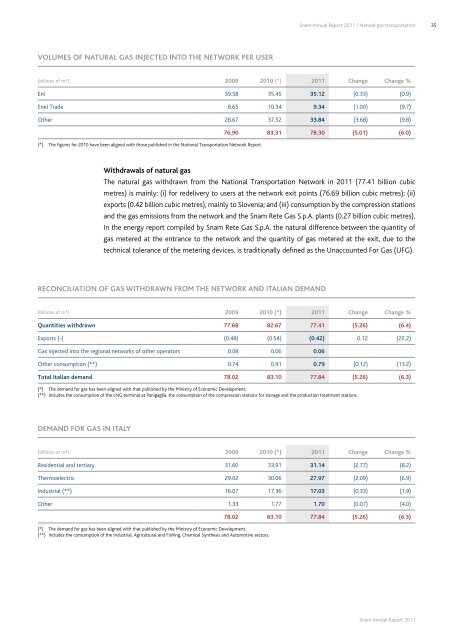
<strong>Snam</strong> <strong>Annual</strong> <strong>Report</strong> <strong>2011</strong> / Natural gas transportation35Volumes of natural gas injected into the network per user(billions of m³) 2009 2010 (*) <strong>2011</strong> Change Change %Eni 39.58 35.45 35.12 (0.33) (0.9)Enel Trade 8.65 10.34 9.34 (1.00) (9.7)Other 28.67 37.52 33.84 (3.68) (9.8)76.90 83.31 78.30 (5.01) (6.0)(*) The figures for 2010 have been aligned with those published in the National Transportation Network <strong>Report</strong>.Withdrawals of natural gasThe natural gas withdrawn from the National Transportation Network in <strong>2011</strong> (77.41 billion cubicmetres) is mainly: (i) for redelivery to users at the network exit points (76.69 billion cubic metres); (ii)exports (0.42 billion cubic metres), mainly to Slovenia; and (iii) consumption by the compression stationsand the gas emissions from the network and the <strong>Snam</strong> Rete Gas S.p.A. plants (0.27 billion cubic metres).In the energy report compiled by <strong>Snam</strong> Rete Gas S.p.A. the natural difference between the quantity ofgas metered at the entrance to the network and the quantity of gas metered at the exit, due to thetechnical tolerance of the metering devices, is traditionally defined as the Unaccounted For Gas (UFG).Reconciliation of gas withdrawn from the Network and Italian demand(billions of m³) 2009 2010 (*) <strong>2011</strong> Change Change %Quantities withdrawn 77.68 82.67 77.41 (5.26) (6.4)Exports (-) (0.48) (0.54) (0.42) 0.12 (22.2)Gas injected into the regional networks of other operators 0.08 0.06 0.06Other consumption (**) 0.74 0.91 0.79 (0.12) (13.2)Total Italian demand 78.02 83.10 77.84 (5.26) (6.3)(*) The demand for gas has been aligned with that published by the Ministry of Economic Development.(**) Includes the consumption of the LNG terminal at Panigaglia, the consumption of the compression stations for storage and the production treatment stations.Demand for gas in Italy(billions of m³) 2009 2010 (*) <strong>2011</strong> Change Change %Residential and tertiary 31.60 33.91 31.14 (2.77) (8.2)Thermoelectric 29.02 30.06 27.97 (2.09) (6.9)Industrial (**) 16.07 17.36 17.03 (0.33) (1.9)Other 1.33 1.77 1.70 (0.07) (4.0)(*) The demand for gas has been aligned with that published by the Ministry of Economic Development.(**) Includes the consumption of the Industrial, Agricultural and Fishing, Chemical Synthesis and Automotive sectors.78.02 83.10 77.84 (5.26) (6.3)<strong>Snam</strong> <strong>Annual</strong> <strong>Report</strong> <strong>2011</strong>