10Casalegno C. – Cerruti E. – Pellicelli M. / Economia Aziendale Online 2000 Web 4 (2009) 1-35price, can also provide useful information. This ratio expresses the percentage of thecurrent share price represented by the dividend.However, these indices refer to the short-term, while the creation of value dependson long-term cash flows. On the other hand, measures that are based on stock marketevaluations, such as MVA, MBR and TSR, present problems involving stock price fluctuations,which can depend on factors outside the control of management as well asthose management can act on (specific information, for example, acquisitions or mergers).The latter measures present three problems in the interpretation of the data.1) The first problem derives from the fluctuation in the price of shares. This value isdetermined by multiplying the number of shares issued and their market price.2) The market price at any moment also expresses the valuation of the future flowof dividends (discounted at a given rate). When the market receives new informationabout the future of the company, the valuation changes.3) The information on which the market bases its valuations is the same as thatavailable to the general public or to the financial analysts (during conferences and pressreleases), but such information is not necessarily always true. The future is always uncertain;only those within the company have the means at their disposal to reduce uncertainty.In particular, MVA does not explain when the value was created, nor whether therewill be further increases in the future. MBR is calculated starting from the balancesheet. This makes the calculation easier, but it subjects the index to accounting distortions.While both MVA and MBR measure the creation of value as a comparison betweenthe market value of shareholder investments and the value of the capital shareholdershave invested at a certain date, Total Shareholder Returns determines how much shareholdershave received over a certain period of time (dividends) plus the appreciation ofshare values. TSR is important for two reasons. Above all, it expresses what is of mostinterest to investors. Secondly, it is widely used by both stock market oversight authoritiesand financial analysts. TSR is the sum of the increase in share prices and the distributeddividends over a given period of time (usually less than three years).It is easy to calculate and interpret and is not based on accounting data, and thus isnot subject to distortions due to valuation criteria. Moreover, it is not affected by thesize of the company, unlike MVA, which greatly favours large companies (Ashworth,James, 2001). Nevertheless, TSR does not express the creation of value if used alone. Itneeds to be compared with the return the investor would have obtained from an investmentof equal risk.This problem can easily be overcome by comparing over the same period the TSRof a company with that of a sample of companies with similar characteristics. The priceper share is affected by forces other than those of management alone. Experience shows
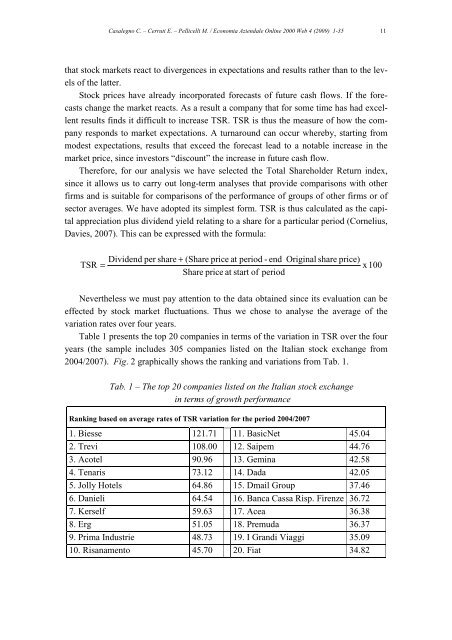
Casalegno C. – Cerruti E. – Pellicelli M. / Economia Aziendale Online 2000 Web 4 (2009) 1-35 11that stock markets react to divergences in expectations and results rather than to the levelsof the latter.Stock prices have already incorporated forecasts of future cash flows. If the forecastschange the market reacts. As a result a company that for some time has had excellentresults finds it difficult to increase TSR. TSR is thus the measure of how the companyresponds to market expectations. A turnaround can occur whereby, starting frommodest expectations, results that exceed the forecast lead to a notable increase in themarket price, since investors “discount” the increase in future cash flow.Therefore, for our analysis we have selected the Total Shareholder Return index,since it allows us to carry out long-term analyses that provide comparisons with otherfirms and is suitable for comparisons of the performance of groups of other firms or ofsector averages. We have adopted its simplest form. TSR is thus calculated as the capitalappreciation plus dividend yield relating to a share for a particular period (Cornelius,Davies, 2007). This can be expressed with the formula:TSR=Dividend per share + (Share price at period - endShare price at start of periodOriginal share price)x 100Nevertheless we must pay attention to the data obtained since its evaluation can beeffected by stock market fluctuations. Thus we chose to analyse the average of thevariation rates over four years.Table 1 presents the top 20 companies in terms of the variation in TSR over the fouryears (the sample includes 305 companies listed on the Italian stock exchange from2004/2007). Fig. 2 graphically shows the ranking and variations from Tab. 1.Tab. 1 – The top 20 companies listed on the Italian stock exchangein terms of growth performanceRanking based on average rates of TSR variation for the period 2004/20071. Biesse 121.71 11. BasicNet 45.042. Trevi 108.00 12. Saipem 44.763. Acotel 90.96 13. Gemina 42.584. Tenaris 73.12 14. Dada 42.055. Jolly Hotels 64.86 15. Dmail Group 37.466. Danieli 64.54 16. Banca Cassa Risp. Firenze 36.727. Kerself 59.63 17. Acea 36.388. Erg 51.05 18. Premuda 36.379. Prima Industrie 48.73 19. I Grandi Viaggi 35.0910. Risanamento 45.70 20. Fiat 34.82