Download this PDF file - Riviste
Download this PDF file - Riviste
Download this PDF file - Riviste

Create successful ePaper yourself
Turn your PDF publications into a flip-book with our unique Google optimized e-Paper software.
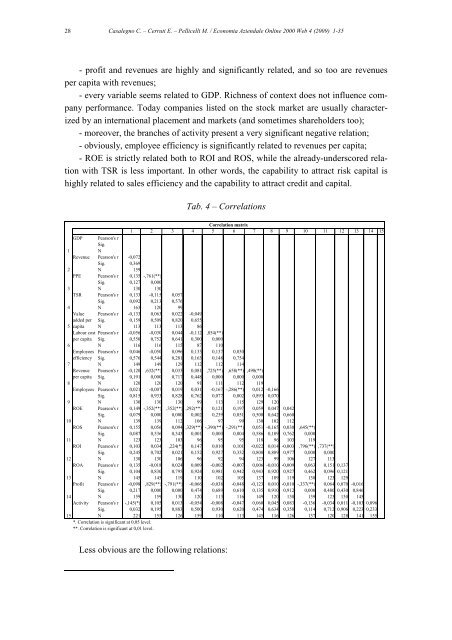
28Casalegno C. – Cerruti E. – Pellicelli M. / Economia Aziendale Online 2000 Web 4 (2009) 1-35- profit and revenues are highly and significantly related, and so too are revenuesper capita with revenues;- every variable seems related to GDP. Richness of context does not influence companyperformance. Today companies listed on the stock market are usually characterizedby an international placement and markets (and sometimes shareholders too);- moreover, the branches of activity present a very significant negative relation;- obviously, employee efficiency is significantly related to revenues per capita;- ROE is strictly related both to ROI and ROS, while the already-underscored relationwith TSR is less important. In other words, the capability to attract risk capital ishighly related to sales efficiency and the capability to attract credit and capital.Tab. 4 – CorrelationsGDP1Revenue2PPE3TSR4567Valueadded percapitaLabour costper capitaEmployeesefficiencyRevenueper capita8Employees9ROE10ROS11ROI12ROA13Profit14Activity15Correlation matrix1 2 3 4 5 6 7 8 9 10 11 12 13 14 15Pearson's rSig.NPearson's r -0,072Sig. 0,369N 159Pearson's r 0,135 -,761(**)Sig. 0,127 0,000N 130 130Pearson's r 0,133 -0,115 0,057Sig. 0,092 0,213 0,576N 163 120 99Pearson's r -0,133 0,063 0,022 -0,049Sig. 0,159 0,509 0,820 0,655N 113 113 113 86Pearson's r -0,056 -0,030 0,044 -0,112 ,854(**)Sig. 0,550 0,752 0,641 0,300 0,000N 116 116 115 87 110Pearson's r 0,046 -0,050 0,096 0,133 0,137 0,030Sig. 0,576 0,544 0,281 0,163 0,148 0,754N 149 149 129 112 112 114Pearson's r -0,120 ,632(**) 0,033 0,081 ,725(**) ,658(**) ,498(**)Sig. 0,191 0,000 0,717 0,448 0,000 0,000 0,000N 120 120 120 91 111 112 119Pearson's r 0,021 -0,007 0,019 0,031 -0,167 -,286(**) 0,012 -0,166Sig. 0,815 0,933 0,828 0,762 0,077 0,002 0,893 0,070N 130 130 130 99 113 115 129 120Pearson's r 0,149 -,352(**) ,352(**) ,292(**) 0,121 0,197 0,059 0,047 0,042Sig. 0,079 0,000 0,000 0,002 0,239 0,051 0,508 0,642 0,660N 139 139 112 106 97 99 130 102 112Pearson's r 0,155 0,056 0,094 ,329(**) -,390(**) -,291(**) 0,051 -0,165 0,030 ,645(**)Sig. 0,087 0,536 0,343 0,001 0,000 0,004 0,586 0,109 0,762 0,000N 123 123 103 96 95 95 118 96 103 119Pearson's r 0,103 0,034 ,224(*) 0,147 0,010 0,101 -0,022 0,014 -0,003 ,796(**) ,737(**)Sig. 0,245 0,702 0,021 0,152 0,927 0,332 0,808 0,889 0,977 0,000 0,000N 130 130 106 96 92 94 123 99 106 127 113Pearson's r 0,135 -0,018 0,024 0,009 -0,002 -0,007 0,006 -0,010 -0,009 0,063 0,151 0,137Sig. 0,104 0,830 0,795 0,924 0,981 0,942 0,943 0,920 0,927 0,462 0,096 0,121N 145 145 119 110 102 105 137 109 119 138 123 129Pearson's r -0,098 ,829(**) -,791(**) -0,066 -0,038 -0,048 -0,123 0,010 -0,010 -,337(**) 0,064 0,070 -0,016Sig. 0,217 0,000 0,000 0,474 0,689 0,610 0,135 0,910 0,912 0,000 0,480 0,430 0,846N 159 159 130 120 113 116 149 120 130 139 123 130 145Pearson's r -,145(*) 0,105 0,013 -0,054 -0,008 -0,047 0,060 0,045 0,083 -0,136 -0,034 0,011 -0,103 0,096Sig. 0,032 0,195 0,883 0,500 0,930 0,620 0,474 0,634 0,358 0,114 0,712 0,906 0,223 0,233N 221 155 126 159 110 113 145 116 126 137 120 128 141 155*. Correlation is significant at 0,05 level.**. Correlation is significant at 0,01 level.Less obvious are the following relations: