Regional developments in <strong>energy</strong><strong>systems</strong>, economics and climate66.1 OECD countriesPoul Erik Morthorst, Risø DTU; Dolf Gielen, IEA, ParisThe countries of the OECD2 strongly influence the developmentof <strong>energy</strong> demand and new <strong>energy</strong> supply opportunities.OECD members are generally characterised as well-developed,industrialised countries, the only exceptions beingMexico and Turkey. In the development of new renewabletechnologies such as photovoltaics, wind power and biofuels,the OECD countries are amongst the fastest, as shown byand photovoltaics in Germany, the USA and Japan. This sectionoutlines current trends in the development of <strong>energy</strong>demand and supply in the OECD countries, including themain economic and demographic drivers and policy initiatives.6.1.1 Economic and demographic developmentAmong the drivers for <strong>energy</strong> development, two of the mostbasic are economic growth and population growth. By 2004the total population of the OECD nations was close to 1,200million, or approximately 19% of the global population. Forcomparison, India and China have around 16% and 20%, respectively,of the world’s population. The population of theOECD countries has grown only modestly for many years,however, while over the last 25 years India and China haveseen average annual population growth of 1.5% and 1.2% respectively(Table 5).By 2005 the OECD’s share of global gross domestic product(GDP) was 77%, while India and China had approximately5% and 2%, respectively3. Thus, although the populations ofthese three blocs are very similar, there is still a big differencein the value of the products they manufacture, with theOECD having almost 15 times the GDP of China.As with population growth, however, economic growth inthe OECD countries has been moderate: around 2.8% annuallyon average from 1980 to 2004. In comparison, annualgrowth in India and China has been much faster, averagingalmost 6% for India and almost 10% for China in the sameperiod. Moreover, the growth rates of the mature industrialisedOECD countries are declining, while India and China– if we discount a few ups and downs of the world trade cycle– have maintained their high average growth rates for morethan 20 years. Table 1 shows the growth in population andGDP for selected economic groupings and countries.Figure 7 shows GDP (2007) per capita for selected countriesand regions. The chart clearly shows the difference in economicterms between the industrialised western countriesand the developing countries such as India and China, percapitaGDP for the USA being 20 times than of China and 45times that of India. These gaps are narrowing rapidly, however:in 2000 the USA had 33 times the per-capita GDP ofChina, so a corresponding figure of 20 in 2007 represents acatching-up by nearly 40% in seven years.6.1.2 Energy developmentIn 2005, total primary <strong>energy</strong> demand in the OECD countrieswas 5,542 Mtoe, or almost 49% of the global <strong>energy</strong>demand. The USA was the world’s main <strong>energy</strong> consumer,accounting for 20% of total demand; China’s share was 15%,Table 5Growth rates of population and GDP for selected economic groupings and countriesPopulation growth % /yOECDUSAEUJapanTransition economiesDeveloping countriesChinaIndiaBrazilWorld1980–19900.80.90.30.60.62.11.52.12.11.71990–20040.81.20.30.2–0.21.71.01.71.51.41980–19903.03.22.43.9–0.53.99.16.01.52.9Economic growth % /y1990–20042.53.02.11.3–0.85.710.15.72.63.42 Organisation for Economic Co-operation and Development. The OECD region comprises the EU member states, the USA, Canada, Japan, Aus-3 Calculated in constant USD at the 1995 exchange rate.Risø Energy Report 737
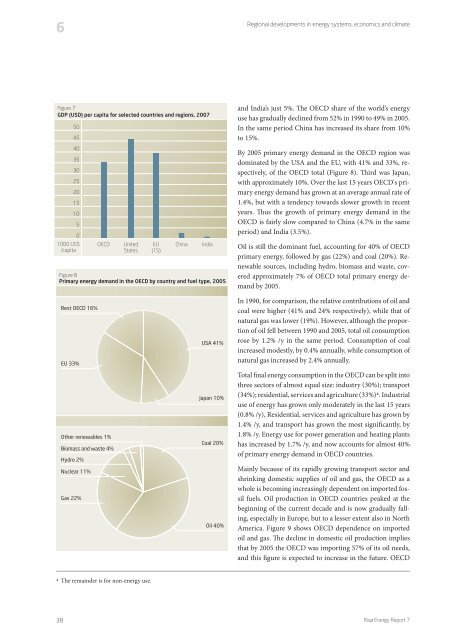
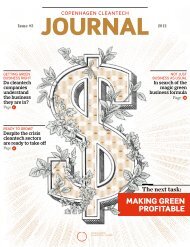
6Regional developments in <strong>energy</strong> <strong>systems</strong>, economics and climateFigure 7GDP (USD) per capita for selected countries and regions, 2007504540353025201510501000 US$/capitaOECDUnitedStatesEU(15)ChinaIndiaFigure 8Primary <strong>energy</strong> demand in the OECD by country and fuel type, 2005and India’s just 5%. The OECD share of the world’s <strong>energy</strong>use has gradually declined from 52% in 1990 to 49% in 2005.In the same period China has increased its share from 10%to 15%.By 2005 primary <strong>energy</strong> demand in the OECD region wasdominated by the USA and the EU, with 41% and 33%, respectively,of the OECD total (Figure 8). Third was Japan,with approximately 10%. Over the last 15 years OECD's primary<strong>energy</strong> demand has grown at an average annual rate of1.4%, but with a tendency towards s<strong>low</strong>er growth in recentyears. Thus the growth of primary <strong>energy</strong> demand in theOECD is fairly s<strong>low</strong> compared to China (4.7% in the sameperiod) and India (3.5%).Oil is still the dominant fuel, accounting for 40% of OECDprimary <strong>energy</strong>, fol<strong>low</strong>ed by gas (22%) and coal (20%). Renewablesources, including hydro, biomass and waste, coveredapproximately 7% of OECD total primary <strong>energy</strong> demandby 2005.Rest OECD 16%EU 33%Other renewables 1%Biomass and waste 4%Hydro 2%Nuclear 11%Gas 22%USA 41%Japan 10%Coal 20%Oil 40%In 1990, for comparison, the relative contributions of oil andcoal were higher (41% and 24% respectively), while that ofnatural gas was <strong>low</strong>er (19%). However, although the proportionof oil fell between 1990 and 2005, total oil consumptionrose by 1.2% /y in the same period. Consumption of coalincreased modestly, by 0.4% annually, while consumption ofnatural gas increased by 2.4% annually.Total final <strong>energy</strong> consumption in the OECD can be split intothree sectors of almost equal size: industry (30%); transport(34%); residential, services and agriculture (33%)4. Industrialuse of <strong>energy</strong> has grown only moderately in the last 15 years(0.8% /y), Residential, services and agriculture has grown by1.4% /y, and transport has grown the most significantly, by1.8% /y. Energy use for power generation and heating plantshas increased by 1.7% /y, and now accounts for almost 40%of primary <strong>energy</strong> demand in OECD countries.Mainly because of its rapidly growing transport sector andshrinking domestic supplies of oil and gas, the OECD as awhole is becoming increasingly dependent on imported fossilfuels. Oil production in OECD countries peaked at thebeginning of the current decade and is now gradually fall-America. Figure 9 shows OECD dependence on importedoil and gas. The decline in domestic oil production impliesthat by 2005 the OECD was importing 57% of its oil needs,and this figure is expected to increase in the future. OECD4 The remainder is for non-<strong>energy</strong> use.38Risø Energy Report 7