<strong>Future</strong> <strong>energy</strong> <strong>systems</strong> to cope withclimate and <strong>energy</strong> challenges77.1 OECD countriesPoul Erik Morthorst, Risø DTU; Dolf Gielen, IEA, ParisWe are facing serious challenges in the <strong>energy</strong> sector. Theglobal economy is set to grow fourfold between now and2050, and growth could approach ten-fold in developingcountries like China and India. This promises economicbenefits and huge improvements in people’s standards of living,but also involves much more use of <strong>energy</strong>. Unsustainablepressures on natural resources and on the environmentare inevitable if <strong>energy</strong> demand is not de-coupled from economicgrowth and fossil fuel demand reduced.A global revolution is needed in the ways that <strong>energy</strong> issupplied and used. Far greater <strong>energy</strong> efficiency is a core free technologies have to be developed. A dramatic shift isneeded in government policies, notably creating a higherlevel of long-term policy certainty over future demand for<strong>low</strong>-<strong>carbon</strong> technologies, upon which industry’s decisionmakerscan rely. Unprecedented levels of cooperation amongthe world’s major economies will also be crucial, bearing inmind that under the “business-as-usual” scenario for 2050,less than one-third of global emissions are expected to stemfrom OECD countries.Increasing concerns over climate change and security ofsupply imply that our <strong>energy</strong> <strong>systems</strong> will have to changedrastically in the future. Renewable <strong>energy</strong> sources includingwind power, photovoltaics (PV) and biofuels will need tomake significant contributions to our <strong>energy</strong> <strong>systems</strong>, alongsidetraditional sources such as coal, oil and natural gas.Renewable <strong>energy</strong> technologies such as wind power and PVare characterised by inherent variability of production. Thiswill increase the complexity of future <strong>energy</strong> <strong>systems</strong>, andintroduce the need for advanced features including demandresponse, regulation and storage. This in turn calls for advancedmodelling techniques to support decisions on how todevelop future <strong>energy</strong> <strong>systems</strong>. Most of these decisions willhave consequences lasting for 30–40 years or even longer, soit is of the utmost importance that they are based on soundreasoning and accurate calculations.Modelling <strong>energy</strong> <strong>systems</strong> over large regions of the world isa complicated matter, so only a limited number of <strong>energy</strong>studies and models exist. Some of the more important onesare the World Energy Outlook and the Energy TechnologyPerspectives undertaken by the IEA; the long-term scenariosreported by the Intergovernmental Panel on Climate Change(IPCC); the studies prepared by the World Energy Council(WEC); and work carried out in relation to European Unionpolicy. For this Energy Report we have chosen to focus onthe IEA Energy Technology Perspectives because of its timelinessand long-term view.7.1.1 Energy Technology PerspectivesEnergy Technology Perspectives (ETP 2008) [1] is an indepthreview of the status of, and outlook for, existing andadvanced clean <strong>energy</strong> technologies. It draws on modellingwork within the IEA Secretariat and expertise from the IEA’sinternational <strong>energy</strong> technology collaboration network. ETP2008 is a companion to the IEA’s World Energy Outlook 2007[2], taking that publication’s reference (“baseline”) scenarioand extending it from 2030 to 2050.ETP 2008 presents several different sets of scenarios. The“ACT” scenario shows how global CO2 emissions could bebrought back to current levels by 2050, while the “BLUE”scenario targets a 50% reduction in CO2 emissions by 2050.Only the BLUE scenario will be described here.The main assumptions of the BLUE scenario are:2005 to 2050. OECD population is assumed to grow by0.2% /y in the same period, reflecting continued growthin the OECD Pacific region2005 to 2050. The main growth will be in developing Asia, with approximately 5.2% /y in China andIndia. Growth in the OECD is assumed to average 1.9%est in JapanOil import prices in the baseline scenario are consistent withthe World Energy Outlook Reference Scenario: a crude oilprice of USD 62–65 bbl and a natural gas price of approximatelyUSD 8/MBtu in 2030–2050 (constant-2006 prices).BLUE assumes <strong>low</strong>er oil prices, but this is more than compensatedfor by a CO2 incentive of USD 200/t CO2, giving aneffective oil price of USD 80/bbl.Reducing CO2 emissions by 50% by 2050 is a tough challengethat implies a very rapid change of direction. Costs arenot only substantially higher, but also much more uncertain,because BLUE demands the deployment of technologies thatare still under development, and whose progress and ultimatesuccess are therefore hard to predict. BLUE requiresurgent implementation of unprecedented and far-reachingnew policies in the <strong>energy</strong> sector.Risø Energy Report 751
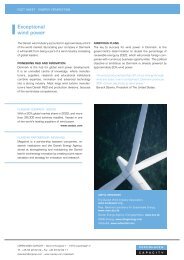
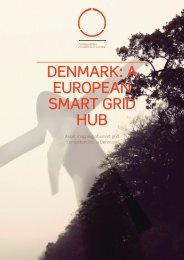
7<strong>Future</strong> <strong>energy</strong> <strong>systems</strong> to cope with climate and <strong>energy</strong> challengesFigure 16 shows how the marginal costs of CO2 abatementincrease as the targeted CO2 savings increase. For BLUE, thefigure is at least USD 200 per tonne of CO2 saved, and itcould be as high as USD 500 if the progress of key technologiesis disappointing. The blue area indicates the cost range,bounded by optimistic and pessimistic technology assumptions.Figure 16Marginal CO ² abatement cost curve, 2050 [1]1000Managerial cost (USD/t CO ² )Transport alternative fuels800600400Industry fuel switching and CCS500BLUEMap200Power sector100 200End-use efficiencyACT0Map50-2000 5 10 15 20 25 30 35 40 452050 CO ² emissions reduction (Gt CO ² /yr)As well as their environmental benefits, the ACT and BLUEscenarios also show a more balanced outlook for oil markets.Under ACT, demand for oil continues to grow, but theforecast increase of 12% between now and 2050 is much lessthan in the business-as-usual scenario. BLUE shows a muchmore marked difference, with oil demand 27% less in 2050than it is today. However, this does not greatly reduce shortandmedium-term investment needs in fossil-fuel supply. Allthe scenarios predict that massive investments in fossil-fuelsupply will be needed in the coming decades.Energy efficiency improvements in buildings, appliances,transport, industry and power generation represent the larg-tancecome measures to substantially de<strong>carbon</strong>ise powergeneration. This can be achieved through a combination ofrenewables, nuclear power, and the use of <strong>carbon</strong> captureand storage (CCS) at fossil-fuel plants. Whichever the finaltarget, action in all these areas is urgent and necessary.It is particularly important to avoid becoming locked intoinefficient technologies for decades to come. The BLUE scenariorequires higher-cost options including the industrysectorapplication of CCS, and alternative transport fuels.Figure 17 shows the sources of CO2 savings in BLUE comparedto the baseline scenario. Policymakers should rememberthat long lead times are frequently required to implementchanges and that priorities in each country will varyaccording to national circumstances. Moreover, reducingmethane emissions in the <strong>energy</strong> sector is also an importantpart of an overall climate change strategy, as these emissionsoffer important opportunities for near-term and cost-effectivegreenhouse gas reduction.CCS for power generation and industry is the most importantsingle new technology for CO2 savings in both ACT andBLUE, in which it accounts for 14% and 19% of total CO2savings, respectively. BLUE includes higher-cost applicationsof CCS for industry and gas-fired power stations. There is amassive switch to renewables for power generation, especiallyto wind, PV, concentrating solar and biomass, so thatby 2050, 46% of global power in the BLUE scenario comesfrom renewables. Renewable technologies across all sectorsaccount for 21% of the CO2 savings in the BLUE scenarioagainst the baseline scenario. A substantial switch to nuclearcontributes 6% of CO2 savings, based on the constructionof 32 GW of capacity each year between now and 2050. tionin BLUE, and hydro for half as much, building on theimportant role both technologies already play in the baselinescenario.Figure 17Emission reductions under the BLUE scenario, 2050 [1]706050403020100 WEO 2007 450 ppm case EPT 2008 BLUE Map scenario2005 2010 2015 2020 2025 2030 2035 2040 2045CO ² emissions (Gt CO ² /yr)CCS industry and transformation 9%CCS power generation 10%Nuclear 6%Renewables 21%Power generation efficiency& fuel switching 7%End-use fuel switching 11%End-use electricity efficiency 2%End-use fuel efficiency 24%The report’s broad range of options for power generationshows that there is considerable flexibility for individualcountries to choose which precise mix of CCS, renewablesand nuclear technology they will use to de<strong>carbon</strong>ise theirpower sectors.The BLUE scenario is very challenging for the transport sector:significant de<strong>carbon</strong>isation of transport, which has hithertobeen dominated by the internal combustion engine, islikely to be much more costly than in sectors such as powergeneration. BLUE assumes that advanced biofuels will playa significant role, within the limits of sustainable production52Risø Energy Report 7