Future low carbon energy systems - Copenhagen Cleantech Cluster
Future low carbon energy systems - Copenhagen Cleantech Cluster
Future low carbon energy systems - Copenhagen Cleantech Cluster

Create successful ePaper yourself
Turn your PDF publications into a flip-book with our unique Google optimized e-Paper software.
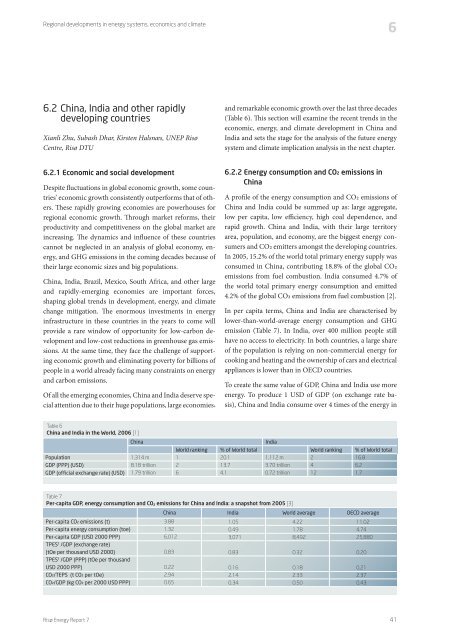
Regional developments in <strong>energy</strong> <strong>systems</strong>, economics and climate66.2 China, India and other rapidlydeveloping countriesXianli Zhu, Subash Dhar, Kirsten Halsnæs, UNEP RisøCentre, Risø DTUand remarkable economic growth over the last three decades(Table 6). This section will examine the recent trends in theeconomic, <strong>energy</strong>, and climate development in China andIndia and sets the stage for the analysis of the future <strong>energy</strong>system and climate implication analysis in the next chapter.6.2.1 Economic and social developmentDespite fluctuations in global economic growth, some countries’economic growth consistently outperforms that of others.These rapidly growing economies are powerhouses forregional economic growth. Through market reforms, theirproductivity and competitiveness on the global market areincreasing. The dynamics and influence of these countriescannot be neglected in an analysis of global economy, <strong>energy</strong>,and GHG emissions in the coming decades because oftheir large economic sizes and big populations.China, India, Brazil, Mexico, South Africa, and other largeand rapidly-emerging economies are important forces,shaping global trends in development, <strong>energy</strong>, and climatechange mitigation. The enormous investments in <strong>energy</strong>infrastructure in these countries in the years to come willprovide a rare window of opportunity for <strong>low</strong>-<strong>carbon</strong> developmentand <strong>low</strong>-cost reductions in greenhouse gas emissions.At the same time, they face the challenge of supportingeconomic growth and eliminating poverty for billions ofpeople in a world already facing many constraints on <strong>energy</strong>and <strong>carbon</strong> emissions.Of all the emerging economies, China and India deserve specialattention due to their huge populations, large economies,6.2.2 Energy consumption and CO ² emissions inChinaA profile of the <strong>energy</strong> consumption and CO2 emissions ofChina and India could be summed up as: large aggregate,<strong>low</strong> per capita, <strong>low</strong> efficiency, high coal dependence, andrapid growth. China and India, with their large territoryarea, population, and economy, are the biggest <strong>energy</strong> consumersand CO2 emitters amongst the developing countries.In 2005, 15.2% of the world total primary <strong>energy</strong> supply wasconsumed in China, contributing 18.8% of the global CO2emissions from fuel combustion. India consumed 4.7% ofthe world total primary <strong>energy</strong> consumption and emitted4.2% of the global CO2 emissions from fuel combustion [2].In per capita terms, China and India are characterised by<strong>low</strong>er-than-world-average <strong>energy</strong> consumption and GHGemission (Table 7). In India, over 400 million people stillhave no access to electricity. In both countries, a large shareof the population is relying on non-commercial <strong>energy</strong> forcooking and heating and the ownership of cars and electricalappliances is <strong>low</strong>er than in OECD countries.To create the same value of GDP, China and India use more<strong>energy</strong>. To produce 1 USD of GDP (on exchange rate basis),China and India consume over 4 times of the <strong>energy</strong> inTable 6China and India in the World, 2006 [1]ChinaPopulationGDP (PPP) (USD)GDP (official exchange rate) (USD)1,314 m8.18 trillion1.79 trillionWorld ranking126% of World total20.113.74.1India1,112 m3.70 trillion0.72 trillionWorld ranking2412% of World total16.86.21.7Table 7Per-capita GDP, <strong>energy</strong> consumption and CO ²emissions for China and India: a snapshot from 2005 [3]China India World average OECD averagePer-capita CO ² emissions (t)Per-capita <strong>energy</strong> consumption (toe)Per-capita GDP (USD 2000 PPP)TPES¹ /GDP (exchange rate)(tOe per thousand USD 2000)TPES¹ /GDP (PPP) (tOe per thousandUSD 2000 PPP)CO ² /TEPS (t CO ² per tOe)CO ² /GDP (kg CO ² per 2000 USD PPP)3.881.326,0120.830.222.940.651.050.493,0710.830.162.140.344.221.788,4920.320.182.330.5011.024.7425,8800.200.212.370.43Risø Energy Report 741