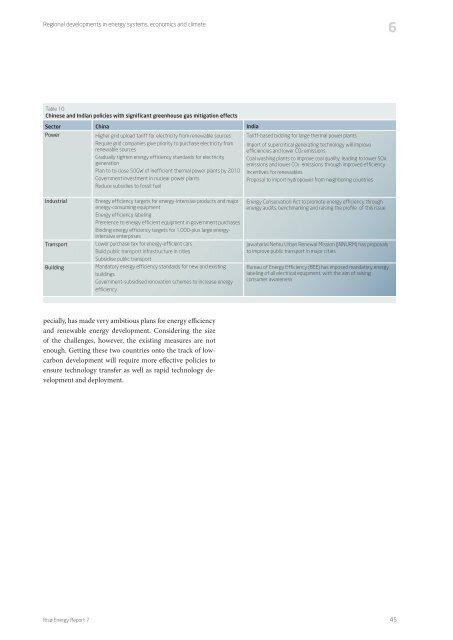
Regional developments in <strong>energy</strong> <strong>systems</strong>, economics and climate6Table 10Chinese and Indian policies with significant greenhouse gas mitigation effectsSectorPowerChinaHigher grid upload tariff for electricity from renewable sourcesRequire grid companies give priority to purchase electricity fromrenewable sourcesGradually tighten <strong>energy</strong> efficiency standards for electricitygenerationPlan to to close 50GW of inefficient thermal power plants by 2010Government investment in nuclear power plantsReduce subsidies to fossil fuelIndiaTariff-based bidding for large thermal power plantsImport of supercritical generating technology will improveefficiencies and <strong>low</strong>er CO ² emissionsCoal washing plants to improve coal quality, leading to <strong>low</strong>er SOxemissions and <strong>low</strong>er CO ² emissions through improved efficiencyIncentives for renewablesProposal to import hydropower from neighboring countriesIndustrialTransportBuildingEnergy efficiency targets for <strong>energy</strong>-intensive products and major<strong>energy</strong>-consuming equipmentEnergy efficiency labelingPrererence to <strong>energy</strong> efficient equipment in government purchasesBinding <strong>energy</strong> efficiency targets for 1,000-plus large <strong>energy</strong>intensiveenterprisesLower purchase tax for <strong>energy</strong>-efficient carsBuild public transport infrastructure in citiesSubsidise public transportMandatory <strong>energy</strong> efficiency standards for new and existingbuildingsGovernment-subsidised renovation schemes to increase <strong>energy</strong>efficiencyEnergy Conservation Act to promote <strong>energy</strong> efficiency through<strong>energy</strong> audits, benchmarking and raising the profile of this issueJawaharlal Nehru Urban Renewal Mission (JNNURM) has proposalsto improve public transport in major citiesBureau of Energy Efficiency (BEE) has imposed mandatory <strong>energy</strong>labeling of all electrical equipment, with the aim of raisingconsumer awarenesspecially, has made very ambitious plans for <strong>energy</strong> efficiencyand renewable <strong>energy</strong> development. Considering the sizeof the challenges, however, the existing measures are notenough. Getting these two countries onto the track of <strong>low</strong><strong>carbon</strong>development will require more effective policies toensure technology transfer as well as rapid technology developmentand deployment.Risø Energy Report 745
6Regional developments in <strong>energy</strong> <strong>systems</strong>, economics and climate6.3 AfricaIvan Nygaard, Gordon Mackenzie and Said Abdallah, UNEPRisø Centre, Risø DTU; Peter Zhou, EECG, BotswanaMost of the nations of sub-Saharan Africa (SSA), with thenotable exceptions of South Africa and a few others, fall intothe category of “least developed countries” (LDCs), typicallywith per-capita GDP be<strong>low</strong> USD 2,000. Table 11 showskey indicators for some selected LDCs.LDCs are characterised by industrial sectors that provideonly a small proportion of GDP. Although the contributionof agriculture to GDP also appears <strong>low</strong>, most people in thesecountries depend largely on agriculture for survival. Povertylevels—the fraction of people with an income be<strong>low</strong> 1 USDper day—are in general above 40%. While provision of basicservices like clean water and sanitation is improving in manyLDCs, access to modern forms of <strong>energy</strong> like electricity andgas remains extremely <strong>low</strong>.The <strong>low</strong> level of economic development determines the <strong>low</strong>level of <strong>energy</strong> consumption, and also the forms of <strong>energy</strong>used (Table 12). Sub-Saharan Africa has one of the world’s<strong>low</strong>est per-capita consumption rates of modern <strong>energy</strong>, andeven this is declining, since the rate of electrification cannotkeep pace with population increase. The <strong>low</strong> level of electrificationis due to a number of factors including poverty ingeneral, a highly-dispersed rural population, a <strong>low</strong> degree ofindustrialisation, a historically inefficient <strong>energy</strong> sector, anddifficulties in accessing capital to finance the development ofmodern <strong>energy</strong> sources [3].For LDCs throughout this region the major part of <strong>energy</strong> isused in households as Table 13 shows. By far the largest partof this <strong>energy</strong> is used for cooking and comes from traditionalbiomass such as firewood, charcoal and agricultural waste,which supplies as much as 95% of all <strong>energy</strong> consumed insome countries, and an average of 81% for the whole SSAregion.The major developmental challenges for all the countriesin the region may be expressed in terms of the MillenniumDevelopment Goals (MDGs). Although there is no specificTable 11Key indicators for selected LDCs of sub-Saharan Africa. Gross Domestic Product (GDP) is expressed in Purchasing Power Parity (PPP).(Africa Economic Outlook, [1] (all except electricity access), World Energy Outlook [2] (electricity access data); assuming a 70/30 rural/urban population split)CountryBurkina FasoMozambiqueZambiaTanzaniaPopulation (m)13.620.211.939.0GDP per capita(USD, PPP)1,3141,9571,167594Access toelectricity(%)76.31911Accessto cleanwater (%)88.3406259.8Access tosanitation(%)9.93427Literacy(%)12.869.4GDP contributionfrom industry (miningand manufacturing) (%)15.913.714.29.6GDP contributionfrom agriculture(%)17.921.49.617.9Table 12Primary <strong>energy</strong> consumption of selected LDCs in SSA in 2005(International Energy Agency [4]; data from Burkina Faso is from 2004 [5]; generating capacity is from SADC [6] and MMCE [7])CountryBurkina FasoMozambiqueZambiaTanzaniaTotal primary<strong>energy</strong> consumption(ktoe)3,05410,2077,12420,404Biomass (%)85.485.478.792.1Coal (%)1.30.2Oil and gas(%)14.05.49.56.9Other(renewable)(%)0.311.210.70.7Electricity importsas a fraction of totalprimary <strong>energy</strong> (%)0.3–2.0–0.20.1Electricity generatingcapacity (2002) (MW)1362,3881,778881Electricityconsumption(GWh/y)5469,1432,256Table 13Sectoral <strong>energy</strong> split in selected LDCs in SSA in 2005(percentage of total final <strong>energy</strong> consumption) (International Energy Agency [4]; data from Burkina Faso is from 2004 [5])CountryHouseholds IndustryAgriculture Commerce,service sectorTransportOtherBurkina FasoMozambiqueZambiaTanzania81.878.066.779.510.117.124.110.30.34.40.70.41.76.84.46.32.50.50.10.83.346Risø Energy Report 7