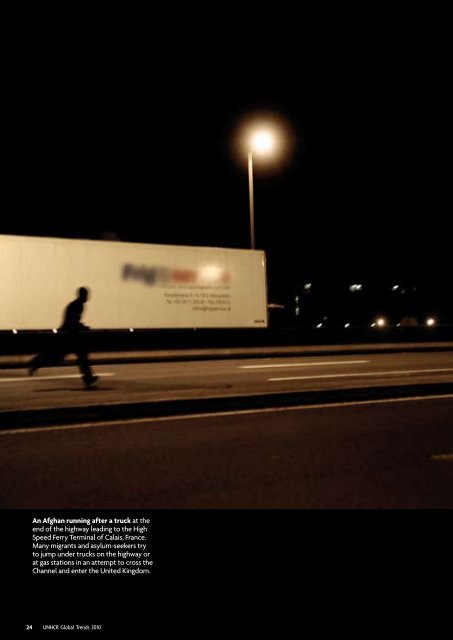
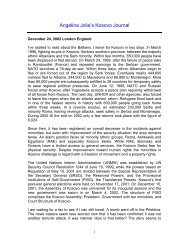
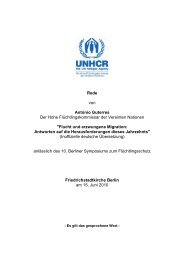
An Afghan running after a truck at theend of the highway leading to the HighSpeed Ferry Terminal of Calais, France.Many migrants and asylum-seekers tryto jump under trucks on the highway orat gas stations in an attempt to cross theChannel and enter the United Kingdom.24 <strong>UNHCR</strong> Global Trends <strong>20</strong>10
VIAsylum-seekersThe following sections present some of the main trends related to asylum applications which havebeen lodged on an individual basis. They do not include mass refugee inflows nor do they makereference to people who have been accorded refugee status on a prima facie basis.© M. DepardonDuring <strong>20</strong>10, at least845,800 (26) individual applicationsfor asylum or refugeestatus were submitted toGovernments or <strong>UNHCR</strong>offices in 166 countries or territories.This constitutes an 11 per cent decreasecompared to the previous year (948,400claims) and the first drop after threeconsecutive annual increases. Thisdevelopment is in line with the oneobserved in industrialized countriesin <strong>20</strong>10 where the number of asylumapplications dropped as well. (27) Out ofthe provisional total of 845,800 asylumclaims, an estimated 729,100 were initialapplications (28) lodged in first instanceprocedures whereas the remaining86,700 claims were submitted on appealor with courts. (29)<strong>UNHCR</strong> offices registered some96,800 applications out of the provisionaltotal of 845,800 claims in <strong>20</strong>10,about 22,300 less than in <strong>20</strong>09 (119,100claims). The Office’s share in the globalnumber of applications registered stoodat 11 per cent in <strong>20</strong>10 compared to 13 percent in <strong>20</strong>09.New individual asylumapplications receivedWith 180,600 asylum claims registeredin <strong>20</strong>10, South Africa was for the thirdyear running the main destination fornew asylum-seekers worldwide. Assuch, it also accounted for one fifth ofindividual applications globally. However,the <strong>20</strong>10 figure was 19 per centlower than in <strong>20</strong>09 (222,300 claims) butstill four times more compared to <strong>20</strong>07when 45,600 individuals had sought internationalprotection. Similar to previousyears, Zimbabweans accounted forthe vast majority of all claims submittedin <strong>20</strong>10 (146,600 applications or 81 percent).The United States of America receivedless than one third of the numberof claims as South Africa, but was neverthelessin second position with anestimated 54,300 applications. (30) Thenumber of new asylum claims lodgedin the United States of America wentTABLE 226 Owing to the fact that some European countries havenot yet released national asylum data at the time of writing,this figure is likely to be revised upwards later this year.27 For a detailed analysis of asylum trends inindustrialized countries, see Asylum Levels and Trends inIndustrialized Countries, <strong>20</strong>10, <strong>UNHCR</strong> Geneva, March<strong>20</strong>11, available at: http://www.unhcr.org/4d8c5b109.html.28 Despite the fact that statistical reporting on newasylum-seekers has improved in recent years, in particularin Europe, it should be borne in mind that the data includea significant number of repeat claims, i.e. the applicantsubmitted at least one previous application in the same oranother country.29 Statistical information on outcomes of asylum appealsand court proceedings is under-reported in <strong>UNHCR</strong>statistics, particularly in developed countries, because thistype of data is often either not collected by States or notpublished separately.30 Estimated number of individuals based on the numberof new cases (28,440) and multiplied by 1.4 to reflect theaverage number of individuals per case (Source: U.S.Department of Homeland Security); and number of new“defensive” asylum requests lodged with the U.S. ExecutiveOffice of Immigration Review (14,500, reported byindividuals).New and appeal applications received<strong>20</strong>08 <strong>20</strong>09 <strong>20</strong>10 (a)State (b) 765,800 803,300 742,800<strong>UNHCR</strong> 73,400 119,100 96,800Jointly (c) (d) 36,100 26,000 6,<strong>20</strong>0Total 875,300 948,400 845,800% <strong>UNHCR</strong> only 8% 13% 11%a Provisional.b Includes revised estimates.c Refers to refugee status determination conducted jointlybetween <strong>UNHCR</strong> and the Government.d The <strong>20</strong>10 figure excludes Eritrean asylum-seekers in Ethiopia who were granted refugeestatus on a prima facie basis. In previous years, this group has accounted for some <strong>20</strong>,000asylum applications per year.<strong>UNHCR</strong> Global Trends <strong>20</strong>1025