New Researches in Biotechnology - Facultatea de Biotehnologii ...
New Researches in Biotechnology - Facultatea de Biotehnologii ...
New Researches in Biotechnology - Facultatea de Biotehnologii ...
- No tags were found...

You also want an ePaper? Increase the reach of your titles
YUMPU automatically turns print PDFs into web optimized ePapers that Google loves.
UNIVERSITY OF AGRONOMICAL SCIENCES AND VETERINARYMEDICINE BUCHARESTSCIENTIFIC BULLETINSeries FXVBIOTECHNOLOGYProceed<strong>in</strong>gs of the 4 th International Symposium“<strong>New</strong> <strong>Researches</strong> <strong>in</strong> <strong>Biotechnology</strong>” SimpBTH2011ISSN 1224-7774BUCHAREST2011
Proceed<strong>in</strong>g of the 4 rd International Symposium“NEW RESEARCH IN BIOTECHNOLOGY” USAMV Bucharest, Romania, 2011ORGANIZERS:FACULTY OF BIOTECHNOLOGYCENTER OF MICROBIAL BIOTECHNOLOGY BIOTEHGENSPONSORSDEXTER COM2
Proceed<strong>in</strong>g of the 4 rd International Symposium“NEW RESEARCH IN BIOTECHNOLOGY” USAMV Bucharest, Romania, 2011SCIENTIFIC COMMITTEEProf. Dr. Petru Niculita, Dean, Faculty of <strong>Biotechnology</strong>, USAMV Bucharest,RomaniaDr Huub Lelieveld, GHI Association Netherlands and EFFoST ExecutiveCommitteeAssoc. Prof. Dr. Crist<strong>in</strong>a Silva, ISEKI Food, Catholic University of PortugalProf. Dr. Veronika Abram, UL-BF, Biotechnical Faculty, University of Ljubljana,SloveniaProf. Dr. Gustavo Fi<strong>de</strong>l Gutierrez - Lopez, ENCB-IPN, National School ofBiological Sciences, National Polytechnic Institute, MexicoProf. Dr. Mona Elena Popa, Faculty of <strong>Biotechnology</strong>, USAMV Bucharest,RomaniaProf. Dr. Margarida Vieira, Directora do Dep. <strong>de</strong> Engenharia Alimentar, InstitutoSuperior <strong>de</strong> Engenharia, Universida<strong>de</strong> do Algarve, PortugalPhD Estela <strong>de</strong> Oliveira Nunes, Santa Catar<strong>in</strong>a West University - UNOESCBiotechnological Nucleus, BrazilPhD Dumoul<strong>in</strong> Elisabeth, AgroParisTech Institut <strong>de</strong>s Sciences et Industries duVivant et <strong>de</strong> l'Environement, FranceSenior Lecturer Dr. Lynn McIntyre, Food Microbiology, Harper AdamsUniversity College Edgmond, <strong>New</strong>port, United K<strong>in</strong>gdomProf. Dr. Constant<strong>in</strong> Stirbu, Institute Pasteur, Bucharest, RomaniaDr. Helmut Glattes, ICC Austria, ISEKI FoodProf. Dr. Gustavo V. Barbosa-Canovas, Wash<strong>in</strong>gton State University Pullman,State of Wash<strong>in</strong>gton, USA3
Proceed<strong>in</strong>g of the 4 rd International Symposium“NEW RESEARCH IN BIOTECHNOLOGY” USAMV Bucharest, Romania, 2011Prof. Dr. Paulo Jose do Amaral Sobral, Depto <strong>de</strong> Eng. <strong>de</strong> Alimentos - FZEA -USP, Pirassununga, BrazilProf. Dr. Ingrid Bauman, Faculty of Food Technology and <strong>Biotechnology</strong>,Zagreb, CroatiaPhD Kather<strong>in</strong>e Flynn, European Association for Food Safety, Brussels, BelgiumAssoc. Prof. Dr. Paola Pittia, Dipartimento di Scienze <strong>de</strong>gli Alimenti, Universita<strong>de</strong>gli Studi di Teramo, ItalyORGANIZING COMMITTEE - Faculty of <strong>Biotechnology</strong>, USAMVBLecturer Dr. Florent<strong>in</strong>a MateiProfessor Dr. Mona Elena PopaLecturer Dr. Mioara VargaAssistant Dr. Mihaela Ghidurus PanagopoulouAssistant Dr. Mira TurtoiAssistant Dr. Mihaela GeicuAssistant Dr. Radu TomaBogdan Matei4
Proceed<strong>in</strong>g of the 4 rd International Symposium“NEW RESEARCH IN BIOTECHNOLOGY” USAMV Bucharest, Romania, 2011CONTENTSECTION I: AGRICULTURAL BIOTECHNOLOGYISOPEROXIDASE PROFILES IN SOYBEAN IN VITRO CULTURES UNDEROSMOTIC STRESSGeorg<strong>in</strong>a Kosturkova, Georgi Angelov, Margarita Dimitrova, Krasimira TashevaAN ANALYSIS OF THE EFFECT OF TEMPERATURE ON THE QUANTITY OF BTTOXIN IN COTTON VARIETIESMUHAMMAD SAJJAD ALIi, INTEZAR ALIA MODEL POST COMMERCIALIZATION MONITORING FRAMEWORK FOR BTCOTTON IN PAKISTANMUHAMMAD SAJJAD ALIi, INTEZAR ALIINVESTIGATION OF NEW AGRICULTURAL DECISIONS FOR THEMAINTENANCE OF THE SOIL FERTILITY OF THE VERTISOILIvan Dimitrov, Totka Mitova, Svilen Rajkov, Daf<strong>in</strong>a Nikolova, Stajka StratievaTECHNOLOGICAL EVALUATION OF THE USED SIDERATES WITH ANALTERNATIVE BIOTECHNOLOGICAL METHOD OF RE-CULTIVATIONIvan Dimitrov, Totka Mitova, Svilen Raykov, Ivan PachevSTUDY OF THE SEED MICRO FLORA IN WHEAT AND BARLEY GROWN INENVIRONMENTALLY FRIENDLY CONDITIONSMARIELA GEORGIEVA-ANDREEVA, SVILEN RAYKOV, KRASIMIRA TANOVAEFFECT OF DIRECT ALTERNATING CURRENT STIMULATION ON VIRUS –ELIMINATION IN GRAPEVINEIonela Cătăl<strong>in</strong>a Guţă, Elena-Cocuţa Buciumeanu, Benedict Oprescu, Lav<strong>in</strong>ia TătaruEFFECT OF INORGANIC NITROGEN NUTRITION ON IN VITRO PRODUCTION OFPOTATO MICROTUBERSAndreea NISTOR, Nicoleta CHIRU, Carmen BĂDĂRĂUIN VITRO CONSERVATION BY SLOW GROWTH OF ARNICA MONTANAMariya PETROVA, Ely ZAYOVA, Luba EVSTATIEVAINFLUENCE OF PRE-SOWING TREATMENT OF SORGHUM SEEDS WITHMICROELEMENTS ON THE GERMINATION AND GROWTH OF PLANTS IN THEINITIAL STAGES OF THEIR DEVELOPMENTSVILEN RAYKOV, MARIELA ANDREEVA, MILENA SIMEONOVAPageNo.8151925323640495461SECTION III: FOOD BIOTECHNOLOGYEVALUATION OF INULIN GELLING PROPERTIES IN NEW TYPES JELLIESMAIJA KRONBERGA, DAINA KARKLINA, DACE KLAVAGENETICALLY MODIFIED FOODPopescu DanPHYSICAL-CHEMICAL PROPERTIES OF MONASCUS METABOLITESNicoleta Radu, Yianis Kourkoutas, Mariana Fer<strong>de</strong>sTHE EFFECT OF PREPARATES BASED ON SODIUM CARBONATE AND CITRICACID ON THE PARAMETER FALLING NUMBER IN HYPERDIASTAZIC FLOURSTAMBA-BEREHOIU R., POPESCU S., POPA C. N.INFLUENCE OF THE CULTURE MEDIUM ON TORULARHODIN PIGMENTBIOSYNTHESIS68758090955
Proceed<strong>in</strong>g of the 4 rd International Symposium“NEW RESEARCH IN BIOTECHNOLOGY” USAMV Bucharest, Romania, 2011Camelia UNGUREANU, Mariana FERDESTHE MATHEMATICAL MODELING IN OPTIMIZATION OF REFRIGERATIONPROCESSMioara Varga, Mira Turtoi, Mihaela GhidurusSTUDY METHODS TO EXTRACTION OF PHENOLIC COMPOUNDS IN THEPROCESS OF OBTAINING ROSE WINES WITH STABLE CHROMATICCHARACTERISTICSVISAN LUMINITASTUDY OF FACTORS EVENT INFLUENCING THE QUALITY OF RED WINESVISAN LUMINITA, DANAILA SILVANA, RADU TOMA103110115SECTION IV: INDUSTRIAL AND ENVIRONMENTAL BIOTECHNOLOGYMOLASSES INFLUENCE ON THE EFFICIENCY OF INDUSTRIALBIOTECHNOLOGICAL PROCESSES OF PRODUCING YEAST BIOMASSMihaela Begea, Alexandr<strong>in</strong>a Sirbu, Yannis Kourkoutas, Romulus DimaIN VITRO CULTURES OF BALKAN AND BULGARIAN ENDEMIC CENTAUREASPECIESRossen GORGOROV, Mar<strong>in</strong>a STANILOVA, Svetlana BANCHEVAEPIFLUORESCENCE MICROSCOPY AND TEM INVESTIGATIONS ON BACTERIAIN MARINE MICROCOSMSGabriel PRODAN, Ioan ARDELEAN, Simona GHITATHERAPEUTIC EFFECT OF MONASCUS METABOLITESNicoleta Radu, Sidira Marianthi, Mariana Fer<strong>de</strong>s121131138146SECTION V: FOOD SAFETYNEW PACKAGING MATERIALS AND THEIR EFFECT ON THE SHELF-LIFE OFPACKAGED SALADMariana Ionescu, Gabriel Mustatea, Valent<strong>in</strong> Ionescu, Ir<strong>in</strong>a Smeu, Giuseppe Spadaro, Z<strong>in</strong>aVulugaTHE EFFECTS OF THE COMPONENTS SPECIFIC MIGRATION FOR THE FOODSTUFF CONSERVATION IN METALLIC CANSBuculei Amelia, Rebenciuc Ioana, Gheorghe Campeanu, Valent<strong>in</strong> I. Ionescu, Mariana I.Ionescu, Gabriela Constant<strong>in</strong>escu (Pop), Adriana DabijaANALYSIS AND QUANTIFICATION OF RESVERATROL IN WINE FROMMUNTENIA AND OLTENIA REGIONS (ROMANIA)Elisabeta-Ir<strong>in</strong>a Geana, Andreea-Maria Iordache, Roxana-Elena IoneteCAROTENE CONTENT FROM MILK SAMPLES OBTAINED IN DIFFERENTFEEDING CONDITIONSFulvia A. Manolache, Denisa E. Duţă, Valent<strong>in</strong> Ionescu, Lum<strong>in</strong>ita Catana, Vasile A. Blaj,Amalia MiteluţRESEARCH ON MYCOTOXIN CONTENT OF TRITICUM AESTIVUM IN ROMANIANSOUTH CROPSAmalia MITELUŢ, Al<strong>in</strong>a CULEŢU, Ir<strong>in</strong>a SMEU, Mona POPATHE POLYOLEFIN PACKAGE INFLUENCE UPON THE QUALITY OF THE BREADENRICHED WITH EXOGENOUS BUCKWHEAT ADDINGRebenciuc Ioana, Buculei Amelia, Constant<strong>in</strong>escu Gabriela, Dabija Adriana, IonescuMariana1541641741821881956
Proceed<strong>in</strong>g of the 4 rd International Symposium“NEW RESEARCH IN BIOTECHNOLOGY” USAMV Bucharest, Romania, 2011SECTION VI: MISCELLANEOUSRESEARCH ABOUT INFLUENCE OF DENSITY AND FERTILISATION ON PROTEINAND STARCH CONTENT IN SOME GENOTYPES OF BARLEY, VARIETYDISTICHUMAXINTI NICOLETA, TRIFAN DANIELASTUDY OF CORRELATIONS BETWEEN MAIN QUALITY INDICES OF BARLEYAND TECHNOLOGICAL PARAMETERS OF BREWINGAXINTI NICOLETA, TRIFAN DANIELACOMPARATIVE STUDY OF NEW INDETERMINATE TOMATO CULTIVARS INVEGETABLE PRODUCTION AREA OF MATCA: QUALITY ASPECTSM. PETRACHE, C. POHRIB, G. CAMPEANU, GABRIELA NEATASTUDIES REGARDING THE EFFECT OF MULCHING WITH TRANSPARENT FILMIN GREENHOUSES OF MATCA VEGETABLE AREA ON QUALITY OF TOMATOESC. POHRIB, M. PETRACHE, G. CAMPEANU, GABRIELA NEATATHE INFLUENCE OF RIPENING TEMPERATURE ON DIVERSITY OF NON-STARTER LACTIC BACTERIA IN SEMI-HARD CHEESESINGA CIPROVICA, ALLA MIKELSONE2032092162202267
Proceed<strong>in</strong>g of the 4 rd International Symposium“NEW RESEARCH IN BIOTECHNOLOGY” USAMV Bucharest, Romania, 2011SECTION I: AGRICULTURAL BIOTECHNOLOGYISOPEROXIDASE PROFILES IN SOYBEAN IN VITRO CULTURES UNDEROSMOTIC STRESS8GEORGINA KOSTURKOVA 1 , GEORGI ANGELOV 2 , MARGARITA DIMITROVA 1 ,KRASIMIRA TASHEVA 11 Institute of Plant Physiology and Genetics, Bulgarian Aca<strong>de</strong>my of Sciences, 1113 Sofia, Bulgaria; Phone: + 3592 974 6228; Fax: + 359 2 978 5512 Institute for Biodiversity and Ecosystem Research, Bulgarian Aca<strong>de</strong>my of Sciences, 1113 Sofia, Bulgaria; Phone:+359 2 871 8259; Fax: + 359 2 871 9032Correspon<strong>de</strong>nce to: Georg<strong>in</strong>a Kosturkova; E-mail: gkosturkova@yahoo.comAbstract. Soybean is commonly used gra<strong>in</strong> legume with multiple product applications. However, itsyield is reduced by environmental stress with drought be<strong>in</strong>g one of them. Due to the complex nature ofdrought tolerance, the problem has been studied from different aspects. Biotechnological methodscomplement classical ones and make possible mo<strong>de</strong>l<strong>in</strong>g of stress <strong>in</strong> vitro. Biochemical analysis of stressrelated prote<strong>in</strong>s contribute to better evaluation of the tolerant genotypes. The aim of the present work isto compare isozyme profiles of peroxidase <strong>in</strong> organogeneic soybean cultures cultivated <strong>in</strong> normal andstress conditions. Adventitious shoots and callus cultures from cv Rosa were <strong>in</strong>duced on modifiedFraytag medium. In vitro response of cotyledonary explant was recor<strong>de</strong>d, shoot and callus <strong>de</strong>velopment<strong>in</strong> stress conditions was characterized. Clusters of shoots were transferred to control medium and mediaconta<strong>in</strong><strong>in</strong>g polyethylene glycol (PEG) of concentrations of 4 %, 6%, and 8%. Totally five peroxidaseisoforms were i<strong>de</strong>ntified. Some of them cannot be <strong>de</strong>tected <strong>in</strong> the control, thus <strong>in</strong>duced un<strong>de</strong>r stressconditions. Induction is weaker at PEG concentration of 4% and more pronounced at 6% and 8% PEG.Enzyme profiles <strong>in</strong> shoots subjected to stress for periods of 1, 3, 6 and 23 days were i<strong>de</strong>ntified.Differential response was recor<strong>de</strong>d <strong>de</strong>pend<strong>in</strong>g on PEG concentration and time treatment.Keywords: peroxidase, osmotic stress, soybean, Glyc<strong>in</strong>e max, <strong>in</strong> vitro cultures1. INTRODUCTIONGlyc<strong>in</strong>e max is consi<strong>de</strong>red a world wi<strong>de</strong> strategic crop and commonly used gra<strong>in</strong>legume with multiple product applications. Soybean has a lead<strong>in</strong>g position among thelegume species as a source of high quality prote<strong>in</strong> and oil and beneficiary valuablesubstances as isoflavones, phenolic compounds and sapon<strong>in</strong>s. (Sakthivelu et al., 2008a)especially recognized by vegetarian and healthy food diets. However, abiotic environmentalstresses <strong>in</strong>clud<strong>in</strong>g drought, high temperatures and sal<strong>in</strong>ity reduce yield potentialsubstantially (Boyer, 1982). Due to the great importance of the problem and the complexnature of the tolerance efforts and studies for improvement of plant performance are ofdifferent aspects. Classical breed<strong>in</strong>g methods have been complemented with newtechniques of plant biotechnology and molecular biology (Bajji et al, 2000, Diab et al.,2008) giv<strong>in</strong>g possibility for simulat<strong>in</strong>g the <strong>de</strong>sired stress <strong>in</strong> vitro, provid<strong>in</strong>g selection on celllevel and manipulat<strong>in</strong>g genes for resistance.
Proceed<strong>in</strong>g of the 4 rd International Symposium“NEW RESEARCH IN BIOTECHNOLOGY” USAMV Bucharest, Romania, 2011Plant <strong>de</strong>fensive mechanisms are also <strong>in</strong> the focus of environmental stress research. Anumber of stress factors provoke a burst of active oxygen species <strong>in</strong> plants (Foyer et al.,1994). These free radicals are chemically highly active and cause <strong>in</strong>juries <strong>in</strong> plant cellstructure. Several enzymes, <strong>in</strong>clud<strong>in</strong>g peroxidase, are the ma<strong>in</strong> <strong>de</strong>fensive mechanismaga<strong>in</strong>st oxidative stress <strong>in</strong> plants as they elim<strong>in</strong>ate H 2 O 2 and free radicals. Peroxidases (PO)are a large family of enzymes which oxidize different substrates <strong>in</strong> the presence of H 2 O 2 ,thus regulat<strong>in</strong>g its concentration <strong>in</strong> plant cell. It has been <strong>de</strong>monstrated that these enzymesare <strong>in</strong>volved <strong>in</strong> several biochemical and physiological processes <strong>in</strong>clud<strong>in</strong>g different stressresponses (Med<strong>in</strong>a et al., 1999). Increase of peroxidases activity is a general response ofplants to stress factors (Fang & Kao, 2000). Effect of water stress (flood<strong>in</strong>g and drought) onantioxidant enzymes have been studied <strong>in</strong> rice varieties (Mali and Mehta, 1977) andAnthemis (Gorjizad et al., 2010)In Bulgaria soybean breed<strong>in</strong>g have been directed to improvement of yield, biotic andabiotic stress tolerance (Goranova and Todorova, 2005). Recently tissue cultures ofsoybean have been <strong>de</strong>veloped and they were used for <strong>in</strong> vitro mo<strong>de</strong>l<strong>in</strong>g of abiotic stress andscreen<strong>in</strong>g for genotypes with higher tolerance (Kosturkova 2005, Kosturkova et al., 2006,2008, Ne<strong>de</strong>v et al., 2007, Sakthivelu et al., 2008b)The aim of the present work is to compare the <strong>de</strong>velopment and the isoenzyme profilesof peroxidase <strong>in</strong> soybean calli and shoots cultivated <strong>in</strong> vitro un<strong>de</strong>r normal and stressconditions <strong>in</strong> attempt to analyze plant response to the drought stress factor.2. MATERIALS AND METHODSPreparation of <strong>in</strong> vitro cultures.Seeds of soybean cv Rosa were provi<strong>de</strong>d by Dr. R. Todorova (patent hol<strong>de</strong>r, Todorovaand Goranova, 2010) from the Soybean Experimental Station – Pavlikeni. After r<strong>in</strong>sed withwater seeds were surface sterilized by immersion <strong>in</strong> 70 % ethanol for 1 m<strong>in</strong>, followed by 30% v/v commercial bleach for 20 m<strong>in</strong> and r<strong>in</strong>sed three times <strong>in</strong> sterile distilled water. Seedswere plated un<strong>de</strong>r aseptic conditions on basal medium of Murashige and Skoog (1962) forgerm<strong>in</strong>ation. After 10-14 days cotyledonary no<strong>de</strong>s were excised from the seedl<strong>in</strong>gs beforethe formation of the first leaf and were plated on modified Fraytag’s medium (MSF)conta<strong>in</strong><strong>in</strong>g 4 mg/l benzylam<strong>in</strong>opur<strong>in</strong>e (BAP) and 0.1 mg/l 3-<strong>in</strong>dolebutyric acid (IBA)(Ne<strong>de</strong>v et al., 2007) - normal control conditions. To simulate drought conditionspolyethylene glycol (PEG) with molecular weight 6000 was ad<strong>de</strong>d <strong>in</strong>to the media beforeautoclav<strong>in</strong>g to have f<strong>in</strong>al concentrations of 4 %, 6 % and 8 % w/v. For peroxidase profil<strong>in</strong>gexpants respond<strong>in</strong>g <strong>in</strong> vitro on MSF medium were transferred to media conta<strong>in</strong><strong>in</strong>g PEG.After <strong>in</strong>duction of organogenesis and callogenesis tissues from the green shoots and fromthe calli were biochemical analyzed on the 1 st , 3 rd , 6 th , 23 rd , and 30 th day of cultivation <strong>in</strong>stress (cultured on media conta<strong>in</strong><strong>in</strong>g PEG) and normal control conditions (cultured onmedia lack<strong>in</strong>g PEG).Cultivation conditions.In vitro cultures were ma<strong>in</strong>ta<strong>in</strong>ed <strong>in</strong> phytotrone rooms at temperature of 25±1°C,photoperiod of 16/8 h and illum<strong>in</strong>ation of 40 µmolm –2 s –1 .Biochemical analysis.9
Proceed<strong>in</strong>g of the 4 rd International Symposium“NEW RESEARCH IN BIOTECHNOLOGY” USAMV Bucharest, Romania, 2011Calli and shoots from <strong>in</strong> vitro soybean cultures were ground <strong>in</strong> 0.01 M Tris, 0.08 Mglyc<strong>in</strong>e, 0.005 M cyste<strong>in</strong>e and 20% sucrose at pH 8.3. Homogenates were centrifuged at 10000 rpm for 10 m<strong>in</strong>. The supernatant was used as a source of enzyme. Anodally migrat<strong>in</strong>gisoforms of peroxidase were resolved on 7.5% polyacrylami<strong>de</strong> slabs as separat<strong>in</strong>g gel with3% stack<strong>in</strong>g gel accord<strong>in</strong>g to Davis (1964). The length of the separat<strong>in</strong>g gel was 6 cm andstack<strong>in</strong>g gels were 2 cm long. Electrophoresis was conducted at 200 V until the <strong>in</strong>dicatorbromphenol reached the gel end. Isoforms were <strong>de</strong>signated by number symbol reflect<strong>in</strong>gtheir gel migration (<strong>in</strong> mm) from the start. Sta<strong>in</strong><strong>in</strong>g of gels followed procedureof Przybilskaet al. (1982)3. RESULTS AND DISCUSSIONSSoybean <strong>in</strong> vitro cultures <strong>de</strong>velopment un<strong>de</strong>r osmotic stress.Soybean cotyledonary explants plated on medium for <strong>in</strong>duction of organogenesis startedformation of buds from the meristematic tissue (Fig. 1) and gave rise to green shoots for aperiod of one month. Simultaneously bottom part of the explant was swell<strong>in</strong>g and compactcalluses like tissue or callus was formed. This pattern of <strong>de</strong>velopment of excisedcotyledonary no<strong>de</strong>s was observed for soybean cultures from other varieties <strong>in</strong>vestigatedpreviously (Ne<strong>de</strong>v et al., 2007; Sakthivelu et al., 2008b). The negative effect of the osmoticagent PEG was visible at early stage of explant <strong>de</strong>velopment (second week, Fig. 1)suppress<strong>in</strong>g organogenesis and callus <strong>in</strong>duction. Further formation of shoots and calli andtheir growth was <strong>in</strong>fluenced by the stress conditions <strong>in</strong> a various way (Table 1). After onemonth <strong>in</strong> culture the number of explants that have <strong>de</strong>veloped <strong>in</strong> stress conditions was lower(75 %, 70 % and 60 % for PEG concentrations of 4 %, 6 %, and 8 %, respectively).However, all <strong>in</strong> vitro respond<strong>in</strong>g explants formed shoots and callus simultaneously.Shoot number per explant <strong>de</strong>creased from 2.3 to 1.1 with the <strong>in</strong>crease of PEGconcentration. Shoot growth was arrested too, with exception for 4% PEG. Callus weight<strong>de</strong>creased significantly (by 30 %) at the lowest PEG concentration of 4 %. However, for thenext concentrations of 6 % and 8 % callus growth was stimulated. Higher weight wasrecor<strong>de</strong>d for the cases of higher stress pressure of 6-8 % of PEG. In addition to the morevigorous formation of callus the latter was more liquidy.Fig 1. Two weeks old cultures of soybean cotyledonary explants <strong>de</strong>velop<strong>in</strong>g on MSF media for<strong>in</strong>duction of organogenesis <strong>in</strong> normal control conditions (medium without PEG) and un<strong>de</strong>r osmoticstress (media conta<strong>in</strong><strong>in</strong>g 4 % and 6 % PEG).10
Proceed<strong>in</strong>g of the 4 rd International Symposium“NEW RESEARCH IN BIOTECHNOLOGY” USAMV Bucharest, Romania, 2011Legend: Concentration of PEG <strong>in</strong> the media: 0 % PEG, Control <strong>in</strong> testubes 1 and 2; 4 % PEG <strong>in</strong>testubes 3 and 4; 6 % PEG <strong>in</strong> testubes 5 and 6.Table 1. Characteristic of soybean cv Rosa adventitious shoots and callus cultured of MSF mediaun<strong>de</strong>r normal and osmotic stress conditions on the 30 th day of cultivation.PEGconcentration<strong>in</strong> the mediaIn vitroresponse[%]Shootnumber perexplantShoot size[cm]Callusweight[g]0 % 85 2.3 ± 0.7 3.2 ± 0.26 0.700 ± 0.274 % 75 1.7 ± 0.5 2.0 ± 0.12 0.490 ± 0.146 % 70 1.4 ± 0.4 2.8 ± 0.28 0.600 ± 0.158 % 60 1.1 ± 0.4 2.1 ± 0.30 0.770 ± 0.18Values are mean ± SDSoybean isoperoxidase profiles of <strong>in</strong> vitro <strong>in</strong>duced shoots and calli.Isoperoxidase profile of soybean <strong>in</strong> vitro shoots cultivated on different concentrations ofPEG for a different period of time is shown <strong>in</strong> Fig 2. Totally five peroxidase isoforms (10,21, 24, 28 and 35) were i<strong>de</strong>ntified. One of them (isoform 10) can not be <strong>de</strong>tected <strong>in</strong> thecontrol and it is <strong>in</strong>duced un<strong>de</strong>r stress. Isoform 10 was less <strong>in</strong>tense on the third day and most<strong>in</strong>tense on the twenty third day. Consi<strong>de</strong>r<strong>in</strong>g isoform 21, <strong>in</strong> most cases of PEG treatment its<strong>in</strong>tensity was much greater compared to the control.Fig 2. Isoperoxidase profile of soybean <strong>in</strong> vitro shoots cultivated on different concentrations of PEGfor a different period of timeLegend: A. First day: 1 - 0 % PEG (Control); 2 – 4 % PEG; 3 – 6 % PEG; 4 – 8 % PEG; Third day:5 – 4 % PEG; 6 – 6 % PEG; 7 – 8 % PEG;B. Sixth day - 8 – 4 % PEG; 9 – 6 % PEG; 10 – 8 % PEG; Twenty third day: 11 – 4 % PEG; 12 – 6% PEG; 13 – 8 % PEG; 14 – 0 % PEG (Control)Generally, there was gradual <strong>in</strong>crease of its <strong>in</strong>tensity parallel to <strong>in</strong>crease of PEGconcentration. Isoforms 24 and 28 <strong>de</strong>monstrated an <strong>in</strong>tensive response to the stress factor. Itwas most pronounced on the third day (lanes 4-6), sixth day (lanes 9-10) and twenty thirdday (lanes 11-12). Isoform 35 was absent <strong>in</strong> the control and <strong>in</strong> the plants treated with 4%11
Proceed<strong>in</strong>g of the 4 rd International Symposium“NEW RESEARCH IN BIOTECHNOLOGY” USAMV Bucharest, Romania, 2011PEG on the first day. There was <strong>in</strong>crease of its <strong>in</strong>tensity correspond<strong>in</strong>g to the <strong>in</strong>crease ofPEG concentration. It was most illustrative on the sixth day (lanes 8-10) and on the twentythird day (lanes 11-13). Isoperoxidase profile of soybean <strong>in</strong> vitro cultures treated withdifferent concentrations of PEG for thirty days is presented <strong>in</strong> Fig 3. Exclud<strong>in</strong>g isoform 10,a similar pattern was observed. Isoform 35 was not found <strong>in</strong> the control. Consi<strong>de</strong>r<strong>in</strong>gisoforms 21, 24, 28 and 35, the most <strong>in</strong>tense response to the stress factor was recor<strong>de</strong>d <strong>in</strong>calli cultures (lanes 1-3).The exposure of soybean shoot cultures to osmotic (drought) stress, simulated by PEG,<strong>in</strong>duced new isoperoxidases as a response to the stress factor. Induction of peroxidase havebeen observed also <strong>in</strong> Aegilops (Landjeva et al., 2004), barley (Tamás et al., 2007) andHevea brasiliensis (Dutsa<strong>de</strong>e and Nunta, 2008).Differential response of soybean peroxidase to the stress factor was recor<strong>de</strong>d <strong>de</strong>pend<strong>in</strong>gon PEG concentration and time treatment. Generally, there was gradual <strong>in</strong>crease ofisoperoxidase <strong>in</strong>tensity (activity) which correspon<strong>de</strong>d to the <strong>in</strong>crease of PEG concentration.Similar pattern of gradual <strong>in</strong>crease of isoperoxidases was found <strong>in</strong> Aegilops (Landjeva etal., 2004) too. Analysis of 13 POD genes <strong>in</strong> sweetpotato revealed differential expression ofPODs <strong>in</strong> response to the stress factor (Yun-Hee Kim et al., 2010).Fig 3. Isoperoxidase profile of soybean <strong>in</strong> vitro cultures treated with different concentrations ofPEG for 30 days.Calli: 1 – 4 % PEG; 2 – 6 % PEG; 3 – 8 % PEG; 4 – 0 % PEG (Control);Shoots: 5 – 0 % PEG (Control); 6 – 4 % PEG; 7 – 6 % PEG; 8 – 8 % PEG4. CONCLUSIONIt could be conclu<strong>de</strong>d that <strong>in</strong>duction, <strong>in</strong>crease of activity and differential expression <strong>in</strong>response to the stress factor are closely l<strong>in</strong>ked to an improved antioxidant <strong>de</strong>fense capabilitymediated by peroxidase <strong>in</strong> soybean cv Rosa. This variety was chosen <strong>in</strong> these experiments forits higher yield un<strong>de</strong>r non-irrigated field conditions (Todorova and Goranova, 2010) and isconsi<strong>de</strong>red with higher drought tolerance.12
Proceed<strong>in</strong>g of the 4 rd International Symposium“NEW RESEARCH IN BIOTECHNOLOGY” USAMV Bucharest, Romania, 2011Presented results enrich our previous research on comparison between the response ofvarious soybean l<strong>in</strong>es to water <strong>de</strong>ficiency <strong>in</strong> field and laboratory conditions us<strong>in</strong>g droughtsimulation by PEG. A ten<strong>de</strong>ncy of positive correlation between seed yield from one si<strong>de</strong> andseed germ<strong>in</strong>ation and seedl<strong>in</strong>g growth stages from another was observed (Kosturkova et al.,2008). Cotyledonary nodal explants subjected to 6% PEG 6000 treatments, resulted <strong>in</strong>reduction <strong>in</strong> shoot <strong>in</strong>duction, compared to the control. In vitro callus cultures of both Indianand soybean cultivars grown <strong>in</strong> Bulgarian showed a reduction <strong>in</strong> callus growth with PEGtreatment, compared with the control. Presence of PEG <strong>in</strong> the medium elevated dry mattercontent <strong>in</strong> all the treatments compared to the control (Saktivelu et al., 2008b).ACKNOWLEDGEMENTS. Auhtors thank to Dr. R. Todorova, associate professor of theSoybean Experimental Station – Pavlikeni for provid<strong>in</strong>g soybean seeds.REFERENCESBajij, M., Lutts S., K<strong>in</strong>et J. M. (2000): Physiological changes after exposure to and recovery frompolyethylene glycol-<strong>in</strong>duced water <strong>de</strong>ficit <strong>in</strong> callus culture issued from durum wheat (Triticum durum)cultivars differ<strong>in</strong>g <strong>in</strong> drought resistance, J. Plant Physiol. Vol. 156: 75–83.Boyer, J.S. (1982): Plant productivity and environment. Science. Vol. 218: 443–448.Davis, B. (1964): Disc electrophoresis. I. Method and application to human serum prote<strong>in</strong>s. Ann NY Acad Sc. Vol. 121: 404-427.Diab, A.A., Cantety, R.V., Osturk, N.Z., Benscher, D., Nachit M.M. and Sorrells, M.E. (2008):Drought – Inducible Genes and Differentially Expressed Sequence Tags Associated with Components ofDrought Tolerance <strong>in</strong> Durum Wheat. Scientific Research and Essay. Vol. 3, (1): 9-26.Dutsa<strong>de</strong>e, Ch., and Nunta, Ch. (2008): Induction of peroxidase, scopolet<strong>in</strong>, phenolic compoundsand resistance <strong>in</strong> Hevea brasiliensis by elicit<strong>in</strong> and a novel prote<strong>in</strong> elicitor purified from Phytophthorapalmivora. Physiological and Molecular Plant Pathology. Vol. 72: 179-187.Fang, V., Kao Ch. (2000): Enhanced peroxidase activity <strong>in</strong> rice leaves <strong>in</strong> response to excess Fe, Cuand Zn. Plant Science. Vol. 158: 71-76.Foyer, C., Descourvieres P., Kunert, K. (1994): Protection aga<strong>in</strong>st oxygen radicals: an important<strong>de</strong>fense mechanism studied <strong>in</strong> transgenic plants. Plant Cell Envirn. Vol. 17: 507-523.Goranova, K. and Todorova, R. (2005): Past, present and future of the breed<strong>in</strong>g of soybean. In:Breed<strong>in</strong>g and Technological Aspects <strong>in</strong> Production and Process<strong>in</strong>g of Soybean and Other LegumeCrops”, ed. G. Georgiev, Pavlikeni, 30-41.Gorjizad, A., Livani B., Abadi, D. (2010): Study of water stress (flood<strong>in</strong>g and drought) on someantioxidant enzymes and essence percent <strong>in</strong> Anthemis altissima L. J. <strong>Biotechnology</strong>. Vol. 150: 185-193.Kosturkova, G. (2005): In vitro <strong>de</strong>velopment of various soybean (Glyc<strong>in</strong>e max) explants frommature seeds. “Breed<strong>in</strong>g and Technological Aspects <strong>in</strong> Production and Process<strong>in</strong>g of Soybean and OtherLegume Crops”. Scientific Reports of the Jubilee Scientific conference (with <strong>in</strong>ternational participation),8-9 Sept. 2005 Pavlikeni, 94-99.Kosturkova, G., Ne<strong>de</strong>v, T., Dimitrova, M. (2006): Application of callus cultures of soybean (Glyc<strong>in</strong>emax) to study abiotic stress factors. Field Crops Studies (Bg). Vol. 3, (2): 245-249.Kosturkova, G., Todorova, R. , Sakthivelu G., Akitha Devi M. K., Giridhar, P., Rajasekaran, T.,Ravishankar, G. A. (2008): Response of Bulgarian and Indian soybean genotypes to drought and water<strong>de</strong>ficiency <strong>in</strong> field and laboratory conditions. Journal of general and Applied Plant Physiology. Vol. 34(3-4): 239-25013
Proceed<strong>in</strong>g of the 4 rd International Symposium“NEW RESEARCH IN BIOTECHNOLOGY” USAMV Bucharest, Romania, 2011Landjeva, S., Angelov, G., Nenova V., Merakchijska, M., Ganeva, G. (2004): Seedl<strong>in</strong>g growth andperoxidase responses to excess copper <strong>in</strong> wheat-Aegilops geniculata shromosome addition andsubstitution l<strong>in</strong>es. Genetics and Breed<strong>in</strong>gs. Vol. 33: 17-24.Mali, P., Mehta, Ch. (1977): Effect of drought on enzymes and free prol<strong>in</strong>e <strong>in</strong> rice varieties..Phytochemistry. Vol. 16: 1355-1357.Med<strong>in</strong>a, M., Qusada, M., Pilego, F., Botella, M., Valpuesta, V. (1999): Expression of tomatoperoxidasegene PRX 1 <strong>in</strong> NaCl-adapted and nonadapted suspension cells. Plant Cell Rep. 18: 680-683.Murashige, T., Skoog, F. (1962): A revised medium for rapid growth and bioassays with tobaccotissue culture, Physiol. Plant. Vol. 15: 473–497.Ne<strong>de</strong>v, T., Todorova, R., Kosturkova, G., Akita Devi, M.K., Sakthivelu, G., Giridhar, P.,Rajaserakan, T., Ravishankar, G.A. (2007): Variation <strong>in</strong> <strong>in</strong> vitro Morphogenic Response to GrowthRegulators <strong>in</strong> Soybean Genotypes from India and Bulgaria. International Electronic JournalBioautomation. Vol. 8 (S1): 193-200Przybilska, J., Blixt, S., Parzisz, H., Zimniak–Przybilska, Z. (1982): Isoenzyme variation <strong>in</strong> thegenus Pisum. I. Electrophoretic patterns of several enzyme systems. Genet Pol. Vol. 23: 103-121Sakthivelu, G., Akitha Devi, M. K., Giridhar, P., Rajasekaran, T., Ravishankar, G. A., Nikolova, M.T. , Angelov, G. B., Todorova, R. M., Kustorkova, G. (2008a): Isoflavone composition, phenol contentand antioxidant activity of Soybean seeds from India and Bulgaria, J. of Agrl. and Food Chem. Vol. 56:2090-2095.Sakthivelu, G., Akitha Devi, M. K., Giridhar, P., Rajasekaran, T., Ravishankar, G. A., Ne<strong>de</strong>v, T.,Kosturkova, G. (2008b). Drought <strong>in</strong>duced alterations <strong>in</strong> growth, osmotic potential and <strong>in</strong> vitroregeneration of soybean cultivars. Journal of General and Applied Plant Physiology. Vol. 34 (1-2): 103-112.Tamás, L., Ďurčeková, K., Halušková, L., Huttová, V., Mistrík, I., Ollé, M. (2007): Rhizospherelocalized cationic peroxidase from barley roots is strongly activated by cadmium and correlated withroot growth <strong>in</strong>hibition. Chemosphere. Vol. 66: 1292-1300.Todorova, R., Goranova, K. (2010): Rosa – A new Bulgarian soybean variety. In: Breed<strong>in</strong>g andTechnological Aspects <strong>in</strong> Production, Process<strong>in</strong>g and Use of Soybean and Other Gra<strong>in</strong> Legumes”,Proceed<strong>in</strong>gs of a Scientific-Practical Conference, Pavlikeni 2010, 37-40.Yun-Hee, Kim, Haeng-Soon, Lee & Sang-Soo, K. (2010): Differential responses of sweetpotatoperoxidases to heavy metals. Chemosphere. Vol. 81: 79-85.14
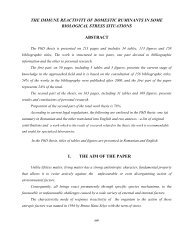
Proceed<strong>in</strong>g of the 4 rd International Symposium“NEW RESEARCH IN BIOTECHNOLOGY” USAMV Bucharest, Romania, 2011AN ANALYSIS OF THE EFFECT OF TEMPERATURE ON THEQUANTITY OF BT TOXIN IN COTTON VARIETIES1. Universitatea <strong>de</strong> Sti<strong>in</strong>te Agronomice si Medic<strong>in</strong>a Veter<strong>in</strong>ara, Bucuresti, Romania2. University of Agriculture, Faisalabad, PakistanMUHAMMAD SAJJAD ALIi 1 , INTEZAR ALI 2Abstract. The expression of Bt transgene <strong>in</strong> cotton cultivars is <strong>de</strong>pen<strong>de</strong>nt upon a host of factors.Extreme variations <strong>in</strong> temperature not only affect overall plant vigour and growth but the expressionof Cry1Ac gene is also compromised. The expression of Bt content correlated with temperature wasquantified <strong>in</strong> six cotton varieties dur<strong>in</strong>g the cotton year 2010-2011. The results <strong>in</strong>dicate a <strong>de</strong>cl<strong>in</strong>e <strong>in</strong>expression of Cry1Ac over temperature <strong>in</strong><strong>de</strong>pen<strong>de</strong>nt of the hybrid genotype. The situation necessitatesa post commercialization monitor<strong>in</strong>g of the formally approved cotton varieties.Keywords: Cry tox<strong>in</strong>; quantity; temperature; correlation1. INTRODUCTIONBt cotton was <strong>de</strong>veloped to thwart the bollworm’s attack and dur<strong>in</strong>g the last couple ofyears, there has been a steady growth <strong>in</strong> area covered by Bt cotton varieties <strong>in</strong> Punjab(figure 1).If on one hand, there is an <strong>in</strong>crease <strong>in</strong> the adoption of Bt technology, there arealso many Bt varieties of unknown parent germplasm.The expression of Bt tox<strong>in</strong> is <strong>de</strong>pen<strong>de</strong>nt upon a host of factors <strong>in</strong>clud<strong>in</strong>g parent germplasm,plant parts, availability of macronutrients especially nitrogen and changes <strong>in</strong> temperature.Accord<strong>in</strong>g to the work done <strong>in</strong> India, the expression of tox<strong>in</strong> <strong>in</strong> boll-r<strong>in</strong>d, squares and <strong>in</strong> theovary of flowers was found below the threshold of 1.8µg/g ,the amount consi<strong>de</strong>red as LD 99(Kranthi et al., 2005).A high dose expression of Bt tox<strong>in</strong> ensures the durability of Bt technology and it isimportant that the foliar plant parts express this endotox<strong>in</strong> <strong>in</strong> sufficient quantities to causemaximum mortality of the target pests i.e. Helicoverpa armigera (Hubner), Earias vitella(Fabricius) and Pect<strong>in</strong>ophora gossypiella.The first <strong>in</strong>star of these target pests completes<strong>de</strong>velopment on leaves chew<strong>in</strong>g the ten<strong>de</strong>r foliar tissues. An enhanced quantity of Btendotox<strong>in</strong>, therefore, <strong>in</strong> leaves is <strong>de</strong>sirable <strong>in</strong> domestically <strong>de</strong>veloped and commercializedBt cotton varieties.However, the temperature extremes affect the plant vigour lead<strong>in</strong>g to a <strong>de</strong>crease <strong>in</strong>production of Bt endotox<strong>in</strong>. The expression of Cry1Ac <strong>in</strong> Bollards due to temperaturevariations have been found vary<strong>in</strong>g and correlated with the survival of target pests (Olsen etal., 2005).The present study was <strong>de</strong>signed <strong>in</strong> or<strong>de</strong>r to verify the uniformity of optimumexpression of Bt tox<strong>in</strong> with temperature variations <strong>in</strong> commonly commercialized cottonvarieties dur<strong>in</strong>g the cotton season 2010-2011. It was necessary because earlier research hasshown a variance of Bt tox<strong>in</strong> <strong>in</strong> illegal varieties commonly found <strong>in</strong> farmers’ fields.15
Proceed<strong>in</strong>g of the 4 rd International Symposium“NEW RESEARCH IN BIOTECHNOLOGY” USAMV Bucharest, Romania, 2011Increase <strong>in</strong> Bt cotton areaPercent Area90807060504030201009080706050403020100Percent Area-10-102005 2007 2009 2011YearsFigure 1: Evolution of Bt cotton area <strong>in</strong> Punjab 2006−2010162. MATERIALS AND METHODSN<strong>in</strong>e cultivars of Gossypium Hirsutum L. conta<strong>in</strong><strong>in</strong>g cry1Ac gene (MON531 event) weregrown <strong>in</strong> RCBD <strong>de</strong>sign. The varieties were Ali Akbar 802, IR 3701, Ali Akbar 703,FH113,IR 1524,GH 2035,FH 114,N 121 and MG 6. The plot size was 40 x 20 ft keep<strong>in</strong>g rowto row distance 30 <strong>in</strong>ches and plant to plant distance 12 <strong>in</strong>ches. The sow<strong>in</strong>g date was May15, 2010.Water and fertilizer were applied as per normal recommendations.Three consecutive plants were selected from each genotype <strong>in</strong> every repeat and tagged after30 days of germ<strong>in</strong>ation. Selected plants were tested for their Bt studies. Agdiaimmunostrips were used for Bt test<strong>in</strong>g. Cry1Ac prote<strong>in</strong> concentration was quantified <strong>in</strong>cotton leaves by ELISA. After 30 days of sow<strong>in</strong>g, leaf samples were collected andpreserved <strong>in</strong> liquid nitrogen for ELISA test. Third leaf from the top of each tagged plantwas tested. Tagged plants were quantified five times i.e. 30 days after plant<strong>in</strong>g (DAP),70DAP, 100DAP, 130DAP and 160 DAP.Average temperature of days s<strong>in</strong>ce sow<strong>in</strong>g/previous sampl<strong>in</strong>g date was calculated prior toeach sampl<strong>in</strong>g. Bt quantification data was analysed by split plot <strong>de</strong>sign by us<strong>in</strong>g QI Macros2011 software which showed a non normal data nature. At α=0.05, the data rejects nullhypothesis.
Proceed<strong>in</strong>g of the 4 rd International Symposium“NEW RESEARCH IN BIOTECHNOLOGY” USAMV Bucharest, Romania, 20113. RESULTS AND DISCUSSIONThe quantities of Bt tox<strong>in</strong> <strong>de</strong>term<strong>in</strong>ed over the grow<strong>in</strong>g season are expressed below (table1).Table 1: Variation <strong>in</strong> the quantity of Bt tox<strong>in</strong> over the grow<strong>in</strong>g seasonMeanTemperature37 0 C 39 0 C 36 0 C 31 0 C 26 0 CVarieties 30DAP 70 DAP 100 DAP 130 DAP160DAPAA802 0.921 0.755 0.672 0.546 0.541MG6 0.915 0.764 0.722 0.548 0.514IR3701 0.924 0.76 0.681 0.546 0.523AA703 0.92 0.749 0.716 0.548 0.521FH113 0.924 0.765 0.727 0.546 0.527IR1524 0.913 0.756 0.657 0.549 0.506GH2035 0.912 0.765 0.673 0.543 0.504FH114 0.928 0.744 0.636 0.544 0.519N121 0.924 0.743 0.634 0.548 0.516The trend of change <strong>in</strong> concentration of Bt tox<strong>in</strong> related with temperature shows the highestproductivity at 37 0 C which <strong>de</strong>cl<strong>in</strong>es onwards with an <strong>in</strong>crease <strong>in</strong> temperature (figure2).The Bt tox<strong>in</strong> concentration is expressed <strong>in</strong> µg/g.Bt tox<strong>in</strong> concentration ranged between0.930—0.510 µg/g. The maximum level of Bt prote<strong>in</strong> was produced at 30DAP whilem<strong>in</strong>imum be<strong>in</strong>g at 160 DAP. The concentration of Bt content is tapered off towards the endof the grow<strong>in</strong>g period.At 37 0 C, i.e. at 30DAP, the varieties produced the highest quantity of tox<strong>in</strong>.The juveniletissues produced the maximum effect.However, at this stage the bollworms do not <strong>in</strong>fest thefield as they appear later <strong>in</strong> the crop season at about 80-100 DAP. At 26 0 C (160DAP), theplants had the favorable temperature for growth and mature plants produced Bt tox<strong>in</strong>sufficiently. However, the graph clearly <strong>in</strong>dicates that at no growth stage, no plant variety atany temperature range produced Bt tox<strong>in</strong> high enough to cause 95% mortality of targetpests (high dose strategy).Illegal varieties produced by random cross<strong>in</strong>g of Bollard varietieswith local high yield<strong>in</strong>g cultivars not only cause an economic loss to farmers (as the Btseeds are priced higher than non Bt); but also cause the survival of target pest <strong>in</strong>dividuals.The resistance evolution case has not yet been observed <strong>in</strong> Pakistani cotton fields as noresearch report <strong>in</strong>dicates so. Pakistani cotton experts are of the view that the resistanceevolution <strong>in</strong> target pests due to less-than-optimal tox<strong>in</strong> concentration is not feasible(Sharma, 2009). The farmers have small hold<strong>in</strong>gs and due to adjacent fields of differentcrop plants, target pests do not survive due to host unavailability <strong>in</strong> vic<strong>in</strong>ity. However, <strong>in</strong>many cotton areas especially nearby cities, there is a trend of vegetable grow<strong>in</strong>g nearbycotton fields. The migrat<strong>in</strong>g surviv<strong>in</strong>g pests may f<strong>in</strong>d ochra, br<strong>in</strong>jal and cauliflower asalternate hosts for <strong>de</strong>velopment.17
Proceed<strong>in</strong>g of the 4 rd International Symposium“NEW RESEARCH IN BIOTECHNOLOGY” USAMV Bucharest, Romania, 2011Correlation between temperature and concentration of Bt tox<strong>in</strong> <strong>in</strong> cotton varietiesy=(a+cx+ex^2)/(1+bx+dx^2)r^2=0.90263579 DF Adj r^2=0.8901532 FitStdErr=0.048751164 Fstat=92.707146a=0.50943885 b=-0.053329122 c=-0.027091175d=0.00071219129 e=0.000361306230.950.95concentration µg/g0.90.850.80.750.70.650.60.550.90.850.80.750.70.650.60.55concentration µg/g0.50.525 30 35 40TemperatureFigure 2: Variation <strong>in</strong> concentration of Cry tox<strong>in</strong> with temperature4. CONCLUSIONSThere is an imm<strong>in</strong>ent threat of resistance evolution <strong>in</strong> target cotton pests if proper resistancemanagement measures are not adopted.The study <strong>in</strong>dicates the need for provision ofcertified Bt seed accessible to all farmers. A strict regulatory regime must be established tomonitor and to conta<strong>in</strong> the spread of illegal varieties as well as the environmental reevaluationof commercialized varieties for their Bt potential. It is necessary because <strong>in</strong> prereleasetrials, the assessments are limited <strong>in</strong> scope and the assessment results may differ <strong>in</strong>different climatic conditions and agronomic practices by the farmers.REFERENCES1. Kranthi, K.R. (2005): Bollworm resistance to Bt cotton <strong>in</strong> India. Nature<strong>Biotechnology</strong>.Vol.23, 12: 1476-1477.2. Olsen, K.R., Daly, J.C., Holt, H.E. and F<strong>in</strong>negan, E.J, (2005): Seasonal long variation <strong>in</strong>expression of Cry1Ac gene and efficacy of Bacillius thur<strong>in</strong>giensis tox<strong>in</strong> <strong>in</strong> transgenic cotton aga<strong>in</strong>stHelicoverpa armigera Hub. (Lepidoptera: Noctuidae).J.Econ.Ent., 98:1007-1017.3. Sharma, D. ‘The illegal way to promote Bt cotton <strong>in</strong> Pakistan’. (20 June 2009): Availableat: http://<strong>de</strong>v<strong>in</strong><strong>de</strong>r-sharma.blogspot.com/2009/06/bt-cotton-seeds-smuggled-from-<strong>in</strong>dia.html.18
Proceed<strong>in</strong>g of the 4 rd International Symposium“NEW RESEARCH IN BIOTECHNOLOGY” USAMV Bucharest, Romania, 2011A MODEL POST COMMERCIALIZATION MONITORINGFRAMEWORK FOR BT COTTON IN PAKISTAN1. Universitatea <strong>de</strong> Sti<strong>in</strong>te Agronomice si Medic<strong>in</strong>a Veter<strong>in</strong>ara, Bucuresti, Romania2. University of Agriculture, Faisalabad, PakistanMUHAMMAD SAJJAD ALIi 1 , INTEZAR ALI 2Abstract. Cotton varieties were formally approved for large scale cultivation <strong>in</strong> Pakistan <strong>in</strong> late2010.However, the prevalence of Bt cotton varieties <strong>in</strong> farmers’ fields can be traced back s<strong>in</strong>ce2002.The cultivation of unapproved varieties with an unknown parent germplasm and a doubtfulcompatibility of such varieties with local flora must be analysed for environmental consequences. Theflow of transgene <strong>in</strong> local ecosystem needs to be monitored at earliest. A regulatory mo<strong>de</strong>l is <strong>de</strong>signedfor the monitor<strong>in</strong>g of ill effects/spread of Bt transgene. The mo<strong>de</strong>l presents a plan from sampl<strong>in</strong>g toresults <strong>in</strong>terpretation <strong>in</strong>volv<strong>in</strong>g the active role of all agricultural stake hol<strong>de</strong>rs <strong>in</strong> Pakistan.KEYWORDS: Bt cotton; stakehol<strong>de</strong>rs; monitor<strong>in</strong>g; framework1. INTRODUCTIONWhen GM crops are approved for unconf<strong>in</strong>ed environmental release <strong>in</strong> Pakistan, systematicpost commercialization monitor<strong>in</strong>g (PCM) of their environmental impact is not required. InPakistan, GM crops are produced by conventional breed<strong>in</strong>g, mutagenesis or morecommonly by recomb<strong>in</strong>ant DNA techniques. In 2010, Pakistan was among the top 5countries produc<strong>in</strong>g Bt cotton (James 2011).Viewed retrospectically, GM hybrids changedthe farm<strong>in</strong>g practice <strong>in</strong> cotton fields by allow<strong>in</strong>g a reduction of spray<strong>in</strong>g frequency andrelated practices.Although not legally required to conduct PCM, Pakistan needs to establish the PCM regimeafter the pervasiveness of illegal cultivation of GM cotton. As the GM crop iscommercialized on a larger spatial and temporal scale, it may be possible to observe smallerand less frequent ecological risks (Snow et al., 2005).Thus PCM provi<strong>de</strong>s the basis for anearly warn<strong>in</strong>g system to <strong>de</strong>tect and mitigate any adverse effects.2. MATERIALS AND METHODSA review of exist<strong>in</strong>g monitor<strong>in</strong>g legislations and the role of regulatory authority <strong>in</strong> Pakistanare studied. A mo<strong>de</strong>l Monitor<strong>in</strong>g plan <strong>in</strong> post commercialization scenario is <strong>de</strong>veloped.ENVIRONMENTAL RISK ASSESSMENT OF GM CROPSOver a couple of years, technology <strong>de</strong>velopers have partnered with researchers fromprov<strong>in</strong>cial and fe<strong>de</strong>ral <strong>in</strong>stitutions to conduct monitor<strong>in</strong>g of specific environmental andagronomic concerns previously i<strong>de</strong>ntified <strong>in</strong> the Biosafety Gui<strong>de</strong>l<strong>in</strong>es 2005.An appropriaterisk assessment gathers data that clearly l<strong>in</strong>k the measurement endpo<strong>in</strong>ts with theenvironmental management goals through the assessment end po<strong>in</strong>ts (Raybould, 2006).19
Proceed<strong>in</strong>g of the 4 rd International Symposium“NEW RESEARCH IN BIOTECHNOLOGY” USAMV Bucharest, Romania, 2011PROJECT MANAGEMENT AND MONITORING PROCEDUREOnce the environmental risk (assessment endpo<strong>in</strong>ts and testable hypothesis) arecharacterized, the next phase is project management and monitor<strong>in</strong>g. A sound governancestructure is essential for successful PCM. A pr<strong>in</strong>cipal <strong>in</strong>vestigator would coord<strong>in</strong>ateplann<strong>in</strong>g and execution of the study. It would be pru<strong>de</strong>nt to have national and <strong>in</strong>ternationaladvisors to provi<strong>de</strong> expert advice on all aspects of the PCM program.a) THE MONITORPakistan has a long history of conduct<strong>in</strong>g field and farmer surveys by public researchers orextension workers. However the same level of cooperation between farmers and employeesof the technology <strong>de</strong>velopers may not be as forthcom<strong>in</strong>g because of perceptions of bias ortrust.In Pakistan, neither the regulator i.e. National Agriculture Research Council (NARC) northe technology <strong>de</strong>veloper mult<strong>in</strong>ational companies has the expertise or <strong>in</strong>frastructure toconduct PCM. Much more importantly real or perceived conflicts of <strong>in</strong>terests should beavoi<strong>de</strong>d by hav<strong>in</strong>g public aca<strong>de</strong>mic lead PCM, not the <strong>de</strong>veloper with a vested <strong>in</strong>terest <strong>in</strong>the commercial success of the GM crop or the regulators that approved the unconf<strong>in</strong>e<strong>de</strong>nvironmental release of a GM crop; because there is the risk of bias <strong>in</strong> validat<strong>in</strong>g theirorig<strong>in</strong>al <strong>de</strong>cision.Public aca<strong>de</strong>mia should have access to these protocols directly from NARC as a conditionof the regulatory process for a genetically modified crop (GMC). Without these molecularprotocols it would be impossible to confirm the presence of a transgene of <strong>in</strong>terest <strong>in</strong> GMcrop populations.b) THE FINANCERCost shar<strong>in</strong>g should reflect the value of the <strong>in</strong>formation to private <strong>de</strong>velopers, the publicgood and the policy <strong>de</strong>velopment. Technology <strong>de</strong>velopers should bear the majority of costsbecause they ga<strong>in</strong> the major f<strong>in</strong>ancial ga<strong>in</strong>s through seed or pestici<strong>de</strong> sales. A 20 yearspatent on the technology ensures a monopoly for that duration and an acceptable rate ofreturn on <strong>in</strong>vestment. Moreover results from the PCM provi<strong>de</strong> technology <strong>de</strong>velopers withnew <strong>in</strong>formation to help farmers adopt best management of GMCs and optimize economicbenefits.c) SPATIAL SCALEDepend<strong>in</strong>g on the size of the risk be<strong>in</strong>g monitored or regional scale of GM crop cultivation,multiple monitor<strong>in</strong>g sites with different eco-regions will be required to <strong>de</strong>term<strong>in</strong>e thevariation <strong>in</strong> magnitu<strong>de</strong> of measured variables. Data often would be collected <strong>in</strong> cultivatedfields, field bor<strong>de</strong>rs marg<strong>in</strong>s, and/or adjacent ru<strong>de</strong>ral or natural areas for areas adjacent toGMC cultivation, pollen flow and seed dispersal distances will <strong>in</strong>fluence the spatial scale ofmonitor<strong>in</strong>g.d) TEMPORAL SCALEThe duration of PCM should generally be 5 years from time of market release and wi<strong>de</strong>spread cultivation of a GM crop (Kjellsson and Strandberg, 2001).The responsibility ofpossible longer term (5 yrs) PCM to <strong>de</strong>tect potential <strong>in</strong>teractive or cumulative GM crop20
Proceed<strong>in</strong>g of the 4 rd International Symposium“NEW RESEARCH IN BIOTECHNOLOGY” USAMV Bucharest, Romania, 2011specific effects (e.g. <strong>in</strong>vasiveness) should lie with a report<strong>in</strong>g network of tra<strong>in</strong>ed observers.Exist<strong>in</strong>g personnel <strong>in</strong> agriculture (extension specialists), environment and natural resourcemanagement could constitute a report<strong>in</strong>g network after receiv<strong>in</strong>g tra<strong>in</strong><strong>in</strong>g <strong>in</strong> recogniz<strong>in</strong>gspecial ecological effects of GM crops.e) DATA COLLECTIONA plethora of data will be collected from PCM. Quality control is essential <strong>in</strong> data entry,storage compilation and analysis. A common template for standardized data entry us<strong>in</strong>gcommon or comparable database software will facilitate efficient data compilation andmanagement. Graef et al., (2007) stressed data harmonization and coord<strong>in</strong>ation among allstakehol<strong>de</strong>rs for ensur<strong>in</strong>g data quality and comparability. Given the significant costs <strong>in</strong>collect<strong>in</strong>g PCM data, it is imperative that proper checks and balances are <strong>in</strong> place forprofessional data base management.f) DATA ANALYSISBoth univariate and multivariate statistics are employed for data analysis. Because datavariability is <strong>in</strong>heritability greater <strong>in</strong> the field or landscape scale experiments than smallplot research, the type I error rate <strong>in</strong> univariate statistical analysis is generally greater than0.05—typically 0.10-0.20.A statistician specialized <strong>in</strong> analyz<strong>in</strong>g large data sets fromfield/landscape research is an <strong>in</strong>tegral part of the PCM team.g) DATA EVALUATIONAfter the data are statistically analysed a f<strong>in</strong>al report will be written and scientificpublications submitted for peer review. Technology <strong>de</strong>velopers should not be allowed torestrict or impose conditions <strong>in</strong> legally b<strong>in</strong>d<strong>in</strong>g agreements on contents of reports or peerreviewed publications. The full results must be ma<strong>de</strong> available <strong>in</strong> a timely manner to thescientific community and society at large. A transparent system is essential for allay<strong>in</strong>gconcerns that any perceived environmental risks are be<strong>in</strong>g trivialized.THE REGULATORY DECISIONThe results of the data analysis to confirm or refute the hypothesis will dictate the <strong>de</strong>cisionby National Biosafety Committee (NBC). Once a <strong>de</strong>cision is ma<strong>de</strong> it must be conveyed toall stakehol<strong>de</strong>rs particularly farmers via means of mass communication. Once the PCM of aGMC is term<strong>in</strong>ated, a cost benefit analysis conducted by the third party may improve theefficiency and effectiveness of future PCM activities. A mo<strong>de</strong>l monitor<strong>in</strong>g Plan for theEnvironmental management of commercially approved GM crops <strong>in</strong> Pakistan is presentedbelow (figure 1).Sites for the GMC <strong>in</strong>vasiveness would be established <strong>in</strong> all crop grow<strong>in</strong>g areas mostly <strong>in</strong>Punjab and S<strong>in</strong>dh where GMC and non GMC crops are mostly adopted by the farmers. Foreach site, monitor<strong>in</strong>g will term<strong>in</strong>ate at the end of study period. If the effect size wasexceeds at a site; monitor<strong>in</strong>g may cont<strong>in</strong>ue for two more years. The life span of the cropmay <strong>in</strong>fluence the temporal scale of monitor<strong>in</strong>g. In addition, the adoption rate of the GMcrop may also <strong>in</strong>fluence the duration of monitor<strong>in</strong>g. Here a mo<strong>de</strong>l monitor<strong>in</strong>g plan is<strong>de</strong>signed for GM cotton <strong>in</strong> Punjab (table 1).The selection of basel<strong>in</strong>e for comparative risk assessment is important. In case of cottoncrop <strong>in</strong> Pakistan, as the pest control measures are of practical relevance so the consumptionrate of pestici<strong>de</strong>s <strong>in</strong> transgenic versus non transgenic crop cultures can make a basel<strong>in</strong>e as arisk assessment factor.21
22Proceed<strong>in</strong>g of the 4 rd International Symposium“NEW RESEARCH IN BIOTECHNOLOGY” USAMV Bucharest, Romania, 2011
Proceed<strong>in</strong>g of the 4 rd International Symposium“NEW RESEARCH IN BIOTECHNOLOGY” USAMV Bucharest, Romania, 2011National Commission on <strong>Biotechnology</strong> appo<strong>in</strong>ts an aca<strong>de</strong>mic researcher forthis monitor<strong>in</strong>g project and will ma<strong>in</strong>ta<strong>in</strong> liaison with MNCs for exchange of dataand f<strong>in</strong>ancial matters. (The Monitor)Mult<strong>in</strong>ational Company e.g. Pioneer, Monsanto. The Companywill provi<strong>de</strong> major f<strong>in</strong>ancial support for the research as it is themajor recipient of f<strong>in</strong>ancial ga<strong>in</strong>s <strong>in</strong> case of wi<strong>de</strong>spread cultivationof its product over a long time period. The ga<strong>in</strong>s are hefty due to asizeable return on sales. It will also provi<strong>de</strong> facilities for laboratoryanalysis of the collected samples. (The f<strong>in</strong>ancer)Pr<strong>in</strong>cipal Scientific Officer (PSO) ːThe Aca<strong>de</strong>mic from a university e.g.University of Agriculture, Faisalabad; University of Sargodha;Problem formulation and <strong>de</strong>term<strong>in</strong>ation of effect size, spatial andtemporal scale, sampl<strong>in</strong>g plan and selection of variable(s)Field data collection and analysis of samplesStatistical analysis-a specialized statisticianhandles and analyses large data sets.Field Data collection by staff ofExtension W<strong>in</strong>g of AgricultureDepartment of related crop regionLaboratory analysis byresearchers (Public privateuniversities /research <strong>in</strong>stitutes)Evaluation of laboratory results and statistical analysis by pr<strong>in</strong>cipal scientific officerResults, conclusion and recommendationsNCB makes the f<strong>in</strong>al <strong>de</strong>cision on the future cultivation of crop <strong>in</strong> the country or <strong>in</strong>respective region <strong>in</strong> the light of recommendations from PSO. The <strong>de</strong>cision iscommunicated to all stake-hol<strong>de</strong>rs via means of mass communication. It also assessesthe need for further assessment of a particular trait <strong>in</strong> a given GM event.Figure 1: A mo<strong>de</strong>l representation of post commercialization monitor<strong>in</strong>g system for GM crops <strong>in</strong>Pakistan23
24Proceed<strong>in</strong>g of the 4 rd International Symposium“NEW RESEARCH IN BIOTECHNOLOGY” USAMV Bucharest, Romania, 2011Table 1. Post commercialization monitor<strong>in</strong>g system for ERA of GM cotton <strong>in</strong> PakistanNo. Step Description123RiskI<strong>de</strong>ntificationAssessmentEndpo<strong>in</strong>tsEffectDef<strong>in</strong>ition4 Effect sizeIncreased resistance <strong>in</strong> targeted lepidopteransComparison of resistant <strong>in</strong>dividuals’ i.e. lepidopterous larvae feed<strong>in</strong>g on plantparts of IR cotton.Hypothesis: IR cotton provi<strong>de</strong>s LD 99 aga<strong>in</strong>st target <strong>in</strong>sect species.M<strong>in</strong>imum and maximum effect will range from 0.1% to 10 % of the populationsize of the crop plants <strong>in</strong> case of ferals.5 Spatial Scale Cotton grow<strong>in</strong>g belt of Punjab especially Southern Punjab6 Temporal Scale789101112Sampl<strong>in</strong>g PlanVariableSelectionData collectionData AnalysisDataEvaluationRegulatoryDecision13 Communication An optimum size study consists of the m<strong>in</strong>imum number of assessment endpo<strong>in</strong>ts at a given time to make the study economical and time sav<strong>in</strong>g. The studywill focus on one assessment end po<strong>in</strong>t (max.2) at a time and will commenceafter three years of approval for commercial scale cultivation of the GM crop tolet the GM crop plants and their effects assimilate <strong>in</strong>to the local environment <strong>in</strong>a variety of grow<strong>in</strong>g areas. However, <strong>in</strong> case of illegal/unapproved cultivation <strong>in</strong> pockets of crop area, thestudy may beg<strong>in</strong> earlier due to the factors of varied quantity and quality of tox<strong>in</strong>production. At least two crop seasons must go through rigorous assessment. The pr<strong>in</strong>cipal scientific officer will contemplate the sampl<strong>in</strong>g scheme withconsultation of the statistician to arrange the variables and bor<strong>de</strong>r l<strong>in</strong>e of thedata to be collected. 50 sites of GM crop and 50 sites of non-GM cultivation are selected (on anaverage) <strong>in</strong> a prov<strong>in</strong>ce for two years. GM and its comparator will bear the datafor 300 crop years collectively at the end of data collection period. Composite <strong>in</strong><strong>de</strong>x of <strong>in</strong>sect population size <strong>in</strong> each habitat—fled marg<strong>in</strong>s,ru<strong>de</strong>ral areas, undisturbed grassland area. For <strong>in</strong>sect collection, the number of <strong>in</strong>sects on crop plants per 1m 2 r<strong>in</strong>g afterevery 5 meters distance will be counted <strong>in</strong> a representative 1 ha area per oneevaluation site.For <strong>in</strong>sects, the variable is the comparative number of <strong>in</strong>sects per 1 ha. area <strong>in</strong>both crop types.Weather data for each site compiled from the closes meteorological stationFerals: m<strong>in</strong>imum of 25 1-m 2 quadrate measurements <strong>in</strong> each of field.For <strong>in</strong>sects data is collected on weekly basis throughout the grow<strong>in</strong>g season tillmaturity.Analysis of variance us<strong>in</strong>g a mixed mo<strong>de</strong>l, with site and year consi<strong>de</strong>red asrandom effects and treatments as a fixed effect (significance level of P ≤0.10for <strong>in</strong>sects.Repeated measures analysis to <strong>de</strong>tect any changes over time.Means comparison test (t test) to <strong>de</strong>term<strong>in</strong>e if effect size excee<strong>de</strong>d.Data analyzed with<strong>in</strong> farm<strong>in</strong>g system by district and comb<strong>in</strong>ed data set.Determ<strong>in</strong>e the frequency of susceptible and resistant target and non target<strong>in</strong>sects <strong>in</strong> the vic<strong>in</strong>ity.Environmental risk assessment is validated if null hypothesis accepted (effectsize never excee<strong>de</strong>d).Buffer zones are setup <strong>in</strong> districts where the nullhypothesis is rejected (effect size excee<strong>de</strong>d; expand mitigation measure if effectsize is <strong>in</strong>creased <strong>in</strong>to two or more regions over the study period.Decision by the NCB will be communicated to farmers and the public <strong>in</strong>general <strong>in</strong> conjunction with the study participants.
Proceed<strong>in</strong>g of the 4 rd International Symposium“NEW RESEARCH IN BIOTECHNOLOGY” USAMV Bucharest, Romania, 20114. CONCLUSIONSFor the ecological management of the released GM event,there is no official mechanism forsystematic post commercial monitor<strong>in</strong>g of GM crops.It is possible that the unwanted flowof transgenes is <strong>de</strong>tected <strong>in</strong> large scale agriculture that went un<strong>de</strong>tected dur<strong>in</strong>g preapprovalfield trials because the trials are of relatively small scale and have short duration.There aresufficient assessment criteria for new GM crops before their commercialization.But,becasueuncerta<strong>in</strong>ties exist,it is useful to establish some probalistic framework and compareexpected environmental benefits and costs.REFERENCES1. Graef, F., W. Zughart, A. Bezler, F. Berhorn, and U.Sukopp.2007.Monitor<strong>in</strong>ggenetically modified plants (GMP): Data harmonization and coord<strong>in</strong>ation on multiplelevels to ensure data quality and comparability.J.Verbr.Lebensm.2(Suppl.):2-75.2. James C: “Global Status of Commercialized Transgenic Crops. ISAAA Briefs No. 24-2011.” Ithaca: International Service for the Acquisition of Agri-Biotech Applications,2011.3. Kjellsson, G.; Strandberg, M. 2001: Monitor<strong>in</strong>g and surveillance of geneticallymodified higher plants: gui<strong>de</strong>l<strong>in</strong>es for procedures and analysis of environmentaleffects. Basel, Birkhäuser Verlag. 119 p.4. Raybould, A. (2006) Problem formulation and hypothesis test<strong>in</strong>g for environmentalrisk assessment of genetically modified crops. Environmental Biosafety Research5,119-125.5. Snow AA, Andow DA, Gepts P, Hallerman EM, Power A, Tiedje JM, Wolfenbarger LL(2005) Genetically eng<strong>in</strong>eered organisms and the environment: current status andrecommendations. Ecol Appl 15:377–404.25
Proceed<strong>in</strong>g of the 4 rd International Symposium“NEW RESEARCH IN BIOTECHNOLOGY” USAMV Bucharest, Romania, 2011INVESTIGATION OF NEW AGRICULTURAL DECISIONS FOR THEMAINTENANCE OF THE SOIL FERTILITY OF THE VERTISOILIVAN DIMITROV, TOTKA MITOVA, SVILEN RAJKOV, DAFINANIKOLOVA, ROSITSA TONCHEVAUniversity of Shumen “K. Preslavski”, e-mail: rajkov_svilen@abv.bgAbstract. The changes <strong>in</strong> the soil, climatic and economic conditions lead to the application of neweffective <strong>de</strong>cisions for the agricultural activities to full use utilization of the productive potential ofthe cultivated cultures. The new production technologies contribute to the ma<strong>in</strong>tenance of the soilfertility.In the report are treated the results of three years exam<strong>in</strong>ation of technologies for polish production<strong>in</strong> two crop–rotation.It was found out <strong>in</strong> the <strong>in</strong>vestigation that with the apply<strong>in</strong>g of new <strong>de</strong>cisions for the soil cultivationand ma<strong>in</strong>ly for the m<strong>in</strong>eral fertilization the <strong>in</strong>crease of the crop from 13.4 to 17.0% of the cultivatedcultures could be achieved. A ten<strong>de</strong>ncy towards improvement of the values of some of the ma<strong>in</strong>physical and agrochemical parameters of the soil fertility is established.Keywords: soil tillage, fertilization, soil fertility1. INTRODUCTIONThe problem with technology actualization <strong>in</strong> farm<strong>in</strong>g and more specifically <strong>in</strong>gra<strong>in</strong> produc<strong>in</strong>g is current and socially significant. Alternative technological solutionsmeet<strong>in</strong>g the effectiveness criteria – <strong>in</strong>crease of productivity, <strong>de</strong>crease of <strong>in</strong>vestment,rational use of resources and keep<strong>in</strong>g the soil fertility – are a prerequisite for successfulbus<strong>in</strong>ess.The ma<strong>in</strong> solutions for achiev<strong>in</strong>g economic stability <strong>in</strong> gra<strong>in</strong> produc<strong>in</strong>g throughma<strong>in</strong>tenance of soil fertility concern soil treatment as a direct agro technical measure and asa factor, affect<strong>in</strong>g the effectiveness of other farm<strong>in</strong>g practices, the ma<strong>in</strong> one of which isfertilization, and also the means of fight<strong>in</strong>g weeds vegetation. The rationalization of ma<strong>in</strong>agro technical measures allows for fuller use of the reproductive potential of crops grown ata good level of soil fertility.The purpose of this research is to exam<strong>in</strong>e new solutions for application of ma<strong>in</strong>agro technical means – soil treatment, m<strong>in</strong>eral fertilization and the weed control, withwhich a better upkeep of soil fertility <strong>in</strong> leached vertisoil is achieved.2. MATERIAL AND METHODSThis research has been carried out <strong>in</strong> a field experiment set <strong>in</strong> Bozhurishte test<strong>in</strong>gfacility, Sofia District. The scheme of this experiment <strong>in</strong>clu<strong>de</strong>s two crop rotations with thealternation between w<strong>in</strong>ter crops and row crops <strong>in</strong> the first rotation and fused surface crops<strong>in</strong> the second. Three agro technical measures have been studied:26
Proceed<strong>in</strong>g of the 4 rd International Symposium“NEW RESEARCH IN BIOTECHNOLOGY” USAMV Bucharest, Romania, 2011Soil treatment – three soil treatment systems are <strong>in</strong>clu<strong>de</strong>d <strong>in</strong> Table 1, the newsolutions be<strong>in</strong>g: system 1 – l<strong>in</strong>e loosen<strong>in</strong>g at a <strong>de</strong>pth of 15-18cm when row crops aregrown; the second system compares options with simultaneous plow<strong>in</strong>g and harrow tillage,as well as sow<strong>in</strong>g and roll<strong>in</strong>g, with such, where these operations are conducted<strong>in</strong><strong>de</strong>pen<strong>de</strong>ntly.№ Crops yearTable 1. Soil treatment systemsTreatment systemsО 1 О 2 О 31. TriticaleWheat2008-2009 Loosen<strong>in</strong>g12-15cmPlow<strong>in</strong>g15-18 cmDisk plow<strong>in</strong>g10-12 cm2. Corian<strong>de</strong>rCorn2009-2010 Plow<strong>in</strong>g28-30 cmPlow<strong>in</strong>g28-30 cmLoosen<strong>in</strong>g28-30 cm3. Wheat 2010-2011 Disk plow<strong>in</strong>g10-12 cmDisk plow<strong>in</strong>g10-12 cmDisk plow<strong>in</strong>g10-12 cm4. BeansRape2011-2012 Loosen<strong>in</strong>g20-25 cmPlow<strong>in</strong>g20-25 cmLoosen<strong>in</strong>g20-25 cmFertilization – non-fertilized options Т0 and agro chemically tested for fertilizationrate soil samples have been compared. At an equal rate of fertilization the follow<strong>in</strong>g optionswere tested: Т1/ fertilization with ammonium nitrate, superphosphate and potassiumsulphate; Т2/ fertilization with ammonium nitrate, foliar fertilizer with 30% nitrogen, 1/5 ofthe quantity nee<strong>de</strong>d for feed<strong>in</strong>g up, amophos and potassium sulphate. The potassiumfertilizer is <strong>in</strong>troduced dur<strong>in</strong>g the first crop rotation <strong>in</strong> the first year for wheat and dur<strong>in</strong>gthe second <strong>in</strong> the second year for corn.Weed control – <strong>in</strong>clu<strong>de</strong>s options with <strong>in</strong>tegrated control, us<strong>in</strong>g different chemicalsubstances.The soil of the test<strong>in</strong>g area is leached vertisol, a typical representative of the heavyk<strong>in</strong>d – physical clay content 78-80% and il content 62%. Soil is medium humus 3.5,characterized by high bufferity and plasticity. Despite of that, signs of over<strong>de</strong>nsification ofthe un<strong>de</strong>r-plow<strong>in</strong>g layer are present.3. RESULTS AND DISCUSSIONSSoil fertility is i<strong>de</strong>ntified with the conditions of nutrition of crops. Some physicalfactors which affect the <strong>de</strong>velopment of the root system also play an important role.Solutions <strong>in</strong> soil treatment ma<strong>in</strong>ly affect the structural condition, the water supply, thevolumetric <strong>de</strong>nsity and the firmness of the soil.The structural analysis of the soil shows that mostly <strong>in</strong> dry siev<strong>in</strong>g the aggregatesare of a size > 1 mm. The structural aggregates are waterproof but with a very firmcomposition. With <strong>de</strong>pth <strong>in</strong>crease, the fraction of the smallest aggregates <strong>de</strong>creases <strong>in</strong> dryas well as wet siev<strong>in</strong>g. After water saturation about a third of the aggregates sized > 1mmare left <strong>in</strong> the 30-40 cm layer.The content of soil moisture is a ma<strong>in</strong> physical parameter, which <strong>de</strong>f<strong>in</strong>es thedynamics of processes tak<strong>in</strong>g place <strong>in</strong> the soil, the liv<strong>in</strong>g conditions for beneficial27
Proceed<strong>in</strong>g of the 4 rd International Symposium“NEW RESEARCH IN BIOTECHNOLOGY” USAMV Bucharest, Romania, 2011organisms <strong>in</strong> it, as well as germ<strong>in</strong>ation, growth and <strong>de</strong>velopment of crops grown. No<strong>in</strong>fluence on the soil moisture level has been registered by the applied treatments.The comparative analysis of data shows that when comb<strong>in</strong><strong>in</strong>g the plow<strong>in</strong>g and theharrow tillage and the sow<strong>in</strong>g with roll<strong>in</strong>g, the pressure on soil’s top layer is <strong>de</strong>crease,which expresses itself <strong>in</strong> the <strong>de</strong>crease of volumetric <strong>de</strong>nsity by 0.02-0.035 g/cm 3 , and of thefirmness by 8,5 to 11, 7 kg/cm 2 . The reported differences by options of treatment aresharper <strong>in</strong> the corn test area <strong>in</strong> the 10-20 cm layer – up to 0,13 g/cm 3 , which is due to thecompaction action of the wheels of aggregates dur<strong>in</strong>g pre-sow<strong>in</strong>g treatment. Exam<strong>in</strong>ationof ma<strong>in</strong> physical <strong>in</strong>dicators <strong>in</strong> corn shows that conduct<strong>in</strong>g of <strong>in</strong>tercrops loosen<strong>in</strong>g helpskeep<strong>in</strong>g their values with<strong>in</strong> optimum. Figures 1 and 2 show the values of volumetric<strong>de</strong>nsity, which <strong>in</strong> the option with <strong>in</strong>tercrops loosen<strong>in</strong>g for plow<strong>in</strong>g layer 0-30cm are lowerby 0.023 g/cm 3 <strong>in</strong> comparison to the cultivation plots.Figures 1, 2. Volumetric <strong>de</strong>nsity of soil <strong>in</strong> g/cm 3 when grow<strong>in</strong>g corn28
Proceed<strong>in</strong>g of the 4 rd International Symposium“NEW RESEARCH IN BIOTECHNOLOGY” USAMV Bucharest, Romania, 2011The firmness of soil before ear formation of wheat <strong>de</strong>creases its values by anaverage of 20 kg/cm 2 , while the plots with Triticale keep theirs <strong>in</strong> the same range. Theoption with disk plow<strong>in</strong>g of wheat reads higher values for layers 10-20cm and 30-40cm,while the plot with Triticale shows higher firmness of the options with plow<strong>in</strong>g – up to100,80 kg/cm 2 . Firmness of soil has values that are not critical for root system <strong>de</strong>velopmentof the crops grown dur<strong>in</strong>g the second year. Before corian<strong>de</strong>r flower<strong>in</strong>g, the values of thissoil parameter <strong>in</strong>crease with an average of 15 kg/cm 2 , while the plots with corn, the soilkeeps its firmness with<strong>in</strong> the same range.The total porosity of the vertisols has values that are lower than these, establisheddur<strong>in</strong>g optimum condition of the soil. In the shallow layers of the soil this <strong>de</strong>crease isma<strong>in</strong>ly at the expense of coarse pores with equivalent diameter >200µ. The share of f<strong>in</strong>epores <strong>in</strong>creases, as well as the difficult to access water, conta<strong>in</strong>ed <strong>in</strong> them.From the analysis of the ma<strong>in</strong> parameters <strong>de</strong>f<strong>in</strong><strong>in</strong>g the physical characteristics ofsoil diversity – leached vertisol, one can establish that moisture, volumetric <strong>de</strong>nsity andfirmness have values that is good from the agro technical po<strong>in</strong>t of view and does not limitthe <strong>de</strong>velopment and functions of plants’ root system.The agro chemical analysis found that the m<strong>in</strong>eral nitrogen content is low, with avariation of data present <strong>in</strong> the respective samples. Although oat was sown as anequalization crops, no complete equalization of the area’s agro chemical parameters wasachieved, due to the many years of experimental options applied to the fertilization levels.The content of mobile forms of nitrogen, which <strong>in</strong> the output samples was 3,0-7,4 mg/kgsoil for the test area of the first and respectively 3,9-5,5 mg/kg soil for the area of thesecond crop rotation, as a result of the m<strong>in</strong>eral fertilization <strong>in</strong> the phase of ear formation ofthe crops is with a higher level. With wheat <strong>in</strong> the 0-20 cm layer for the fertilization optionsa m<strong>in</strong>eral nitrogen content of 9,7-12,9 mg/kg soil is registered, and with Triticale - 13,2-19,7 mg/kg soil. In the 20-40 cm layer these values for nitrogen are lower. There is noregistered concord of data for options only fertilized with ammonium nitrate and thosefertilized with liquid fertilizer <strong>in</strong> the tiller<strong>in</strong>g and sp<strong>in</strong>dl<strong>in</strong>g phases. Higher content of thearea with Triticale is expla<strong>in</strong>ed by the lesser number of plants per unit area and accord<strong>in</strong>glyweaker absorption by plants. Data analysis shows a slight ten<strong>de</strong>ncy of <strong>in</strong>creas<strong>in</strong>g ofassimilable phosphorous when fertiliz<strong>in</strong>g with amophos compared to fertiliz<strong>in</strong>g with triplesuperphosphate. From the analysis of soil samples taken dur<strong>in</strong>g ear formation of the crops,we have established an <strong>in</strong>crease of soluble potassium by 3-6 mg/100g soil <strong>in</strong> the optionsfertilized with potassium sulphate.With corn <strong>in</strong> the 0-20 cm layer a content of m<strong>in</strong>eral nitrogen of 10,3-16,1 mg/kgsoil was read, and with corian<strong>de</strong>r 13,9-22,4 mg/kg soil respectively. In the 20-40 cm layerthe values of nitrogen are lower. For corn options fertilized only with ammonium nitrateand those fertilized with foliar fertilizer <strong>in</strong> phases 5 leafs and 9-10 leafs. Higher content ofthe area with Triticale is expla<strong>in</strong>ed by the lesser number of plants per unit area andaccord<strong>in</strong>gly weaker absorption by plants. Data analysis shows a slight ten<strong>de</strong>ncy of<strong>in</strong>creas<strong>in</strong>g of assimilable phosphorous when fertiliz<strong>in</strong>g with amophos compared tofertiliz<strong>in</strong>g with triple superphosphate. Potassium content is satisfactory and for the plow<strong>in</strong>glayer it’s <strong>in</strong> the 26.0 – 38.0 mg/100g soil boundaries. From the analysis of soil samplestaken dur<strong>in</strong>g gather<strong>in</strong>g of the crops, we have established an <strong>in</strong>crease of soluble potassium <strong>in</strong>the options fertilized with potassium sulphate.29
Proceed<strong>in</strong>g of the 4 rd International Symposium“NEW RESEARCH IN BIOTECHNOLOGY” USAMV Bucharest, Romania, 2011A cumulative expression of the effect of applied production technology is thequantity of production. Relatively low yield has been gathered <strong>in</strong> the fertilized options butcompared to the average for the region they are higher, especially with wheat. Figure 2shows that compared to the non-fertilized options (<strong>in</strong> the cont<strong>in</strong>uation of 20 years), thefertilized plots have provi<strong>de</strong>d a satisfactory yield. Results from dispersion analysis forwheat show that the treatment system has no statistically significant impact on yields. Theonly statistically proven fact is the effect of fertilization (at a level of probability p
Proceed<strong>in</strong>g of the 4 rd International Symposium“NEW RESEARCH IN BIOTECHNOLOGY” USAMV Bucharest, Romania, 2011Directions, which can be sought for efficient production, are ma<strong>in</strong>ly related to theeconomiz<strong>in</strong>g of production and streaml<strong>in</strong><strong>in</strong>g of costs.Figure 5. Corn yields <strong>de</strong>pend<strong>in</strong>g on the mid-l<strong>in</strong>e treatment4. CONCLUSIONSThis experiment <strong>de</strong>term<strong>in</strong>ed that the application of new solutions of soil treatmentand ma<strong>in</strong>ly of m<strong>in</strong>eral fertilization, one can achieve an <strong>in</strong>crease of yield of 13.4 to 17.0% ofcrops grown. The exchange of part of the ammonium nitrate, <strong>in</strong>ten<strong>de</strong>d for nutrition with adouble <strong>in</strong>troduction of foliar fertilizer, as well as the usage of amophos as a phosphatefertilizer, <strong>in</strong>crease the productiveness of crops grown on leached vertisol.A ten<strong>de</strong>ncy of improvement of the values of some of the ma<strong>in</strong> physical and agrochemical parameters of soil fertility has been found.REFERENCES1. Dimitrov I., T. Mitova. (1997). Effects of soi ltreatment systems and fertilization on theproductivity of crop rotations at ra<strong>in</strong>fed conditions. Crop Science, 34(9-10), 65-69.2. Dimitrov I., Borisov P. 2005. Changes <strong>in</strong> acidity of some soil types <strong>de</strong>pend<strong>in</strong>g on the soil treatmentsystems. “Management, usage and protection of soil resources” Conference, Sofia, 219-221.3. F. Dimitrova, Borisova M. (2007). Agro chemical aspects of soil fertility at cont<strong>in</strong>uous m<strong>in</strong>eralfertilization. Scientific reports, “Pedology – the basis of susta<strong>in</strong>able farm<strong>in</strong>g and environmentalprotection” International Conference, Sofia, 324-327.4. Pachev I., Y. Nay<strong>de</strong>nova, I. Dimitrov (2006). Influence of soil cultivation and fertilization on yieldand digestibility of forage alfalfa. Pedology, agro chemistry and ecology, №1, 57-60.5. Dimitrov I., Koutev V., Borissov P. 2001. Changes <strong>in</strong> organic nitrogen content <strong>in</strong> soil <strong>de</strong>pend<strong>in</strong>g ofdifferent tillage and fertiliz<strong>in</strong>g systems. 11 th NITROGEN WORKSHOP, INRA, Reims,France, 287-289.6. Convert<strong>in</strong>i, G. at all. (1997). Comparison among soil tillage methods <strong>in</strong> southern Italy: Effects onagronomical responses and soil properties. Proceed<strong>in</strong>gs of 14 th ISTRO Conference, Pulawy,Poland, t. 2A, 155-158.31
Proceed<strong>in</strong>g of the 4 rd International Symposium“NEW RESEARCH IN BIOTECHNOLOGY” USAMV Bucharest, Romania, 20117. Torbert, H.A., K. N. Potter and J.E. Morrison. (2006).Tillage system and fertilizer N effect on gra<strong>in</strong>sorghum and wheat yields <strong>in</strong> the Texas black land prairie. Proceed<strong>in</strong>gs of 17 th ISTRO Conference,Kiel, Germany.32
Proceed<strong>in</strong>g of the 4 rd International Symposium“NEW RESEARCH IN BIOTECHNOLOGY” USAMV Bucharest, Romania, 2011ТECHNOLOGICAL EVALUATION OF THE USED SIDERATES WITHAN ALTERNATIVE BIOTECHNOLOGICAL METHOD OF RE-CULTIVATIONIVAN DIMITROV, TOTKA MITOVA, SVILEN RAYKOV, IVAN PACHEVUniversity of Shumen “K. Preslavski”, e-mail: rajkov_svilen@abv.bgAbstract. The alternative biotechnological method is based on the usage of green fertilization as asource for accumulation of organic mass, nee<strong>de</strong>d for the process of humification. With it, however,the construction of correct crop rotations is accompanied by many problems. The ma<strong>in</strong> requirementis that more mo<strong>de</strong>st cultures are grown, <strong>de</strong>velop<strong>in</strong>g <strong>in</strong> poor and unstructured soils with a poor waterand air regime (2, 3, 4, 5.) The number of treatments is reduced to the possible limit so that theprocesses of <strong>de</strong>nsification and <strong>de</strong>nitrification are limited. This, on its part, strongly narrows thespecies composition of the cultures (1, 4.)The purpose of this research is to reach a quick accumulation of organic matter <strong>in</strong> the newly-formedsubstrates and appropriate soil conditions for the grow<strong>in</strong>g of si<strong>de</strong>rate cultures <strong>in</strong> a compactedsuccession of crops.Keywords: re-cultivation, si<strong>de</strong>rates, biomass, organic matter1. INTRODUCTIONThe alternative biotechnological method is based on the usage of greenfertilization as a source for accumulation of organic mass, nee<strong>de</strong>d for the process ofhumification. With it, however, the construction of correct crop rotations is accompanied bymany problems. The ma<strong>in</strong> requirement is that more mo<strong>de</strong>st cultures are grown, <strong>de</strong>velop<strong>in</strong>g<strong>in</strong> poor and unstructured soils with a poor water and air regime (2, 3, 4, 5.) The number oftreatments is reduced to the possible limit so that the processes of <strong>de</strong>nsification and<strong>de</strong>nitrification are limited. This, on its part, strongly narrows the species composition of thecultures (1, 4.)2. МATERIAL AND METHODSIn a field experiment on an area of 1 ha <strong>in</strong> a heap Mednikarovo <strong>in</strong> the area ofm<strong>in</strong>es Maritsa-East, four soil substrates were tested by application of non-humus recultivationtechnology:1. Sediments of yellow-green and grey-green clays;2. Sediments + 700 m 3 /ha soil from humus horizon on leached vertisol;3. Sediments + 700 m 3 /ha soil from humus horizon + 500 m 3 /ha ash;4. Sediments + 500 m 3 /ha ash.In a compacted three-field succession of crops: I year – w<strong>in</strong>ter forage pea + Sudangrass; II year – w<strong>in</strong>ter pea + barley (mix) + Sudan grass; III year – wheat, the follow<strong>in</strong>gtreatments were applied (Table 1):33
Proceed<strong>in</strong>g of the 4 rd International Symposium“NEW RESEARCH IN BIOTECHNOLOGY” USAMV Bucharest, Romania, 2011Table 1. SOIL TILLAGE SYSTEMSCropsTechnology operationsAutumn Pre sow<strong>in</strong>g Complementary1. W<strong>in</strong>ter peas 1.Plow<strong>in</strong>g 23-25 cm Disk plow<strong>in</strong>g 8-10 cm Disk plow<strong>in</strong>g 10-12 cm2002/2003 Sept.-2002 г Disk plow<strong>in</strong>g 6-8 cm(sole)2. Sudan grass 2.Plow<strong>in</strong>g 16-18 cm Cultivation 6-8 cm Roll<strong>in</strong>g after sow<strong>in</strong>g2003May- 2003 г Disk plow<strong>in</strong>g 6-8 cm3. Peas + barley 3. Plow<strong>in</strong>g 20-22 cm Disk plow<strong>in</strong>g 6-8 cm Roll<strong>in</strong>g after sow<strong>in</strong>g2003/2004 г Sept. 2004 гtwice4. Sudan grass 4. Plow<strong>in</strong>g 16-18 cm Cultivat<strong>in</strong>g 6-8 cm Roll<strong>in</strong>g after sow<strong>in</strong>g2004 гMay 2004twice5. Wheat 5.Plow<strong>in</strong>g 18-20 cm Disk plow<strong>in</strong>g 10-12 cm Roll<strong>in</strong>g after sow<strong>in</strong>g2004/2005 г July 2005 Disk plow<strong>in</strong>g 6-8 cmThe amount of crop and root residues from green fertilization is <strong>de</strong>f<strong>in</strong>ed us<strong>in</strong>g themeters method, accord<strong>in</strong>gly 1 m 2 and 0.25 m 2 .The air temperature does not <strong>de</strong>viate substantially from average from previousyears. The amount of ra<strong>in</strong>fall is <strong>de</strong>scribed <strong>in</strong> Fig. 1. From the data one can conclu<strong>de</strong> that thew<strong>in</strong>ter crops are guaranteed enough water from ra<strong>in</strong>fall, and the vegetation of Sudan weedgoes with a substantial sole moisture <strong>de</strong>ficit.343. RESULTS AND DISCUSSION
Proceed<strong>in</strong>g of the 4 rd International Symposium“NEW RESEARCH IN BIOTECHNOLOGY” USAMV Bucharest, Romania, 2011The implementation of the adopted soil tillage system met serious difficulties fromthe very beg<strong>in</strong>n<strong>in</strong>g. Dur<strong>in</strong>g the autumn of 2002 because of poor content of moisture <strong>in</strong> thesoil and the big compact<strong>in</strong>g of area / 1.75 – 1.90 g/сm 3 / as a result of meliorative worksand embankment of substrates, the necessary <strong>de</strong>pth of tillage could not be reached andtherefore, neither could the homogeneous mix<strong>in</strong>g of the components. With its meliorativerole, the w<strong>in</strong>ter forage pea showed extremely high technological qualities and adaptabaility,given the relative unfavorable soil conditions. Other than the not-so-good pre-sow<strong>in</strong>gpreparation of the soil and the low content of organic matter, another limitary factor was thehigh <strong>de</strong>nsity of the sow<strong>in</strong>g layer, because of which the roots of the pea were placed ma<strong>in</strong>ly<strong>in</strong> the 0-20 сm layer, and un<strong>de</strong>r that <strong>de</strong>pth only separate roots. The total quantity of thereceived by the soil absolutely dry biomass /Table 2/ is significant, especially <strong>in</strong> option 3,where it reaches 5650 kg/ha. The bio productivity of peas, grown as a separate culture isbest expressed <strong>in</strong> option 3 with component humus soil material and ash. Its analog, option2, <strong>in</strong> which there is no ash, has 16% less bio mass. Despite of the found lodg<strong>in</strong>g of the crop,the plant <strong>de</strong>bris were very well m<strong>in</strong>ced and distributed across the test area, us<strong>in</strong>g the rotorsilage harvester – KIR – 1.5.Table 2. BIOMAS CONTRIBUTION TO THE SOILS(aboveground residues + root residues abs. dray mass kg/ha)TreatmentsYears Crops 1 2 3 42003 Peas 3190 4770 5650 3310Sudan grass 15400 10740 10910 83102004 Peas barley mix 2790 5510 7670 4540Sudan grass 6930 8030 7070 4070Total 28310 29050 31300 20230Peas F=14.34 F crit=4.06 Sudan grass F=44.94 Fcrit=4.06p=0.001p=0.00002For the grow<strong>in</strong>g of the w<strong>in</strong>ter peas + barley mix, a quality pre-sow<strong>in</strong>g preparationof the soil and even sow<strong>in</strong>g were carried out. The climate conditions were very suitable andan optimum <strong>de</strong>nsity and height of 80cm were reached <strong>in</strong> the options with addition of humussoil to the substrates. The received quantity of biomass is highly <strong>de</strong>pendable on the type ofsoil substrate. It is almost three times lower <strong>in</strong> option 1 compared to option 3. Theimproved soil conditions – dra<strong>in</strong>age and aeration <strong>in</strong> option 3 have given the w<strong>in</strong>ter peas andbarley the opportunity to show their full productive potential.The results from two years of grow<strong>in</strong>g Sudan grass show that it is a veryappropriate crop as a source of humus formation, given the xerophytic properties of thearea. Dur<strong>in</strong>g the first year the ma<strong>in</strong> limit<strong>in</strong>g factor for productivity was the prolongeddrought period. As a result the crop was un<strong>de</strong>r-trimmed, the yield be<strong>in</strong>g a function only ofthe number of plants - R 2 =+0.86. This shows that wherever the crop was trimmed enough,the reserve of spr<strong>in</strong>g moisture <strong>in</strong> the soil was used and therefore the yield is highest Option1(Table 2). Dur<strong>in</strong>g the second year of grow<strong>in</strong>g Sudan grass, a significantly lower yield ofbiomass was received, because of poor soil preparation due to worsened weatherconditions. Unlike the peas, the Sudan grass adapts better to substrates not conta<strong>in</strong><strong>in</strong>g ash,which could be expla<strong>in</strong>ed by the clay soils’ ability to hold the scarce soil moisture dur<strong>in</strong>g35
Proceed<strong>in</strong>g of the 4 rd International Symposium“NEW RESEARCH IN BIOTECHNOLOGY” USAMV Bucharest, Romania, 2011the crop’s vegetation for longer periods of time. The biomass yield from Opt. 1 exceeds by24.2% and 80.4% received from Options 3 and 4.The wheat yield from the third year of the crops succession is the end assessmentof the technological aptitu<strong>de</strong> of the si<strong>de</strong>rate crops grown. The actual yield and theaccounted biological yield of wheat are shown <strong>in</strong> Table 3. Despite the fact that Sudan grassis known to be an <strong>in</strong>appropriate pre<strong>de</strong>cessor of wheat, dur<strong>in</strong>g this experiment the wheatyield was above 4000 кg/hа. This speaks of a significant effectiveness of the technologyapplied dur<strong>in</strong>g biological re-cultivation. From this fact we can <strong>de</strong>rive that the adverseeffects of the pre<strong>de</strong>cessor can be overcome by keep<strong>in</strong>g the С:N ration lower than 25 bya<strong>de</strong>quate m<strong>in</strong>eral fertilization.Table 3. Wheat yield 2005Treatments Biologic yield Real yieldg/m 2 kg/ha kg/ha1 434.3 4340 40002 475.3 4750 41703 491.7 4920 42504 436.3 4360 36704. CONCLUSIONSThe full technological evaluation of the aptitu<strong>de</strong> of grown as si<strong>de</strong>rates crops, givesthe grounds to consi<strong>de</strong>r that grow<strong>in</strong>g w<strong>in</strong>ter forage peas and Sudan grass <strong>in</strong> a compactedcrops rotation is absolutely successful <strong>in</strong> the humus-free biological method of recultivation.Crops show their biological potential very well and give high biomass yields.By grow<strong>in</strong>g si<strong>de</strong>rate crops, a fast pace of organic matter accumulation <strong>in</strong> the soil is reachedand this guarantees the successful <strong>de</strong>velopment of follow<strong>in</strong>g crops. Except for the specificclimatic conditions dur<strong>in</strong>g crops vegetation, another very important factor is observation ofagro technical requirements <strong>in</strong> production. An omission of any of the nee<strong>de</strong>d agro technicaloperations is a significant risk to the crops grow<strong>in</strong>g.REFERENCES1. Dovban K.I. 1990. Zelenoe udobrenie V/O Agropromizdat.2. Zheleva E. and team. 1998. A complex evaluation of the results of biological recultivation<strong>in</strong> Maritsa Iztok m<strong>in</strong>es. Miproekt Fund EAD/NIS – LTU, Sofia.3. Treykyashki P., B. Hristov, 1982. Re-cultivation of disturbed lands for farm<strong>in</strong>g.Farm<strong>in</strong>g, № 1, 53-56.4. Agboola A. A. 1975. Problems of improv<strong>in</strong>g soil fertility by the use of green manur<strong>in</strong>g.In Soil Bullet<strong>in</strong> 27 FAO, pp 147-165.5. Darmer G. 1991. Landscape and surface m<strong>in</strong><strong>in</strong>g: Ecological gui<strong>de</strong>l<strong>in</strong>es forreclamation. Norman L. Dietrich NY.36
Proceed<strong>in</strong>g of the 4 rd International Symposium“NEW RESEARCH IN BIOTECHNOLOGY” USAMV Bucharest, Romania, 2011STUDY OF THE SEED MICRO FLORA IN WHEAT AND BARLEYGROWN IN ENVIRONMENTALLY FRIENDLY CONDITIONSMARIELA GEORGIEVA-ANDREEVA, SVILEN RAYKOV, KRASIMIRA TANOVAUNIVERSITY OF SHUMEN “EPISKOP KONSTANTIN PRESLAVSKI”rajkov_svilen@abv.bgAbstract. By the method of placement <strong>in</strong> Chapek environment, 40 samples of wheat and barley grown<strong>in</strong> environmentally friendly and conventional agriculture conditions are set.The total contam<strong>in</strong>ation of samples has been <strong>de</strong>term<strong>in</strong>ed and fungi have been isolated <strong>in</strong> cleanenvironment and have been <strong>de</strong>f<strong>in</strong>ed by species. The mycological analysis showed that the follow<strong>in</strong>gspecies of fungi are found: Fusarium, Alternaria, Mucor, Penicillium, Helm<strong>in</strong>thosporium,Cladosporium,Botrytis and Rhizopus. In the makeup of the sem<strong>in</strong>al micro flora, the percentage offungi species Fusarium (53%) and Alternaria (32%) is significantly higher compared to that of theother species.The average percent of contam<strong>in</strong>ation <strong>in</strong> seeds is higher <strong>in</strong> these samples than <strong>in</strong> cultures grownconventially. Seeds from the conventional field have stronger Fusarium fungi <strong>in</strong>fection, and thematerials from the ecological field have stronger Alemaria <strong>in</strong>fection.Keywords: wheat, barley, fungi, micro flora, seeds1. INTRODUCTIONProblem <strong>in</strong> ecologically clean foods and feed production is current on a global scale.Technology for conventional agricultural production used by now, lead<strong>in</strong>g to a high<strong>in</strong>crease of productivity is connected to a high <strong>de</strong>gree of pollution, disruption of naturalfunctions and ecosystem <strong>in</strong>tegrity, and above all leads to the loss of enormous quantities ofnon-renewable energy (Knauer.N.1993;Spedd<strong>in</strong>g,C.R.W.,1988).Methods of plant protection had the biggest impact on ecosystems, primarily – the chemicalmethod, which led to mobilization of genetic volatility of harmful species and <strong>in</strong>creased theeffect of the pestici<strong>de</strong> “boomerang” (Stancheva, 1999;).As an answer to these negative processes <strong>in</strong> agronomy, alternative systems of agriculturalproduction were created and <strong>de</strong>veloped. Bulgaria, as a part of Europe, is a part of theseproblems. 90% of the area <strong>in</strong> the country are suitable for the production of ecological foodsand by 2013 a sharp <strong>in</strong>crease of areas for biological production is expected.Cereal cultures are of the most important species that are be<strong>in</strong>g grown biologically.Their grow<strong>in</strong>g <strong>in</strong> ecologically friendly conditions requires the <strong>de</strong>velopment of a technology,comb<strong>in</strong><strong>in</strong>g stable methods of production (crop rotations, mechanical treatment, susta<strong>in</strong><strong>in</strong>gof soil fertility by fertilization with manure and plow<strong>in</strong>g of crop residues, biological controlof pests).Benign and healthy seeds are nee<strong>de</strong>d for susta<strong>in</strong>able yields and quality crops of cereal foodsand feed, as a great part of the seed transmitted pathogens can provoke rott<strong>in</strong>g, <strong>de</strong>crease <strong>in</strong>germ<strong>in</strong>ation, and <strong>in</strong> later stages – systematic <strong>in</strong>fections that can <strong>de</strong>stroy big parts of thecrops (Bateman, GL and H. Kwasna. 1999., Chong, LM and JE Sheridan. 1982., Glazek,М. 1997., Kubiak K. and M. Korbas.1999.).37
Proceed<strong>in</strong>g of the 4 rd International Symposium“NEW RESEARCH IN BIOTECHNOLOGY” USAMV Bucharest, Romania, 2011In conventional production, seed pathogens are controlled by fungici<strong>de</strong>s but <strong>in</strong> bio-farm<strong>in</strong>gno effective methods of control are <strong>de</strong>f<strong>in</strong>ed. This requires the study of seed pathology <strong>in</strong>different ways of cultivat<strong>in</strong>g the crop <strong>in</strong> or<strong>de</strong>r to establish methods of biological controlaga<strong>in</strong>st phytopathogenic seed parasites.382. MATERIAL AND METHODSThis experiment has been carried out <strong>in</strong> the Plant Protection Laboratory ofAgricultural Institute <strong>in</strong> Shumen.Test subjects were wheat and barley seeds harvested <strong>in</strong> 2006, 2007, 2008 and 2009 fromthe <strong>in</strong>stitute’s experimental fields, where two six-pole crop rotation fields were set up withcereal and gra<strong>in</strong> legumes, grown by two different technologies – eco-friendly andconventional.The eco-field was fertilized only with manure and no pestici<strong>de</strong>s dur<strong>in</strong>g vegetation wereapplied. If nee<strong>de</strong>d, the application of harmless for the useful micro flora and entomofaunamedic<strong>in</strong>es is allowed, <strong>in</strong>clu<strong>de</strong>d <strong>in</strong> the so called “Green list”.With cultures grown by conventional technology, the field is fertilized with m<strong>in</strong>eralfertilizers and pestici<strong>de</strong> treatment is used aga<strong>in</strong>st sicknesses and verm<strong>in</strong>s.Those two fields were created on an i<strong>de</strong>ntical soil type with similar parameters fornutrient reserves. Soil <strong>in</strong> test<strong>in</strong>g fields is carbonate black soil with high humus content <strong>in</strong>the plow<strong>in</strong>g layer (3,7 – 3,74%) and weak alkali reaction (pH 7,7 – 8,1).Materials for phytopathological analysis of crops grown <strong>in</strong> eco-friendly conditionsand by conventional technology were <strong>in</strong>clu<strong>de</strong>d <strong>in</strong> the tests.Seed analysis was carried out by the method of placement <strong>in</strong> Chapek environment,100 seeds for phytopathological evaluation be<strong>in</strong>g set from all four options (wheat andbarley from the eco-field and wheat and barley from the conventional field).After a 7 days cultivation period <strong>in</strong> a thermostat at t 24-26 0 C pure cultures have beenisolated from the test plates from the conventional methods and the pathogens <strong>in</strong> sampleshave been <strong>de</strong>f<strong>in</strong>ed.The count of <strong>in</strong>fected seeds for different species of fungi has been reported <strong>in</strong> %and the statistic process<strong>in</strong>g has been carried out by the Mudra (1958) method.3. RESULTS AND DISCUSSIONSAfter the mycological analysis it was <strong>de</strong>term<strong>in</strong>ed that microscopic fungi of thefollow<strong>in</strong>g 8 species are present <strong>in</strong> tested samples –Fusarium, Alternaria, Mucor,Penicillium, Botrytis, Cladosporium, Rhizopus and Helm<strong>in</strong>thosporium.Fig. 1 shows the average percentage of contam<strong>in</strong>ation of seeds with the accord<strong>in</strong>g fungi.It stands out that <strong>in</strong> the composition of seed micro-flora, the percentage of Fusariumfungi (53%) and Alternaria fungi (32%) is significantly higher than that of other fungi(Mucor, Penicillium, Botrytis, Cladosporium,Rhizopus and Helm<strong>in</strong>thosporium ), whosepercent of contam<strong>in</strong>ation varies <strong>in</strong> a narrow range (1%-6%). Similar results are reported byother authors study<strong>in</strong>g the seed pathology <strong>in</strong> wheat and barley (Valcheva, A., 2006;Karadjova, I., 1979; Ivanov, M., 1980), who f<strong>in</strong>d highest percentage fungal <strong>in</strong>fection withspeciesFusarium and Alternaria.
Proceed<strong>in</strong>g of the 4 rd International Symposium“NEW RESEARCH IN BIOTECHNOLOGY” USAMV Bucharest, Romania, 2011Fig. 2 shows the ratio of different k<strong>in</strong>ds of Fusarium species <strong>in</strong> samples. The highesttotal percentage is that of seeds contam<strong>in</strong>ated with F.gram<strong>in</strong>earum (50%), followed byF.moniliforme (36%) and F.oxysporum (14%) which shows that among fungi of Fusariumspecies on barley and wheat grown <strong>in</strong> North-East Bulgaria, most common areF.gram<strong>in</strong>earum.These results differ from Valcheva’s (studied fusariosis on those sameplants <strong>in</strong> North-West Bulgaria), where for the period 1994-2004 she has found a greaterpercentage of contam<strong>in</strong>ation with F.moniliforme.Table 1 shows the mycological status and the total percentage of <strong>in</strong>fected wheat and barleyseeds from the eco- and the conventional fields dur<strong>in</strong>g the period 2006-2009.Data shows that fungiAlternaria and Fusarium are noted <strong>in</strong> different quantities <strong>in</strong> allsamples from both crops <strong>in</strong> separate years. Most <strong>in</strong>fected with Fusarium fungi are materialsharvested from the conventional field (average wheat – 34%, and barley – 16,5%). Seeds<strong>in</strong>fected by Alternaria can be found <strong>in</strong> larger quantities <strong>in</strong> the eco-field (average wheat –18,5% and barley – 16,5%).The presence of the so called “storage fungi” <strong>in</strong> the complex of seed parasites (Mucor andPenicillium) is weak (average 0,5 – 3%) and no significant differences are found <strong>in</strong> separatecrops, as well as the same crops, cultivated <strong>in</strong> different conditions.Microscopic fungi from the species Botrytis are <strong>de</strong>tected only <strong>in</strong> wheat samples from theeco-field, and species Cladosporium and Rhizopus are isolated only <strong>in</strong> barley samples,grown by conventional technology.Seed <strong>in</strong>fection with pathogens from species Helm<strong>in</strong>thosporium is registered <strong>in</strong> very smallquantities (1,5 – 1,75%) <strong>in</strong> analyzed materials from the conventional field.Table 2 shows data from statistical process<strong>in</strong>g and compares results from thephytopathological analysis of both crops – wheat and barley grown by the eco- andconventional technologies regard<strong>in</strong>g the total contam<strong>in</strong>ation of their seeds with fungi fromthe species Alternaria and Fusarium dur<strong>in</strong>g the four-year period of the study.Analysis shows that there is a proven difference <strong>in</strong> resistance aga<strong>in</strong>st seed pathogens fromthe species Fusarium of wheat and barley grown <strong>in</strong> eco-conditions.With conventionally grown barley, fungi from the species Alternaria have a proven strongerparticipation <strong>in</strong> samples, and <strong>in</strong> eco-wheat this difference is very well <strong>in</strong>sured.4. CONCLUSIONS- The percentage of fungi of the species Fusarium (53%) and Alternaria (32%) <strong>in</strong>seed micro-flora is significantly higher than that of other fungi (Mucor, Penicillium,Botrytis, Cladosporium, Rhizopus and Helm<strong>in</strong>thosporium ), whose percentage ofcontam<strong>in</strong>ation varies <strong>in</strong> a narrow range (1%-6%).- From fungi of the species Fusarium the highest percentage of <strong>in</strong>fected seeds is that withF.gram<strong>in</strong>earum (50%), followed by F.moniliforme (36%) and F.oxysporum (14%).- Fungi of the species Fusarium and Alternaria are found <strong>in</strong> all tested samples.- Seeds from the conventional field are more contam<strong>in</strong>ated with fungi Fusarium, while theeco-field is more contam<strong>in</strong>ated with fungi Alternaria.39
Proceed<strong>in</strong>g of the 4 rd International Symposium“NEW RESEARCH IN BIOTECHNOLOGY” USAMV Bucharest, Romania, 2011REFERENCESKaradjova, Y. Y. 1979. Studies of species Fusarium on cereals. Candidate dissertation. Sofia.1979.Valcheva, A.2006. Study of mycological status of wheat for period 1994-2004. Plant Science.44,35-39.Sofia.Valcheva, A.2006. Study of fungi prevalent <strong>in</strong> barley. Ecology and future.2,47-50.Sofia.Valcheva,A.2009. Study of lots of wheat, maize and barley, crop 2008. Plant Science.46,511-515.Sofia.Ivanov, M.1980. Myco-picture of cereals – wheat, maize and beans <strong>in</strong> Bulgaria. Dissertation. Sofia.Peresipk<strong>in</strong>, V.F.1987.Atlas of diseases on crops.”Harvest”Kiew.15-42.Bateman, GL and H. Kwasna. 1999. Effects of number of w<strong>in</strong>ter wheat crops grown successively onfungal communities on wheat roots. Applied Soil Ecology , 13: 271-282. Booth, C.1971.Chong, LM and JE Sheridan. 1982 . Mycoflora of barley (Hor<strong>de</strong>um vulgare L.) seed <strong>in</strong> <strong>New</strong>Zealand. <strong>New</strong> Zealand Journal of Botany , 20: 187-189. Dawson, WAJM and GL Bateman. Доусън,WAJM и GL Бейтман.Glazek, М. 1997. Mycoflora of w<strong>in</strong>ter wheat seeds harvested from floo<strong>de</strong>d commercial fields <strong>in</strong>South-Western Poland <strong>in</strong> 1997. Plant Protection Institute <strong>in</strong> Poznaniu, Sosnicowice Branch,GliwickaSt. 29:44-153 Sosnicowice, Poland.Kubiak K. and M. Korbas.1999. Occurrence of fungal diseases on selected w<strong>in</strong>ter wheatcultivars.Postepy w Ochronie Rosl<strong>in</strong> 39 (2), 801-804 [<strong>in</strong> Polish].Knauer,N.,1993.Okologik and Landwirtschaft – Situation,Konflikte,Losungen.Engen.Ulmer Verlag.Spedd<strong>in</strong>g,C.R.W.1988.An <strong>in</strong>troduction to Agrocultural systems.Elsevier Applied Science.London and<strong>New</strong> York.Conference for Biological farm<strong>in</strong>g.2007.Study of opportunities to <strong>de</strong>velop the cha<strong>in</strong> of bio-products <strong>in</strong>Bulgaria and i<strong>de</strong>ntification of approaches for short-term presentation of bio-products on the <strong>in</strong>ternalmarket.40
Proceed<strong>in</strong>g of the 4 rd International Symposium“NEW RESEARCH IN BIOTECHNOLOGY” USAMV Bucharest, Romania, 2011EFFECT OF DIRECT ELECTRIC CURRENTON VIRUS ELIMINATION IN GRAPEVINEIONELA CĂTĂLINA GUŢĂ 1 , ELENA-COCUŢA BUCIUMEANU 1 ,BENEDICT OPRESCU 2 , LAVINIA TĂTARU 21 National Research & Development Institute for <strong>Biotechnology</strong> <strong>in</strong> Horticulture, 37 Bucureşti-Piteşti Road, 117715- Ştefăneşti-Argeş, România, Tel./Fax.: 0248-866214, E-mail: gutaionelacatal<strong>in</strong>a@yahoo.com2 University of Piteşti, Faculty of Science, 1 Târgu d<strong>in</strong> Vale, 110040 - Piteşti, România, Tel.: 0348-453100, Fax.:0348-453123Abstract. The meristem culture and thermotherapy are <strong>in</strong>dividually or <strong>in</strong> comb<strong>in</strong>ation the mostfrequent methods of obta<strong>in</strong><strong>in</strong>g virus-free plants. The application of heat treatment for viruselim<strong>in</strong>ation<strong>in</strong> plants is time and energy consum<strong>in</strong>g and needs special equipments (chambers for heattreatment). In the case of the meristem culture, the percent of virus elim<strong>in</strong>ation is <strong>in</strong>fluenced by thegenotype, the type of the virus and especially of the difficulty of meristem excision (the percent ofvirus elim<strong>in</strong>ation is <strong>in</strong>verse proportion to the explants dimensions).The use of electrotherapy with discont<strong>in</strong>uous electric current followed by <strong>in</strong> vitro culture was<strong>in</strong>vestigated as alternative technique to elim<strong>in</strong>ate grapev<strong>in</strong>e viruses, <strong>in</strong> simple or mixed <strong>in</strong>fections at atime, <strong>in</strong> seven Vitis v<strong>in</strong>ifera L. varieties naturally <strong>in</strong>fected. The study had <strong>in</strong> view the most dangerousviruses of this crop: fanleaf virus (GFLV), arabis mosaic virus (ArMV), leafroll associated virus 1(GLRaV-1), leafroll associated virus 3 (GLRaV-3), and fleck virus (GFkV). Direct electric current of1000 and 10 000 kHz was applied for 10 m<strong>in</strong> at the cut ends of one bud<strong>de</strong>d herbaceous cutt<strong>in</strong>gs.Treated axillary buds were grown on M&S basic medium conta<strong>in</strong><strong>in</strong>g growth regulators. The efficacyof virus elim<strong>in</strong>ation process was assessed by enzyme-l<strong>in</strong>ked immunosorbent assay (ELISA) test<strong>in</strong>gof regenerated acclimated grapev<strong>in</strong>e plants. The analysis showed some encourag<strong>in</strong>g results forelongated viruses GLRaV-1 and GLRaV-3 <strong>in</strong> s<strong>in</strong>gle <strong>in</strong>fections and no virus eradication <strong>in</strong> mixed<strong>in</strong>fections had been obta<strong>in</strong>ed. The electrotherapy of GLRaV-1- <strong>in</strong>fected material produced maximum12.5% virus-free plants at 1000 kHz and 4.5% GLRaV-3-free v<strong>in</strong>es at 10 000 kHz for 10 m<strong>in</strong> ofexposure. The result regard<strong>in</strong>g GLRaV-1 elim<strong>in</strong>ation was not reproducible <strong>in</strong> the case of mixed<strong>in</strong>fection conta<strong>in</strong><strong>in</strong>g it. No satisfactory results have been achieved for isometric viruses eradication(GFLV, GFkV) either <strong>in</strong> simple or mixed <strong>in</strong>fections.Keywords: Vitis, virus, eradication, electrotherapy, discont<strong>in</strong>uos electric current1. INTRODUCTIONThe International Council for the Study of Virus and Virus-like Diseases of theGrapev<strong>in</strong>e (ICVG), recognizes over 70 <strong>in</strong>fectious agents affect<strong>in</strong>g grapev<strong>in</strong>e (viruses,viroids and mycoplasmas). Many of them cause disor<strong>de</strong>rs that reduce the plant vigour andlongevity or the quality and quantity of the yield. Infected propagat<strong>in</strong>g material is largelyresponsible for the spread of these diseases among and with<strong>in</strong> viticultural regions. Thus, allefforts should be ma<strong>de</strong> to improve its sanitary conditions and to protect selected healthyclones from new <strong>in</strong>fections.The presence of fanleaf virus (GFLV), arabis mosaic virus (ArMV), leafrollassociated virus 1 (GLRaV-1), leafroll associated virus 3 (GLRaV-3), and fleck virus(GFkV <strong>in</strong> simple and mixed <strong>in</strong>fections can cause severe damages to <strong>in</strong>fected grapev<strong>in</strong>e41
Proceed<strong>in</strong>g of the 4 rd International Symposium“NEW RESEARCH IN BIOTECHNOLOGY” USAMV Bucharest, Romania, 2011plants, therefore the use virus-free v<strong>in</strong>es for multiplication and new v<strong>in</strong>eyard establish<strong>in</strong>gis required (F. MANNINI [1]). In cases of high <strong>in</strong>ci<strong>de</strong>nce of <strong>in</strong>fectious diseases <strong>in</strong> breed<strong>in</strong>gv<strong>in</strong>eyards and impossibility to select authentic and disease-free material of a particularvariety or rootstock, several techniques are be<strong>in</strong>g applied for virus elim<strong>in</strong>ation (I.TSVETKOV & al. [ 2]).The meristem culture and thermotherapy are <strong>in</strong>dividually or <strong>in</strong> comb<strong>in</strong>ation themost frequent methods of obta<strong>in</strong><strong>in</strong>g virus-free grapev<strong>in</strong>es (G. GRAMMATIKAKI & A.AVGELIS [3]; B. KŘIŽAN & al. [4]) The application of heat treatment for viruselim<strong>in</strong>ation<strong>in</strong> plants is time and energy consum<strong>in</strong>g and needs special equipments(chambers for heat treatment). In the case of the meristem culture, the percent of viruselim<strong>in</strong>ation is <strong>in</strong>fluenced by the genotype, the type of the virus and especially of thedifficulty of meristem excision.Virus-elim<strong>in</strong>ation techniques such as: chemotherapy (A. PANATTONI & al.[5]), electrotherapy <strong>in</strong> cont<strong>in</strong>uous electric field (I.C. GUȚĂ & al. [6]), cryotherapy (SH.BAYATI & al. [7]), somatic embryogenesis (G. GAMBINO & al. [8]) and theircomb<strong>in</strong>ations are consi<strong>de</strong>red alternative method to thermotherapy. Each of the listedmethod <strong>in</strong>volves one stage of <strong>in</strong> vitro culture.Is well known the use of electric current <strong>in</strong> the clean<strong>in</strong>g of viral diseases <strong>in</strong> plants;<strong>in</strong>stead, a <strong>de</strong>ep knowledge of this phenomenon theoretical basis is not yet available. Theexperiments <strong>de</strong>monstrated that the clean<strong>in</strong>g process nature is, essentially, the effect of theviral prote<strong>in</strong> <strong>de</strong>naturation, by means of the heat to which they were exposed <strong>in</strong> the thermalbath that the vegetal tissue constitutes (J.E GONZÁLES & al. [9]).Electrotherapy has been applied successfully to eradicate potato virus X fromdifferent <strong>in</strong>fected potato clones (H.F. LOZOYA-SALDAÑA & al. [10]); dasheen mosaicvirus <strong>in</strong> malanga (J. IGARZA CASTRO & al. [11]; banana streak virus <strong>in</strong> banana (P.R.HERNÁNDEZ & al. [12]).The electrotherapy for GFLV elim<strong>in</strong>ation was <strong>in</strong>vestigated, as a more practicalalternative technique comparatively to heat therapy of virus <strong>in</strong>fected grapev<strong>in</strong>e, but notsatisfactory results have been obta<strong>in</strong>ed. However, the <strong>de</strong>creas<strong>in</strong>g of by enzyme-l<strong>in</strong>kedimmunosorbent assay (ELISA) values <strong>in</strong> function of the exposure period have beenregistered (J.G. BURGER [13]).The electrotherapy followed by <strong>in</strong> vitro culture of shoot apices produced 33.33–66.66% GLRaV-1+3 –free plants, regardless explant position of exposed grapev<strong>in</strong>e <strong>in</strong>cont<strong>in</strong>uous electric field (I.C. GUȚĂ & al. [14]).The aim of the present research was to elim<strong>in</strong>ate fanleaf virus (GFLV), arabismosaic virus (ArMV), leafroll associated virus 1 (GLRaV-1), leafroll associated virus 342
Proceed<strong>in</strong>g of the 4 rd International Symposium“NEW RESEARCH IN BIOTECHNOLOGY” USAMV Bucharest, Romania, 2011(GLRaV-3), and fleck virus (GFkV) <strong>in</strong> simple or mixed <strong>in</strong>fections at a time, <strong>in</strong> seven Vitisv<strong>in</strong>ifera L. varieties, by electrotherapy with direct electric current.2. MATERIALS AND METHODSSource of virus-<strong>in</strong>fected material: The study regard<strong>in</strong>g GFLV, ArMV, GLRaV-1,GLRaV-3, GFkV and their comb<strong>in</strong>ations (virus complex) elim<strong>in</strong>ation has been done onseven V. v<strong>in</strong>ifera L. cultivars naturally <strong>in</strong>fected (Table 1), ma<strong>in</strong>ta<strong>in</strong>ed <strong>in</strong> the grapev<strong>in</strong>evirus <strong>in</strong>fected collection of NRDIBH Ştefăneşti–Argeş. One year old <strong>in</strong>fected plantsobta<strong>in</strong>ed from one bud cutt<strong>in</strong>gs, confirmed as virus-<strong>in</strong>fected by ELISA test<strong>in</strong>g, constitutedthe source of nodal fragments (microshoots).Table 1. Virus-<strong>in</strong>fected grapev<strong>in</strong>e cultivars used <strong>in</strong> the experimentGrapev<strong>in</strong>e cultivarVirus/virus complexFetească albăGFLVFetească neagrăGLRaV-1GLRaV-1FrâncușăCabernet SauvignonGrasă <strong>de</strong> CotnariUni<strong>de</strong>ntified genotype (1)Uni<strong>de</strong>ntified genotype (2)GLRaV-3GFkVArMV + GFkVGFLV + GLRaV-1Electrotherapy: In the case of electrotherapy with direct electric current, a sourcethat converts the alternat<strong>in</strong>g current from electricity network <strong>in</strong> alternat<strong>in</strong>g current withadjustable parameter is required. The experiment consists of subject<strong>in</strong>g a nodal fragment toan alternat<strong>in</strong>g current for a certa<strong>in</strong> period, after that it is <strong>in</strong>oculated on culture medium,be<strong>in</strong>g the source of regeneration of new grapev<strong>in</strong>e plants.The experimental parameter were established after previous attempts (directelectric current of 1; 100; 1000 and 10 000 kHz was applied for 5; 10 and 20 m<strong>in</strong> at thecut ends of one bud<strong>de</strong>d herbaceous cutt<strong>in</strong>gs), regard<strong>in</strong>g the viability of microshootsexposed to the action of electric current (unpublished data). The current frequency (1000kHz; 10 000 kHz) and exposure time (10 m<strong>in</strong>) for this experiment were established. Thus,the experience is bifactorial of subdivi<strong>de</strong>d parcels type, 2x7 experimental variants; for eachvariant were exposed three microshoots as repetitions.The control for each variant was represented by virus <strong>in</strong>fected microshoots <strong>in</strong> vitrocultured unexposed to direct electric curent (untreated). The position of the nodal fragmentson the shoots were i<strong>de</strong>ntically for all experimental variants, namely the second <strong>in</strong>terno<strong>de</strong>below the apex.In vitro culture: Nodal fragments subjected to electrical current treatment andvirus- <strong>in</strong>fected untreated nodat fragments (control) have been <strong>in</strong>oculated on M&S (1962)basic medium (T. MURASHIGE & F. SKOOG [15]) conta<strong>in</strong><strong>in</strong>g 2 µmol L -1benzylam<strong>in</strong>opur<strong>in</strong>e (BAP) and 5 µmol L -1 <strong>in</strong>dolilacetic acid (AIA). After three subcultures43
Proceed<strong>in</strong>g of the 4 rd International Symposium“NEW RESEARCH IN BIOTECHNOLOGY” USAMV Bucharest, Romania, 2011of 30 days each, when a multiplication process occurred, <strong>in</strong>dividualized and elongatedmicroshoots of 2-2.2 cm were cultured on root<strong>in</strong>g medium (E. VIȘOIU [16]). Dur<strong>in</strong>g theregenerative processes, the parameters such as multiplication rate (X) and number ofpercent of rooted microshoots on experimental variants were monitored.Virus elim<strong>in</strong>ation assessment: In or<strong>de</strong>r to assess the virus elim<strong>in</strong>ation efficiency,regenerated acclimated v<strong>in</strong>es were analyzed by ELISA. The ELISA test was performedaccord<strong>in</strong>g to the method <strong>de</strong>scribed by M.F. CLARK & A.N. ADAMS [17] withcommercial reagents produced by BIOREBA, Switzerland. Absorbance (OD 405nm ) wasrecor<strong>de</strong>d by PR 3100 photometer. For a correct discrim<strong>in</strong>ation of negative and positiveresults, a cut-off value as three times the average values of negative control was calculated.Statistical assessment: Statistical analysis of the data have been ma<strong>de</strong> by SPSSfor W<strong>in</strong>dows 10. In the tables, the values are means± standard <strong>de</strong>viations (sd). Thedifferences between variants as compared to the control were analyzed with one-wayANOVA-LSD tak<strong>in</strong>g P
Proceed<strong>in</strong>g of the 4 rd International Symposium“NEW RESEARCH IN BIOTECHNOLOGY” USAMV Bucharest, Romania, 2011a) the <strong>de</strong>vice of electrotherapy; b) direct stimulation of the microshoot;c) <strong>in</strong> vitro rooted grapev<strong>in</strong>e plantlets; d) regenerated v<strong>in</strong>es after electrotherapyThe evolution of the subcultures was assessed by the multiplication rate ascompared to the control for each <strong>in</strong>fected grapev<strong>in</strong>e genotype, <strong>de</strong>pend<strong>in</strong>g on thecharacteristics of alternat<strong>in</strong>g current. In the first subculture, the virus <strong>in</strong>fected genotypesbehaved no significant differences comparatively with untreated (controls); themultiplication rates range between 1.5000 ± 0.7071 and 3.0000 ± 1.4142. Start<strong>in</strong>g from thesecond subculture, significant differences <strong>in</strong> the case of GLRaV-3–<strong>in</strong>fected cv. CabernetSauvignon and ArMV+GFkV–<strong>in</strong>fected uni<strong>de</strong>ntified genotype (1) have been occurred. Înthe first case, the difference was significantly negative at P< 0.05 for 10 000 kHzfrequency as compared with the control. Also, negative significaton for the double <strong>in</strong>fectionArMV+GFkV at 1000 kHz has beeen found.After three subculture, the material has been stabilized; significant negativediffereces appeared to genotypes Fetească albă, Cabernet Sauvignon, Frâncu ă and Grasăș<strong>de</strong> Cotnari. The data regard<strong>in</strong>g the multiplication rates on three subculctures of <strong>in</strong>fectedgrapev<strong>in</strong>e genotype <strong>in</strong>dicated that the electrotherapy with alternat<strong>in</strong>g current of variablefrequency <strong>in</strong>fluenced negatively the <strong>in</strong> vitro <strong>de</strong>velopment of grapev<strong>in</strong>e <strong>in</strong> some cases.This can have beneficial consequences for the purposes of possible viral <strong>in</strong>activationmultiplication due to <strong>in</strong>tracellular thermotherapy phenomenon produced by electriccurrent (Table 2).Table 2. The evolution of <strong>in</strong> vitro culture on experimental variants expressed by the multiplicationrate dur<strong>in</strong>g three subcultures (I, II, III)Grapev<strong>in</strong>e FrequencyMultiplication rate (X)genotype/ (kHz) I II IIIVirusFetească albă / 1000 1.50 ± 0.7071 3.00 ± 0.0000 8.50 ± 4.9497 bGFLV10 000 1.50 ± 0.7071 5.00 ± 1.4142 17.50 ± 4.9497Control 1.50 ± 0.7071 5.50 ± 2.1213 23.00 ± 4.2426 aFetească neagră 1000 1.50 ± 0.7071 5.50 ± 3.5355 16.50 ± 10.6066/ GLRaV-1 10 000 3.00 ± 1.4142 6.00 ± 1.4142 20.50 ± 0.7071Frâncuşă /GLRaV-1Control 2.50 ± 2.1213 3.50 ± 0.7071 15.50 ± 0.70711000 2.00 ± 1.4142 1.50 ± 0.7071 3.15 ± 0.212110 000 2.00 ± 0.0000 1.50 ± 0.7071 5.10 ± 0.8485 bControl 1.50 ± 0.7071 1.50 ± 0.7071 3.50 ± 0.7071 a1000 1.50 ± 0.7071 3.50 ± 0.7171 2.90 ± 0.4243 b10 000 3.00 ± 0.0000 b 2.10 ± 0.2121 b 1.60 ± 0.2828CabernetSauvignon /GLRaV-3 Control 1.50 ± 0.7071 a 4.70 ± 1.7678 a 1.45 ± 0.0070 aGrasă <strong>de</strong> Cotnari 1000 2.50 ± 0.7071 1.80 ± 0.2828 5.10 ± 0.1414 b/GFkV10 000 3.00 ± 0.0000 2.30 ± 0.4243 4.60 ± 0.5303Control 3.00 ± 0.0000 1.80 ± 0.2828 3.60 ± 0.4950 aUni<strong>de</strong>ntified 1000 2.00 ± 0.0000 3.00 ± 0.0000 b 5.50 ± 0.707145
Proceed<strong>in</strong>g of the 4 rd International Symposium“NEW RESEARCH IN BIOTECHNOLOGY” USAMV Bucharest, Romania, 2011genotype (1) / 10 000 2.00 ± 0.0000 4.00 ± 0.0000 7.00 ± 1.4142ArMV +GFkV Control 1.00 ± 0.0000 6.00 ± 0.0000 a 6.50 ± 0.7071Uni<strong>de</strong>ntified 1000 1.00 ± 0.0000 2.00 ± 1.4142 3.65 ± 0.4950genotype (2) / 10 000 1.50 ± 0.7071 2.50 ± 0.7071 3.25 ± 0.3536GFLV+ Control 1.00 ± 0.0000 2.00 ± 0.0000 3.50 ± 0.7071GLRaV-1The values are means± sd on three repetitions, the small letters representthe significance of the differences between variants as compared to the control at P < 0.05Plant regeneration, <strong>in</strong> general, <strong>de</strong>pends upon several factors, <strong>in</strong>clud<strong>in</strong>g: genotype,physiological state of the explant, culture medium, the cultivation conditions and the<strong>in</strong>teractions betwen these factors (D. SVETLEVA & al. [18]). The electric pulses are olsoreported as stimulant of <strong>in</strong> vitro plant differentiation (A. GOLDSWORTHY [19]). It was<strong>de</strong>monstrated that regeneration of potato plant tissues could be improved by expos<strong>in</strong>gexplants to mild electric current (H.F. LOZOYA-SALDAÑA & al. [10]).Alternat<strong>in</strong>g electric currents (50 Hz, 0.1–50 µA) applied for 30 days on Nicotianatabacum calli <strong>in</strong>duced a significant stimulation of morphogenetic processes. The numberof shoots <strong>in</strong>creased by up to 300% for the samples stimulated with 50 µA but nosignificant changes were noted <strong>in</strong> total mass, DNA and prote<strong>in</strong> content <strong>in</strong> the stimulatedsamples compared to control. It was suggested that <strong>in</strong> the presence of the external electriccurrent, the callus cells become more sensitive to chemical signals (hormones and/or ions)<strong>in</strong> the culture medium (G. COGĂLNICEANU & al. [20]).After three subculture on multiplication media, differentiated and elongatedmicroshoots have been transfered on root<strong>in</strong>g medium. In general, the rhyzogenesisassessed by the number of rooted microshoots took place without large differences on theexperimental variants. In the case of Fetească neagră cv. <strong>in</strong>itially <strong>in</strong>fected with GLRaV-1, asignificant positive difference have been registered, <strong>in</strong> that the treatment with 10 000 kHz<strong>de</strong>term<strong>in</strong>ed the <strong>in</strong>creas<strong>in</strong>g of the number of rooted shoots (121± 0.8112) comparativelywith the control (69± 8.4853) (Table 3).Significant <strong>in</strong>creases <strong>in</strong> root<strong>in</strong>g rate and root growth parameter <strong>in</strong>dicated thatdirect electric current applications may have the potential to improve propagation ofgrapev<strong>in</strong>e rootstocks that are difficult to root by cutt<strong>in</strong>gs (C. Köse [21]). On the other hand,higher <strong>in</strong>tensities of electric current adversely affected the survival of bean explants <strong>in</strong>vitro and, thus, the plant regeneration (M.H. HORMOZI-NEJAD [22].Table 3. In vitro root<strong>in</strong>g assessed by the number of rooted shoots on the experimental variantsGenotype/VirusFrequency(kHz)Rooted shoots(N o )46Fetească albă /1000 11.00 ± 5.6569GFLV10 000 19.00 ± 4.2426Control 15.50 ± 0.7071Fetească neagră /1000 71.50 ± 28.9914GLRaV-110 000 121.00 ± 0.8112 cControl 69.00 ± 8.4853 aFrâncuşă / 1000 20.00 ± 21.2100
Proceed<strong>in</strong>g of the 4 rd International Symposium“NEW RESEARCH IN BIOTECHNOLOGY” USAMV Bucharest, Romania, 2011GLRaV-110 000 21.00 ± 19.8000Control 18.00 ± 2.8300Cabernet Sauvignon /1000 13.00 ± 0.0000GLRaV-310 000 17.00 ± 1.4100Grasă <strong>de</strong> Cotnari /GFkVUni<strong>de</strong>ntified genotype (1) /ArMV + GFkVUni<strong>de</strong>ntified genotype (2) /GFLV + GLRaV-1Control 18.50 ± 2.12001000 36.00 ± 8.490010 000 56.00 ± 29.7000Control 42.00 ± 2.83001000 6.00 ± 1.414210 000 7.00 ± 1.4142Control 17.00 ± 1.41421000 19.00 ± 1.410010 000 20.00 ± 4.2400Control 19.50 ± 0.7100The values are means± sd on three repetitions, the small letters represent the significanceof the differences between variants as compared to the control at P < 0.05Virus elim<strong>in</strong>ation assessmentThe efficacy of virus elim<strong>in</strong>ation process assessed by ELISA test<strong>in</strong>g ofregenerated acclimated grapev<strong>in</strong>e plants was presented <strong>in</strong> Table 4.The analysis showed some encourag<strong>in</strong>g results for elongated viruses GLRaV-1and GLRaV-3 <strong>in</strong> s<strong>in</strong>gle <strong>in</strong>fections and no virus eradication <strong>in</strong> mixed <strong>in</strong>fections had beenobta<strong>in</strong>ed. The electrotherapy of GLRaV-1- <strong>in</strong>fected material produced maximum 12.5%virus-free plants at 1000 kHz for and 4.5% GLRaV-3-free v<strong>in</strong>es at 10 000 kHz, for 10 m<strong>in</strong>of exposure. Grasă <strong>de</strong> Cotnari variety was 100% GFkV-free <strong>in</strong> the case of 10 000 kHzvariant. The results regard<strong>in</strong>g GLRaV-1 or GFkV elim<strong>in</strong>ation were not reproducible <strong>in</strong> thecase of mixed <strong>in</strong>fection conta<strong>in</strong><strong>in</strong>g one of them. In the case of 1000 kHz variants, anyacclimated v<strong>in</strong>e has been obta<strong>in</strong>ed for cv. Frâncu ă and uni<strong>de</strong>ntified genotype (2). Noșsatisfactory results have been achieved for isometric viruses eradication (GFLV, GFkV)either <strong>in</strong> simple or mixed <strong>in</strong>fections. ArMV has been eradicated <strong>in</strong> proportion of 85.7 –88.9% but the v<strong>in</strong>es belong<strong>in</strong>g to uni<strong>de</strong>ntified genotype (1) rema<strong>in</strong>ed GFkV <strong>in</strong>fected.Table 4. Assessment of efficiency of grapev<strong>in</strong>e virus elim<strong>in</strong>ation by electrotherapywith direct electric curentGrapev<strong>in</strong>e cultivar / FrequencyPlants (N o )Sanitationvirus(kHz) ELISA Virus-free ratetested (N o ) (N o )(%)Fetească albă /1000 20 0 0GFLV 10 000 17 0 0Fetească neagră /1000 66 0 0GLRaV-1 10 000 146 0 01000 8 1 12.5ș47
Proceed<strong>in</strong>g of the 4 rd International Symposium“NEW RESEARCH IN BIOTECHNOLOGY” USAMV Bucharest, Romania, 201110 000 2 0 0Cabernet Sauvignon /1000 8 0 0GLRaV-3 10 000 22 1 4.5Grasă <strong>de</strong> Cotnari /1000 15 0 0GFkV 10 000 9 9 1001000 7 6- ArMV-free 0Uni<strong>de</strong>ntified genotype (1)/0 -GFkV-freeArMV+GFkV 10 000 9 8– ArMv-free 00- GFkV-freeUni<strong>de</strong>ntified genotype (2)/ 1000 - - -GFLV+GLRaV-1 10 000 7 0 0The succes of electrotherapy <strong>in</strong> produc<strong>in</strong>g virus- free plants <strong>de</strong>pends upon bothplant regeneration and virus elim<strong>in</strong>ation rates (M.H. HORMOZI-NEJAD [22].Tak<strong>in</strong>g <strong>in</strong>to consi<strong>de</strong>ration that both, antiviral treatment with electric current and <strong>in</strong>vitro culture, can be consi<strong>de</strong>red stress factors responsible for <strong>in</strong>duc<strong>in</strong>g genetic variation, itis compulsory to check the obta<strong>in</strong>ed plants for genetic stability, fi<strong>de</strong>lity and uniformity.Regenerated grapev<strong>in</strong>e after exposure to electrotherapy <strong>in</strong> cont<strong>in</strong>ous electric field weremorphologically i<strong>de</strong>ntical to the control (non-treated plants), as shown <strong>in</strong> the studiescompar<strong>in</strong>g their random amplified polymorphic DNA (RAPD) profiles (I.C. GUȚĂ & al.[14]).48CONCLUSIONSThe <strong>in</strong>fluence of alternat<strong>in</strong>g electric current and the behaviour of grapev<strong>in</strong>egenotypes <strong>in</strong> the presence of virus <strong>in</strong>fection, dur<strong>in</strong>g <strong>in</strong> vitro axillary buds proliferation,could not be correlated.The behaviour of viruses <strong>in</strong> sanitation process is different <strong>in</strong> simple or mixed<strong>in</strong>fections; electrotherapy <strong>in</strong> alternat<strong>in</strong>g current of s<strong>in</strong>gle <strong>in</strong>fected microshoots producedGLRaV-1-, GLRaV-3- or GFkV-free grapev<strong>in</strong>e <strong>in</strong> different percentage, but no viruselim<strong>in</strong>ation <strong>in</strong> mixed <strong>in</strong>fections conta<strong>in</strong><strong>in</strong>g one of these viruses has been obta<strong>in</strong>ed.No satisfactory results have been achieved for GFLV eradication both <strong>in</strong> simpleand mixed <strong>in</strong>fections.In or<strong>de</strong>r to <strong>in</strong>crease the number of grapev<strong>in</strong>e cultivars and clones nee<strong>de</strong>d to beavailable as healthy material, the certification program and, also, the virus-elim<strong>in</strong>ationmethod for obta<strong>in</strong><strong>in</strong>g virus-free grapev<strong>in</strong>es must be constantly <strong>de</strong>veloped.REFERENCES
Proceed<strong>in</strong>g of the 4 rd International Symposium“NEW RESEARCH IN BIOTECHNOLOGY” USAMV Bucharest, Romania, 20111. Man<strong>in</strong>ni, F. (2003): Virus elim<strong>in</strong>ation <strong>in</strong> grapev<strong>in</strong>e and crop performance. Exten<strong>de</strong>d abstracts 14 thICVG Meet<strong>in</strong>g, 12-17 September 2003, Locorotondo (Bari), Italy, 234-239.2. Tsvetkov, I., Atanassov, A., Jankulova, M., Vulchev,V., Todorov, I., Pan<strong>de</strong>liev, S., Katerov, K.,Atanassov, I., Hvarleva, T., Tsvetkov, Y., Genov, I., Dzambazova, T., Antonov, I., Mar<strong>in</strong>ov, L.,Dimitrov, E., Panamska, M., Varad<strong>in</strong>ova, G., Slavova, K., Atanassov, I., Shishmanov, G., Ivanova,N., Lag<strong>in</strong>ova, M. (2005): Grapev<strong>in</strong>e plant genetic resources improvement, preservation andbiodiversity. Biotechnol. & Biotechnol. Eq. Vol.19: 13-21.3. Grammatikaki, G. and Avgelis, A. (2009): Virus elim<strong>in</strong>ation <strong>in</strong> <strong>in</strong>fected clones of four Greekgrapev<strong>in</strong>e w<strong>in</strong>e cultivars (Roditis, X<strong>in</strong>omavro, Baftra and Savatiano) us<strong>in</strong>g <strong>in</strong> vitro thermotherapy andtip meristem culture. Exten<strong>de</strong>d abstracts 16 th ICVG Meet<strong>in</strong>g, 31 Aug.- 4 Sept. 2009, Dijon, France,241-242.4. Křižan, B., Ondrušiková, E., Holle<strong>in</strong>ová, V., Moravcová, K., Bláhová, L. (2009): Elim<strong>in</strong>ation ofGrapev<strong>in</strong>e fanleaf virus <strong>in</strong> grapev<strong>in</strong>e by <strong>in</strong> vivo and <strong>in</strong> vitro thermotherapy. Hort. Sci. (Prague). Vol.36, 3:105–108.5. Panattoni, A., D’Anna, F., Triolo, E. (2006): Improvement <strong>in</strong> grapev<strong>in</strong>e chemotherapy. Exten<strong>de</strong>dabstracts 15 th ICVG Meet<strong>in</strong>g, 3-7 April 2006, Stellenbosch, South Africa, 139-141.6. Guţă, I.C., Buciumeanu, E.C., Vişoiu, E., Teodorescu, Al., Liţă, I. (2008): The effect of electricfield on <strong>in</strong> vitro regenerative processes and grapev<strong>in</strong>e virus elim<strong>in</strong>ation, Simpozion aniversar: A״ 60-aaniversare a Facultăţii <strong>de</strong> ,״Horticultură A״ 10-a aniversare a specializării <strong>de</strong> ,״peisagistică 23 mai2008, Bucureşti, Lucrări şti<strong>in</strong>ţifice, UŞAMV, Seria B – LI -2008- Horticultură, 481-486.7. Bayati, SH., Shams-Bakhsh, M., Moieni, A. (2011): Elim<strong>in</strong>ation of grapev<strong>in</strong>e virus A (GVA) bycryotherapy and electrotherapy. J. Agr. Sci. Tech. Vol. 13: 443-450.8. Gamb<strong>in</strong>o, G., Vallania, R., Gribaudo, I. (2009): Detection and elim<strong>in</strong>ation of grapev<strong>in</strong>e fanleafvirus <strong>in</strong> callus, somatic embryos and regenerated plantlets of grapev<strong>in</strong>e. Exten<strong>de</strong>d abstracts 16 th ICVGMeet<strong>in</strong>g, 31 Aug. - 4 Sept. 2009, Dijon, France, 239-240.9. Gonzáles, J.E., Sánchez, R., Sánchez, A. (2006): Biophysical analysis of electric current mediatednucleoprote<strong>in</strong> <strong>in</strong>activation process. Centro Agrícola Vol. 2: 42-47.10. Lozoya-Saldaña, H.F., Abelló, J., García G. (1996): Electrotherapy and shoot-tip cultureelim<strong>in</strong>ate potato virus X <strong>in</strong> potatoes. Am. J. Potato Res. Vol. 73: 149-154.11. Igarza Castro, J., Hernán<strong>de</strong>z, P.R., Cruz Castelanos, B. (2001): Electrotherapy as an alternativefor elim<strong>in</strong>ation the DMV virus <strong>in</strong> tania. Manejo Integrado <strong>de</strong> Plagas Vol. 60: 57-60.12. Hernán<strong>de</strong>z, P.R., Bertrand, H., Lepoivre, P., Gonzáles, J.E., Rojas, X., Pairol, A., Gonzáles, Y.,Gonzáles, G.Y., Cortés, C. (2002): Diagnostico y saniam<strong>in</strong>ieto <strong>de</strong> Banana Streak Virus (BSV) enMusa spp. Centro Agrícola 2: 42-47.13. Burger, J.G. (1989): Electrotherapy: a possible method to elim<strong>in</strong>ate grapev<strong>in</strong>e fanleaf virus fromgrapev<strong>in</strong>e. Exten<strong>de</strong>d abstracts 9 th ICVG Meet<strong>in</strong>g, Kiryat Anavim, Israel, 1987, 153.14. Guță, I.C., Buciumeanu, E.C., Gheorghe, R.N., Teodorescu, Al. (2010): Solutions to elim<strong>in</strong>ategrapev<strong>in</strong>e leafroll associated virus serotype 1+3 from V. v<strong>in</strong>ifera L. cv. Ranâi Magaraci. Rom.Biotechnol. Lett. Vol.15, 1: 72–78.15. Murashige, T. and Skoog, F. (1962): A revised medium for rapid grow and bioassays withTabacco tissue culture. Physiol. Plant. 15: 473-49.49
Proceed<strong>in</strong>g of the 4 rd International Symposium“NEW RESEARCH IN BIOTECHNOLOGY” USAMV Bucharest, Romania, 201116. Vișoiu, E. (2003): Perfecţionarea biotehnologiilor <strong>de</strong> <strong>de</strong>virozare şi înmulţire <strong>in</strong> vitro a viţei <strong>de</strong> vieîn scopul creşterii valorii biologice a materialului săditor viticol la standar<strong>de</strong>le <strong>in</strong>ternaţionale. Ed.Tipnaste Piteşti, pp.43.17. Clark, M.F. and Adams, A.N. (1977): Characteristics of the microplate method of the enzymel<strong>in</strong>kedimmunosorbent assay for the <strong>de</strong>tection of plant viruses. J. Gen.Virol. Vol. 34, 3: 475-483.18. Svetleva, D., Velcheva, M., Bhowmik, G. (2003): <strong>Biotechnology</strong> as an useful tool <strong>in</strong> common bean(Phaseolus vulgaris L.) improvement. Euphytica 131: 189-200.19. Goldsworthy, A. (1997): Electrical stimulation of tissue culture growth and morphogenesis.Agriculture cell report 8: 14.20. Cogălniceanu, G., Radu, M., Fologea, D., Moisoi, N., Brezeanu, A. (1998): Stimulation oftobacco shoot regeneration by alternat<strong>in</strong>g weak electric field. Bioelectrochem. Bioenerg. Vol. 44, 2:257-260.21. Köse, C. (2007): Effects of direct electric current on adventitious root formation of a grapev<strong>in</strong>erootstock. Am. J. Enol. Vitic. Vol. 58, 1:120-123.22. Hormozi-Nejad, M.H., Mozafari, J., Rakhshan<strong>de</strong>hroo, F. (2010): Elim<strong>in</strong>ation of Bean commonmosaic virus us<strong>in</strong>g an electrotherapy technique. J. Plant Dis. Prot. Vol. 117, 5: 201-205.50
Proceed<strong>in</strong>g of the 4 rd International Symposium“NEW RESEARCH IN BIOTECHNOLOGY” USAMV Bucharest, Romania, 2011EFFECT OF INORGANIC NITROGEN NUTRITION ON “IN VITRO”PRODUCTION OF POTATO MICROTUBERS*INCDCSZ Braşov, e-mail: nistorandreea06@gmail.comANDREEA NISTOR, NICOLETA CHIRU, CARMEN BĂDĂRĂUAbstract: The effect of <strong>in</strong>organic nitrogen nutrition on production of microtubers was studied <strong>in</strong> twopotato genotypes Nicoleta and Christian. The objective of this study was to <strong>in</strong>vestigate whether areduction <strong>in</strong> total nitrogen level <strong>in</strong> the Murashige & Skoog medium would improve microtuberization.The effect of three levels of total nitrogen (30, 45 and 60 meq) on tuberization was studied at constant(20 meq K). Reduc<strong>in</strong>g the total nitrogen supply <strong>in</strong>creased the number but <strong>de</strong>creased the size ofmicrotubers. The weight of microtubers per vessel was the highest at the highest nitrogenconcentration (60 meq): 1.91 g for Christian variety. A reduction <strong>in</strong> total nitrogen supply reduced thesize of microtubers, the lowest weight be<strong>in</strong>g at the lowest nitrogen level – 30 meq: 1.01 g for Nicoletavariety, with a difference of -0.66 g, significant <strong>in</strong> a negative way. Decreas<strong>in</strong>g the total nitrogensupply caused <strong>in</strong>creas<strong>in</strong>g the number of microtubers/ vessel which was the highest at the lowestnitrogen concentration (30 meq): 19.67 microtubers, with a difference of 4.34 microtubers,significant <strong>in</strong> a positive way, for Christian variety. The number of microtubers per vessel was thelowest at the highest nitrogen concentration (60 meq): 15.33 microtubers, for both varieties.Keywords: microplants, m<strong>in</strong>eral nutrition, microtubers, Solarium tuberosum L., tissue culture1. INTRODUCTIONSome cultivars are more sensitive than others to total nitrogen levels or relativeconcentration of nitrate: ammonium <strong>in</strong> the medium dur<strong>in</strong>g micropropagation (Avila et al.1998) or microtuberization (Garner and Blake 1989; Sarkar and Naik 1998). Low nitrogen<strong>in</strong> the micropropagation and microtuberization media was best for microtuberization(Stallknecht and Farnsworth 1979; Wattimena 1983). Total nitrogen and nitrate:ammonium levels were used effectively to improve precondition<strong>in</strong>g, <strong>in</strong>duction (Charles etal. 1995; Zarrabeitia et al. 1997; Sarkar and Naik 1998), and microtuber growth (Chen andLiao 1993; Sarkar and Naik 1998). Reduced ammonium levels dur<strong>in</strong>g source plantprecondition<strong>in</strong>g resulted <strong>in</strong> <strong>in</strong>creased numbers and better synchronization of subsequentmicrotuber <strong>in</strong>duction (Charles et al. 1995; Zarrabeitia et al. 1997; Vreug<strong>de</strong>nhil et al. 1998).The amount of nitrogen had an effect on microtuberization (Cutter, 1978; Moorby,1978).Stallknecht and Farnsworth (1979) and Wattimena (1983) found that low nitrogen<strong>in</strong> both the explants and the tuberization media was best for <strong>in</strong>duced tuberization <strong>in</strong> potato.In the absence of growth regulat<strong>in</strong>g substances <strong>in</strong> the medium, a reduction <strong>in</strong> total nitrogensupply or an <strong>in</strong>crease <strong>in</strong> the ratio of ammonium to nitrate reduced the size and number ofmicrotubers (Garner & Blake, 1989).Hoque et al., (1996) reported that higher number of microtubers can be produced<strong>in</strong> MS medium by reduc<strong>in</strong>g KN0 3 by half of the total amount. Reduction <strong>in</strong> the amount ofNH 4 N0 3 to 1/8th of its amount present <strong>in</strong> MS medium, <strong>in</strong>itiated early and highermicrotuberization after 4 wk (Zarrabeitia et ai., 1997). Nitrogen is one of the major nutrient51
Proceed<strong>in</strong>g of the 4 rd International Symposium“NEW RESEARCH IN BIOTECHNOLOGY” USAMV Bucharest, Romania, 2011elements that regulate plant growth and <strong>de</strong>velopment. The form of nitrogen supplied toplants may <strong>in</strong>fluence the uptake of other nutrients (Schmitz and Lorz, 1990). A low level ofammonium supplied <strong>in</strong> comb<strong>in</strong>ation with nitrate is favorable to tuber growth, but a higherlevel of ammonium supply is <strong>de</strong>trimental (Garner and Blake, 1989). In MS basal saltmedium the two ma<strong>in</strong> sources of nitrogen (N): ammonium nitrate (NH 4 NO 3 ) and potassiumnitrate (KNO 3 ).The present experiment was un<strong>de</strong>rtaken to study the effect of <strong>in</strong>organic nitrogensupply on the <strong>in</strong>duction and <strong>de</strong>velopment of potato microtubers “<strong>in</strong> vitro”.2. MATERIALS AND METHODSNicoleta and Christian potato (Solanum tuberosum L.) varieties were used <strong>in</strong> theexperiment.“In vitro” plantlets of potato were multiplied by subcultur<strong>in</strong>g of s<strong>in</strong>gle stem no<strong>de</strong>s.The multiplication medium conta<strong>in</strong>ed m<strong>in</strong>eral salts and vitam<strong>in</strong>s plus 0.05 mg/l NAA and20g/l sucrose. The medium was solidified with 8 g/l Agar. Temperature <strong>in</strong> the growthchamber was 25 o C with 16 hr photoperiod and light by fluorescent tubes.Fifteen explants (each with two no<strong>de</strong>s) were cultured for each treatment andcultivar, <strong>in</strong> vessels. The microtuberization medium is liquid and conta<strong>in</strong>s the samesubstances as medium Murashige-Shook (1962) coumar<strong>in</strong>, k<strong>in</strong>et<strong>in</strong>, sucrose (80-90 g/l). Thestock solution of cumar<strong>in</strong>e and k<strong>in</strong>et<strong>in</strong> were prepared as follows:Cumar<strong>in</strong>e: 500 mg <strong>in</strong> a 200 ml recipient; 25 ml ethanol are ad<strong>de</strong>d; the solution iscompleted with distilled water.K<strong>in</strong>et<strong>in</strong>: 200 mg <strong>in</strong> a 50 ml recipient; 20 ml NaOH 1N are ad<strong>de</strong>d; the solution iscompleted with distilled water.For 1 l medium we add 20 ml stock solution of coumar<strong>in</strong>e and 12.5 ml stocksolution of k<strong>in</strong>et<strong>in</strong>. The microtuberisation medium doesn’t conta<strong>in</strong> agar. In every plasticrecipient we poured 45 ml medium The microtuber <strong>in</strong>duction cultures were <strong>in</strong>cubated <strong>in</strong> thedark at 20 0 C. We harvested the microtubers separately accord<strong>in</strong>g to variety.After the tuberization period (7-8 weeks of darkness), plantlets were extractedfrom cultures recipients, and harvested microtubers were washed, to avoid the subsequent<strong>in</strong>fections, which can appear dur<strong>in</strong>g their storage. The tuberization percentage (number ofexplants with at least one microtuber over the total number of explants cultured) wasmeasured.In nitrogen-rich MS medium the concentration of total <strong>in</strong>organic nitrogen is 60meq. In the present experiment, alterations <strong>in</strong> MS macronutrients were ma<strong>de</strong> to obta<strong>in</strong> threelevels of total nitrogen (30, 45 and 60 meq) while keep<strong>in</strong>g potassium level constant at 20meq. The different media used <strong>in</strong> the experiment are shown <strong>in</strong> Table 1.Observations were recor<strong>de</strong>d on the number of microtubers per g vessel, averagemicrotuber weight.3. RESULTS AND DISCUSSIONReduc<strong>in</strong>g the total nitrogen supply <strong>in</strong>creased the number but <strong>de</strong>creased the size ofmicrotubers. Reduced total availability of <strong>in</strong>organic nitrogen <strong>in</strong> the medium caused a52
Proceed<strong>in</strong>g of the 4 rd International Symposium“NEW RESEARCH IN BIOTECHNOLOGY” USAMV Bucharest, Romania, 2011<strong>de</strong>cl<strong>in</strong>e <strong>in</strong> the average microtuber weight or size of the microtubers, suggest<strong>in</strong>g that them<strong>in</strong>eral nitrogen nutrition is a major limit<strong>in</strong>g factor controll<strong>in</strong>g their size.Table 1. Total of nitrogen used <strong>in</strong> nutrition mediumNitrogenSalts(meq) KNO NH NO3 4 3(mg l -1 ) mM (mg l -1 ) mM30 950 9.4 825 10.345 1425 14.1 1237 15.560 1900 18.8 1650 20.6Higher numbers of microtubers could be obta<strong>in</strong>ed us<strong>in</strong>g MS mediumsupplemented with 30 meq total nitrogen, 20 meq potassium, 80 g 1 -1 sucrose, but <strong>in</strong>crease<strong>in</strong> microtuber numbers was associated with simultaneous <strong>de</strong>crease <strong>in</strong> microtuber size. Forcommercial seed potato production, microtuber size is more important than microtubernumber because small sized microtubers are more vulnerable to storage loss (Naik &Sarkar, 1997) and are unsuitable for direct field plant<strong>in</strong>g (Jones, 1988).Table 2. Influence of nitrogen concentration and on weight of microtubers produced/ microplantVariety Total nitrogen Average weight of a % Dif. (g) Signif.(meq)microtuber (g)60 1.68 100.00 -NicoletaChristian45 1.25 74.91 -0.42 ns30 1.01 60.46 -0.66 o60 1.91 100.00 -45 1.49 78.50 -0.41 ns30 1.14 60.09 -0.77 oLSD 5%= 0.60 g LSD 1%=0.80 g LSD 0.1%=1.03 gns= not significantThe weight of microtubers per vessel was the highest at the highest nitrogenconcentration (60 meq) (table 2): 1.91 g for Christian variety and 1.68 g for Nicoletavariety. The lowest weight of microtubers was obta<strong>in</strong>ed at the lowest nitrogen level 30meq: 1.14 g for Christian variety, with a difference of -0.77 g, significant <strong>in</strong> a negative way,and 1.01 g for Nicoleta variety, with a difference of -0.66 g, significant <strong>in</strong> a negative way.The number of microtubers per vessel was the highest at the lowest nitrogenconcentration (30 meq) (table 3): 19.67 microtubers, with a difference of 4.34 microtubers,significant <strong>in</strong> a positive way, for Christian variety, followed by Nicoleta with 18.33microtubers and a difference of 3.00 microtubers, significant <strong>in</strong> a positive way.The number of microtubers per vessel was the lowest at the highest nitrogenconcentration (60 meq): 15.33 microtubers, for both varieties.53
Proceed<strong>in</strong>g of the 4 rd International Symposium“NEW RESEARCH IN BIOTECHNOLOGY” USAMV Bucharest, Romania, 2011Table 3. Influence of nitrogen concentration and on number of microtubers produced/microplantVariety Total nitrogen Average number of % Dif. (no. of Signif.(meq) microtubers/vesselmicrotubers)60 15.33 100.00 -NicoletaChristian45 16.67 110.89 1.34 ns30 18.33 119.59 3.00 *60 15.33 100.00 -45 17.00 110.89 1.67 ns30 19.67 128.29 4.34 *LSD 5%= 2.82 microtubers LSD 1%=3.88 microtubers LSD 0.1%=5.32 microtubersns= not significant544. CONCLUSIONSThe experiment showed that m<strong>in</strong>eral nitrogen nutrition strongly <strong>in</strong>fluenced theproduction of potato microtubers. The m<strong>in</strong>eral nitrogen nutrition is a major limit<strong>in</strong>g factorcontroll<strong>in</strong>g their size.Reduc<strong>in</strong>g <strong>in</strong>organic nitrogen <strong>in</strong> the medium had effect <strong>in</strong> the average microtuberweight or size of the microtubers.REFERENCESAvilla, A., S.M. Pereira and J.A. Arguello. 1998. Nitrogen concentration and proportion ofNH4 +- N affect potato cultivar response <strong>in</strong> solid and liquid media. Hort. Sci., 33: 336-338.Charles G, L Rossignol, and M Rossignol. 1995. Mise au po<strong>in</strong>t d'un mo<strong>de</strong>le <strong>de</strong><strong>de</strong>veloppement et <strong>de</strong> tuberisation controles et synchrones chez la pomme <strong>de</strong> terre cultivee <strong>in</strong> vitro.Acta Bot Gal 142:289-300.Chen J-J, and Y-J Liao. 1993. Nitrogen-<strong>in</strong>duced changes <strong>in</strong> the growth and metabolism ofcultured potato tubers. J Am Soc Hort Sci 118:831-834.Cutter E.G., 1978. Structure and <strong>de</strong>velopment of potato plant. In: The Potato Crop. HamsP.M. (eds.). Chapman and Hall, London. p. 70-1 52.Garner N. and J. Blake, 1989. The <strong>in</strong>duction and <strong>de</strong>velopment of potato microtuben <strong>in</strong> vitroon media free of growth regulat<strong>in</strong>g substances. Ann. Bot. 63: 663-674.Hoque ML, N.B. Mila, S. Khan, and R.H. Sarker, 1996. Shoot regeneration and <strong>in</strong> vitromicrotuber formation <strong>in</strong> potato (Sokunirm tuberosum L.). Bangla<strong>de</strong>sh J. Bot. 25: 87- 93.Moorby J., 1978. The physiology of growth and tuber yield. In: The Potato Crop. Harris P.(ed.). Chapman and Hall, London. pp. 1 53- 194.Sarkar D, and PS Naik. 1998. Effect of <strong>in</strong>organic nitrogen nutrition on cytok<strong>in</strong><strong>in</strong>-<strong>in</strong>ducedpotato microtuber production <strong>in</strong> vitro. Potato Res 41:211-217.Schmitz U. and H. Lon, 1990. Nutrient uptake <strong>in</strong> suspension cultures of gram<strong>in</strong>eae. II.Suspension cultures of rke ( O p sariva L.). Plant Sci. 66: 95- 1 1 1.Stallknecht GF, and S Farnsworth. 1979. The effect of nitrogen on the coumar<strong>in</strong>-<strong>in</strong>ducedtuberization of potato axillary shoots cultured <strong>in</strong> vitro. American Potato Journal 56:523-530.
Proceed<strong>in</strong>g of the 4 rd International Symposium“NEW RESEARCH IN BIOTECHNOLOGY” USAMV Bucharest, Romania, 2011Vreug<strong>de</strong>nhil D, Y Boogaard, RGF Visser, and SM <strong>de</strong> Bruijn 1998. Comparison of tuber andshoot formation from <strong>in</strong> vitro cultured potato explants. Plant Cell Tiss Org Cult 53:197-204.Wattimena G.A. 1983. Micropropagation as an alternative technology for potatoproduction <strong>in</strong> Indonesia. Ph.D. Thesis. University of Wiscons<strong>in</strong>-Madison..Zarrabeitia A, X Lejarcegui, J Veramendi, and AM M<strong>in</strong>go-Castel. 1997. Influence ofnitrogen supply on micropropagation and subsequent microtuberization of four potato cultivars. AmPotato J 370:369-378.55
56Proceed<strong>in</strong>g of the 4 rd International Symposium“NEW RESEARCH IN BIOTECHNOLOGY” USAMV Bucharest, Romania, 2011IN VITRO CONSERVATION BY SLOW GROWTH OF ARNICA MONTANAMARIYA PETROVA 1 , ELY ZAYOVA 1 , LUBA EVSTATIEVA 21 Institute of Plant Physiology and Genetics, Bulgarian Aca<strong>de</strong>my of Sciences2 Institute of Biodiversity and Ecosystem Research, Bulgarian Aca<strong>de</strong>my of SciencesCorrespon<strong>de</strong>nce to: Mariya PetrovaE-mail: marry_petrova@yahoo.comInstitute of Plant Physiology and Genetics, Bulgarian Aca<strong>de</strong>my of SciencesAcad. G. Bonchev Street, Bldg. 21, Sofia 1113, BulgariaAbstract. The addition of osmoticums to the nutrient medium has proved efficient for reduc<strong>in</strong>g growthrates of different plant species. An efficient protocol for mass micropropagation of A. montana was<strong>de</strong>veloped, which is an essential requirement for prolonged <strong>in</strong> vitro storage. In vitro study of mannitolon conservation of A. montana plants was conducted. The plants were cultured on ½ Murashige andSkoog (MS) root<strong>in</strong>g medium conta<strong>in</strong><strong>in</strong>g 2% sucrose, 0.5 mg/l IBA and different addition of mannitol(0, 1, 2, 3 and 4%). The <strong>de</strong>velopment of shoot and root growth as well as percentage of survival wasevaluated dur<strong>in</strong>g 1, 3 and 6 months of <strong>in</strong> vitro storage. It was found that ½ MS medium supplementedwith 2% mannitol effectively retar<strong>de</strong>d shoot and root length and number of formed roots. After sixmonths the survival rate was 65%. A comb<strong>in</strong>ation of mannitol and low light <strong>in</strong>tensity was mosteffective <strong>in</strong> prolong<strong>in</strong>g the term between subcultures. The survived plantlets regenerated new shootsafter subcultivation onto the fresh propagation medium. An effective protocol for long-term <strong>in</strong> vitroconservation of A. montana <strong>in</strong> slow growth conditions was <strong>de</strong>veloped, allow<strong>in</strong>g the storage of thisendangered species <strong>in</strong> tissue culture.Keywords: Arnica montana, <strong>in</strong> vitro conservation, mannitol, slow growth1. INTRODUCTIONIn the last <strong>de</strong>ca<strong>de</strong>s many valuable plant species are threatened with ext<strong>in</strong>ction dueto unfavorable environmental conditions. Application of mo<strong>de</strong>rn approaches to preservationof natural plant resources should be a major goal of researches. Conservation throughtraditional methods requires much efforts, area and funds (Charoensub and Phansiri, 2004).Plant material is vulnerable to natural disasters, climate changes, attacks by pests anddiseases dur<strong>in</strong>g cultivation. The conventional methods for propagation are slow and<strong>in</strong>cl<strong>in</strong>ed to unprofitable losses. Therefore it is necessary to <strong>de</strong>velop alternative methods forconservation of endangered and rare medic<strong>in</strong>al plants us<strong>in</strong>g plant tissue culture (Fay, 1994).The germplasm preservation allows reduction of the number of subcultures and ma<strong>in</strong>ta<strong>in</strong>sthe genetic diversity of species <strong>in</strong> a sterile condition ensur<strong>in</strong>g retention of plant stability(Moges et al. 2003; Shibli at al. 2000). The growth rate of <strong>in</strong> vitro cultures can be limitedby various approaches <strong>in</strong>clud<strong>in</strong>g <strong>in</strong>cubation at reduced temperature and low light <strong>in</strong>tensity,changes <strong>in</strong> some media components, additions of osmoticums and growth retardants (Shibliet al, 2006). In vitro storage un<strong>de</strong>r slow-growth conditions were carried out for certa<strong>in</strong>species like banana, potato, yam and cassava and were rout<strong>in</strong>ely used for protection ofsome valuable species (Ashmore, 1997).Arnica montana L. is a well known medic<strong>in</strong>al plant spread <strong>in</strong> the mounta<strong>in</strong>s <strong>in</strong>various regions of Europe. It is a rare and endangered species wi<strong>de</strong>ly applied <strong>in</strong> pharmacy,
Proceed<strong>in</strong>g of the 4 rd International Symposium“NEW RESEARCH IN BIOTECHNOLOGY” USAMV Bucharest, Romania, 2011homeopathy and cosmetics. The plant is used as anti-<strong>in</strong>flammation drug stimulat<strong>in</strong>g woundheal<strong>in</strong>g. It possesses also bacteriostatic, fungistatic, antirheumatic, cardiotonic andantihyperlipi<strong>de</strong>mic effects (Willuhn, 1998). At present circumstances - law protected statusand enhanced pharmacy <strong>in</strong>terest it is necessary to elaborate methods for preservation ofvaluable clones of this species.The objective of the present study was to <strong>de</strong>velop an effective protocol for longterm<strong>in</strong> vitro conservation of A. montana un<strong>de</strong>r slow growth conditions allow<strong>in</strong>g the storageof this endangered plant.2. MATERIALS AND METHODSProlonged <strong>in</strong> vitro conservation of plant material: The A. montana shoots were obta<strong>in</strong>edfrom <strong>in</strong> vitro seedl<strong>in</strong>gs of German population (Botanical gar<strong>de</strong>n, Chemnitz). The plantmaterial was ma<strong>in</strong>ta<strong>in</strong>ed on root<strong>in</strong>g medium (basal medium conta<strong>in</strong><strong>in</strong>g half-strength MSnutrients salts supplemented with 0.5 mg/l IBA) <strong>in</strong> or<strong>de</strong>r to align the phase of growth and<strong>de</strong>velopment. Retard<strong>in</strong>g the growth of cloned plants was accomplished through:- Us<strong>in</strong>g the half-strength MS medium- Reduc<strong>in</strong>g the concentration of sucrose- Addition of osmoticum (mannitol)- Cultivation un<strong>de</strong>r low light <strong>in</strong>tensity (20 µMm -2 s -1 )For the experiment, A. montana plants were cultured on ½ MS medium conta<strong>in</strong><strong>in</strong>g 2%sucrose, 0.5 mg/l IBA and different addition of mannitol (0; 1; 2; 3 and 4%). The mediumwithout mannitol was used as control. The plants were placed vertically <strong>in</strong> the glass tube(150 x 20 mm), conta<strong>in</strong><strong>in</strong>g 8 ml of root<strong>in</strong>g medium. One shoot per culture tubes was<strong>in</strong>oculated and each treatment <strong>in</strong>volved 20 plants.The treatments were repeated two times.A survival of plants was monitored each month with<strong>in</strong> six months without subcultivation.The survival of prolonged storage <strong>in</strong> vitro cultures was <strong>de</strong>term<strong>in</strong>ed by the presence of greenplants with healthy grow<strong>in</strong>g tips without necrosis. The percentages of rooted plants, heightof vegetative part of plants and root length were recor<strong>de</strong>d dur<strong>in</strong>g storage (1, 3 and 6 monthof culture).Multiplication of A. montana plants after long-term storage plant material: Therecovery of plants after prolonged cultivation on medium with mannitol was <strong>in</strong>itiated bycultur<strong>in</strong>g un<strong>de</strong>r optimal conditions for growth and <strong>de</strong>velopment. The plants weresubcultured on two different propagation media (full strength MS medium supplementedwith 1 mg/l BAP or comb<strong>in</strong>ation of 1 mg/l BAP and 0.1 mg/l IAA). The mean number ofshoots per explant after 3 and 6 months of <strong>in</strong> vitro conservation was recor<strong>de</strong>d. The datawere statistically analyzed us<strong>in</strong>g Sigma Stat computer package (Sigma Stat 3.1, SystatSoftware, San Jose, California, USA).Culture conditions: All media were adjusted to pH 5.6 before autoclav<strong>in</strong>g. The nutrientmedia were sterilized and autoclaved at 120 ºC for 20 m<strong>in</strong> at 1 atm. The cultures werestored at 22 ± 2 °C (16/8h photoperiod) and low light <strong>in</strong>tensity (20 µMm -2 s -1 ) for <strong>in</strong> vitroconservation of plant material and light <strong>in</strong>tensity (40 µMm -2 s -1 ) for recovery of plants afterprolonged cultivation.57
Proceed<strong>in</strong>g of the 4 rd International Symposium“NEW RESEARCH IN BIOTECHNOLOGY” USAMV Bucharest, Romania, 20113. RESULTS AND DISCUSSIONProlonged <strong>in</strong> vitro conservation: The literature survey revealed that up to now theprotocol for <strong>in</strong> vitro conservation of A. montana un<strong>de</strong>r slow growth conditions have notbeen <strong>de</strong>veloped. The ma<strong>in</strong> requirement for prolonged <strong>in</strong> vitro storage is an effective methodfor micropropagation, as <strong>de</strong>scribed previously (Petrova et. al. 2005, 2011). Table 1 presentsboth optimal propagation medium and root<strong>in</strong>g medium for <strong>in</strong> vitro conservation of A.montana plants.Table 1. Murashige and Skoog nutrient media modified for A. montana <strong>in</strong> vitro conservationNutrient mediumNutrient media for <strong>in</strong> vitro conservationcompositionMSP (for microMSR (for root<strong>in</strong>g)propagation)MS Full strength Half strengthSucrose (%) 3 2Agar (%) 0.6 0.6BAP (mg/l) 1.0IAA (mg/l) 0.1IBA (mg/l) 0.5Mannitol (%) 2The clonal propagation of plants can be saved valuable genotype, but the process nee<strong>de</strong>dplant subcultivation on fresh medium every months. In vitro conservation through retard<strong>in</strong>gthe growth allows subcultivation at significantly longer periods (several months to year),which is more economically profitable (Negash et al. 2001). In our study slow growth ofplants was achieved by ma<strong>in</strong>ta<strong>in</strong><strong>in</strong>g <strong>in</strong> vitro cultures <strong>in</strong> the presence of osmoticum(mannitol) at concentration 0; 1; 2; 3 and 4% and low light <strong>in</strong>tensity (Table 2, Fig.1).Table 2. Effect of different concentration of mannitol on survival rate of A. montana plantsConcentrationof mannitol at½ МS nutrientmedium (%)After 1 month After 3 months After 6 monthsSurvival,%Root<strong>in</strong>g,%Survival,%Root<strong>in</strong>g,%Survival,%Root<strong>in</strong>g,%0 100 1001 90 100 90 952 65 80 65 70 65 553 55 40 40 354 20 058
Proceed<strong>in</strong>g of the 4 rd International Symposium“NEW RESEARCH IN BIOTECHNOLOGY” USAMV Bucharest, Romania, 2011a b c d eFig.1 A. montana plants ma<strong>in</strong>tened on ½ MS nutrient medium with different concentration of mannitol:а) Control; b) 1%; c) 2%; d) 3%; e) 4%The plants cultivated on ½ MS root<strong>in</strong>g medium (control) formed well <strong>de</strong>veloped rootsystem. The percentage of rooted plants reached 100% on the first month after <strong>in</strong>oculation.The plants nee<strong>de</strong>d a transfer to fresh medium because of their rapid growth (2.8 cm). Whenadd<strong>in</strong>g 1% mannitol to the medium the plants were viable and the percentage of survivaland root<strong>in</strong>g was 90 and 100% respectively, after one month of cultivation (Table 2). Thepresence of 1% mannitol <strong>in</strong>itiated formation of 2-3 adventives shoots at the base of plant.On the other hand this concentration of mannitol caused growth reduction of vegetative partof plants (average height 1.7 cm), but the length of roots rema<strong>in</strong>ed almost the same ascontrol (2.4 cm), allow<strong>in</strong>g plants to be ma<strong>in</strong>ta<strong>in</strong>ed for three months (Fig. 2). After thisperiod of time subcultivation on fresh medium was required. The addition of 2% mannitolestablished condition of osmotic stress, which reduced the growth rate and produced shortplants. Thus <strong>in</strong>creased the time of subcultivation, but <strong>de</strong>creased values of all parameters<strong>in</strong>vestigated. This concentration of mannitol was retar<strong>de</strong>d <strong>de</strong>velopment of plants comparedto control. The survival rate <strong>de</strong>creased to 65% <strong>in</strong> the first month and rema<strong>in</strong>ed constantuntil the end of cultivation. The stems were shortened, the leaves were with small size andthe <strong>de</strong>velopment of root system was <strong>de</strong>ta<strong>in</strong>ed. This allowed subcultivations of plants aftersix months. The average height of plants was reduced to 1.1 cm. The differences betweenthe heights of control plants and those cultivated on MS medium supplemented with 2%mannitol were well proven statistically (Р≥0.01). The number of formed roots and theirlength were also reduced. The plants that didn’t form roots required an earlier transfer tofresh medium. The comb<strong>in</strong>ation of 2% sucrose and 2% mannitol <strong>in</strong> ½ MS mediumprovi<strong>de</strong>d slow plant growth and <strong>in</strong>creased the storage period of six months. It was foundthat this comb<strong>in</strong>ation is optimal for <strong>in</strong> vitro conservation of plants ma<strong>in</strong>ta<strong>in</strong>ed un<strong>de</strong>r lowlight <strong>in</strong>tensity. The further <strong>in</strong>creas<strong>in</strong>g of mannitol concentration led to yellow<strong>in</strong>g of leaves59
Proceed<strong>in</strong>g of the 4 rd International Symposium“NEW RESEARCH IN BIOTECHNOLOGY” USAMV Bucharest, Romania, 2011and necrosis of plant tips. The plants died after the third month. The content of 4%mannitol <strong>in</strong> the medium blocked the growth and <strong>de</strong>velopment of plants. The survival ratewas low (20%) and plants died <strong>in</strong> the first month after <strong>in</strong>oculation.mm353025Plant heightRoot length20151050МS0 MS 1% MS 2% MS 3%Concentration of mannitolFig. 2 Effect of mannitol on the plant height and root length of A. montana un<strong>de</strong>rconditions of slow growthMultiplication of A. montana plants after prolonged <strong>in</strong> vitro conservation: In vitro culturescould be effectively ma<strong>in</strong>ta<strong>in</strong>ed for 6 months. The plants were transferred to MS free mediumwithout growth regulator and osmoticum <strong>in</strong> or<strong>de</strong>r to return towards normal growth and<strong>de</strong>velopment. The plant growth was restored at a temperature of 22 ± 2 °C and light <strong>in</strong>tensity of40 µMm -2 s -1 . The plants subsequently were micropropagated on MS media conta<strong>in</strong><strong>in</strong>g 1.0 mg/lBAP alone or <strong>in</strong> comb<strong>in</strong>ation with 0.1 mg /l IAA after three and six months of storage. Shootsthat had been <strong>in</strong>cubated for 6 months multiplied slowly on multiplication medium un<strong>de</strong>r normalgrowth conditions. It was necessary one or two passages of plants subcultivation before startedthe process micropropagation. Basal part of plant tissue slowly expan<strong>de</strong>d and <strong>in</strong>duction of newvegatative buds was started. The <strong>in</strong>crease of the swollen tissues and the formation ofadventitious buds were more obviously <strong>in</strong> cultures grown on MS medium supplemented with 1mg/l BAP and 0.1 mg/l IAA. On this medium also the higher micropropagation rate wasobserved <strong>in</strong> comparison with plants cultivated on MS medium supplemented with 1 mg/l BAP.The plants produced 2-3 new shoots (MS medium with 1 mg/l BAP) and 3.5- 4 shoots (MSmedium with 1 mg/l BAP and 0.1 mg/l IAA) dur<strong>in</strong>g sub-cultivation after three months ofstorage. The micropropagation frequency was significantly lower <strong>in</strong> plants ma<strong>in</strong>ta<strong>in</strong>ed sixmonths <strong>in</strong> terms of slower growth than <strong>in</strong> three months (Table 3). S<strong>in</strong>ce the height of the plantswas reduced dur<strong>in</strong>g storage and ma<strong>in</strong> axes of the shoots were <strong>in</strong> a passive state, when the plantswere transferred to fresh medium for micropropagation they grew <strong>in</strong>to viable buds. The plantswere rooted successfully on ½ MS medium conta<strong>in</strong><strong>in</strong>g 0.5 mg/l IBA for rhizogenesis. Rootswere observed with<strong>in</strong> two weeks after the transfer of root<strong>in</strong>g medium.60
Proceed<strong>in</strong>g of the 4 rd International Symposium“NEW RESEARCH IN BIOTECHNOLOGY” USAMV Bucharest, Romania, 2011Table 3. Micropropagation of A. montana after prolonged <strong>in</strong> vitro conservation with mannitolNumber of shoots/explantNumber of shoots/explantAfter three monthsAfter six monthsSubcultivationBAP (1 mg/l) BAP (1 mg/l) + BAP (1 mg/l) BAP (1 mg/l) +IAA (0.1mg/l)IAA (0.1 mg/l)1 0.8±0.12 1.2±0.18 0.6±0.09 0.8±0.132 2.7±0.22 3.5±0.27 1.8±0.14 2.2±0.183 3.4±0.25 4.0±0.26 1.9±0.15 2.3±0.20The protocols of <strong>in</strong> vitro conservation were <strong>de</strong>veloped of few plant species. Mannitol at aconcentrations of 20 g/l ad<strong>de</strong>d to the medium reduced the growth of rose coloured leadwortplants and prolonged subcultivation eight months (Charoensub and Phansiri, 2004). Sarkar andNaik, 1998 reported that 20 or 40 g/l mannitol <strong>in</strong>creased the survival of potato <strong>in</strong> vitro plants,but concentration of 60 g/l, caused <strong>de</strong>ath of plants. The effect of mannitol for <strong>in</strong> vitro storage ofpotatoes (Mix, 1985), strawberries (Vysotskaya, 1994), bananas (Van <strong>de</strong>n Houwe et al. 1995)and enset (Negash et al., 2001) was reported.4. CONCLUSIONLong-term storage of <strong>in</strong> vitro plant material of A. montana un<strong>de</strong>r slow growth conditionsensures the <strong>de</strong>velopment of an effective system for protection and preservation of thisendangered medic<strong>in</strong>al species. In vitro cultures could be effectively ma<strong>in</strong>ta<strong>in</strong>ed on ½ MSmedium supplemented with 0.5 mg/l IBA and 2% mannitol for 6 months at 20 µMm -2 s -1 light<strong>in</strong>tensity. After prolonged storage the shoots were multiplied on MS medium supplemented with1 mg/l BAP and 0.1 mg/l IAA. This protocol can be used for <strong>in</strong> vitro conservation of valuable A.montana clones.ACKNOWLEDGEMENTS. The authors are grateful for the f<strong>in</strong>ancial support provi<strong>de</strong>d by theBulgarian National Science Fund, M<strong>in</strong>istry of Education, Youth and Science (Project DTK-02/38)REFERENCE1. Ashmore, S.E. (1997): Status report on the <strong>de</strong>velopment and application of <strong>in</strong> vitrotechniques for the conservation and use of plant genetic resources. IPGRI, Italy.2. Charoensub, R., Phansiri, S. (2004): In vitro Conservation of Rose ColouredLeadwort:Effect of Mannitol on Growth of Plantlets Kasetsart J. Nat. Sci. Vol.38: 97 - 1023. Fay, M.F. (1994): In what situations is <strong>in</strong> vitro culture appropriate to plant conservation?Biodiversity and Conservation. Vol. 3:176-183.4. Mix, G. (1985): In vitro preservation of potato genotypes. In: Langhe W, Zeven AC &Hogenboom NG (eds) Efficiency <strong>in</strong> Plant Breed<strong>in</strong>g Pudoc, Wagen<strong>in</strong>gen, The Netherlands,pp 194–195.61
Proceed<strong>in</strong>g of the 4 rd International Symposium“NEW RESEARCH IN BIOTECHNOLOGY” USAMV Bucharest, Romania, 20115. Moges, A. D., Karam, N. S., Shibli, R. A. (2003): Slow growth <strong>in</strong> vitro preservation ofAfrican violet (Sa<strong>in</strong>tpaulia ionantha Wendl.) Advances <strong>in</strong> horticultural science, No. 4,pages 223-2306. Negash, A., Krens, F., Schaart, J., Visser, B. (2001): In vitro conservation of enset un<strong>de</strong>rslow-growth conditions. Plant Cell, Tissue and Organ Culture Vol.66: 107–111.7. Petrova, M., Zayova, E., Yankova, E., Baldzhiev, G. (2011): Plant regeneration from callusculture of Arnica montana. Romanian Biotechnological Letters, Supplement, Vol. 16,1: 92-978. Petrova, M., Tasheva, K., Zagorska, N., Evstatieva L. (2005): In vitro propagation of Arnicamontana L. Comptes Rendus <strong>de</strong> L’Aca<strong>de</strong>mie Bulgare <strong>de</strong>s Sciences, Vol. 58, 1: 67 – 72.9. Sarkar, D., Naik P.S. (1998): Factors affect<strong>in</strong>g m<strong>in</strong>imal growth conservation of potatomicroplants <strong>in</strong> vitro. Euphytica Vol. 102(2): 275-280.10. Shibli, R.A., Shatnawi, M.A., Subaih, W.S., Ajlouni, M.M. (2006): In vitro conservation andcryopreservation of plant genetic resources: a review. World Journal of AgriculturalSciences 2, 4: 372-38211. Shibli RA, Al-Juboory KH. (2000): Cryopreservation of 'Nabali' olive (Olea europea l.)somatic embryos by encapsulation-<strong>de</strong>hydration and encapsulation-vitrification. CryoLetters. 21, 6:357-366.12. Van <strong>de</strong>n Houwe, I., Smet <strong>de</strong>, K., Tezenas du, M.H., Swennen, R.(1995): Variability <strong>in</strong>storage potential of banana shoot cultures un<strong>de</strong>r medium term storage conditions. Plant CellTiss. Org. Cult. Vol. 42:269–27413. Vysotskaya, O.N. (1994): Long-term ma<strong>in</strong>tenance of strawberry plants <strong>in</strong> vitro. Russian J.Plant Physiol. Vol. 41: 827–83314. Willuhn, G. (1998): Arnica flowers: pharmacology, toxicology and analysis of thesesquiterpene lactones-their ma<strong>in</strong> active substances. In: Lawson L. D., Bauer R. (ed.):Phytomedic<strong>in</strong>es of Europe, ACS Symp. Ser 691 Am. Chem. Soc. Vol. 691:118–13262
Proceed<strong>in</strong>g of the 4 rd International Symposium“NEW RESEARCH IN BIOTECHNOLOGY” USAMV Bucharest, Romania, 2011INFLUENCE OF PRE-SOWING TREATMENT OF SORGHUM SEEDSWITH MICROELEMENTS ON THE GERMINATION AND GROWTH OFPLANTS IN THE INITIAL STAGES OF THEIR DEVELOPMENTSVILEN RAYKOV, MARIELA ANDREEVA, MILENA SIMEONOVAUniversity of Shumen “K. Preslavski”, e-mail: rajkov_svilen@abv.bgAbstract. Conta<strong>in</strong>er tests with sorghum seeds soaked for 24 hours <strong>in</strong> solutions with concentration20mg/l of the follow<strong>in</strong>g substances - ZnSO 4 , MnSО 4 , H 3 BO 3 , CuSo 4 , MgSO 4 , and control sample –with water - were carried out, after which 50 seeds were planted. The germ<strong>in</strong>ation has been reportedand after gather<strong>in</strong>g of the test plants, the length of their roots and aboveground mass and the weightof the fresh and dried biomass.Based on the reported data it has been <strong>de</strong>term<strong>in</strong>ed that the highest germ<strong>in</strong>ation is present <strong>in</strong> theoption treated with MgSO 4 and <strong>in</strong> the control sample (92%), followed by the options with H 3 BO 3 (88%) и CuSO 4 (84%), and the lowest germ<strong>in</strong>ation was with seeds, treated with MgSO 4 (80%) andZnSO 4 (78%).The pre-sow<strong>in</strong>g treatment with ZnSO 4 and with CuSO 4 stimulates the <strong>de</strong>velopment of the root system(respectively 49% and 20% longer than the control sample’s roots), and with H 3 BO 3 – of theaboveground mass (12% higher than the control samples).Microelements stimulate the accumulation of more water <strong>in</strong> plant tissue.Keywords: seeds, sorghum, microelements, germ<strong>in</strong>ation1. INTRODUCTIONLately a lot of works from different scientists, show<strong>in</strong>g the ability to <strong>in</strong>creaseyields of many plants by pre-sow<strong>in</strong>g treatment of seeds with different microelementssolutions, have appeared ( Peeran, SN and Natanasabapathy, S., 1980; Khalid, BY andMalik, NSA, 1982; Sherrell, CG.,1984; Marcar, NE and Graham, RD (1986; ). Somemicroelements have the ability to jo<strong>in</strong> up with specific prote<strong>in</strong>s and form biocatalysts –vitam<strong>in</strong>s and metallo enzymes, which stand out with their very high biological activity andplay an important role <strong>in</strong> the growth and <strong>de</strong>velopment of plants (Shkolnik, M. Y. andMakarova, N. A. 1957).In the late 30s Russian scientists P.A. Vlasyuk and I.K. Onishtenko conduct thefirst research on the <strong>in</strong>fluence of Zn feed<strong>in</strong>g on plants and prove its positive role. They<strong>de</strong>term<strong>in</strong>e that plants have the higher Zn needs <strong>in</strong> the early phases of growth and form<strong>in</strong>gand <strong>de</strong>velopment of the germ.Bondarenko (1956) carried out tests with which he proves the great effectivenessof boron fertilization of carbonate black earth.The issue of the <strong>in</strong>fluence of pre-sow<strong>in</strong>g treatment of seeds with microelements onthe activity of root micro flora also <strong>de</strong>serves attention. In this respect the experiments ofRahno (1950) which show an <strong>in</strong>crease of microorganisms <strong>in</strong> the risosphere of roots, andwith them of physiological processes of the plants, is of <strong>in</strong>terest.Some researchers (Kornilov, A.F. and Deeva V.P., 1955) th<strong>in</strong>k that pre-sow<strong>in</strong>gtreatment of seeds is a type of root fertilization but <strong>in</strong> fact pre-sow<strong>in</strong>g treatment of plants63
Proceed<strong>in</strong>g of the 4 rd International Symposium“NEW RESEARCH IN BIOTECHNOLOGY” USAMV Bucharest, Romania, 2011have the advantage before root feed<strong>in</strong>g with the fact that each plant is provi<strong>de</strong>d with thenee<strong>de</strong>d quantity of any given microelement and those microelements are placed directly <strong>in</strong>the plant. This is an easy and cheap way of feed<strong>in</strong>g up of plants <strong>in</strong> the <strong>in</strong>itial stages of their<strong>de</strong>velopment.By treat<strong>in</strong>g seeds before sow<strong>in</strong>g one can achieve not only an even feed<strong>in</strong>g up ofplants with microelements but also a reset of vital processes <strong>in</strong> the germ itself(Lorenz,1980; Agarwala S.C. and colleagues,1995; Hong F.S.and colleagues 1996;).The purpose of this test is to research the <strong>in</strong>fluence of pre-sow<strong>in</strong>g treatment ofsorghum seeds with the follow<strong>in</strong>g microelements – z<strong>in</strong>c, manganese, boron, magnesium,and copper on the germ<strong>in</strong>ation and growth of plants <strong>in</strong> the <strong>in</strong>itial stages of their<strong>de</strong>velopment.2. MATERIAL AND METHODSThis experiment was carried out <strong>in</strong> the Agricultural Institute – Shumen, whereconta<strong>in</strong>er tests were set with seeds for gra<strong>in</strong> sorghum, Sadovo species, crop 2010. Seedswere soaked for 24 hours <strong>in</strong> water solutions with concentration 20mg/l of the follow<strong>in</strong>gsubstances: ZnSO 4 , MnSО 4 , H 3 BO 3 , CuSO 4 , MgSO 4 and control – with water, after which50 seeds were planted at the same <strong>de</strong>pth <strong>in</strong> vegetation conta<strong>in</strong>ers with soil from the<strong>in</strong>stitute’s test fields. Soil is carbonate black earth with high humus content and soilreaction from slightly alkal<strong>in</strong>e to alkal<strong>in</strong>e (pH – 7,7-8,1). Reserves of available phosphorusis weak (16,3 – 21,8 P 2 O 5 на 100 gr.), and regard<strong>in</strong>g content of potassium, soil is mediumto well supplied (40,3 – 50,3 K 2 O /100 gr.).Plants have been grown to the 4-5 leaf phase. Germ<strong>in</strong>ation was reported at the 7 th ,8 th , 9 th and 13 th day from seed sow<strong>in</strong>g.After gather<strong>in</strong>g of test plants the length of their roots and aboveground mass aswell as the weight of dry and fresh biomass were measured.Statistical analysis was ma<strong>de</strong> by the bor<strong>de</strong>r difference method (Zapryanov, 1983).3. RESULTS AND DISCUSSIONFirst sprouts were registered on the 5 th day after sow<strong>in</strong>g of seeds treated withmagnesium and the control sample. On the 6 th day seeds treated with z<strong>in</strong>c and boron startedsprout<strong>in</strong>g, and on the 7 th day – seeds treated with manganese and copper.Figure 1 shows the dynamics of germ<strong>in</strong>ation of seeds soaked <strong>in</strong> solutions ofdifferent microelements. Results registered on the 8 th day after sow<strong>in</strong>g show that presow<strong>in</strong>genrichment of gra<strong>in</strong> sorghum seeds with CuSO 4 <strong>in</strong> concentration 20mg/l has asuppressive effect on germ<strong>in</strong>ation (16 of 50 sown seeds). The percentage of germ<strong>in</strong>atedseeds was highest <strong>in</strong> the control sample – from 50 sown seeds we have 43 germ<strong>in</strong>ated. Withthe rema<strong>in</strong><strong>in</strong>g options the number of germ<strong>in</strong>ated seeds varies from 34 (treated with ZnSO 4 )and 37 (treated with H 3 BO 3 ). On the 9 th day the germ<strong>in</strong>ated seeds <strong>in</strong> control conta<strong>in</strong>er and<strong>in</strong> options fed up with manganese and boron are almost equal (respectively 44, 42, 43germ<strong>in</strong>ated seeds) and the rest of the options keep their slower pace of germ<strong>in</strong>ation.64
Proceed<strong>in</strong>g of the 4 rd International Symposium“NEW RESEARCH IN BIOTECHNOLOGY” USAMV Bucharest, Romania, 2011Fig. 1. The dynamics of germ<strong>in</strong>ation of seeds soaked <strong>in</strong> solutions of different microelementsFrom 10 th day until 14 th day the dynamic of plumule growth <strong>in</strong>creases <strong>in</strong> the optionsoaked <strong>in</strong> CuSO4 solution, and seeds from options wi th z<strong>in</strong>c and magnesium germ<strong>in</strong>ateslower.Dur<strong>in</strong>g the last count of sprouts (13.06.2011) the highest germ<strong>in</strong>ation was reported<strong>in</strong> seeds treated with MnSO 4 and <strong>in</strong> the control option, treated with water ( 92% ) followedby H 3 BO 3 option (88%) and CuSO 4 ( 84%).The lowest level of germ<strong>in</strong>ation was found <strong>in</strong> seeds treated with MgSO 4 ( 80%) and ZnSO 4(78%).Accord<strong>in</strong>g to Bulgarian Standards requirements the m<strong>in</strong>imum germ<strong>in</strong>ation level ofpure sorghum seeds should not be lower than 80% and reported results (exclud<strong>in</strong>g samplestreated with ZnSo 4 ) meet those requirements.For the creation of a well-seasoned crop it is very important the simultaneousgerm<strong>in</strong>ation and sprout<strong>in</strong>g of plants. Regard<strong>in</strong>g this issue, microelements manganese andboron receive a positive mark.65
Proceed<strong>in</strong>g of the 4 rd International Symposium“NEW RESEARCH IN BIOTECHNOLOGY” USAMV Bucharest, Romania, 2011Idres and Aslam (1975) and Shaban and Eid (1982) who have exam<strong>in</strong>ed the presow<strong>in</strong>gtreatment of wheat seeds with ZnSO 4 , CuSO 4 and MgSO 4 and its effect ongerm<strong>in</strong>ation, report similar results.Table 1 shows the results from statistic treatment of the reported data for averagelength of roots and above ground parts of different options.66Table 1 Average length of root system and above ground parts of plants from different optionsOptionAverage length of rootcmD Sd t ProofRelativeZnSo 4 30,09 9,83 2,27 4,33 *** 149MnSО 4 20,96 0,7 1,85 0,38 - 103H 3 BO 3 17,50 2,76 1,32 2,09 * 86CuSo 4 24,21 3,95 2,02 1,96 - 120MgSO 4 21,60 1,34 1,78 0,75 - 107Control 20,26Average length ofOption above ground partcmD Sd t Proof%RelativeZnSo 4 19,74 0,13 0,98 0,13 - 101MnSО 4 19,65 0,04 1,0 0,04 - 100,2H 3 BO 3 22,02 2,41 0,93 2,59 * 112CuSo 4 20,98 1,37 1,06 1,29 - 107MgSO 4 20,38 0,77 0,85 0,91 - 104Control 19,61p 5%=2,02 p1%=2,70 p 0,1%=3,55Plants treated with ZnSO 4 and CuSO 4 have the best <strong>de</strong>veloped root systems.The average length of their roots surpasses the root length of control plantsrespectively by 49% and 20% and the difference between the control sample and the ZnSO 4option is statistically very well assured. Plants treated with H 3 BO 3 have the least <strong>de</strong>velopedroot system – 14% lower average length from that of control plants, and this difference isstatistically proven.The rema<strong>in</strong><strong>in</strong>g two options (MnSО 4 and MgSO 4 ) do not register consi<strong>de</strong>rabledifferences with the control samples (3-7%).Regard<strong>in</strong>g the average length of above ground parts of plants, differences varybetween 0,2% and 4%, best <strong>de</strong>veloped above ground mass compared to the control samplehave plants from seeds soaked <strong>in</strong> H 3 BO 3 (12% higher plants from those soaked <strong>in</strong> water).This difference is proven on statistical level.Data from this analysis confirms results of Bozhenko (1956) who has studied theeffect of pre-sow<strong>in</strong>g treatment of seeds with ZnSO 4 <strong>in</strong> different crops and <strong>de</strong>term<strong>in</strong>es thestimulat<strong>in</strong>g <strong>in</strong>fluence of microelement Zn on plant’s root system growth.%
Proceed<strong>in</strong>g of the 4 rd International Symposium“NEW RESEARCH IN BIOTECHNOLOGY” USAMV Bucharest, Romania, 2011Table 2 shows the proportion of roots and above ground parts of plants fromdifferent options <strong>in</strong> percent. This proportion <strong>in</strong> control is closer to 100 (103% <strong>in</strong> favor ofroot system). Plants from seeds soaked <strong>in</strong> MnSО 4 and MgSО 4 solution have results similarto those of control plants (respectively 105% and 106% <strong>in</strong> favor of the root system. Moresubstantial differences are reported <strong>in</strong> test plants treated with MnSО 4 , H 3 BO 3 and CuSO4.The average root length of ZnSo4 option exceeds the average length of above ground massby 52%, and CuSO 4 – by 15%. With H 3 BO 3 the values of average length of above groundmass are higher by 31%. These results show that Zn and Cu stimulate the <strong>de</strong>velopment ofroot system and B stimulates the <strong>de</strong>velopment of above ground mass.Table 3 shows the results from the measured weight of roots and above groundmass <strong>in</strong> fresh and dried condition. Weight of fresh roots of all test plants is less (from 49%to 21%) from that of control plants, lowest values measured <strong>in</strong> plants treated with ZnSO 4and MnSО 4 . Fresh mass weight of options with MnSО 4 , H 3 BO 3 , CuSO4 and MgSO4exceeds that of control plants respectively by 6%, 50%, 23% and 28%. Only <strong>in</strong> treated withZnSO 4 option the measured fresh weight of leafs and stalks is less by 11% from that of nontreatedseeds.OptionTable 2 Proportion between root and above ground parts length <strong>in</strong> different optionsRootOptionLength, cmAbove groundmassRootProportionZnSo 4 19,74 30,09 152,00MnSО 4 19,65 20,96 105,00H 3 BO 3 22,02 17,5 79,00CuSo 4 20,98 24,21 115,00MgSO 4 20,38 21,6 106,00Control 19,61 20,26 103,00Fresh massTable 3. Weight of fresh and dry biomass%Dry massAverage for 1 plant, g. Average for 1 plant, g.Relative Above Relative Relative Above RelativegroundRootground% mass %% mass %ZnSo 4 0,197 51 0,241 89 0,038 57 0,041 65MnSО 4 0,219 57 0,286 106 0,045 67 0,045 71H 3 BO 3 0,290 76 0,409 150 0,059 88 0,059 94CuSo 4 0,304 79 0,333 123 0,047 70 0,047 75MgSO 4 0,292 76 0,375 138 0,042 63 0,052 83Control 0,384 100 0,271 100 0,067 100 0,063 10067
Proceed<strong>in</strong>g of the 4 rd International Symposium“NEW RESEARCH IN BIOTECHNOLOGY” USAMV Bucharest, Romania, 2011Weight of dry roots and above ground parts <strong>in</strong> all test plants treated withmicroelements is less from that of control plants.It makes an impression that plants treated with MnSО 4 , H 3 BO 3 , CuSo 4 and MgSO 4have had a larger weight of leafs and stalks from the control sample <strong>in</strong> fresh condition, andafter dry<strong>in</strong>g the weight of their above ground parts is less than control plants which meansthat microelements stimulate the accumulation of more water <strong>in</strong> plant tissue.4. CONCLUSIONS- Highest germ<strong>in</strong>ation is registered <strong>in</strong> the option treated with MnSО 4 and <strong>in</strong> the controloption (92%) followed by option with H 3 BO 3 (88%) and CuSo 4 (84%).- Lowest germ<strong>in</strong>ation was registered <strong>in</strong> seeds treated with MgSO 4 (80%) and ZnSo 4 (78%)- Pre-sow<strong>in</strong>g treatment of seeds with ZnSo4 and with CuSo4 stimulates the <strong>de</strong>velopment ofthe root system (respectively by 49% and 20% longer roots than control sample), and withH 3 BO 3 – that of above ground mass (12% higher plants than control samples)- Plants treated with MnSО 4 , H 3 BO 3 , CuSo 4 and MgSO 4 have a larger weight of leafs andstalks <strong>in</strong> fresh condition, and after dry<strong>in</strong>g the weight of their above ground parts is less thanthat of control plants, which means that microelements stimulate the accumulation of morewater <strong>in</strong> plant tissues.REFERENCES681. Peeran, SN and Natanasabapathy, S. (1980).International Rice Research Potassiumchlori<strong>de</strong> pretreatment on rice seeds. International Rice Research.<strong>New</strong>sletter 5:192. Khalid, BY and Malik, NSA (1982). Presow<strong>in</strong>g soak<strong>in</strong>g of wheat seeds <strong>in</strong> copper andmanganese solutions.Communications <strong>in</strong> Soil Science and Plant Analysis 13:981–9863. Sherrell, CG (1984).Effect of molyb<strong>de</strong>num concentration <strong>in</strong> the seed on the response ofpasture legumes to molyb<strong>de</strong>num. <strong>New</strong> Zealand Journal of Agricultural Research 27:417–4234. Marcar, NE and Graham, RD (1986).Effect of seed manganese content on the growth ofwheat ( Triticum aestivum )un<strong>de</strong>r manganese <strong>de</strong>ficiency. Plant and Soil 96:165–173.5. Wilhelm, NS, Graham, RD and Rovira, AD (1988). Application of different sources ofmanganese sulphate <strong>de</strong>ficienct Australian <strong>de</strong>creases take-all ( Gaeumannomyces gram<strong>in</strong>isvar. tritici ) of wheat grown <strong>in</strong> a manganese <strong>de</strong>ficienct soil. Australian Journal ofAgricultural Research 39:1–10.6. Musakhanov, AN, 1964. Effect of trace elements and methods of their application on yieldof horse bean. Doki. Abad. S. Kh.Nauk. , (3): 26–8 ( Soil and Ferti., 27: 3213, 1964)7. Pomogaeva, A. and FA Butylk<strong>in</strong>, 1977. Effect of pre-sow<strong>in</strong>g seed treatment of lentil withthree trace elements on prote<strong>in</strong> contents.Sbor<strong>in</strong>k Nauchnykh Nauchnykh Trudov. Institute,90: 169–72( Field Crop Absts., 32: 3163; 1979)8. Lorenz O.Cereal sprouts: composition, nutritive value, food applications, Rev. Food. Sci.Nutr.1980;13(4):353-85)9. Osipova L.V., Obuhovskaya L.V., Vernichenko I.V., Effect of seed treatment withmicroelements on the adaptive potential of spr<strong>in</strong>g wheat // IV Congress of physiologists,1999 – p. 433-43410. Paylik I.S., Pre-sow<strong>in</strong>g treatment of seeds with microelements <strong>in</strong> Moldova // Microelements<strong>in</strong> biology and their use <strong>in</strong> agriculture and medic<strong>in</strong>e. Samarkand, 1990. / Proc. Conf XIProc. Conf. Samarkand, 1990. – p. 209-210.
Proceed<strong>in</strong>g of the 4 rd International Symposium“NEW RESEARCH IN BIOTECHNOLOGY” USAMV Bucharest, Romania, 201111. Agarwala S.C., Naitiyal B.D., Chaterjee C., Nautiyal N. Variations <strong>in</strong> copper and z<strong>in</strong>csupplest <strong>in</strong>fluence growth and activities of some enzymes <strong>in</strong> maize. // Soil Sci. and Plant.Nutr., 1995. V. 41. № 2. -P. 329-335.12. Hong F.S., Mo C.C., Wang X.M., Ji C.M. // Effect of Ca and Zn on seed vigor and activityof some forms <strong>in</strong> germ<strong>in</strong>at<strong>in</strong>g seeds of maize. // Plant. Physiol. Commun., 1996. V. 32. № 2.P. 110-112.13. Kornilov, A.F. and V.P. Deeva (1955) Foliar treatment of table beet with microelementssolutions. Sb. Foliar treatment of plants, 85-9114. Shkolnik, M.Y and N.A. Makarova (1957). Microelements <strong>in</strong> agriculture. Issued by ScienceAca<strong>de</strong>my of USSR15. Zapryanov, Z. 1983. Запрянов,З.1983.Manual for experimental activity. Zemizdat. Sofia.16. Idris, M. and M. Aslam, (1975). The effect of soak<strong>in</strong>g and dry<strong>in</strong>g seed17. before plant<strong>in</strong>g on the germ<strong>in</strong>ation and growth of Triticum vulgare un<strong>de</strong>r normal andsal<strong>in</strong>e conditions. Cand. J. Pl. Sci. Sci., 53: 1328–32.18. Shaban and A. Eid,( 1982). Effect of some micro-nutrients on seed germ<strong>in</strong>ation andseedl<strong>in</strong>g growth <strong>in</strong> miaze and cotton. Res. Bul.,Faculty Agri., A<strong>in</strong> Shams Uni., 2047: 1419. Bozhenko, V.P. (1956). Effect of z<strong>in</strong>c, molyb<strong>de</strong>num and boron on carbohydrate and prote<strong>in</strong>metabolism of red clover. Sb. Microelements <strong>in</strong> agriculture and medic<strong>in</strong>e. Moscow.69
Proceed<strong>in</strong>g of the 4 rd International Symposium“NEW RESEARCH IN BIOTECHNOLOGY” USAMV Bucharest, Romania, 2011SECTION III: FOOD BIOTECHNOLOGYEVALUATION OF INULIN GELLING PROPERTIES IN NEW TYPES OFJELLIESMAIJA KRONBERGA, DAINA KARKLINA, DACE KLAVA, RUTA GALOBURDAFaculty of Food Technology, Latvia University of Agriculture, Liela iela 2, Jelgava, Latvia, LV 3001Tel/fax No 37163022829, e-mail:maija.kronberga@<strong>in</strong>box.lvAbstract. Inul<strong>in</strong>-type fructans have become a topic of much <strong>in</strong>terest for both the food <strong>in</strong>dustry and forresearchers (Roberfroid, 2005). At high concentrations <strong>in</strong> water, above 25% for standard chicory<strong>in</strong>ul<strong>in</strong> and above 15% for long – cha<strong>in</strong> material, <strong>in</strong>ul<strong>in</strong> has gell<strong>in</strong>g properties (Glibowski, 2011).Therefore the objective of this research work was to evaluate effect of agar-agar and <strong>in</strong>ul<strong>in</strong> on thestructural properties of experimental gels.The research was carried out at the Latvia University of Agriculture, Faculty of Food Technology. Ingel production the <strong>in</strong>ul<strong>in</strong> pow<strong>de</strong>r was used to make mixed gels from the agar-agar and <strong>in</strong>ul<strong>in</strong>. Toprepare control samples the follow<strong>in</strong>g recipe was used: agar-agar (2 g), sucrose (28 g), water(145 g), citric acid (1 g) and <strong>in</strong>ul<strong>in</strong> pow<strong>de</strong>r (24 g). In the research amount of agar-agar was varied <strong>in</strong>the follow<strong>in</strong>g range: 1.0; 1.5; 2.0; 2.5 g. Agar-agar water solutions were boiled for 5 m<strong>in</strong>utes at thetemperature of 100 ºC, then sucrose and citric acid were ad<strong>de</strong>d to the solution and cooled down to85 ºC. Then <strong>in</strong>ul<strong>in</strong> pow<strong>de</strong>r was ad<strong>de</strong>d, mixture stirred and kept for 5 m<strong>in</strong>utes at the temperature85 ºC. The solution was hot filled <strong>in</strong> polystyrene conta<strong>in</strong>ers (150 ml), which were sealed with lids andcooled, down to 18 ºC.The gel strength (hardness) was characterised by cutt<strong>in</strong>g force. Texture was <strong>de</strong>term<strong>in</strong>ed us<strong>in</strong>g aTexture Analyser TA.XT Plus. Wire cutter (A/BC) was used to slice the jelly samples. Measurementswere carried out on samples at room temperature on the next day after gel samples were prepared.Structure of agar-agar and <strong>in</strong>ul<strong>in</strong> pow<strong>de</strong>r dissolved <strong>in</strong> water, control samples with agar-agar, and<strong>in</strong>ul<strong>in</strong>, as well as gel samples with both polysaccahari<strong>de</strong>s were analysed un<strong>de</strong>r the triocularmicroscope Axioskop 40. Pictures were taken by digital compact camera Canon PowerShot A620 via16 × 10 or 16 × 40 magnification of the microscopeIn experimental gel samples, <strong>in</strong>ul<strong>in</strong> concentration <strong>in</strong>fluenced the strength of the gels. The <strong>de</strong>crease <strong>in</strong>hardness of the gels can be expla<strong>in</strong>ed by different properties of <strong>in</strong>ul<strong>in</strong> and agar-agar. The strength ofthe gels became weaker when <strong>in</strong>ul<strong>in</strong> was used as agar-agar substitute.Keywords: <strong>in</strong>ul<strong>in</strong> pow<strong>de</strong>r, agar-agar, gels1. INTRODUCTIONJellies are not basic foods, but they are good complements to a diet if they are eaten <strong>in</strong>correct amounts (Figuerola et al., 2007). Jellies are high-energy products, mean<strong>in</strong>g that theproducts are not suitable or advisable for people who have glycemic problems, obesity,diabetes, and cardiovascular diseases.70
Proceed<strong>in</strong>g of the 4 rd International Symposium“NEW RESEARCH IN BIOTECHNOLOGY” USAMV Bucharest, Romania, 2011Sugar <strong>in</strong> jellies is essential to form not only to product sweet taste, but also the productstructure and gives to product calories (Bayarri et al., 2004). Some polysaccari<strong>de</strong>s can beused to replace sugar <strong>in</strong> different sweets obta<strong>in</strong><strong>in</strong>g products with lower calories.Inul<strong>in</strong> is legally classified as food or a food <strong>in</strong>gredient, and not as additive <strong>in</strong> all countrieswhere it is processed <strong>in</strong> a number of different ways for the health food market (Roberfroid,2005, Frack, 2002; Kaur et al., 2002). Inul<strong>in</strong> has been <strong>de</strong>f<strong>in</strong>ed as a polydispersecarbohydrate consist<strong>in</strong>g ma<strong>in</strong>ly of β – (2→1) fructosylfructose l<strong>in</strong>ks (Roberfroid, 2005).The most common are: native <strong>in</strong>ul<strong>in</strong> with an average <strong>de</strong>gree of polymerization (DP) of 10–12, <strong>in</strong>ul<strong>in</strong> conta<strong>in</strong><strong>in</strong>g short cha<strong>in</strong> fractions (with DP from 2 to 10) and a high performance<strong>in</strong>ul<strong>in</strong> with an average DP no less than 23 (Roberfroid, 2005).Inul<strong>in</strong> offers technological properties for a wi<strong>de</strong> scope of food applications as well asimportant nutritional benefits. At high concentrations (> 25% <strong>in</strong> water for native and > 15%for long-cha<strong>in</strong> <strong>in</strong>ul<strong>in</strong>) <strong>in</strong>ul<strong>in</strong> has gell<strong>in</strong>g properties and forms a participle gel network<strong>in</strong>gafter shear<strong>in</strong>g (Kim et al. 2001, Glibowski and Wasko 2008, Glibowski, 2009; Glibowskiand Bukowska, 2011). When <strong>in</strong>ul<strong>in</strong> is thoroughly mixed with water, a white creamystructure is obta<strong>in</strong>ed that can easily be <strong>in</strong>corporated <strong>in</strong> foods to replace fat. One of is its fatmimetic property which is used <strong>in</strong> the production of yogurts with <strong>de</strong>creased caloricity andfull fat taste (Guven et al., 2005) and <strong>in</strong> ice-cream (El-Nagar et al., 2002) production.Inul<strong>in</strong> <strong>in</strong>corporation <strong>in</strong>to baked goods allows the replacement of sugar, fibre enrichmentand better moisture retention properties (Frack, 2002). Inul<strong>in</strong> has found an <strong>in</strong>terest<strong>in</strong>gapplication as low calorie bulk <strong>in</strong>gredient <strong>in</strong> chocolate to replace sugar. Inul<strong>in</strong> syrup alsocan be used to substitute sugar <strong>in</strong> low-sugar jelly formulations by obta<strong>in</strong><strong>in</strong>g differentproduct quality (Kronberga et al., 2011; Kronberga and Karkl<strong>in</strong>a, 2011).Agar has been used for many centuries as a high performance gell<strong>in</strong>g agent (Armisen et al.,2000; Stanley, 2006). Agar forms one of the strongest gels. Its ability to produce clear,colourless, odourless, and natural gels without the support of other colloids has long beenexploited by the food <strong>in</strong>dustry not only as a stabilizer and gell<strong>in</strong>g agent but also <strong>in</strong> themanufactur<strong>in</strong>g of confectionery (Barrangou et al., 2006).Interactions between hydrocolloids may modify the gel characteristics. The polysacchari<strong>de</strong>differs from other hydrocolloids <strong>in</strong> property of its high gel strength. The synergistic effectof <strong>in</strong>ul<strong>in</strong> with other gell<strong>in</strong>g agents constitutes additional advantage <strong>in</strong> all these applications.In several products <strong>in</strong>ul<strong>in</strong>, and especially long cha<strong>in</strong> version, can even (partially) replacegelat<strong>in</strong>e, starch, malto<strong>de</strong>xtr<strong>in</strong>, and other stabilizers. As of present jelly structure propertiesaffected by agar-agar and <strong>in</strong>ul<strong>in</strong> have not been <strong>in</strong>vestigated <strong>de</strong>creas<strong>in</strong>g the content of agarand <strong>in</strong>creas<strong>in</strong>g the content of <strong>in</strong>ul<strong>in</strong> <strong>in</strong> jellies. The knowledge of the mixed gels as well asthe stability of such gels becomes very important for the <strong>de</strong>velopment new products.Therefore the objective of this research work was to evaluate effect of agar-agar and <strong>in</strong>ul<strong>in</strong>on the structural properties of experimental gels.2. MATERIALS AND METHODSInul<strong>in</strong> granulated pow<strong>de</strong>r ma<strong>de</strong> from chicory root (Orafti GR produced by BENEO-Orafti,Belgium) was used <strong>in</strong> the experiments. Agar pow<strong>de</strong>r produced by AgarNordS, Estonia (E406) was used for preparation of experimental jellies. Sugar (Dansukker, Denmark) andcitric acid (E 330) were purchased <strong>in</strong> local retail<strong>in</strong>g and ad<strong>de</strong>d to experimental gels.71
Proceed<strong>in</strong>g of the 4 rd International Symposium“NEW RESEARCH IN BIOTECHNOLOGY” USAMV Bucharest, Romania, 2011Gel samples were prepared us<strong>in</strong>g concentrations of <strong>in</strong>ul<strong>in</strong> pow<strong>de</strong>r (23.5–25 g), agar-agar(1.0–2.5 g) sucrose (28 g) and water (145 g).Agar-agar was swollen <strong>in</strong> cold water, and then the mixture was heated until agar-agar wasdissolved <strong>in</strong> water. Agar-agar/water solution was boiled for 5 m<strong>in</strong>utes at a temperature of100 °C, and then sucrose and citric acid ad<strong>de</strong>d to the solution. Solution was cooled down to85 °C and <strong>in</strong>ul<strong>in</strong> pow<strong>de</strong>r was ad<strong>de</strong>d, mixture stirred and kept for 5 m<strong>in</strong>utes at thetemperature 85 °C.Subsequently, the obta<strong>in</strong>ed agar–agar/water with <strong>in</strong>ul<strong>in</strong> pow<strong>de</strong>r, sugar and citric acid washot–filled <strong>in</strong> polystyrene conta<strong>in</strong>ers (150 ml), which were covered with lids and cooleddown to 18 °C. To compare results of experimental gels the control samples were preparedus<strong>in</strong>g only agar-agar or <strong>in</strong>ul<strong>in</strong> pow<strong>de</strong>r. The analyses of the structure were carried out on thenext day after all k<strong>in</strong>ds of gel samples were prepared.Gel strength (hardness)The gel strength (hardness) was characterised by cutt<strong>in</strong>g force. The texture was <strong>de</strong>term<strong>in</strong>edby us<strong>in</strong>g the Texture Analyser Mo<strong>de</strong>l TA.XT Plus (Stable Micro Systems, UK) equippedwith a load cell of 50 kg. The gel samples were positioned on a platform and cut us<strong>in</strong>g wirecutter (A/BC). The test<strong>in</strong>g conditions were cross-head movement at a constant speed of1 mm s -1 , a trigger po<strong>in</strong>t of 0.09 N, distance 13 mm. The average values of tenmeasurements are reported.Prepar<strong>in</strong>g of microscopic samples of <strong>in</strong>ul<strong>in</strong> and agar-agar pow<strong>de</strong>r suspen<strong>de</strong>d <strong>in</strong> water, an<strong>de</strong>xperimental gels (Table 1)Structure of agar-agar and <strong>in</strong>ul<strong>in</strong> pow<strong>de</strong>r dissolved <strong>in</strong> water, control gel samples with agaragar,<strong>in</strong>ul<strong>in</strong> as well as gel samples with both polysaccahari<strong>de</strong>s were analysed un<strong>de</strong>r thetriocular microscope Axioskop 40 (epifluorescence, excitation 450–490 nm, emission>500 nm). Pictures were taken by digital compact camera Canon PowerShot A620 via16 × 10 or 16 × 40 magnification of the microscope.The samples of experimental gels were cut <strong>in</strong> a 5 µm layer by <strong>de</strong>vice Microm HM315.Preparations were placed on a glass sli<strong>de</strong>.Table 1. Recipes of the samples for analysis of microstructure and texture (g)Ingredients Samples1 2 3 4 5 6Agar 2 - 2.5 2 1.5 1Inul<strong>in</strong> - 24 23.5 24 24.5 25Water 145 145 145 145 145 145Sugar - - 28 28 28 28Citric acid - - 1 1 1 1Total 147 169 200 200 200 200Microsoft Excel software was used for the research purpose to calculate mean values andstandard <strong>de</strong>viations of the experimental data obta<strong>in</strong>ed <strong>in</strong> the research.72
Proceed<strong>in</strong>g of the 4 rd International Symposium“NEW RESEARCH IN BIOTECHNOLOGY” USAMV Bucharest, Romania, 20113. RESULTS AND DISCUSSIONFor <strong>de</strong>velop<strong>in</strong>g of new products that meet the people’s needs for a non-sugar diet, most ofthe foods are prepared by substitut<strong>in</strong>g sugar with sugar replacers – other sweeteners whichgive lower calories (sugar gives 4 kcal while fibre – 2 kcal per gram of the product)(Commission Directive 90/496/EU, Commission Directive 2008/100/EU). Jelly is a productmanufactured by cook<strong>in</strong>g fruit juice with ad<strong>de</strong>d sugar, glucose syrup and agar-agar(Figuerola, 2007).Sugar serves as a preserv<strong>in</strong>g agent and gell<strong>in</strong>g aid. For proper structure, jelly productsrequire the correct comb<strong>in</strong>ation of agar, sugar and glucose syrup (Tabata, 1999; Bayarri etal., 2004). In or<strong>de</strong>r to exam<strong>in</strong>e how the strength (hardness) of gel changes, the <strong>de</strong>velopmentof an optimum gel mo<strong>de</strong>l is <strong>in</strong> progress without add<strong>in</strong>g any extra taste, aroma or colouradditives (e.g., fruit or berry juice).Regard<strong>in</strong>g the gel strength (hardness), the data of gel texture <strong>in</strong> the literature sources is<strong>in</strong>sufficient. Even very m<strong>in</strong>or changes <strong>in</strong> composition or process<strong>in</strong>g variables candramatically <strong>in</strong>fluence the textural properties of jellies (Kim et al., 2001, Matsuhashi, 1990,Panouille and Larreta-Gar<strong>de</strong>, 2009). Table 2 shows the gel strength of experimental gelsamples if the content of agar-agar is <strong>de</strong>creased and the content of <strong>in</strong>ul<strong>in</strong> <strong>in</strong> jellies is<strong>in</strong>creased. For example, the hardness of gel is 2.87±0.14 N (sample 1) if 2.5 g of agar–agarare ad<strong>de</strong>d, but 0.31±0.02 N (sample 4) if 1.0 g of agar is ad<strong>de</strong>d. The concentration of <strong>in</strong>ul<strong>in</strong>pow<strong>de</strong>r was <strong>in</strong> the range from 23.5 to 25 g 100 g -1 <strong>in</strong> gel mix.Table 2. Gel strength of experimental samplesSample no Amount of agar-agar, g 100 g -1 Gel strength, N1 2.5 2.87 ± 0.142 2.0 2.38 ± 0.123 1.5 0.96 ± 0.054 1.0 0.31 ± 0.02In this case the gel strength is a strong function of agar-agar concentration <strong>in</strong> gels. Thestrength of experimental gels <strong>de</strong>creases with <strong>in</strong>crease <strong>in</strong> the content of <strong>in</strong>ul<strong>in</strong> <strong>in</strong> gels. Incomparison with agar-agar gel, the mixed gels were more easily <strong>de</strong>formable and they hadlower strength. The significance of these <strong>in</strong>teractions could <strong>in</strong>fluence the functionality ofagar-agar <strong>in</strong> jellies. The type of <strong>in</strong>ul<strong>in</strong> pow<strong>de</strong>r used <strong>in</strong> experiment, and its concentration didnot form stable gel. More concentrated samples with <strong>in</strong>ul<strong>in</strong> pow<strong>de</strong>r (50 and 60 g 100 g -1 )have to be prepared for formation har<strong>de</strong>r gels (Chiavaro et al., 2007).Figure 1 and Figure 2 show the microscopic images of particle size of <strong>in</strong>ul<strong>in</strong> and agar-agarpow<strong>de</strong>r suspen<strong>de</strong>d <strong>in</strong> water and experimental gels. Agar can form either transparent oropaque gels which are thermally reversible on heat<strong>in</strong>g and cool<strong>in</strong>g (McClements, 2007).Inul<strong>in</strong> with a crystal structure un<strong>de</strong>rgoes dispersion and forms a suspension <strong>in</strong> a waterenvironment at room temperature. Most of the crystals do not change their structure. Thecrystals which do not dissolve form a weak three-dimensional network which isstrengthened by dissolved <strong>in</strong>ul<strong>in</strong> (Glibowski and Pikus, 2011). Obta<strong>in</strong>ed results showed thatafter heat<strong>in</strong>g and cool<strong>in</strong>g the agar–agar is swollen and it formed the gel structure The73
Proceed<strong>in</strong>g of the 4 rd International Symposium“NEW RESEARCH IN BIOTECHNOLOGY” USAMV Bucharest, Romania, 2011crystals of <strong>in</strong>ul<strong>in</strong> are not so swollen at 100 ºC temperature and reta<strong>in</strong>ed similar structureafter heat<strong>in</strong>g. The formation of partial gel was observed. At mo<strong>de</strong>rate temperature (60–70 ºC), the polymer cha<strong>in</strong>s of <strong>in</strong>ul<strong>in</strong> may have active movement <strong>in</strong> the solution due tohigher k<strong>in</strong>etic energy. This may help the <strong>in</strong>ul<strong>in</strong> cha<strong>in</strong> be better dispersed <strong>in</strong> solution. Thusthe better contact between <strong>in</strong>ul<strong>in</strong> cha<strong>in</strong>s becomes easier dur<strong>in</strong>g cool<strong>in</strong>g to form gelstructure. At high temperature (100 ºC) the <strong>in</strong>ul<strong>in</strong> cha<strong>in</strong> may start to <strong>de</strong>gra<strong>de</strong> <strong>in</strong>to shortercha<strong>in</strong>s by hydrolysis which makes it har<strong>de</strong>r to form a gel (Kim et al., 2001).ACBDFig. 1. Microscopic image of agar-agar and <strong>in</strong>ul<strong>in</strong> (16 × 10 or 16 × 40):A - pow<strong>de</strong>r of agar-agar; B – agar-agar heated <strong>in</strong> water at 100 °C; C - pow<strong>de</strong>r of <strong>in</strong>ul<strong>in</strong>; D - <strong>in</strong>ul<strong>in</strong>heated <strong>in</strong> water at 100 °C.Similar results were obta<strong>in</strong>ed after analysis of the structure of gels of the experimentalsamples with microscope. In comparison with agar-agar gel, the mixed gels were muchmore <strong>de</strong>formable with some <strong>in</strong>ul<strong>in</strong> crystals <strong>in</strong>clu<strong>de</strong>d <strong>in</strong> agar-agar gel (Fig. 2).74Fig. 2. Experimental gel sample with agar 2.5 g and <strong>in</strong>ul<strong>in</strong> 23.5 g (16 × 10).
Proceed<strong>in</strong>g of the 4 rd International Symposium“NEW RESEARCH IN BIOTECHNOLOGY” USAMV Bucharest, Romania, 2011Decreas<strong>in</strong>g the amount of agar-agar <strong>in</strong> experimental gels, much more <strong>in</strong>ul<strong>in</strong> crystals couldbe observed <strong>in</strong> microscope and the gel became softer and it obta<strong>in</strong>ed smoother texture.Gel formation is the key step to produce qualitative jellies. Our results show that the use of<strong>in</strong>ul<strong>in</strong> <strong>de</strong>creas<strong>in</strong>g amount of agar-agar <strong>in</strong> jellies the strength of the gels became weaker andformed <strong>in</strong>sufficiently stable gel. The <strong>de</strong>crease <strong>in</strong> hardness of the gels can be expla<strong>in</strong>ed bythe different properties of <strong>in</strong>ul<strong>in</strong> and agar-agar. Selected technological process for prepar<strong>in</strong>gjellies was not favourable for mechanism and factors of <strong>in</strong>ul<strong>in</strong> gel formation.4. CONCLUSIONSFrom the data presented above we can conclu<strong>de</strong> that <strong>in</strong> experimental mixed gel samples,with ad<strong>de</strong>d <strong>in</strong>ul<strong>in</strong> concentration <strong>in</strong>fluences the strength of the gels. Similar results areobta<strong>in</strong>ed analys<strong>in</strong>g the microstructure of gels of the experimental samples. <strong>New</strong>technological process has to be <strong>de</strong>veloped to <strong>de</strong>sign new types of agar-agar/<strong>in</strong>ul<strong>in</strong> enrichedjellies with acceptable quality.ACKNOWLEDGEMENTS. State Research Programme “Susta<strong>in</strong>able use of localresources (earth, food, and transport) – new products and technologies (NatRes)” (2010-2013) Project no. 3. „Susta<strong>in</strong>able use of local agricultural resources for <strong>de</strong>velopment ofhigh nutritive value food products (Food)”.ESF project “Support for the implementation of LLU doctoral studies” contractNo 2009/0180/1DP/1.1.2.1.2/09/IPIA/VIAA/017.REFERENCESArmisen, R., Galatas, F. (2000): Agar. In: Handbook of Hydrocolloids. G. O. Phillips and P. A.Williams (eds). Cambridge, U.K: Woodhead Publish<strong>in</strong>g co.: 21.Barrangou, L. M., Daubert, C R., Foeged<strong>in</strong>g, E. A. (2006): Textural properties of agarose gels. I.Rheological and fracture properties. Food Hydrocolloids. 20: 184-195.Bayarri, S., Duran, L., Costell, E. (2004): Influence of sweeteners on the viscoelasticity ofhydrocolloids gelled systems. Food Hydrocolloids. 18: 611-619.Chiavaro, E., Vittad<strong>in</strong>i, E., Corrad<strong>in</strong>i, C. (2007): Physicochemical characterization and stability of<strong>in</strong>ul<strong>in</strong> gels. Eur Food Res Tecchnol, 225: 85 – 94.El-Nagar, G., Clowes, G., Tudoric, C. M., Kuri, V., Brennan, C. S. (2002): Rheological quality andstability of yog-ice cream with ad<strong>de</strong>d <strong>in</strong>ul<strong>in</strong>. Int. J. Dairy Technol. 55, 2: 89-93.Figuerola, F. E. (2007): Berry jams and jellies. In: Berry Fruit. Y. Zhao (ed). <strong>New</strong> York: CRC Press,367-386.Frack, A. (2002): Technological functionality of <strong>in</strong>ul<strong>in</strong> and oligofructose. Brit. J. Nutr. 87: 287-291.Glibowski, P. (2009): Rheological properties and structure of <strong>in</strong>ul<strong>in</strong>-whey prote<strong>in</strong> gels. Int. Dairy J.19: 443-449.Glibowski, P., Bukowska, A. (2011): The effect of pH, temperature and heat<strong>in</strong>g time on <strong>in</strong>ul<strong>in</strong>chemical stability. Acta Sci. Pol., Technol. Aliment. 10(2): 189-196.Glibowski, P., Pikus, S. (2011): Amorphous and crystal <strong>in</strong>ul<strong>in</strong> behavior <strong>in</strong> a water environment.Carbohydrate Polymers. Vol. 83: 635-639.Glibowski, P., Wasko, A. (2008): Effect of thermochemical treatment on the structure of <strong>in</strong>ul<strong>in</strong> andits gell<strong>in</strong>g properties. Int. J. Food. Sci. Tech. 43: 2075-2082.75
Proceed<strong>in</strong>g of the 4 rd International Symposium“NEW RESEARCH IN BIOTECHNOLOGY” USAMV Bucharest, Romania, 2011Guven, M., Yasar, K., Karaca, O. B., Hayaloglu, A. A. (2005): The effect of <strong>in</strong>ul<strong>in</strong> as a fat replacer onthe quality of set-type low-fat yogurt manufacture. Int. J. Dairy Technol. 58, 3: 180-184.Kaur, N., Gupta, A. K. (2002): Applications of <strong>in</strong>ul<strong>in</strong> and oligofructose <strong>in</strong> health and nutrition.J. Bioscience. 27: 703-714.Kim, Y., Faqih M. N., Wang S. S. (2001): Factors affect<strong>in</strong>g gel formation of <strong>in</strong>ul<strong>in</strong>. Carbohyd. Polym.46: 135-145.Kronberga, M., Karkl<strong>in</strong>a, D. (2011): Changes of marmela<strong>de</strong> structural properties <strong>de</strong>pend<strong>in</strong>g ondifferent sweet matters. In: Proceed<strong>in</strong>gs of International conference Research for rural<strong>de</strong>velopment. LLU. Jelgava (<strong>in</strong> press).Kronberga, M., Karkl<strong>in</strong>a, D., Murniece, I., Kruma, Z. (2011): Changes of agar-agar gel propertiesafter replac<strong>in</strong>g sucrose by <strong>in</strong>ul<strong>in</strong> syrup. Foodbalt 2011 Conference Proceed<strong>in</strong>gs, Jelgava: 137-142.Matsuhashi, T. (1990): Agar. In: Food Gels. P. Harris (ed). London: Elsevier Applied Science: 1-51.McClements J. D. (2007): Un<strong>de</strong>rstand<strong>in</strong>g and controll<strong>in</strong>g the microstructure of complex foods.Woodhead Publish<strong>in</strong>g Limited: 772.Panouille, M., Larreta-Gar<strong>de</strong>, V. (2009): Gelation behavior of gelat<strong>in</strong>e and alg<strong>in</strong>ate mixtures. FoodHydrocolloids, 23 (4): 1074-1080.Roberfroid, M. (2005): Inul<strong>in</strong> –Type Fructans. Functional Food Ingredients. Boca Raton, Florida:CRC Press: 359.Stanley, N. F. (2006): Agars. In: Food Polysacchari<strong>de</strong>s and Their Applications. A. M. Stephen,G. O. Phillips, P. A. Williams (eds). <strong>New</strong> York: CRC Press: 217–238.Tabata, K. (1999): Functions and applications of agar jelly. Chem. Abstr. 130: 295-652.76
Proceed<strong>in</strong>g of the 4 rd International Symposium“NEW RESEARCH IN BIOTECHNOLOGY” USAMV Bucharest, Romania, 2011Bioterra University BucharestGENETICALLY MODIFIED FOODPOPESCU DANAbstract. The variety of foods consumed by humans has changed greatly over the centuries, alter<strong>in</strong>gthe balance of nutrients <strong>in</strong> the diet. Nutritional changes may have a more profound impact on thehealth of the population. Traditional plant breed<strong>in</strong>g techniques of <strong>in</strong>tra and <strong>in</strong>ter-species cross<strong>in</strong>gand mutation are <strong>de</strong>signed to create genetic variation upon which selection of the most <strong>de</strong>siredgenotype is the expected outcome. All plant breed<strong>in</strong>g procedures can produce unexpected effects.Generally consumers consi<strong>de</strong>r that traditional foods (that have often been eaten for thousands ofyears) are safe. When new foods are <strong>de</strong>veloped by natural methods, some of the exist<strong>in</strong>gcharacteristics of foods can be altered, either <strong>in</strong> a positive or a negative way. The purpose of thisresearch was to establish the op<strong>in</strong>ion of future food eng<strong>in</strong>eers (f<strong>in</strong>al year stu<strong>de</strong>nts) concern<strong>in</strong>g thegenetically modified organisms, so I asked them to complete a questionnaire of seven questions. Theresearch conclusion was that more than 75% of them don’t consi<strong>de</strong>r that the genetically modifiedorganisms use is safe for consumption. However most of them don’t really know what geneticallymodified organisms are so their op<strong>in</strong>ion is not endorsed but is reveal<strong>in</strong>g for the lack of public<strong>in</strong>formation <strong>in</strong> this field.Keywords: genetically modified, food, safety.1. INTRODUCTIONFor more than ten years, genetically modified crops are cultivated worldwi<strong>de</strong> fortheir <strong>in</strong>creased yield, smaller production costs, higher quality, etc. In our country there arelegally cultivated only 5 varieties of genetically modified corn accord<strong>in</strong>g to the RomanianOfficial Varieties of Crop Plants Register, 2011 edition, while the genetically modifiedsoybean production was stopped <strong>in</strong> 2007. Worldwi<strong>de</strong> genetically modified soybean is themost cultivated crop, probably because of the market <strong>de</strong>mand. Soybean products are found<strong>in</strong> a wi<strong>de</strong> range on the Romanian market, whether is raw or as an <strong>in</strong>gredient. Romanianannual loss is almost 1 billion euro because it’s not cultivat<strong>in</strong>g genetically modifiedsoybean, the national production potential be<strong>in</strong>g about two million tons, has <strong>de</strong>clared <strong>in</strong> apress conference, the M<strong>in</strong>ister of Agriculture Valeriu Tabără.”Romanian annual import ofsoybean from Brazil, U.S.A. and another countries is about 500 000 tons, and it is allproduced only through biotechnology. We are currently attempt<strong>in</strong>g to get the approval forgenetically modified soybean cultivat<strong>in</strong>g start<strong>in</strong>g 2012 because the economic loss issignificant. Among all genetically modified crops cultivated worldwi<strong>de</strong>, only four rule themarket: soybean, cotton, corn and rape. Regard<strong>in</strong>g the cultivated surface, soybean is morespread. In 2009 more than three quarters (77%) from the 90 million hectares cultivated withsoybean worldwi<strong>de</strong> were genetically modified, while for cotton, almost half (49%) from the33 million hectares were genetically modified. More than one quarter (26%) from the158million hectares cultivated worldwi<strong>de</strong> with corn were genetically modified and 21% of the31 million hectares of rape cultivated worldwi<strong>de</strong> were genetically modified (James, 2009).This study aims to i<strong>de</strong>ntify the products than conta<strong>in</strong> genetically modified soybean.77
Proceed<strong>in</strong>g of the 4 rd International Symposium“NEW RESEARCH IN BIOTECHNOLOGY” USAMV Bucharest, Romania, 20112. MATERIALS AND METHODSThe material was gathered us<strong>in</strong>g extensive literature and Internet searches and theresearch method was ma<strong>de</strong> through a questionnaire supported by approximately 100persons that answered at a series of seven questions about the genetically modifiedorganisms, from a consumer po<strong>in</strong>t of view. The persons that answered the questions weremostly f<strong>in</strong>al year stu<strong>de</strong>nts <strong>in</strong> food <strong>in</strong>dustry field, study<strong>in</strong>g <strong>in</strong> Bucharest.3. RESULTS AND DISCUSSIONSAcross the world, food is a part of cultural i<strong>de</strong>ntity and societal life, and hasreligious significance to people. Therefore, any technological modification, <strong>in</strong>clud<strong>in</strong>gchanges to the genetic basis of crops or animals used for food, may be met with socialresistance. In many countries, people’s <strong>in</strong>teraction with nature, often correlated withreligious perspectives, causes social and ethical resistance to modifications that <strong>in</strong>terferewith genes. Whereas the objectives of food safety <strong>in</strong> its limited sense are more clearlyrealized and harmonized <strong>in</strong>ternationally, the objectives of nature protection, environmentalsafety and susta<strong>in</strong>able agriculture are much more complex, unclear and variable <strong>in</strong> differentregions of the world.The potential direct health effects of GM foods are generally comparable to theknown risks associated with conventional foods, and <strong>in</strong>clu<strong>de</strong>, for example, the potential forallergenicity and toxicity of components present, and the nutritional quality andmicrobiological safety of the food. It has been argued that random <strong>in</strong>sertion of genes <strong>in</strong>GMOs may cause genetic and phenotypic <strong>in</strong>stabilities (Ho 2002) but, as yet, no clearscientific evi<strong>de</strong>nce for such effects is available. A better un<strong>de</strong>rstand<strong>in</strong>g of the impact ofnatural transposable elements on the eukaryotic genome may shed some light on therandom <strong>in</strong>sertion of sequences. Food allergies or hypersensitivities are adverse reactions tofoods triggered by the immune system. With<strong>in</strong> the different types of reactions <strong>in</strong>volved,non-immunological <strong>in</strong>tolerances to food and reactions <strong>in</strong>volv<strong>in</strong>g components of theimmune system need to be differentiated. The former may <strong>in</strong>voke reactions such as bloat<strong>in</strong>gor other unpleasant reactions, but are thought not to <strong>in</strong>volve the immune system and called‘food <strong>in</strong>tolerances’. The application of mo<strong>de</strong>rn biotechnology to crops has the potential tomake food less safe if the newly ad<strong>de</strong>d prote<strong>in</strong> proves to cause an allergic reaction once <strong>in</strong>the food supply.Investigations of public perception <strong>in</strong> areas of the world with relatively highresistance to GM foods <strong>in</strong>dicate that lack of <strong>in</strong>formation is not the primary reason(Lewenste<strong>in</strong> 2002; Birner and Alcaraz 2004). The public is not for or aga<strong>in</strong>st GMOs per se— people discuss arguments both for and aga<strong>in</strong>st GMOs, and are aware of contradictionswith<strong>in</strong> these arguments. Also, people do not <strong>de</strong>mand zero risk. They are quite aware thattheir lives are full of risks that need to be balanced aga<strong>in</strong>st each other and aga<strong>in</strong>st thepotential benefits. People may also discrim<strong>in</strong>ate <strong>in</strong> their perception of different technologieswhere a general positive perception can be observed for applications with a clear benefit forsociety, e.g. for mo<strong>de</strong>rn medic<strong>in</strong>es. A key f<strong>in</strong>d<strong>in</strong>g is that people do not react so much to78
Proceed<strong>in</strong>g of the 4 rd International Symposium“NEW RESEARCH IN BIOTECHNOLOGY” USAMV Bucharest, Romania, 2011genetic modification as a specific technology, but rather to the context <strong>in</strong> which GMOs are<strong>de</strong>veloped and the purported benefits they are to produce.Know<strong>in</strong>g the genetically modified organism controversy I wanted to f<strong>in</strong>d out thefresh food eng<strong>in</strong>eers (f<strong>in</strong>al year stu<strong>de</strong>nts) op<strong>in</strong>ion regard<strong>in</strong>g this issue, so I <strong>de</strong>veloped aquestionnaire of seven questions and I asked them to complete it. The questionnaireconta<strong>in</strong>ed the next questions: what do you know about the genetically modified organisms?Are you aware of any food conta<strong>in</strong><strong>in</strong>g genetically modified organisms? Would you eatgenetically modified food? What genetically modifies crop is now cultivated <strong>in</strong> ourcountry? What do you th<strong>in</strong>k about the animals that are be<strong>in</strong>g feed on genetically modifiedfod<strong>de</strong>r? Would you buy genetically modified food? Do you th<strong>in</strong>k that genetically modifiedorganisms are safe to use?To this questionnaire answered more than 100 food eng<strong>in</strong>eer<strong>in</strong>g stu<strong>de</strong>nts. At thefirst question mean<strong>in</strong>g: “what do you know about the genetically modified organisms?” thepercentage of the answers were:- 20% don’t know what the genetically modified organisms are;- 17% th<strong>in</strong>k that they are harmful for our health;- 33% have a wrong op<strong>in</strong>ion about it;- 30% had a clue about it and its purpose.The second question “Are you aware of any food conta<strong>in</strong><strong>in</strong>g genetically modifiedorganisms?” proved to be a real challenge, because the ones that answered correctlymentioned soybean, potatoes and corn although there aren’t on the market and the othersth<strong>in</strong>k that there are currently on the market genetically modified: chicken, sausage, fruitsand vegetables. The percentage was this way:- 20% doesn’t know any genetically modified food;- 31% gave a wrong answer <strong>in</strong>dicat<strong>in</strong>g fruits or vegetables;- 49% answered soybean or corn.To the third question “Would you eat genetically modified food?” the percentage was:- 47% gave a positive answer;- 43% gave a negative answer;- 10% couldn’t <strong>de</strong>ci<strong>de</strong>.In our country s<strong>in</strong>ce 2007 the only genetically modified crop that is cultivated is cornMON810. To the question“ What genetically modifies crop is now cultivated <strong>in</strong> ourcountry?”:- 31% gived a wrong answer say<strong>in</strong>g that genetically modified soybean, tomatoes,potatoes, canola and bees are now cultivated <strong>in</strong> our country;- 40% answered correctly;- 17% answered partially correct;- 12% don’t know anyth<strong>in</strong>g about it.Another <strong>de</strong>licate subject is about the animals that are be<strong>in</strong>g feed on geneticallymodified fod<strong>de</strong>r, compound of genetically modified soybean and corn. So when I asked thestu<strong>de</strong>nt what they th<strong>in</strong>k about it 49% th<strong>in</strong>k that it can affect our health or the animal; 30%th<strong>in</strong>k is beneficial and 21% don’t know a th<strong>in</strong>g about it.In my last study of the market I found that there isn’t any genetically modifiedfood on the Romanian market and know<strong>in</strong>g that I asked them also if they would buygenetically modified food, 3% said that they can’t <strong>de</strong>ci<strong>de</strong>; 35% answered “yes”; 45%79
Proceed<strong>in</strong>g of the 4 rd International Symposium“NEW RESEARCH IN BIOTECHNOLOGY” USAMV Bucharest, Romania, 2011answered “no”; 13% said that they have probably bought it without know<strong>in</strong>g and 7 % saidthat they would buy it if it doesn’t have any si<strong>de</strong> effects.Although the safety of genetically modified organisms usage is still a controversysubject because there are conclusive studies on each part, at the question: “Do you th<strong>in</strong>kthat genetically modified organisms are safe to use?” 76% answered “no”; 14% answered“yes” and 10% “don’t know”.804. CONCLUSIONSGM foods currently available on the <strong>in</strong>ternational market have un<strong>de</strong>rgone riskassessments and are not likely to present risks for human health any more than theirconventional counterparts. However the consumers op<strong>in</strong>ion seems to be different, most ofthem consi<strong>de</strong>r that genetically modified food can affect their health.Although there are lots of studies and World Health Organization reports about thegenetically modified organisms the <strong>in</strong>formation seems to be hard to get because as wediscover <strong>in</strong> the questionnaire most of the consumers th<strong>in</strong>k that the fruits, the vegetables andmeat products are genetically modified and th<strong>in</strong>k that they are already eat<strong>in</strong>g this k<strong>in</strong>d offood without be<strong>in</strong>g <strong>in</strong>formed.REFERENCES1. Birner R, Alcaraz G (2004). Policy dialogues on genetically modified crops <strong>in</strong> Europe:<strong>in</strong>sights for African policy dialogues on biotechnology. Background paper: Conference onAfrican Policy Dialogues on <strong>Biotechnology</strong>, The <strong>New</strong> Partnership for Africa’sDevelopment/Food, Agriculture and Natural Resources Policy AnalysisNetwork/International Food Policy Research Institute (NEPAD/FANRPAN/IFPRI), Harare,Zimbabwe, 20–22 September 2004. NEPAD, Johannesburg, South Africa,http://www.ifpri.org/africadialogue/pdf/policydialoguespaper.pdf.2. FAO/WHO (Food and Agriculture Organization of the United Nations/World HealthOrganization) (2000). Safety aspects of genetically modified foods of plant orig<strong>in</strong>. Report ofa FAO/WHO Expert consultation on Food Derived from <strong>Biotechnology</strong>, World HealthOrganization Headquarters, Geneva, Switzerland 29 May-2 June 2000.3. Ho M-W, Ryan A, Cumm<strong>in</strong>s J (2000). Hazards of transgenic plants with the cauliflowermosaic viral promoter. Microbial Ecology <strong>in</strong> Health and Disease, 12, 6–11.4. James C. (2009)Executive summary – Global status of commercialized biotech/GM crops:2009 Ithaca: The International Service for the Acquisition of Agri-biotechApplications(ISAAA)http://www.isaaa.org/resources/publications/briefs/41/executivesummary/<strong>de</strong>fault.asp5. Lewenste<strong>in</strong> BV (2002). Public perception and un<strong>de</strong>rstand<strong>in</strong>g of the genomics revolution.Presented to World Health Organization: <strong>Biotechnology</strong> and genomics <strong>in</strong> healthimprovement <strong>in</strong> <strong>de</strong>velop<strong>in</strong>g countries, Havana, Cuba, 25 March 2002. Cornell GenomicsInitiative, Cornell University, <strong>New</strong> York City.6. Timo Kaphengst, Nadja El Benni, Clive Evans, Robert F<strong>in</strong>ger, Sophie Herbert, StaphenMorse, Nataliya Stupak, (2011). Assessment of the economic performance of GM cropsworldwi<strong>de</strong>, Ecologic Institute, Berl<strong>in</strong>, 29 march, 2011.7. WHO (World Health Organization) 2005.Mo<strong>de</strong>rn food biotechnology, human health and<strong>de</strong>velopment: an evi<strong>de</strong>nce-based study, Food Safety Department, 1 June 2005.
Proceed<strong>in</strong>g of the 4 rd International Symposium“NEW RESEARCH IN BIOTECHNOLOGY” USAMV Bucharest, Romania, 2011***http://www.curierulnational.ro/Economie/20110407/Soia+MG%3A+o+mancam%2C+<strong>in</strong>sa+nu+o+cultivam+si+pier<strong>de</strong>m+1+miliard+<strong>de</strong>+euro+pe+an&hl=soia&tip=toate consultat <strong>in</strong>data <strong>de</strong> 01.07.2011;*** HG 173/2006 priv<strong>in</strong>d trasabilitatea si etichetarea organismelor modificate genetic sitrasabilitatea alimentelor si hranei pentru animale, obt<strong>in</strong>ute d<strong>in</strong> organisme modificate genetic;***http://www.madr.ro/pages/raport/agricultura-romaniei-noiembrie-2010.pdf***http://www.madr.ro/pages/page.php?self=01&sub=0104&art=0405&var=010402consultat <strong>in</strong> data <strong>de</strong> 01.07.201181
Proceed<strong>in</strong>g of the 4 rd International Symposium“NEW RESEARCH IN BIOTECHNOLOGY” USAMV Bucharest, Romania, 2011PHYSICAL-CHEMICAL PROPERTIES OF MONASCUS METABOLITESNicoleta Radu 1,3 , Yiannis Kourkoutas 2 Mariana Fer<strong>de</strong>s 31 U.S.A.M.V. Cluj Napoca, Bioeng<strong>in</strong>eer<strong>in</strong>g and <strong>Biotechnology</strong> Department;Correspond<strong>in</strong>g author: Nicoleta Radu, e-mail: nicolbiotec@yahoo.com, phone number:0730. 728.6942 Department of Molecular Biology & Genetics, Democritus University of Thrace, Alexandroupolis Greece3 Politehnica University of Bucharest, Bioeng<strong>in</strong>eer<strong>in</strong>g and <strong>Biotechnology</strong> DepartmentAbstract. Monascal metabolites are wi<strong>de</strong>ly us<strong>in</strong>g as food colorant <strong>in</strong> Asia, Europe and United States.Bioprocesses, based on solid state or submerged biosynthesis [1-3] are recommen<strong>de</strong>d as natural fooddyes, but the safety product is <strong>in</strong>sufficiently solved, due to content of citr<strong>in</strong><strong>in</strong>. Citr<strong>in</strong><strong>in</strong> is a mycotox<strong>in</strong>especially toxic to liver and kidney tissue and is suspected of be<strong>in</strong>g a renal carc<strong>in</strong>ogen lead<strong>in</strong>g torenal tumors. Used two stra<strong>in</strong>s we obta<strong>in</strong>ed the biopigments which are characterized by UV-VIS, andHPLC, <strong>in</strong> or<strong>de</strong>r to establish the major compounds <strong>in</strong> Monascus metabolite and the mycotox<strong>in</strong>concentration <strong>in</strong> them. The ma<strong>in</strong> conclusion of our study is the follow<strong>in</strong>g: metabolites obta<strong>in</strong><strong>in</strong>g <strong>in</strong>submerged biosynthesis were a content of mycotox<strong>in</strong> less than 3 ppm and is suitable to use as rawmaterial <strong>in</strong> food <strong>in</strong>dustryKeywords: biopigment, food safety, mycotox<strong>in</strong> content1. INTRODUCTIONMonascus extracts composition was not standardized; we know only that theseextracts conta<strong>in</strong> monacol<strong>in</strong>s, meviol<strong>in</strong>s, vitam<strong>in</strong>s, polyphenols, azaphylones, gammaam<strong>in</strong>obutiric acid and ascorbic acid. Certa<strong>in</strong> study performed on metabolites fromMonascus ruber and Monascus purpureus reveal a content of 25 ppm meviol<strong>in</strong>, 17 unitsOD azaphylones (pigments), 15.6% prote<strong>in</strong>s, 7.1% lipids, 1.3% monacol<strong>in</strong> K and 8%humidity [1-2]. Accord<strong>in</strong>g to study published <strong>in</strong> 1996 <strong>in</strong> Technique and prote<strong>in</strong> ChemistryVII [3], metabolites obta<strong>in</strong>ed on solid substrates with Monascus rubidigosus, conta<strong>in</strong>glucoamylase and carbohydrate <strong>in</strong> the follow<strong>in</strong>g quantities: 43.9 mol mannose/ molglucoamilase, 12.2 mol N-acetylglucosam<strong>in</strong>a /mol glucoamilase and 8 mol galactose/molglucoamilase [1].Regard<strong>in</strong>g the monacol<strong>in</strong>s content, this is a function of stra<strong>in</strong> type. From this po<strong>in</strong>tof view, studies performed on 7 types of Monascus stra<strong>in</strong>s revealed a content of Monacol<strong>in</strong>K between 128-7633 mg/kg [2]. But if we analyse the correlation between Monacol<strong>in</strong>s andcitr<strong>in</strong><strong>in</strong> content, we see that only two stra<strong>in</strong>s were qualified for commercial use,respectively those <strong>in</strong> which the citr<strong>in</strong><strong>in</strong> content is zero (figs.1-2). The content of azaphylone<strong>in</strong> Monascus metabolites were quantified by UV-VIS measurements, at 370 or 400 nm(yellow pigments), 420 nm (orange pigments) and 500 nm (red pigments) (fig.3). Studiesperformed by Esp<strong>in</strong>oza [2] on metabolites obta<strong>in</strong><strong>in</strong>g <strong>in</strong> submerged media <strong>in</strong>dicate a contentof 2.5 g/L red pigment and 1.43 g/L orange pigment.82
Proceed<strong>in</strong>g of the 4 rd International Symposium“NEW RESEARCH IN BIOTECHNOLOGY” USAMV Bucharest, Romania, 2011Fig. 1. Content of Monacol<strong>in</strong> K <strong>in</strong> bioproducts <strong>de</strong>rived from 7 Monascus sp. Stra<strong>in</strong>sFig. 2. Content of citr<strong>in</strong><strong>in</strong> <strong>in</strong> bioproducts <strong>de</strong>rived from 7 Monascus sp. Stra<strong>in</strong>sFig. 3. Content of azaphilones <strong>in</strong> bioproducts obta<strong>in</strong>ed from Monascus sp. In submerged culturemedia which conya<strong>in</strong> 5% wheat flour, whitout gluten,at pH =5.6Accord<strong>in</strong>g to studies performed by Yuan, L<strong>in</strong> and Wang [2] content of gammaam<strong>in</strong>obutyric acid (GABBA) is of ten times more great <strong>in</strong> bioproducts obta<strong>in</strong>ed on solid83
Proceed<strong>in</strong>g of the 4 rd International Symposium“NEW RESEARCH IN BIOTECHNOLOGY” USAMV Bucharest, Romania, 2011culture media <strong>in</strong> comparison with bioproducts obta<strong>in</strong>ed with the same stra<strong>in</strong> , but <strong>in</strong>submerged culture (figure 4). The aim of our study is to quantify the content of azaphylone<strong>in</strong> Monascus metabolite obta<strong>in</strong>ed <strong>in</strong> submerged media and the citr<strong>in</strong><strong>in</strong>, <strong>in</strong> or<strong>de</strong>r to <strong>in</strong>dicatethe suitability to use Monascus metabolites as food additiveFig.4. Content of gamma am<strong>in</strong>obutyric acid <strong>in</strong> bioproducts obta<strong>in</strong>ed with Monascus sp. onsoli<strong>de</strong> state or submerged biosynthesis842. MATERIAL AND METHODSIn this study we used 2 stra<strong>in</strong>s of Monascus: Monascus sp.1 and Monascus sp.2 supplied byBioeng<strong>in</strong>eer<strong>in</strong>g and <strong>Biotechnology</strong> Department of University POLIEHNICA of Bucharest.Metabolites from the two stra<strong>in</strong>s were obta<strong>in</strong>ed <strong>in</strong> submerged biosynthesis, with threeculture media which conta<strong>in</strong> starch (Medium 1), ethanol (medium 2) and <strong>de</strong>xtrose (medium3). The content of each culture media used <strong>in</strong> this study is presented <strong>in</strong> Table 1. Theazaphylone content was monitorised dur<strong>in</strong>g all bioprocess (10 days) by measur<strong>in</strong>g theoptical <strong>de</strong>nsity of aqueous extract at 400 nm (for yellow azapylones), 420 nm (for orangeazaphylones) and 500 m respectively (for red azaphylones). All experiments was realised <strong>in</strong>triplicate, on the thermostated Heydolph rotary shaker, <strong>in</strong> Erlenmeyer flasks with totalvolume of 500 ml. Each Erlenmeyer flask was filled with 100 ml culture media. In additionfor all samples resulted from biosynthesis on <strong>de</strong>xtrose media, the citr<strong>in</strong><strong>in</strong> content wasmeasured by higy performance liquid chromaotography (HPLC). The <strong>de</strong>vice used was theAgilent type, with C18 column. The solvent used as carrier was the methanol. Calibrationcurve was recor<strong>de</strong>d with methanolic citr<strong>in</strong><strong>in</strong> solution (the citr<strong>in</strong><strong>in</strong> was supplied by Sigma).3. RESULTS AND DISCUSSIONIn culture media which conta<strong>in</strong> starch, Monascus sp.1 do not producedpigmentation. For the second stra<strong>in</strong> Monascus sp.2, maximum concentration of red
Proceed<strong>in</strong>g of the 4 rd International Symposium“NEW RESEARCH IN BIOTECHNOLOGY” USAMV Bucharest, Romania, 2011azapylones was obta<strong>in</strong>ed after 106 h, (figure 5) with a OD=3.8 units units, whilst maximumconcentration of orange compounds was obta<strong>in</strong>ed after 105 h, when a OD = 4.2 wasobta<strong>in</strong>ed (figure 6.)Table 1. Culture media used o obta<strong>in</strong> Monascus metabolite <strong>in</strong> submerged mediaCulture media with starchCulture media with ethanolStarch, g/L 30 Glutamic acid, g/L 5Peptone, g/L 4 K 2 HPO 4, g/L 5glutamic acid, g/L 1 KH 2 PO 4, g/L 5bidistiled water up to1L MgSO 4 •7H 2 O, g/L 0.5Culture media with <strong>de</strong>xtrose CaCl 2, g/L 0.5Dextrose, g/L 30 FeSO 4 •7H 2 O), g/L 0.5NaNO 3, g/L 0.1 ZnSO 4 •7H 2 O, g/L 0.01MgSO 4, g/L 0.05 MnSO 4 •H 2 O, g/L 0.03FeSO 4 , g/L 0.01 Ethanol, g/L 20ZnSO 4 , g/L 0.08 bidistiled water up to1LMnSO 4 , g/L 0.03bidistiled waterup to1LMaximum concentration for yellow azaphylones was atta<strong>in</strong> <strong>in</strong> 114 h with a OD =2.85 (figure 8.)In media with etanol the behaviour of Monascus sp 1 is the same like <strong>in</strong> the caseof starch media (without pigment production). In the case of stra<strong>in</strong> Monascus sp.2 ,azaphylone appear, but <strong>in</strong> the concentration less than that obta<strong>in</strong>ed <strong>in</strong> starch culture media.So, <strong>in</strong> this case the productions of azaphylones red and yelow atta<strong>in</strong> the maximumconcentration after 145h, correspond<strong>in</strong>g to an OD=1(figure 8 and figure 10), whereas thecontent of orange azaphylone atta<strong>in</strong> a maximum concentration after 135 h with an OD =0.27 (figure 9.In submerged media which conta<strong>in</strong> <strong>de</strong>xtrose, the both stra<strong>in</strong>s produce azaphylones,but content of their is less than azaphylone concentration obta<strong>in</strong>ed <strong>in</strong> starch or etanolculture media. The Monascus sp. 1 stra<strong>in</strong> give a maximum concentration of red azaphilonesafter 160 h, when obta<strong>in</strong> an OD =0.75 (figure 11). After 164 h, a maximum concentrationof orange pigment is obta<strong>in</strong>ed (figure 12) with an OD =1. Two hour later (at 166 h) amaximum concentration of yellow pigment was obta<strong>in</strong>ed; with an OD =1 (figure 13),Monascus sp. 2 give a maximum concentration of red azaphylones after 153 h,with an OD =0.75 (figure 14). After 166 h of biosynthesis, a maximum concentration oforange pigment was obta<strong>in</strong>ed (figure 15) with an OD=1. After that, at 177h a maximumconcentration of yellow pigment was obta<strong>in</strong>ed, with an OD =1.2 (figure 16)Fungal mycotox<strong>in</strong> formation <strong>in</strong> submerged media. Fungi from Monascus genusproduce one mycotox<strong>in</strong>: citr<strong>in</strong><strong>in</strong>. Content of this toxic compound <strong>in</strong> food, raw materials forfood <strong>in</strong>dustry or fod<strong>de</strong>r <strong>de</strong>pend of Monascus stra<strong>in</strong>s and culture media.85
Proceed<strong>in</strong>g of the 4 rd International Symposium“NEW RESEARCH IN BIOTECHNOLOGY” USAMV Bucharest, Romania, 2011OD 500 nm43.532.521.5STARCH CULTURE MEDIAEqn 8003 Gaussian(a,b,c,d)r^2=0.99965971 DF Adj r^2=0.99863886 FitStdErr=0.047929151 Fstat=979.23525a=0.24463903 b=3.6453725c=106.23732 d=13.15324343.532.521.5OD 500 nmFigure 5.Red azaphylone production dur<strong>in</strong>gthe biosynthesis <strong>in</strong> submergedmedia with starch and Monascussp.2. Measurement performed at500 nm110.50.500-0.525 75 125 175Time, h-0.5OD 420 nm54321STARCH CULTURE MEDIAEqn 8003 Gaussian(a,b,c,d)r^2=0.9984746 DF Adj r^2=0.9938984 FitStdErr=0.10779572 Fstat=218.18868a=0.28948027 b=3.9181855c=106.54646 d=12.96766554321OD 420 nmFigure 6.Orange azaphylone productiondur<strong>in</strong>g the biosynthesis <strong>in</strong>submerged media with starch andMonascus sp.2. Measurementperformed at 420 nm00-1-1-2-20 50 100 150 200 250Time, hOD 400 nm32.521.5STARCH CULTURE MEDIAEqn 8003 Gaussian(a,b,c,d)r^2=0.99854818 DF Adj r^2=0.99419272 FitStdErr=0.077254401 Fstat=229.26373a=0.30831065 b=2.6114121c=114.55539 d=12.66890332.521.5OD 400 nmFigure 7.Yellow azaphylone productiondur<strong>in</strong>g the biosynthesis <strong>in</strong>submerged media with starch andMonascus sp.2. Measurementperformed at 400 nm110.50.50070 90 110 130 150 170Time, h86
Proceed<strong>in</strong>g of the 4 rd International Symposium“NEW RESEARCH IN BIOTECHNOLOGY” USAMV Bucharest, Romania, 2011OD 500 nm10.90.80.70.60.50.40.30.20.1ETHANOL CULTURE MEDIAEqn 8003 Gaussian(a,b,c,d)r^2=0.99997769 DF Adj r^2=0.99991075 FitStdErr=0.003718455 Fstat=14938.508a=0.042198749 b=0.95165273c=145.03762 d=13.37123910.90.80.70.60.50.40.30.20.1OD 500 nmFigure 8Red azaphylone production dur<strong>in</strong>gthe biosynthesis <strong>in</strong> submergedmedia with ethanol and Monascussp.2. Measurement performed at500 nm0070 90 110 130 150 170Time, hOD 420 nm0.30.250.20.150.1ETHANOL CULTURE MEDIAEqn 8003 Gaussian(a,b,c,d)r^2=0.99788412 DF Adj r^2=0.99153649 FitStdErr=0.008861205 Fstat=157.20573a=0.032869571 b=0.24338737c=136.49229 d=18.4755310.30.250.20.150.1OD 420 nmFigure 9Orange azaphylone productiondur<strong>in</strong>g the biosynthesis <strong>in</strong>submerged media with ethanol andMonascus sp.2. Measurementperformed at 420 nm0.050.050070 90 110 130 150 170Time, hDO 400 nm10.90.80.70.60.50.4ETANOL MUTANT STRAINEqn 8003 Gaussian(a,b,c,d)r^2=0.99997769 DF Adj r^2=0.99991075 FitStdErr=0.003718455 Fstat=14938.508a=0.042198749 b=0.95165273c=145.03762 d=13.37123910.90.80.70.60.50.4DO 400 nmFigure 10Yellow azaphylone productiondur<strong>in</strong>g the biosynthesis <strong>in</strong>submerged media with ethanol andMonascus sp.2. Measurementperformed at400 nm0.30.30.20.20.10.10070 90 110 130 150 170Time, h87
Proceed<strong>in</strong>g of the 4 rd International Symposium“NEW RESEARCH IN BIOTECHNOLOGY” USAMV Bucharest, Romania, 2011If Monascus purpureus was <strong>de</strong>veloped on gra<strong>in</strong> milk, the content of citr<strong>in</strong><strong>in</strong> <strong>in</strong>culture media which result after fermentation is 386 mg/L [4-5]. If the same stra<strong>in</strong> wasgrowth on potato-glucose medium, the citr<strong>in</strong><strong>in</strong> content at the end of fermentation is lessthan 1.1 ppm.If we reffer<strong>in</strong>g to raw materials used <strong>in</strong> food <strong>in</strong>dustry, maximum concentration ofcitr<strong>in</strong><strong>in</strong> f<strong>in</strong>d <strong>in</strong> cereals was 224.6 ng/g.In some products used <strong>in</strong> animal fod<strong>de</strong>r, sometimes citr<strong>in</strong><strong>in</strong> concentration is bigger that 405ppb [5].In the case of Monascus sp.1 which <strong>de</strong>velop <strong>in</strong> culture media with <strong>de</strong>xtrose, thestudy regard<strong>in</strong>g the content of citr<strong>in</strong><strong>in</strong> <strong>in</strong> liquid culture media <strong>in</strong>dicate a maximumconcentration at 96 h of biosynthesis, when the content of citr<strong>in</strong><strong>in</strong> from the system atta<strong>in</strong>7.72 ppm. After 120 h of biosynthesis, the content of citr<strong>in</strong><strong>in</strong> from the system <strong>de</strong>creased to3.5 ppm (figure 17) and cont<strong>in</strong>ue to <strong>de</strong>crease until 2,68 ppm at 240 h of biosynthesis.This fact is positive because the maximum concentration of red azaphilones wasatta<strong>in</strong>ed after 200h, when <strong>in</strong> the system the citr<strong>in</strong><strong>in</strong> concentration is less than 2.7 ppm. Inthis case results obta<strong>in</strong>ed are comparable with citr<strong>in</strong><strong>in</strong> content from juice or w<strong>in</strong>e.In the case of stra<strong>in</strong> Monascus sp. 2, the analysis <strong>in</strong>dicate a maximumconcentration of citr<strong>in</strong><strong>in</strong> of 24.48 ppm, at 120h of biosynthesis. After 168h the content ofcitr<strong>in</strong><strong>in</strong> from the system <strong>de</strong>creased at 3.39 ppm figure 18). After 10 day of fermentation, thecontent of citr<strong>in</strong><strong>in</strong> from the system <strong>de</strong>creased to 2.2 ppm.If we compare the time at which we obta<strong>in</strong> the maximumum content of azaphylonewith time <strong>in</strong> which we obta<strong>in</strong> the m<strong>in</strong>imum content of mycotox<strong>in</strong>, we obta<strong>in</strong> an optimaltime of biosynthesis situated <strong>in</strong> the range of 200-220h.4. CONCLUSIONGood results are obta<strong>in</strong>ed <strong>in</strong> the case of biosynthesis of azaphilone on <strong>de</strong>xtrose culturemedia us<strong>in</strong>g Monascus sp.1 or Monascus sp.2 as stra<strong>in</strong>s. In the last case, the maximumconcentration of red azaphilones are obta<strong>in</strong>ed after 170 h of biosynthesis, (OD =1 for redazaphilones) when the content of citr<strong>in</strong><strong>in</strong> is situated un<strong>de</strong>r 3 ppm. These results recommendthe stra<strong>in</strong>s Monascus sp.1 and Monascus sp.2 to obta<strong>in</strong> food additives (pigments) <strong>in</strong>submerged culture media with <strong>de</strong>xtrose.ACKNOWLEDGEMENTS. The work was f<strong>in</strong>ancially supported by the projectPOSDRU/89/1.5/S/52432 from 1.04.2010 - Institutional organization of a postdoctoralschool of national <strong>in</strong>terest "Applied biotechnology with impact <strong>in</strong> the Romanian economy";the project was cofun<strong>de</strong>d by the EU Social Fund <strong>in</strong> the framework of the SectorialOperational Programme 2007-2013 for Human Resources Development88
Proceed<strong>in</strong>g of the 4 rd International Symposium“NEW RESEARCH IN BIOTECHNOLOGY” USAMV Bucharest, Romania, 2011OD, 500 nm0.90.80.70.60.50.40.30.20.10DEXTROSE CULTURE MEDIA PARENTAL STRAINEqn 8003 Gaussian(a,b,c,d)r^2=0.99963627 DF Adj r^2=0.99854509 FitStdErr=0.011110123 Fstat=916.1049a=0.076055966 b=0.66024568c=160.15307 d=23.3969040.90.80.70.60.50.40.30.20.10OD, 500 nmFigure 11. Red azaphyloneproduction dur<strong>in</strong>g the biosynthesis <strong>in</strong>submerged media with <strong>de</strong>xtrose andMonascus sp.1. Measurementperformed at 500 nm-0.125 75 125 175Time, h-0.1Figure 12. Orange azaphyloneproduction dur<strong>in</strong>g the biosynthesis <strong>in</strong>submerged media with <strong>de</strong>xtrose andMonascus sp.1. Measurementperformed at 420 nmOD, 400 nm1.510.5DEXTROSE CULTURE MEDIA PARENTAL STRAINEqn 8003 Gaussian(a,b,c,d)r^2=0.99989547 DF Adj r^2=0.99958187 FitStdErr=0.0081132936 Fstat=3188.4961a=0.086541641 b=0.94895152c=165.72041 d=36.0218811.510.5OD, 400 nmFigure 13. Yellow azaphyloneproduction dur<strong>in</strong>g the biosynthesis <strong>in</strong>submerged media with <strong>de</strong>xtrose andMonascus sp.1. Measurementperformed at 400 nm00-0.525 75 125 175Time, h-0.589
Proceed<strong>in</strong>g of the 4 rd International Symposium“NEW RESEARCH IN BIOTECHNOLOGY” USAMV Bucharest, Romania, 2011OD 500 nm1.510.5DEXTROSE CULTURE MEDIA MODIFIED STRAINEqn 8003 Gaussian(a,b,c,d)r^2=0.99869513 DF Adj r^2=0.99478052 FitStdErr=0.018920331 Fstat=255.12006a=0.044744129 b=0.75989211c=192.76906 d=45.7374431.510.5OD 500 nmFigure 14. Red azaphyloneproduction dur<strong>in</strong>g thebiosynthesis <strong>in</strong> submerged mediawith <strong>de</strong>xtrose and Monascussp.2. Measurement performed at500 nm00-0.5-0.50 50 100 150 200 250Time, hOD 420 nm1.510.5DEXTROSE CULTURE MEDIA MODIFIED STRAINEqn 8003 Gaussian(a,b,c,d)r^2=0.99891834 DF Adj r^2=0.99567338 FitStdErr=0.025487003 Fstat=307.83626a=0.078192263 b=0.90413132c=166.51642 d=32.9894711.510.5OD 420 nmFigure 15. Orange azaphyloneproduction dur<strong>in</strong>g thebiosynthesis <strong>in</strong> submerged mediawith <strong>de</strong>xtrose and Monascussp.2. Measurement performed at420 nm00-0.525 75 125 175Time, h-0.5OD 400 nm21.510.5DEXTROSE CULTURE MEDIA MODIFIED STRAINEqn 8003 Gaussian(a,b,c,d)r^2=0.99966372 DF Adj r^2=0.99865486 FitStdErr=0.019332854 Fstat=990.89053a=0.065608312 b=1.3232823c=177.17553 d=39.17736121.510.5OD 400 nmFigure 16. Yellow azaphyloneproduction dur<strong>in</strong>g thebiosynthesis <strong>in</strong> submerged mediawith <strong>de</strong>xtrose and Monascussp.2. Measurement performed at400 nm00-0.525 75 125 175Time, h-0.590
Proceed<strong>in</strong>g of the 4 rd International Symposium“NEW RESEARCH IN BIOTECHNOLOGY” USAMV Bucharest, Romania, 2011Figura 17 Citr<strong>in</strong><strong>in</strong> production dur<strong>in</strong>g thebiosynthesis <strong>in</strong> submerged media with <strong>de</strong>xtroseand Monascus sp.1Figura 18 Citr<strong>in</strong><strong>in</strong> production dur<strong>in</strong>g thebiosynthesis <strong>in</strong> submerged media with <strong>de</strong>xtroseand Monascus sp.2REFERENCES1. Esp<strong>in</strong>osa, D. R., Webb, C., (2003), Submerged fermetation <strong>in</strong> wheat substrate for productionof Monascus pigments, Worl Journal of Microbiol. Biotechnol., 19, 329.2. Yuan, C.S., L<strong>in</strong>, T.T.,Wang, J.J. Production of the secondary metabolites γamm<strong>in</strong>obutyricacid and monacol<strong>in</strong> K by Monascus, (2003), J.Ind. Microbiol. Biotechnol., 30(1), 41-46..3. Satyanaraya, T., Maheswar, J.L.U.R, (1996), α Amilases, Prote<strong>in</strong> Chemistry vol XII ed.Crabb, J.4. Wang, Y.Z., Xiu. L. J., Yu. G.Z., (2005), The variability of citr<strong>in</strong><strong>in</strong> production <strong>in</strong> Monascus typecultures Food Microbiology, (22), 145-148,.5. Blanc, P. J., Loret, M. O., Goma, G., (1995).Production of citr<strong>in</strong><strong>in</strong> by various species ofMonascus. Biotech. Lett., 17 : (3), 291-294,91
Proceed<strong>in</strong>g of the 4 rd International Symposium“NEW RESEARCH IN BIOTECHNOLOGY” USAMV Bucharest, Romania, 2011THE EFFECT OF PREPARATES BASED ON SODIUM CARBONATEAND CITRIC ACID ON THE PARAMETER FALLING NUMBERIN HYPERDIASTAZIC FLOURSTAMBA-BEREHOIU R.*, POPESCU S.*, POPA C. N.*** U.S.A.M.V.B., Faculty of Biotehnologies, 59 Marasti Str., sector 1, Bucharest, radianatamba@yahoo.com,sazzpop@yahoo.com** FARINSAN S.A. Gradistea, Comana, Giurgiu district, cipnpopa@yahoo.comAbstract. The objective was to assess the <strong>in</strong>fluence of compounds of sodium carbonate and citric acidon the amylase activity of hyperdiastazic flour. Four samples of wheat, with Fall<strong>in</strong>g Number valuesbetween 88 sec and 153 sec, were ground on pilot mill. Flour was treated with vary<strong>in</strong>g amounts ofsodium carbonate/citric acid preparates and comb<strong>in</strong>ations. Results showed that the sodium carbonatepreparate provi<strong>de</strong>s a significant improvement of Fall<strong>in</strong>g Number values at doses above 50 g per 100kg, and citric acid <strong>in</strong>creases Fal<strong>in</strong>g Number values of flour at doses greater than 200 g/100 kg.Comb<strong>in</strong>ations of the two, generally cancel this effect. Consequently, the use of sodium carbonate toimprove Fall<strong>in</strong>g Number parameter values is limited because it is necessary to ma<strong>in</strong>ta<strong>in</strong> acid pH atwhich bakery processes occur.Keywords: wheat flour, sodium carbonate, citric acid, fall<strong>in</strong>g number1. INTRODUCTIONEnvironmental factors such as climatic conditions of the year, the area of culture,doses of nitrogen applied and fungici<strong>de</strong> treatments, <strong>in</strong>fluence the values of the Fall<strong>in</strong>gNumber parameter of wheat, prote<strong>in</strong> quantity and composition. The Fall<strong>in</strong>g Numberparameter, known as Hagberg Fall<strong>in</strong>g <strong>in</strong><strong>de</strong>x, reflects the amylasic activity of wheat andflour. More events were associated with low Fall<strong>in</strong>g Number, namely: late maturat<strong>in</strong>gwheat, which leads to reduced starch content, a lower quality of gluten and excessivera<strong>in</strong>falls that cause the starch <strong>de</strong>tachment of prote<strong>in</strong>s [1].Fungici<strong>de</strong> treatments and Fusarium <strong>in</strong>fections have been <strong>in</strong>crim<strong>in</strong>ated <strong>in</strong> certa<strong>in</strong>studies for an easy <strong>de</strong>crease of the value of this parameter [2]. For some varieties of wheat,the low values of the Fall<strong>in</strong>g Number parameter were correlated with a number of geneticdisor<strong>de</strong>rs, characterized by cont<strong>in</strong>uation of α-amylase synthesis <strong>in</strong> the late maturation stagesof wheat gra<strong>in</strong>s. For most of these varieties, the phenomenon seems to be modulated by thethermal shocks (freez<strong>in</strong>g), to which the wheat plant is exposed <strong>in</strong> late stages of<strong>de</strong>velopment [3, 4].Romanian wheat yields are generally characterized by relatively small values ofamylasic activity, often hav<strong>in</strong>g higher Fall<strong>in</strong>g parameter values, higher than 350 seconds[5]. However, periodically, there are situations when the quality of crops is <strong>in</strong>fluenced byadverse weather conditions, especially dur<strong>in</strong>g harvest. This leads to premature germ<strong>in</strong>ationof seeds and the <strong>in</strong>crease of amylasic activity. A big amylasic activity of wheat is aproblem, as it leads to obta<strong>in</strong><strong>in</strong>g improper flour technological properties. Improv<strong>in</strong>gsolutions are generally based on the change of dough pH, but have a limited effect, due tothe sensitivity of biochemical and rheological processes <strong>in</strong> dough to pH changes. Another92
Proceed<strong>in</strong>g of the 4 rd International Symposium“NEW RESEARCH IN BIOTECHNOLOGY” USAMV Bucharest, Romania, 2011l<strong>in</strong>e of research, which aimed to use amylasic <strong>in</strong>hibitors, has a limited applicability, due totheir <strong>in</strong>terference with the human digestive amylase.2. MATERIAL AND METHODSFour wheat samples taken from the 2010 harvest were analyzed <strong>in</strong> or<strong>de</strong>r to<strong>de</strong>term<strong>in</strong>e the amylasic activity through the Fall<strong>in</strong>g In<strong>de</strong>x (ISO 3093:1997).For each of the four samples we analyzed the Fall<strong>in</strong>g Number on the full meal(milled on the LM 120 laboratory mill taken from Perten Instruments AB) and the flourtype 550 (obta<strong>in</strong>ed by gr<strong>in</strong>d<strong>in</strong>g the samples on a Chop<strong>in</strong> CD1 pilot mill).The obta<strong>in</strong>ed flour samples were treated with successive quantities of Rowelit(preparation based on 80% sodium carbonate, produced by Mühlenchemie), citric acid andcomb<strong>in</strong>ations from them, <strong>in</strong> accordance with the experimental plan <strong>in</strong> Table 1.Table 1. The quantities of Rowelit and citric acid used for treatmentsSample number ROWELIT(g/100 kg)CITRIC ACID(g/100 kg)ROWELIT + CITRIC ACID(g/100 kg)I.II.III.IV.50 100 200 50 100 200The results have been <strong>in</strong>terpreted us<strong>in</strong>g the methods of <strong>de</strong>scriptive statisticalanalysis and t test (Stu<strong>de</strong>nt) for pairs of samples.25+253. RESULTS AND DISCUSSIONThe results obta<strong>in</strong>ed by Fall<strong>in</strong>g Number parameter <strong>de</strong>term<strong>in</strong>ation, of the wheatsamples and the flour produced from them, are presented <strong>in</strong> Table 2.50+50100+10025+100Table 2. Fall<strong>in</strong>g Number values and the estimates of their variability forthe wheat and flour samplesSample numberWheat(s)Wheat flour(s)I. 132 158II. 153 171III. 113 125IV. 88 120Mean 121.5 143.5St. <strong>de</strong>v. 27.671 24.906C.V. (%) 17.356 18.791The studied wheat samples had low values of the Fall<strong>in</strong>g Number parameter, wellbelow the permissible limits of acceptability for their exploitation <strong>in</strong> specific technologicalprocesses of the mill<strong>in</strong>g and bakery <strong>in</strong>dustry (at least 180 s). However, we can see that the100+2593
Proceed<strong>in</strong>g of the 4 rd International Symposium“NEW RESEARCH IN BIOTECHNOLOGY” USAMV Bucharest, Romania, 2011mill<strong>in</strong>g process improves significantly this parameter, the average values for flour be<strong>in</strong>gwith with 22 seconds higher than the average values for wheat (+18.1%, t = 5.003, p =0.015).Table 3 shows the values of the Fall<strong>in</strong>g Number parameter and the estimates oftheir variability <strong>in</strong> the flour samples treated with the preparate based on Rowelit sodiumcarbonate.Table 3. Fall<strong>in</strong>g Number values and their variability estimates for the flour samples treated with citricacid RowelitSampleRowelitCitric acidnumber50g/100kg100g/100 kg200g/100kg50g/100kg100g/100 kg200g/100kgI. 177 181 219 163 158 179II. 190 211 220 166 166 173III. 136 149 183 118 115 141IV. 130 148 182 119 121 139Mean 158.250 172.250 201 141.5 140 158St. <strong>de</strong>v. 29.736 30.037 21.370 26.589 25.729 20.944C.V. (%) 18.791 17.438 10.632 18.791 18.378 13.256The addition of Rowelit <strong>de</strong>term<strong>in</strong>es very significant <strong>in</strong>creases of the values ofFall<strong>in</strong>g Number parameters, from untreated flour. The <strong>in</strong>crease of the parameter value isalmost l<strong>in</strong>ear (Figure 1), be<strong>in</strong>g 10% higher compared with the control when is treated with50 g/100 kg (t = 5.990, p = 0.009), 20% higher compared with the control when is treatedwith 100 g / 100 kg (t = 7.367, p = 0.005) and 40% higher compared with the control whenis treated with 200 g/100 kg (t = 19.438, p = 0.003). The enzymatic <strong>in</strong>hibition mechanism isprobably based on the change of dough pH from the slightly acidic doma<strong>in</strong>, thatcorresponds to the optimum pH of amylasic activity, to the neutral or slightly alkal<strong>in</strong>e pH.The addition of citric acid <strong>in</strong> doses of up to 100 g / 100 kg flour does not <strong>in</strong>ducesignificant changes <strong>in</strong> the value of amylasic activity. In these treatments there have beennoticed a slight <strong>in</strong>crease <strong>in</strong> amylasic activity, showed by the <strong>de</strong>crease of the Fall<strong>in</strong>g Numberparameter, compared to the control (-1.4% and -2.5%). The optimum pH of the amylasicactivity <strong>in</strong> wheat is generally <strong>in</strong> the range 5.2 - 5.6, and a slight <strong>de</strong>crease, caused by theaddition of citric acid may expla<strong>in</strong> these results. However, treatments with bigger quantitiesof citric acid (200 g / 100 kg flour) <strong>de</strong>crease significantly the alpha-amylasic activity offlour (+ 10.1% compared to the control, t = 3.379, p = 0.040).94
Proceed<strong>in</strong>g of the 4 rd International Symposium“NEW RESEARCH IN BIOTECHNOLOGY” USAMV Bucharest, Romania, 2011250200150100Row elitCitric Acid500Control 50 g/100 kg 100 g/100 kg 200 g/100 kgFigure 1. The evolution of the Fall<strong>in</strong>g Number parameter <strong>in</strong> case oftreatments with Rowelit and citric acidS<strong>in</strong>ce <strong>in</strong> bakeries us<strong>in</strong>g a wi<strong>de</strong> range of acidifiers (acetic acid, lactic acid, citricacid etc), the use of sodium carbonate can be a problem, due to its reactivity. Table 4conta<strong>in</strong>s the results obta<strong>in</strong>ed by the treatment of the flour samples with differentcomb<strong>in</strong>ations of the two preparates, namely Rowelit and citric acid.Table 4. Fall<strong>in</strong>g Number values and their variability estimates for the flour samples treated withRowelit and citric acidRowelit + Citric acidSamplenumber25 + 25g/100kg50 + 50g/100 kg100 + 100g/100kg25 +100g/100kg100 + 25g/100kgI. 158 165 166 175 195II. 173 185 189 175 189III. 123 125 121 120 139IV. 116 120 118 121 138Mean 142.500 148.750 148.500 147.750 165.250St. <strong>de</strong>v. 27.404 31.456 34.799 31.468 30.988C.V. (%) 19.231 21.148 23.434 21.298 18.752From Table 4 we notice that the use of equal quantities of the two preparates didnot alter significantly the value of the Fall<strong>in</strong>g Number parameter. Also, the comb<strong>in</strong>ation of25 g/100 kg Rowelit and 100 g/100 kg citric acid does not significantly <strong>in</strong>fluence theamylasic activity of flours. Instead, the comb<strong>in</strong>ation of 100 g/100 kg Rowelit and 25 g/100kg citric acid causes a significant <strong>in</strong>crease of the Fall<strong>in</strong>g Number parameter (+ 15.16%compared to the control, t = 4.207, p = 0.024). This fact suggests that the use of averagedoses of sodium carbonate can be consi<strong>de</strong>red for reduc<strong>in</strong>g the amylasic activity <strong>in</strong> flourswith <strong>de</strong>fects, while the technological processes use relatively small quantities of acidifiers.However, the <strong>de</strong>gree of <strong>in</strong>hibition of amylasic activity is not big enough to allow thecorrection of some flours hav<strong>in</strong>g <strong>in</strong>itially large amylasic activity. In the context of thisresearch, we consi<strong>de</strong>r that the potential of reduc<strong>in</strong>g the amylasic activity by us<strong>in</strong>g sodium95
Proceed<strong>in</strong>g of the 4 rd International Symposium“NEW RESEARCH IN BIOTECHNOLOGY” USAMV Bucharest, Romania, 2011carbonate is limited, for the flour or wheat samples hav<strong>in</strong>g <strong>in</strong>itially Fall<strong>in</strong>g Number greaterthan 140 seconds.4. CONCLUSIONSOur results show that the addition of sodium carbonate significantly <strong>de</strong>creases theamylasic activity of flours, which is valued by the Fall<strong>in</strong>g Number parameter. A similareffect can be achieved by us<strong>in</strong>g big doses of citric acid. Us<strong>in</strong>g comb<strong>in</strong>ations of equalquantities of citric acid - sodium carbonate does not significantly <strong>in</strong>fluence the amylasicactivity of flours; this suggests that <strong>in</strong> the technological processes us<strong>in</strong>g acidifiers, the useof sodium carbonate has a limited applicability. However, the average doses of sodiumcarbonate comb<strong>in</strong>ed with low doses of citric acid can be used for a slight <strong>de</strong>crease ofamylasic activity. The effectiveness of treatment with sodium carbonate <strong>de</strong>pends on the<strong>in</strong>itial value of amylasic activity of flour; that is why we consi<strong>de</strong>r that this method can beused only for wheat flours hav<strong>in</strong>g the value of the Fall<strong>in</strong>g Number parameter bigger than140 seconds.REFERENCES1. Eva Johansson, 2002, Effect of two wheat genotypes and Swedish environment onfall<strong>in</strong>g number. amylase activities. and prote<strong>in</strong> concentration and composition. Euphytica Volume126, Number 1, 143-149.2. Meera Kweon, 2010, Fall<strong>in</strong>g number <strong>in</strong> wheat -How is it calculated andwhat does it meanto producers? Meera Kweon. USDA. ARS. Soft Wheat Quality Lab. Wooster. OH. USA.,http://www.ars.usda.gov/SP2UserFiles/Place/36070500/InfoDianehasuploa<strong>de</strong>d/2010ResearchReviewAnnualReport/MKweon-FN-012810.pdf.3. Mares. Daryl J.. Mrva. Kolumb<strong>in</strong>, 2008, Late-maturity α-amylase: Low fall<strong>in</strong>g number <strong>in</strong>wheat <strong>in</strong> the absence of preharvest sprout<strong>in</strong>g. Journal of Cereal Science., vol. 47 (1):6-174. Wrigley. C., 2006, Late-maturity α-amylase – apparent sprout damage without sprout<strong>in</strong>g.Cereal Foods World 51 (3) 124–125.5. Popa. N.C.. Tamba-Berehoiu R., Popescu S.,2008, Ma<strong>in</strong> quality parameters’ evolution ofthe wheat cultivated <strong>in</strong> Romania dur<strong>in</strong>g the last years. Roumanian Biotechnological Letters Vol. 13.No. 1. pp. 3557-3566.96
Proceed<strong>in</strong>g of the 4 rd International Symposium“NEW RESEARCH IN BIOTECHNOLOGY” USAMV Bucharest, Romania, 2011INFLUENCE OF THE CULTURE MEDIUM ON TORULARHODINPIGMENT BIOSYNTHESISCAMELIA UNGUREANU 1,2 *, MARIANA FERDES 21 University of Agricultural Sciences and Veter<strong>in</strong>ary Medic<strong>in</strong>e Cluj-Napoca, Manastur Street 3, 400372, Cluj-Napoca, Romania2 University Politehnica of Bucharest, Polizu Street 1, Sector 1, 011061, Bucharest, Romania,*ungureanucamelia@gmail.com, +40723239120Abstract. The aim of the present work is to study the formation of the <strong>in</strong>tracellular carotenoidpigment - torularhod<strong>in</strong> <strong>de</strong>pend<strong>in</strong>g on culture medium composition and other cultivation factors.Culture media have a consi<strong>de</strong>rable <strong>in</strong>fluence on the yeast biomass accumulation and carotenoidpigments biosynthesis, particularly torularhod<strong>in</strong>, component with a high-level antioxidant potential.The paper presents the <strong>in</strong>fluence of cultivation conditions on the growth and torularhod<strong>in</strong> formationof the yeast Rhodotorula rubra ICCF 209.Keywords: carotenoids, torularhod<strong>in</strong>, Rhodotorula rubra, β-carotene1. INTRODUCTIONAmongst pigments of natural orig<strong>in</strong>, carotenoids seem to play a fundamental role,their presence <strong>in</strong> the human diet be<strong>in</strong>g consi<strong>de</strong>red positively because of their action as provitam<strong>in</strong>[1-3], antioxidant or possible tumors-<strong>in</strong>hibit<strong>in</strong>g agents [4].The major carotenoid pigments obta<strong>in</strong>ed by biotechnological methods aretorularhod<strong>in</strong>, β-carotene and torulene produced <strong>in</strong> various concentrations by Rhodotorulaand astaxanth<strong>in</strong> produced by Phaffia rhodozyma [5-7].Culture media have a consi<strong>de</strong>rable <strong>in</strong>fluence on the yeast biomass accumulationand carotenoid pigments biosynthesis, particularly torularhod<strong>in</strong> component with a highlevelantioxidant potential.The aim of the present work is to study the formation of the <strong>in</strong>tracellularcarotenoid pigment - torularhod<strong>in</strong> with the yeast Rhodotorula rubra ICCF 209 <strong>de</strong>pend<strong>in</strong>gon culture medium composition and different cultivation factors.2. MATERIAL AND METHODSThe experiments were carried out <strong>in</strong> 1000 mL conical flasks, with 200 mL culturemedium, on a rotary shaker (Gerhardt Laboshake) at 250 rpm, dur<strong>in</strong>g 5-6 days ofdiscont<strong>in</strong>uous aerobic bioprocess, at 28 o C <strong>in</strong> most cases, for the carotenoids mixtureformation, ma<strong>in</strong>ly conta<strong>in</strong><strong>in</strong>g the torularhod<strong>in</strong>, <strong>in</strong> the stationary phase of the yeastRhodotorula rubra ICCF 209 growth curve. The medium composition, <strong>de</strong>f<strong>in</strong>ed as MS3,was obta<strong>in</strong>ed by previous research work [8] with the formula: 40 g/L glucose, 1.5 g/L yeastextract, 5 g/L NH 4 NO 3 , 1 g/L KH 2 PO 4 , 0.4 g/L MgSO 4 x7H 2 O and 0.4 g/L NaCl. Traceelements are assumed to be taken from the tap water.A suspension of the yeast cells <strong>in</strong> sterile water was used for the <strong>in</strong>oculumpreparation. Inoculum was analyzed <strong>in</strong> terms of number of cells / mL.97
Proceed<strong>in</strong>g of the 4 rd International Symposium“NEW RESEARCH IN BIOTECHNOLOGY” USAMV Bucharest, Romania, 2011The cells growth was quantified by: Optical Density (O.D.) <strong>de</strong>term<strong>in</strong>ation at Λ =600 nm, evolution of pH and dried biomass concentration. Dry matter concentration<strong>de</strong>term<strong>in</strong>ation was done after biomass separation from the culture medium bycentrifugation. The biomass dry<strong>in</strong>g was achieved <strong>in</strong> the oven at 105 o C until constant mass.After cells’ separation by centrifugation three freeze-thaw cycles were performed.The pigments extraction procedure was done <strong>in</strong> accordance with the <strong>de</strong>dicated literature [9],compris<strong>in</strong>g acetone extraction of the total pigments mixture <strong>in</strong>clud<strong>in</strong>g water solublespecies, followed by n-hexane extraction to separate the total carotenoids content; anotherextraction with alkal<strong>in</strong>e methanol allow<strong>in</strong>g the torularhod<strong>in</strong> (the only pigment with acidstructure) component isolation.The total carotenoids concentration and the torularhod<strong>in</strong> concentration were<strong>de</strong>term<strong>in</strong>ed based on the spectrometric record<strong>in</strong>g of the extracts on the spectrophotometerUV-VIS (Jenway Spectrophotometer).To calculate the torularhod<strong>in</strong> concentration, the specific absorption coefficient E 1%1932 was applied to the difference between the absorbance of the hexane extract before andafter methanol phase extraction, at 515 nm [10].3. RESULTS AND DISCUSSION1. Influence of the <strong>in</strong>itial pHSeveral experiments were realized to <strong>de</strong>term<strong>in</strong>e the <strong>in</strong>fluence of the <strong>in</strong>itial cultivationpH, <strong>in</strong> the range 3 – 8, on the yeast growth and both – total carotenoids and torularhod<strong>in</strong>formation, consi<strong>de</strong>r<strong>in</strong>g the control medium MS3 with <strong>in</strong>itial pH 5.miuedmL/g,µntiotracennoC80070060050040030020010003 4 5 - control 6 7 8pHTotal carotenoids concentration as ß-caroteneTorularhod<strong>in</strong> concentration98Fig. 1 Variation of total carotenoid and torularhod<strong>in</strong> concentration <strong>de</strong>pend<strong>in</strong>g of <strong>in</strong>itial pH valuesThe studied characteristics – yeast growth, pH evolution, the total carotenoids formationand the torularhod<strong>in</strong> formation recommend the <strong>in</strong>itial pH range of 6-7 as be<strong>in</strong>g favorable,the torularhod<strong>in</strong> fraction from the total carotenoids’ content be<strong>in</strong>g more than 90% for the
Proceed<strong>in</strong>g of the 4 rd International Symposium“NEW RESEARCH IN BIOTECHNOLOGY” USAMV Bucharest, Romania, 2011pH of 7. The pH 3 is not favorable for the pigments formation and the pH 8 is limit<strong>in</strong>g theyeast growth.2. Influence of the <strong>in</strong>itial <strong>in</strong>oculum’s concentrationAlso the growth and the carotenoids production, ma<strong>in</strong>ly torularhod<strong>in</strong> with the sameyeast Rhodotorula rubra ICCF 209 were <strong>in</strong>vestigated for different <strong>in</strong>itial <strong>in</strong>oculum’ cellular<strong>de</strong>nsity on the control medium MS3. The growth evolution is done <strong>in</strong> the fig. 3 and thepigments formation results are presented <strong>in</strong> the fig. 2.miuedmL/g, µntiotracennoC100090080070060050040030020010000.5 1 2 5Inoculum's concentration, %Total carotenoids concentration as ß-caroteneTorularhod<strong>in</strong> concentrationFig. 2 Variation of total carotenoid and torularhod<strong>in</strong> concentration <strong>de</strong>pend<strong>in</strong>g of the <strong>in</strong>oculum sizemn06,sityenaldticpO1816141210864200 20 40 60 80 100 120 140 160Time, h0.5 % 1% - control 2% 5%Fig. 3 Optical <strong>de</strong>nsity variation <strong>de</strong>pend<strong>in</strong>g of the <strong>in</strong>oculum sizeAn <strong>in</strong>oculum concentration of 1-2 v/v is favorable for both yeast growth and carotenoidsformation <strong>in</strong>clud<strong>in</strong>g the torularhod<strong>in</strong> accumulation.99
Proceed<strong>in</strong>g of the 4 rd International Symposium“NEW RESEARCH IN BIOTECHNOLOGY” USAMV Bucharest, Romania, 20113. Study of the nitrogen source <strong>in</strong>fluenceIn a first step, growth and carotenoids synthesis, <strong>in</strong>clud<strong>in</strong>g the torularhod<strong>in</strong> formation withthe Rhodotorula rubra yeast were <strong>in</strong>vestigated based on the use of different salts asm<strong>in</strong>eral nitrogen sources such as NH 4 NO 3 , NH 4 H 2 PO 4 , (NH 4 ) 2 SO 4 , NH 4 Cl and NH 4 NO 3 (asthe control salt <strong>in</strong>itially present <strong>in</strong> MS3 medium) with the concentration of 5 g/L for all thevariants. At the same time for the control medium composition variant the organic nitrogensource, the yeast extract, was supplemented with a concentration of 0.1% from thefollow<strong>in</strong>g am<strong>in</strong>o acids: tryptophan, threon<strong>in</strong>e, glutamic acid, cyste<strong>in</strong>e, alan<strong>in</strong>e, tyros<strong>in</strong>e,prol<strong>in</strong>e, leuc<strong>in</strong>e and val<strong>in</strong>e. The experiment lasted for 144 h.The pigments formation results are presented <strong>in</strong> the fig. 4.Table 1. Experimental variants notation function of the use of different nitrogen sourcesExperimentalNitrogen source,variants5 g/L1 NH 4 NO 3 - control2 NH 4 H 2 PO 43 (NH 4 ) 2 SO 44 NH 4 Cl5 NH4NO3 + 0.1% tryptophan6 NH4NO3 + 0.1% threon<strong>in</strong>e7 NH4NO3 + 0.1% glutamic acid8 NH4NO3 + 0.1% cyste<strong>in</strong>e9 NH4NO3 + 0.1% alan<strong>in</strong>e10 NH4NO3 + 0.1% tyros<strong>in</strong>e11 NH4NO3 + 0.1% prol<strong>in</strong>e12 NH4NO3 + 0.1% leuc<strong>in</strong>e13 NH4NO3 + 0.1% val<strong>in</strong>e900m800iued 700m600/L500gµ 400,n 300tio200atr 100cen0noC1 2 3 4 5 6 7 8 9 10 11 12 13Experimental variantsTotal carotenoids concentration as ß-carotene Torularhod<strong>in</strong> concentrationFig. 4 Variation of the torularhod<strong>in</strong> concentration, and the total carotenoids concentration (as β-carotene) <strong>de</strong>pend<strong>in</strong>g of the nitrogen source from the brothCompared to control medium (MS3) all the variants characterized by small additions ofam<strong>in</strong>o acids have better growths. The <strong>in</strong>troduction of alan<strong>in</strong>e and threon<strong>in</strong>e seems to100
Proceed<strong>in</strong>g of the 4 rd International Symposium“NEW RESEARCH IN BIOTECHNOLOGY” USAMV Bucharest, Romania, 2011<strong>in</strong>fluence more the pigments formation than the use of NH 4 H 2 PO 4 <strong>in</strong>stead of the controlm<strong>in</strong>eral nitrogen source.4. Influence of fatty acids additionsIn or<strong>de</strong>r to study the possible <strong>in</strong>fluence of the <strong>in</strong>troduction of small concentrations of fattyacids on growth and pigments formation consi<strong>de</strong>r<strong>in</strong>g the Rhodotorula yeasts capacity toassimilate these acids as valuable carbon sources [11] the control medium formula wassupplemented with 0.1% of fatty acids: l<strong>in</strong>oleic/oleic/stearic/palmitic. Aga<strong>in</strong> the growth andthe total carotenoids concentration compared with the torularhod<strong>in</strong> concentration were<strong>de</strong>term<strong>in</strong>ed. The carotenoids formation, <strong>in</strong>clud<strong>in</strong>g torularhod<strong>in</strong> is presented <strong>in</strong> the Table 2,and the growth curves for the same experimental variants are represented <strong>in</strong> the fig. 5.Table 2. Experimental variants notation function of the use of fatty acidsCLOSPMediumcompositionvariantsFatty acids additionControl (MS3)Glucose + 0.1% l<strong>in</strong>oleic acidGlucose + 0.1% oleic acidGlucose + 0.1% stearic acidGlucose + 0.1% palmitic acidThe growth was better when oleic acid was used and the carotenoids and torularhod<strong>in</strong>concentrations are the highest for this variant.It is to mention that the <strong>in</strong>fluence of the addition of small concentrations of am<strong>in</strong>o acidsalan<strong>in</strong>e or threon<strong>in</strong>e was more important.2018mn0y,6sitenaldticpO16141210864200 20 40 60 80 100 120 140 160Time, hControl L O S PFig. 5 Influence of fatty acids addition on the growth of Rhodotorula rubra ICCF 209 yeast101
Proceed<strong>in</strong>g of the 4 rd International Symposium“NEW RESEARCH IN BIOTECHNOLOGY” USAMV Bucharest, Romania, 20115. Influence of cultivation timeSeveral experiments were realized to <strong>de</strong>term<strong>in</strong>e the <strong>in</strong>fluence of the cultivation time, <strong>in</strong>the range 1 – 6 days, on the yeast growth and both – total carotenoids and torularhod<strong>in</strong>formation were measured. The stationary phase characterized by an important production ofcarotenoid pigments starts after 48 hours <strong>in</strong> all cases.The total carotenoids concentration and the torularhod<strong>in</strong> concentration were <strong>de</strong>term<strong>in</strong>edbased on the spectrometric record<strong>in</strong>g of the extracts on the UV-VIS spectrophotometer(Jenway Spectrophotometer).The total carotenoids concentration was <strong>de</strong>term<strong>in</strong>ed as β-carotene content by us<strong>in</strong>g theextract absorbance values (fig. 6); similar the torularhod<strong>in</strong> concentration was calculatedus<strong>in</strong>g methanol extracts absorbance values (fig. 7) with the specific absorption coefficient,E 1% 1932.102Fig. 6. Absorption spectra of hexane extract for the Rhodotorula rubra ICCF 209 culture <strong>in</strong> MS3Until 48 h the ratio between the torularhod<strong>in</strong> concentration and the total carotenoidsconcentration is small, so the yeast biosynthesizes more the other pigments; then dur<strong>in</strong>g thegrowth stationary phase the concentration of torularhod<strong>in</strong> can represent so far 90% fromtotal carotenoids content. The carotenoids concentration <strong>in</strong>creases until 96-120 h, but afterthis duration the trend is towards the dim<strong>in</strong>ution of any carotenoids content.
Proceed<strong>in</strong>g of the 4 rd International Symposium“NEW RESEARCH IN BIOTECHNOLOGY” USAMV Bucharest, Romania, 2011Fig. 7 Absorption spectra of methanol extracts for the Rhodotorula rubra ICCF 209 culture <strong>in</strong> MS34. CONCLUSIONSCulture media have a consi<strong>de</strong>rable <strong>in</strong>fluence on the yeast biomass accumulation andcarotenoid pigments biosynthesis, particularly torularhod<strong>in</strong>, component with a high-levelantioxidant potential.For all carbon sources tested the Rhodotorula rubra ICCF 209 stra<strong>in</strong> presented a goodgrowth as can be seen from the OD 600 nm values. The yeast stra<strong>in</strong> growth is stimulated byglucose, fructose, sucrose and maltose, but <strong>in</strong>hibited by lactose.The studied characteristics – yeast growth, the total carotenoids formation, and thetorularhod<strong>in</strong> formation recommend the <strong>in</strong>itial pH range of 6-7 as be<strong>in</strong>g favorable, thetorularhod<strong>in</strong> ratio from the total carotenoids content be<strong>in</strong>g greater for the pH of 7.At the same time an <strong>in</strong>oculum concentration of 1-2 % is favorable for both yeast growthand carotenoids formation.When NH 4 NO 3 is replaced <strong>in</strong> the control medium with other m<strong>in</strong>eral nitrogen sources(NH 4 H 2 PO 4 , (NH 4 ) 2 SO 4 , or NH 4 Cl) both the growth and the carotenoids formation arehigher when acid ammonium phosphate was used; <strong>in</strong> this case a fraction of about 95 %torularhod<strong>in</strong> is formed <strong>in</strong> the pigments mixture.103
Proceed<strong>in</strong>g of the 4 rd International Symposium“NEW RESEARCH IN BIOTECHNOLOGY” USAMV Bucharest, Romania, 2011The medium composition variant, where there were both - the replacement of NH 4 NO 3 asanorganic nitrogen source with the same concentration of - NH 4 H 2 PO 4 and thesupplementation with alan<strong>in</strong>e (0.1%), threon<strong>in</strong>e (0.2%), and oleic acid (0.1%) – representsthe optimum composition studied so far for torularhod<strong>in</strong> formation.ACKNOWLEDGMENTS. The work was f<strong>in</strong>ancially supported by the projectPOSDRU/89/1.5/S/52432 from 1.04.2010 - Institutional organization of a postdoctoralschool of national <strong>in</strong>terest "Applied biotechnology with impact <strong>in</strong> the Romanianeconomy"; the project was cofun<strong>de</strong>d by the EU Social Fund <strong>in</strong> the framework of theSectorial Operational Programme 2007-2013 for Human Resources Development.REFERENCESBhosale P., Gadre, R.V. (2001): Production of b-carotene by a mutant of. Rhodotorula glut<strong>in</strong>is,Lett Appl Microbiol, vol. 33, 12-16Libk<strong>in</strong>d, D., Van Broock, M., (2006): Biomass and carotenoid pigment production by Patagoniannative yeasts, World J Microbiol Biotechnol, vol. 22, 687–692Dema<strong>in</strong>, A.L., Phaff, H.J., Kurtzman, C. P. (1998): In The Yeasts. A Taxonomic Study 4edn, 13–19Davoli, P., Milran, V., Weber, R.W.S. (2004): Appl. Biochem. Microbiol., vol. 40, 4: 392Simova, E., Frengova, G., Beshkova, D. (1998: Z. Naturforsch., vol. 58 C, 225-229Razavi, H., Marc, I. (2006): Effect of temperature and pH on the growth k<strong>in</strong>etics and carotenoidproduction by Sporobolomyces ruberrimus H110, us<strong>in</strong>g technical glycerol as carbon source,Iran J of Chem. Eng., vol. 25, 3:59-64Ungureanu, C., Fer<strong>de</strong>s, M., Chirvase, A.A., Mocanu, E. (2011): Method for torularhod<strong>in</strong>separation and analysis <strong>in</strong> the yeast Rhodotorula rubra aerobically cultivated <strong>in</strong> labbioreactor, Chemical Eng<strong>in</strong>eer<strong>in</strong>g Transactions, vol. 24, 943-948Fer<strong>de</strong>ş, M., Ungureanu C., Mihalcea, A., Chirvase A. A., Mocanu, E. (2011): The <strong>in</strong>fluence of thecarbon source on torularhod<strong>in</strong> pigment biosynthesis, Rev. Chim., vol. 62, 3:339-343Peterson, W. J., Bell, T.A., Etchells, J.L., Smart, W.W.G. (1954): J. Bacteriol., vol. 67, 708-713Bhosale, P.B. (2001), PhD <strong>in</strong> Microbiology Thesis, India, 20Frengova, G., Beshkova, D. (2009): Carotenoids from Rhodotorula and Phaffia – yeasts ofbiotechnological importance, Journal of Industrial Microbiology & <strong>Biotechnology</strong>, vol. 36, 2:163-168104
Proceed<strong>in</strong>g of the 4 rd International Symposium“NEW RESEARCH IN BIOTECHNOLOGY” USAMV Bucharest, Romania, 2011THE MATHEMATICAL MODELING IN OPTIMIZATION OFREFRIGERATION PROCESS1, 2, 3Faculty of <strong>Biotechnology</strong>, U.S.A.M.V., BucharestMioara Varga 1 , Mira Turtoi 2 , Mihaela Ghidurus 3Abstract. In recent <strong>de</strong>ca<strong>de</strong>s there is a cont<strong>in</strong>u<strong>in</strong>g concern <strong>in</strong> the food <strong>in</strong>dustry for optimization ofrefrigeration process. Improvement of conservation technologies of perishable food products has asprimary objective the comb<strong>in</strong>ation of capabilities extend<strong>in</strong>g the validity of the product with keepphysical, chemical, nutritional and sensory properties. The mathematical mo<strong>de</strong>l<strong>in</strong>g is a fundamentalsolution to which appeals most often to optimize a random process, <strong>in</strong>clud<strong>in</strong>g the refrigeration.In the first part of this paper we present the ma<strong>in</strong> theoretical elements that characterize theoptimization process us<strong>in</strong>g certa<strong>in</strong> mathematical mo<strong>de</strong>ls. Then, we apply the theoretical conceptspreviously presented to optimize two refrigeration processes.Keywords: mathematical mo<strong>de</strong>l, stochastic optimization, evolutionary method1. INTRODUCTIONIt is known that refrigeration has a key role <strong>in</strong> food safety; at present there areseveral technologies that apply conservation of perishable food products (radiation, dry<strong>in</strong>g,cur<strong>in</strong>g, high-pressure process<strong>in</strong>g and conservation). With these techniques is <strong>in</strong>ten<strong>de</strong>dprimarily to extend the comb<strong>in</strong>ed capacity of validity of the product, while ma<strong>in</strong>ta<strong>in</strong><strong>in</strong>g thephysical, chemical, nutritional and sensory qualities, the objective be<strong>in</strong>g pursued <strong>in</strong> thesame way by both consumers and manufacturers of refrigeration systems.An important consequence of the wi<strong>de</strong>spread use of refrigeration systems is toensure better nutrition worldwi<strong>de</strong> both <strong>in</strong> terms of quantity and quality of perishable food.In terms of quality, it should be emphasized that chill<strong>in</strong>g leads to reduce damage to vitalfood of animal and vegetable nature (which can accommodate different pathogens) andhence the <strong>de</strong>cl<strong>in</strong>e <strong>in</strong> bacterial growth.The above are some arguments that justify the importance accor<strong>de</strong>d to refrigerationprocesses. Permanent concern of researchers for optimiz<strong>in</strong>g food refrigeration processes isso logical, although until now small steps have been taken <strong>in</strong> this direction. Tradition,certa<strong>in</strong> regulations <strong>in</strong> the field, the criteria by which food or processes are structured as anoptimization problem (choice of objective function and non-quantitative <strong>de</strong>f<strong>in</strong>ition ofvariables subject to large errors), contributed to the <strong>de</strong>velopment of <strong>in</strong>terest <strong>in</strong> this directionof the food <strong>in</strong>dustry.In recent years there have been several studies to mo<strong>de</strong>l<strong>in</strong>g food processes thatenable some products that were <strong>in</strong>tangible qualities such as taste, ten<strong>de</strong>rness, color, safetyand other quality factors to be quantifiable and predictable.Data process<strong>in</strong>g techniques have evolved through improved observation,experiments gave errors and time consum<strong>in</strong>g, and mathematical mo<strong>de</strong>l<strong>in</strong>g has become themethod most often used for optimization of refrigeration processes.105
Proceed<strong>in</strong>g of the 4 rd International Symposium“NEW RESEARCH IN BIOTECHNOLOGY” USAMV Bucharest, Romania, 20112. MATERIALS AND METHODSWe will try to apply the mathematical optimization for two refrigeration processes,<strong>in</strong> or<strong>de</strong>r to improve product quality and <strong>in</strong>crease food safety. We used for this, the studies<strong>in</strong>dicated <strong>in</strong> references with [2] and [4].The first problem that we want to optimize apply<strong>in</strong>g mathematical mo<strong>de</strong>l<strong>in</strong>g is "howto completely thaw blocks of meat <strong>in</strong> a given time while m<strong>in</strong>imiz<strong>in</strong>g surface temperature <strong>in</strong>or<strong>de</strong>r to m<strong>in</strong>imize microbial growth, by vary<strong>in</strong>g the air temperature <strong>in</strong> a suitable way ", alsoknow<strong>in</strong>g that when the air temperature is too high, the surface will heat up and <strong>in</strong>crease thenumber of microbes, while if it is too low the centre will not thaw <strong>in</strong> time.The second problem that what we study is "beef carcass chill<strong>in</strong>g optimization." Wewant to mo<strong>de</strong>l a system of temperature, given the constra<strong>in</strong>ts and maximiz<strong>in</strong>g theten<strong>de</strong>rness of the lo<strong>in</strong> muscle and reduc<strong>in</strong>g microbial growth rate.Before present<strong>in</strong>g solutions, we see that we have analyzed a phenomenon occurr<strong>in</strong>g<strong>in</strong> certa<strong>in</strong> variables (air temperature at the surface and the center block of meat) andrestrictions (<strong>in</strong>creas<strong>in</strong>g the number of microbes to be m<strong>in</strong>imal), that have the general data ofa problem optimization. It is necessary to <strong>in</strong>troduce some features of mathematicalmo<strong>de</strong>l<strong>in</strong>g and optimization that we subsequently apply the above mentioned problems. Weused <strong>in</strong> this or<strong>de</strong>r [1], [3] and [7].2.1. The mathematical mo<strong>de</strong>l<strong>in</strong>gThe mathematical mo<strong>de</strong>l<strong>in</strong>g has an important role <strong>in</strong> mo<strong>de</strong>rn scientific research. Inconstruction of a mathematical mo<strong>de</strong>l, those characteristics of the object mo<strong>de</strong>l<strong>in</strong>g arehighlight on one hand and on the other hand for the <strong>in</strong>formative characteristics we consi<strong>de</strong>rthe mathematical formalization. The mathematical mo<strong>de</strong>l is a mathematical relationship<strong>de</strong>scrib<strong>in</strong>g the essential properties of the orig<strong>in</strong>al. So, solv<strong>in</strong>g a real problem can be reducedto solv<strong>in</strong>g a mathematical problem.The general mathematical mo<strong>de</strong>l<strong>in</strong>g steps are formulation of the problem,<strong>de</strong>velop<strong>in</strong>g a mo<strong>de</strong>l, computer experimentation (simulation) and analysis of mo<strong>de</strong>l<strong>in</strong>gresults (satisfactory or unsatisfactory).Depend<strong>in</strong>g on the sizes <strong>in</strong>volved <strong>in</strong> mo<strong>de</strong>ls, they can be <strong>de</strong>term<strong>in</strong>istic (the precisesize value) or stochastic (a part of all sizes take random values, for example occurs <strong>in</strong>temperature, humidity, etc.).The stochastic mo<strong>de</strong>l<strong>in</strong>g is a relatively new branch <strong>in</strong> mathematical programm<strong>in</strong>g, <strong>in</strong>which the results and methods of <strong>de</strong>term<strong>in</strong>istic programm<strong>in</strong>g and the theory of probabilityare used. The stochastic programm<strong>in</strong>g aims to study the problems of <strong>de</strong>term<strong>in</strong><strong>in</strong>g the best<strong>de</strong>cision possible solutions when the crowd is not completely known (<strong>in</strong> the <strong>de</strong>term<strong>in</strong>isticsense) but predictable, due to the presence of random factors specified, and the objectivefunction is a function <strong>de</strong>f<strong>in</strong>ed on the set of random possible solutions [5]. In such problemsit is consi<strong>de</strong>red as random factors <strong>in</strong>volved <strong>in</strong> <strong>de</strong>f<strong>in</strong><strong>in</strong>g possible solutions crowd and theobjective function (status parameters) to form a s<strong>in</strong>gle multi-dimensional random variable,whose distribution law is unknown. An important feature of stochastic methods is that theytend to imitate natural phenomena.106
Proceed<strong>in</strong>g of the 4 rd International Symposium“NEW RESEARCH IN BIOTECHNOLOGY” USAMV Bucharest, Romania, 2011There are two pr<strong>in</strong>ciples <strong>in</strong> address<strong>in</strong>g stochastic programm<strong>in</strong>g:a) the pr<strong>in</strong>ciple of "wait and see" is <strong>in</strong>ten<strong>de</strong>d that the knowledge of probabilistic<strong>in</strong>formation about n-dimensional random vector, and distribution function, or somemoments (mean, variance), stochastic problem is then treated as a <strong>de</strong>term<strong>in</strong>istic problem,characterized by a probability distribution.b) The 'here and now "means choos<strong>in</strong>g a solution from the set of possible solutions thatmeet a certa<strong>in</strong> criterion of optimality, before study<strong>in</strong>g random variables <strong>in</strong>volved <strong>in</strong> theproblem.2.2. General formulation of optimization problemsThe optimization process is divi<strong>de</strong>d <strong>in</strong> three stages:- Problem <strong>de</strong>f<strong>in</strong>ition, <strong>in</strong> which one <strong>de</strong>f<strong>in</strong>e the system (process) to be optimized, thevariables that can be changed, the objective function to calculate the m<strong>in</strong>imum ormaximum, and limitations to be observed;- Construction of a mathematical mo<strong>de</strong>l to be used to calculate the objective function;- Choos<strong>in</strong>g of mathematical methods for f<strong>in</strong>d<strong>in</strong>g the m<strong>in</strong>imum or maximum objectivefunction.2.2.1. Problem <strong>de</strong>f<strong>in</strong>itionThe objective function is what we seek to maximize or m<strong>in</strong>imize. This is usually aneconomic function (e.g.: energy consumption, equipment size, production costs, capitalcosts, total cost, the duration of the recovery of money or the <strong>in</strong>ternal rate of return) or noneconomic(safety and reliability, product quality or <strong>de</strong>pen<strong>de</strong>nce work or often acomb<strong>in</strong>ation of these factors, weighted <strong>in</strong> some way reflect<strong>in</strong>g our priorities). Often, thegoal is to m<strong>in</strong>imize costs, therefore the objective function is called the "cost".The variables can be mo<strong>de</strong>led - <strong>de</strong>sign variables such as number, size and structuretypes of equipment or plants, or operational variables such as freezers and coolersprogramm<strong>in</strong>g, how to rotate refrigeration compressors or number of laps <strong>in</strong> a day. Thevariables can also be classified as cont<strong>in</strong>uous variables (or simple) and structural variables.The former tend to be more easily optimized, while structural variables (those which cannotconveniently be ma<strong>de</strong> <strong>in</strong> figures) are the most difficult to represent mathematically andtherefore most uncomfortable for optimization.The constra<strong>in</strong>s of optimization problems are: physical (laws of conservation ofenergy or materials, laws of thermodynamics), economical (capital available, the rate ofreturn or recovery time), technological (materials and technology available), and others arelegal and sociological.Basically a mathematical optimization problem (l<strong>in</strong>ear or nonl<strong>in</strong>ear programm<strong>in</strong>g) isto <strong>de</strong>term<strong>in</strong>ate maximum or m<strong>in</strong>imum (optimum) of a function that <strong>de</strong>pends on certa<strong>in</strong>variables, that respect the restrictions given.2.2.2. Construction of a mathematical mo<strong>de</strong>lThe optimization process is performed on a mathematical mo<strong>de</strong>l. It must establish aset of equations that expect the objective function (cost) and a set of variable valuestogether with a method of solv<strong>in</strong>g these equations. The equations are generally solved by anumerical procedure.107
108Proceed<strong>in</strong>g of the 4 rd International Symposium“NEW RESEARCH IN BIOTECHNOLOGY” USAMV Bucharest, Romania, 20112.2.3. An evolutionary method for process optimizationFor problems <strong>in</strong>volv<strong>in</strong>g optimization of a process where variables mo<strong>de</strong>l can varyover time (or any other <strong>in</strong><strong>de</strong>pen<strong>de</strong>nt variables such as distance) turn to an evolutionaryprogram [6]. For example, heat or chill food process<strong>in</strong>g, efficiency and result<strong>in</strong>g productquality are <strong>de</strong>pen<strong>de</strong>nt on the time-temperature regime. The method is based on randomtemperature regimes. Each of these regimes (also called members of the population)consists of a vector ( )1,...,nX X X whose components <strong>de</strong>pend on the (constant) equalt ,... t , t t t− = + , ( ) i 1,∀ = n , the temperature values at times are<strong>in</strong>tervals of time 1 n i 1 i<strong>de</strong>term<strong>in</strong>ed by the l<strong>in</strong>ear <strong>in</strong>terpolation or us<strong>in</strong>g Lagrange polynomial.Start<strong>in</strong>g from two random vectors and us<strong>in</strong>g a mathematical formula we obta<strong>in</strong> thefollow<strong>in</strong>g vector-temperature (this step is called a generation reproductive stage). Then, twovectors are taken at random from those <strong>in</strong>dicated. The "less competent" (for therefrigeration process- the highest temperature) of them is elim<strong>in</strong>ated.This process of elim<strong>in</strong>ation provi<strong>de</strong>s vectors temperature range f<strong>in</strong>d<strong>in</strong>g "fit" for theprocess consi<strong>de</strong>red. The algorithm is repeated until it reaches a satisfactory regime exist<strong>in</strong>g<strong>in</strong> the population until they can get improvements for a pre-specified number of cycles.3. RESULTS AND DISCUSSIONS3.1. Optimize <strong>de</strong>frost<strong>in</strong>g meat blocksThe problem of optimization of complete thaw<strong>in</strong>g meat blocks, consi<strong>de</strong>r<strong>in</strong>g thetemperature fluctuation <strong>in</strong> a certa<strong>in</strong> period of time, was solved by apply<strong>in</strong>g the evolutionarymethod above, after hav<strong>in</strong>g first found the follow<strong>in</strong>g:- Us<strong>in</strong>g a conventional technique of numerical analysis, the calculus of f<strong>in</strong>ite differences,we can <strong>de</strong>term<strong>in</strong>e the temperature at different po<strong>in</strong>ts of the food.- If we consi<strong>de</strong>r the temperature variations <strong>in</strong> the block of meat to be thawed are highbecause the edges and corners are heated more quickly and if we consi<strong>de</strong>r the <strong>de</strong>viationsdue to random errors of measurement or record<strong>in</strong>g, we believe that stochastic mo<strong>de</strong>l<strong>in</strong>g isthe most appropriate method to optimize this process.- The meat blocks are represented by a plate 160 mm thick; <strong>in</strong>itial temperature of -20 ° C,heat transfer coefficient is 20 W/m2 K and the time available for thaw<strong>in</strong>g 24 hours.- We assume that the temperature varies, but because of <strong>de</strong>sign restrictions vaporizerchamber cannot exceed 30°C, graphical representation of this temperature is a polygonall<strong>in</strong>e with a slope change every three hours.- The objective function we want to <strong>de</strong>term<strong>in</strong>e is the extent to which the m<strong>in</strong>imum surfacetemperature exceeds 7 ° C and is characterized mathematically by:f( T ) ⎤2∫ ⎡⎣max 0,s7 ⎦,= −WhereT Sis the surface temperature.- The cost of thaw<strong>in</strong>g is given by the penalty function:( )g = max 0, TP− TC
Proceed<strong>in</strong>g of the 4 rd International Symposium“NEW RESEARCH IN BIOTECHNOLOGY” USAMV Bucharest, Romania, 2011WhereT Cis the temperature <strong>in</strong> any po<strong>in</strong>t of the block of meat and TPis the temperature <strong>in</strong>the center. We want to <strong>de</strong>term<strong>in</strong>em<strong>in</strong> f( + cg )c is the coefficient of penalty cost.To ensure that the packag<strong>in</strong>g is completely thawed, choose a high cost factor, forexample. To <strong>de</strong>term<strong>in</strong>e the optimal solution, it is necessary to achieve a number of differentsimulations (between 500 and 1000). Start<strong>in</strong>g from the maximum value of 30 ° C airtemperature drops to 24-23 ° C, then at 20 ° C and f<strong>in</strong>ally at 8 ° C. This process keeps thesurface temperature to no more than about 13 ° C, while the center is thawed <strong>in</strong> 24 hours.The results obta<strong>in</strong>ed with the evolutionary method have the next graphical representation:Fig.1 Optimized thaw<strong>in</strong>g process for meat blocks.3.2. Optimization of beef carcass chill<strong>in</strong>g (microbial constra<strong>in</strong>s)We propose to mo<strong>de</strong>l a system to cool the temperature of a foot <strong>de</strong>ep beef carcasse,such as the potential microbial (E. coli) growth on the surface of the foot should not exceedthree generations and at the same time to obta<strong>in</strong> maximum ten<strong>de</strong>rness of the meat. Heattransfer coefficient is assumed to be 20 W/m2K and <strong>in</strong>itial temperature 40 ° C. The airtemperature ranges from 15 ° C and -10 ° C because of regulations and <strong>de</strong>sign restrictions.The problem was proposed and analyzed by Q. Tuan Pham and S. Lovatt [4]. Themathematical mo<strong>de</strong>l correspond<strong>in</strong>g to E.coli growth rate (Gill, 1993), <strong>in</strong>dicates bothnecessary <strong>in</strong>tervals beef carcass cool<strong>in</strong>g accord<strong>in</strong>g to different values of temperature andmicrobial growth rate (<strong>in</strong> E.coli generations per hour).109
Proceed<strong>in</strong>g of the 4 rd International Symposium“NEW RESEARCH IN BIOTECHNOLOGY” USAMV Bucharest, Romania, 2011If tLis the latent period (<strong>in</strong> hours), and r is the rate of microbial growth, there arethe follow<strong>in</strong>g relationships:Table 1. Intervals beef carcass cool<strong>in</strong>g accord<strong>in</strong>g to different values of temperatureand microbial growth rateTtLrT < 7t = 0r =07 ≤ T < 30o o 0,001T2 − 0,136T+ 2,841t L1030 ≤ T < 40o o 0,001T2 − 0,136T+ 2,841t L1040 ≤ T < 45o o 0,001T2 − 0,136T+ 2,841t L10o45 ≤ T < 47oT > 47oL= r = 0,0513⋅T− 0,17= r = 0,027 ⋅ T + 0,55= r = 2,66tL= ∞ r = 2,66tL= ∞ r = 0The meat ten<strong>de</strong>rness is measured by a z value, rang<strong>in</strong>g from 1 (strong meat) before cool<strong>in</strong>gto 0. Z is the standard objective function, while the penalty function is g. These expressionsare comb<strong>in</strong>ed as the objective function. The optimization is then carried out rout<strong>in</strong>ely us<strong>in</strong>gan evolutionary program.The objective function and penalty function are formed <strong>in</strong> the normal manner. Theair temperature is gradually reduced from 15 ° C to 0.8 ° C, then <strong>in</strong>creased back to 5.3 ° C<strong>in</strong> the last hours. This system provi<strong>de</strong>s a nearly l<strong>in</strong>ear <strong>de</strong>crease <strong>in</strong> average temperature ofthe rear leg and the f<strong>in</strong>al temperature is 14 ° C. The ten<strong>de</strong>rizers <strong>de</strong>gree is normalized from0252-0194 with a significant <strong>de</strong>crease of 23%.4. CONCLUSIONSThrough this work we wanted to present <strong>in</strong> a more accessible form the general aspectsof mathematical mo<strong>de</strong>l<strong>in</strong>g and optimization techniques that are used <strong>in</strong>creas<strong>in</strong>gly often <strong>in</strong>the food <strong>in</strong>dustry. The two applications presented above are examples <strong>in</strong> this sense. In thefirst problem analyzed, we consi<strong>de</strong>r the temperature variations <strong>in</strong> the block of meat to bethawed are high because the edges and corners are heated more quickly and if we consi<strong>de</strong>rthe random errors of measurement due to <strong>de</strong>viations or registration, we believe thatstochastic mo<strong>de</strong>l<strong>in</strong>g would be a more appropriate method to optimize this process. In thesecond problem studied, we wanted to mo<strong>de</strong>l a system of temperature, given theconstra<strong>in</strong>ts and maximiz<strong>in</strong>g the ten<strong>de</strong>rness of the lo<strong>in</strong> muscle and reduc<strong>in</strong>g microbialgrowth rate.For both problems we could apply both methods <strong>in</strong> parallel: the evolutionary methodand the stochastic procedure.110
Proceed<strong>in</strong>g of the 4 rd International Symposium“NEW RESEARCH IN BIOTECHNOLOGY” USAMV Bucharest, Romania, 2011We <strong>in</strong>tend <strong>in</strong> the future to apply the stochastic mo<strong>de</strong>l<strong>in</strong>g for refrigeration processes,<strong>in</strong> or<strong>de</strong>r to compare the results obta<strong>in</strong>ed by this technique with those obta<strong>in</strong>ed byevolutionary method.REFERENCES1. Bausic, F. (2001): Fundamentals of mo<strong>de</strong>l<strong>in</strong>g, Bucharest, Matrix Rom, p. 22-26.2. Gill, C.O. (1993): Assessment of the hygienic efficiencies of processes for cool<strong>in</strong>g meat atslaughter<strong>in</strong>g plants, Agriculture Canada Technical Bullet<strong>in</strong> 1993-10E.3. Gorunescu, F., Prodan, A. (2001): Stochastic mo<strong>de</strong>l<strong>in</strong>g and simulation, Cluj-Napoca, Ed Blue. p.33-37.4. Graafhuis, A.E., Lovatt, S.J. and Dev<strong>in</strong>e, C.E. (1992): A predictive mo<strong>de</strong>l for lamb ten<strong>de</strong>rness.Proc 27th <strong>New</strong> Zealand Meat Ind. Res. Conf. (Hamilton), p.143-147.5. Mihoc, Gh., Nă<strong>de</strong>j<strong>de</strong>, I. (1967): Mathematical Programm<strong>in</strong>g, Stochastic Programm<strong>in</strong>g , ScientificalEd. , Bucharest, p.30-38.6. Pham, Q.T. (1995): Competitive evolution: a natural approach to operator selection. In: Progress <strong>in</strong>Evolutionary Computation, Lecture Notes <strong>in</strong> Artificial Intelligence, Spr<strong>in</strong>ger-Verlag, Hei<strong>de</strong>lberg ,Vol. 956, p.49-60.7. Varga, M., Matei, F. (2009): The application of statistical mo<strong>de</strong>l<strong>in</strong>g tools to predict the growthevolution of foodborn moulds, Romanian Biotechnological Letters, Bucharest, Vol.14, p.4249-4259.111
Proceed<strong>in</strong>g of the 4 rd International Symposium“NEW RESEARCH IN BIOTECHNOLOGY” USAMV Bucharest, Romania, 2011STUDY METHODS TO EXTRACTION OF PHENOLIC COMPOUNDS INTHE PROCESS OF OBTAINING ROSE WINES WITH STABLECHROMATIC CHARACTERISTICSFaculty of <strong>Biotechnology</strong>, University of Agronomical Sciences and Veter<strong>in</strong>ary Medic<strong>in</strong>e, BucharestVISAN LUMINITAAbstract. Lately at European level is dist<strong>in</strong>guished <strong>in</strong> our country and a grow<strong>in</strong>g <strong>de</strong>mand for roséw<strong>in</strong>es, due to freshness, fruit<strong>in</strong>ess and olfactory characteristics of these w<strong>in</strong>es. However, to obta<strong>in</strong>quality rosé w<strong>in</strong>es technologist faces numerous problems, mostly related to extraction of phenoliccompounds, so the chromatic characteristics of w<strong>in</strong>e taste and balance.Several methods have been studied for extraction of polyphenols from grape varieties typically usedto obta<strong>in</strong> dark red w<strong>in</strong>es: Cabernet Sauvignon, Feteasca neagra and P<strong>in</strong>ot noir: extraction ofphenolic compounds by maceration of grape marc short duration (5 h, 10 h), at a temperature of 18°C– V 1; extraction by maceration-fermentation at 20-22 ºC temperature - V 2 ; criomaceration pulp ata temperature of 5 ° C.The results of physico-chemical and organoleptic results that the method of extraction of polyphenolsshows a great importance for color and organoleptic characteristics of w<strong>in</strong>e, each variety of blackgrapes with a potential technology of phenolic compounds, behav<strong>in</strong>g differently <strong>de</strong>pend<strong>in</strong>g on theversion of the extraction used. Of the three grape varieties, Cabernet Sauvignon, followed byFeteasca neagra variety shows a large pool of phenolic compounds compared with P<strong>in</strong>ot noir.Thus, for the first two varieties of the best ways of extract<strong>in</strong>g them is short maceration andcriomaceration; by fermentation-maceration is high concentration of phenolic compounds. The w<strong>in</strong>esare <strong>in</strong>tensely colored and lack<strong>in</strong>g the f<strong>in</strong>esse of rosé w<strong>in</strong>es.For P<strong>in</strong>ot noir, a variety of phenolic potential lower than the other two varieties is the best optionfermentation-maceration, the criomaceration is the method by which to extract the small amount ofphenols.Keywords: rose w<strong>in</strong>es, polyphenol extraction, criomaceration1. INTRODUCTIONIn recent years, our country and especially the rest of Europe there is an <strong>in</strong>creas<strong>in</strong>g<strong>de</strong>mand for rosé w<strong>in</strong>es, especially <strong>in</strong> summer. To obta<strong>in</strong> high quality rose w<strong>in</strong>es us<strong>in</strong>ggrape varieties for red w<strong>in</strong>es and follows a portion of total polyphenols extraction toachieve balanced w<strong>in</strong>e, smooth, light-colored, with personality.Of course, many rosé w<strong>in</strong>es on the market are fakes, that is, w<strong>in</strong>es produced withdifferent methods: by pass<strong>in</strong>g a white w<strong>in</strong>e by marc result from gett<strong>in</strong>g red w<strong>in</strong>es, whitew<strong>in</strong>e mixed with red w<strong>in</strong>e, both different <strong>in</strong> orig<strong>in</strong>.Due to <strong>in</strong>creas<strong>in</strong>g <strong>de</strong>mand, many countries <strong>in</strong> Europe (France, Italy) <strong>de</strong>velops newtechnologies for obta<strong>in</strong><strong>in</strong>g quality rosé w<strong>in</strong>es, varietal specific technologies and specificconditions. In some v<strong>in</strong>eyards <strong>in</strong> Romania rose w<strong>in</strong>es are produced by various methods andtechnologies (direct fermentation of musts ma<strong>de</strong> from grape varieties poorly colored, rosew<strong>in</strong>es obta<strong>in</strong>ed from mixed technology).112
Proceed<strong>in</strong>g of the 4 rd International Symposium“NEW RESEARCH IN BIOTECHNOLOGY” USAMV Bucharest, Romania, 20112. MATERIALS AND METHODSThe establishment of technological schemes for obta<strong>in</strong><strong>in</strong>g quality rosé w<strong>in</strong>es usedblack grape varieties that are commonly used to make red w<strong>in</strong>es: Cabernet Sauvignon,Feteasca neagra and P<strong>in</strong>ot noir. The grapes were v<strong>in</strong>ified by three different technologicalschemes (variants V 1 , V 2 , V 3 ):V 1 : short maceration of grapes (5-10 h) at temperature of 18ºC;V 2 : maceration-fermentation at temperature of 20-22º C;V3: criomaceration, temperature of 5 º C, for P<strong>in</strong>ot noir.Result<strong>in</strong>g w<strong>in</strong>es were analyzed by the follow<strong>in</strong>g parameters: alcoholic strength (vol%alcohol), total acidity (g/l tartaric acid), volatile acidity (mg/l CH 3 COOH), dry extract (g/l),phenolic compounds (mg/100 ml), anthocyan content (mg/l), <strong>in</strong>tensity and sha<strong>de</strong> color.Grapes harvested from the three varieties have slightly different concentrations ofsugars, a higher concentration with P<strong>in</strong>ot Noir, the alcoholic strength of w<strong>in</strong>e is also higherfor this variety. Sugar content was 218 g/l to P<strong>in</strong>ot Noir, 215 g/l to Feteasca neagra and206 g/l for Cabernet Sauvignon.3. RESULTS AND DISCUSSIONSTable 1 – Chemical and physical parameters of rose w<strong>in</strong>es obta<strong>in</strong>ed by two types of extraction ofpolyphenolsChemical and physicalCabernetFeteasca neagra P<strong>in</strong>ot noirparameters of rose w<strong>in</strong>es/SauvignonParametrii fizico-chimici aiv<strong>in</strong>urilorV 1 V 2 V 1 V 2 V 1 V 2alcoholic strength, vol% alcohol 12,5 12,6 12,7 12,7 11,9 12,0residual sugar, g/l 2,5 0,8 2,2 2,2 3,7 2,0total acidity, g/l tartaric acid 5,5 5,4 5,1 5,1 5,9 5,9dry extract, g/l 28 34 28 32 32 38volatile acidity, mg/l CH 3 COOH 0,3 0,5 0,3 0,5 0,4 0,3phenolic compounds, mg/100 ml 38,8 47,49 32,0 38,82 42,5 58,5anthocyan content, mg/l 214,98 242,31 185,3 205,2 225,4 262,1color <strong>in</strong>tensityDO520 nm + DO420 nm0,638 0,659 0,624 0,635 0,720 0,79sha<strong>de</strong> colorDO520 nm /DO420 nm0,65 0,69 0,54 0,64 0,79 0,82scor<strong>in</strong>g w<strong>in</strong>es to taste I III II I II IIIColor extraction process steps to obta<strong>in</strong> rose w<strong>in</strong>es are of special importance, fortak<strong>in</strong>g the time and temperature used <strong>de</strong>pends on the characteristics result<strong>in</strong>g w<strong>in</strong>e. Thus,each black grape variety with a different technological potential of phenolic compounds,behave differently <strong>in</strong> different types of color extraction. W<strong>in</strong>es produced by variant V 2 ,maceration-fermentation at temperature 20-22º C, has an <strong>in</strong>creased content of phenoliccompounds from V 1 . In the case of Cabernet Sauvignon w<strong>in</strong>e, polyphenol concentration ishigher by 37,6 % over the first variant (short extraction at 18° C). In the Feteasca neagraw<strong>in</strong>e polyphenols concentration <strong>in</strong>creased by 22,3 % <strong>in</strong> variant 2 compared to variant 1,113
Proceed<strong>in</strong>g of the 4 rd International Symposium“NEW RESEARCH IN BIOTECHNOLOGY” USAMV Bucharest, Romania, 2011and for P<strong>in</strong>ot noir w<strong>in</strong>e, one can observe an <strong>in</strong>crease of 21,3 %. Of the three grape varieties,Cabernet Sauvignon, followed by Feteasca neagra has a large pool of phenolic compoundscompared to P<strong>in</strong>ot Noir.And <strong>in</strong> anthocyan content extraction by V 2 leads to <strong>in</strong>creased concentrations ofthese compounds color: 16,2 % to Cabernet, 12,7 % to Feteasca neagra and 10,7 % toP<strong>in</strong>ot noir. The content of phenolic compounds reduced the P<strong>in</strong>ot Noir can be observed foranthocyan<strong>in</strong>s.6050mg/100 ml403020100V1 V2 V1 V2 V1 V2FeteascaneagraP<strong>in</strong>ot noirCabernetSauvignonFig.1 Variant <strong>in</strong>fluence over the content <strong>in</strong> polyphenols extraction300250200mg/l150100500V1 V2 V1 V2 V1 V2FeteascaneagraP<strong>in</strong>ot noirCabernetSauvignonFig.2 Variant <strong>in</strong>fluence over the content of anthocyan<strong>in</strong> extraction114
Proceed<strong>in</strong>g of the 4 rd International Symposium“NEW RESEARCH IN BIOTECHNOLOGY” USAMV Bucharest, Romania, 20110,90,80,70,60,50,40,30,20,10V1 V2 V1 V2 V1 V2FeteascaneagraP<strong>in</strong>ot noirCabernetSauvignon<strong>in</strong>tensely coloredsha<strong>de</strong> colorFig. 3 Variant <strong>in</strong>fluence on the <strong>in</strong>tensity and sha<strong>de</strong> color w<strong>in</strong>esIn P<strong>in</strong>ot Noir, phenolic compounds content is lower and thus is more suitable forobta<strong>in</strong><strong>in</strong>g rose w<strong>in</strong>es, the ma<strong>in</strong> problem <strong>in</strong> obta<strong>in</strong><strong>in</strong>g this w<strong>in</strong>e is not to get too rich colorand taste tann<strong>in</strong>s as <strong>in</strong> red w<strong>in</strong>es. In P<strong>in</strong>ot Noir should be used for extraction version V 2 ,result<strong>in</strong>g w<strong>in</strong>es fits best <strong>in</strong> class quality rose w<strong>in</strong>e, balanced, with optimal content ofpolyphenols, fresh and pleasant aroma. The color is p<strong>in</strong>k, medium <strong>in</strong>tensity.Besi<strong>de</strong>s the chemical analysis of w<strong>in</strong>es was ma<strong>de</strong> and tast<strong>in</strong>g organoleptic, theresults led to the conclusion that to obta<strong>in</strong> rose w<strong>in</strong>es of Cabernet Sauvignon may be usedonly version of short maceration of grapes (5 h) at temperature of 18º C and for obta<strong>in</strong><strong>in</strong>gthe Feteasca neagra rose w<strong>in</strong>es can apply the same technology but with a longer durationof extraction (10 h).Table 2. Influence of criomaceration on w<strong>in</strong>e quality P<strong>in</strong>ot NoirChemical and physical parameters of rose w<strong>in</strong>es/Parametrii fizico-chimici ai v<strong>in</strong>urilorV 1 V 3alcoholic strength, vol% alcohol 12,7 12,8residual sugar, g/l 2,2 0,4total acidity, g/l tartaric acid 5,1 5,0volatile acidity, mg/l CH 3 COOH 0,5 0,2phenolic compounds, mg/100 ml 37,05 26,65anthocyan content, mg/l 206,9 163,6color <strong>in</strong>tensityDO520 nm + DO420 nm0,912 0,531sha<strong>de</strong> colorDO520 nm /DO420 nmI III115
Proceed<strong>in</strong>g of the 4 rd International Symposium“NEW RESEARCH IN BIOTECHNOLOGY” USAMV Bucharest, Romania, 2011For P<strong>in</strong>ot Noir has been studied a criomaceration method, extraction ofpolyphenols at low temperature, the extraction method leads to obta<strong>in</strong> fresh w<strong>in</strong>e of greatf<strong>in</strong>esse. Witness is classical maceration at temperature 18 ºC.In P<strong>in</strong>ot Noir, this method has yiel<strong>de</strong>d good results, extraction of phenoliccompounds and anthocyan<strong>in</strong>s were <strong>in</strong>sufficient. Sta<strong>in</strong><strong>in</strong>g <strong>in</strong>tensity of the w<strong>in</strong>es that hadvery small values compared with controls.4. CONCLUSIONS1. The method of extraction of polyphenols from rose w<strong>in</strong>es is a majortechnological step, temperature used <strong>de</strong>pend<strong>in</strong>g on the quality of w<strong>in</strong>es;2. Each black grape variety has a different technological potential of phenoliccompounds and behaves differently from color extraction;3. To obta<strong>in</strong> rose w<strong>in</strong>es of Cabernet Sauvignon may be used only the version ofshort maceration of grapes (5 h) at temperature of 18º C and for obta<strong>in</strong><strong>in</strong>g the Feteascaneagra rose w<strong>in</strong>es can apply the same technology but with a longer duration of extraction(10 h).4. In P<strong>in</strong>ot Noir should be used for extraction version V 2 , result<strong>in</strong>g w<strong>in</strong>es fits best<strong>in</strong> the class of quality rose w<strong>in</strong>es, balanced, with optimal content of polyphenols, fresh andpleasant aroma. The color is p<strong>in</strong>k, with medium <strong>in</strong>tensity;5. In P<strong>in</strong>ot Noir, this method has yiel<strong>de</strong>d good results, extraction of phenoliccompounds and anthocyan<strong>in</strong>s were <strong>in</strong>sufficient. Sta<strong>in</strong><strong>in</strong>g <strong>in</strong>tensity of the w<strong>in</strong>es that hadvery small values compared with controls.REFERENCES1. Andre P., Aubert S., Pellise, C. (1970): Contribution aux etu<strong>de</strong>s sur les v<strong>in</strong>s roses meridionaux. Lacouleur – <strong>in</strong>fluence sur la <strong>de</strong>gustation. Ann.Techn. Agr.19;2. Andre P., Aubert S., Pellise, C. (1970): Contribution aux etu<strong>de</strong>s sur les v<strong>in</strong>s roses meridionaux.Importance du cepage sur la couleur et la constitution en materies polyphenoliques. Ann.Techn.Agr.19;3. Mark A., Kl<strong>in</strong>gshirm M. (2002): The chemistry of w<strong>in</strong>e, University of Alabama;4. Muntean C, Gheorghita M., (1996): Cercetări priv<strong>in</strong>d structura cromatică a v<strong>in</strong>urilor roşii şi rozeobţ<strong>in</strong>ute în zona viticolă nisipoasă d<strong>in</strong> sudul Olteniei. Sesiunea Anuală <strong>de</strong> comunicari Şti<strong>in</strong>ţ. Fac.<strong>de</strong> Hortic, Craiova.116
Proceed<strong>in</strong>g of the 4 rd International Symposium“NEW RESEARCH IN BIOTECHNOLOGY” USAMV Bucharest, Romania, 2011STUDY OF FACTORS EVENT INFLUENCING THE QUALITY OF REDWINESVISAN LUMINITA, DANAILA SILVANA, RADU TOMAFaculty of <strong>Biotechnology</strong>, University of Agronomical Sciences and Veter<strong>in</strong>ary Medic<strong>in</strong>e, BucharestAbstract. The quality w<strong>in</strong>e is a result of the <strong>in</strong>ter<strong>de</strong>pen<strong>de</strong>nce of many factors, a very important role isattributed to the ecosystem of the v<strong>in</strong>eyard and the climatic conditions of the harvest.Mo<strong>de</strong> of recovery of environmental conditions (soil - local climate and microclimate - climatic factorsof year of harvest) is done by every variety of v<strong>in</strong>e <strong>in</strong> the metabolism of specific. It was studied the<strong>in</strong>fluence of environmental conditions on the technological potential and quality of w<strong>in</strong>es fromCabernet Sauvignon and Merlot <strong>in</strong> 3 w<strong>in</strong>e centers: Dragasani, Valea Calugareasca and Urlati,dur<strong>in</strong>g a 3 year <strong>in</strong>terval (2007 – 2009).The results of experiments showed that both v<strong>in</strong>eyard ecosystem and climate of the harvest has amajor <strong>in</strong>fluence on the technological potential of the variety that, the quality of w<strong>in</strong>e results.Significant differences were recor<strong>de</strong>d on color characteristics of grapes and w<strong>in</strong>es of three varietiesanalyzed.In terms of year of harvest, 2007 saw the most favorable climatic conditions, this positive <strong>in</strong>fluenceboth production and quality of w<strong>in</strong>es <strong>in</strong> both viticulture centers analyzed. Merlot varieties fared best<strong>in</strong> the center Valea Calugareasca and w<strong>in</strong>e center Urlati offered the best conditions of grape varietyCabernet Sauvignon.Keywords: ecoclimatic factors, grape varieties, red w<strong>in</strong>e1. INTRODUCTIONGrape variety is always <strong>in</strong> close <strong>in</strong>ter<strong>de</strong>pen<strong>de</strong>nce with ecological and geographicalconditions, with its specific biotope and ecosystem. Also, crop quality and therefore thequality of w<strong>in</strong>e results vary <strong>in</strong> a given ecosystem to the climate of the year. Mo<strong>de</strong> ofrecovery of environmental conditions is achieved by the metabolism of each specificvariety. Studies on the system variety-ecosystem-crop year have great importance forestablish<strong>in</strong>g each type of varieties of a viticultural area date <strong>in</strong> or<strong>de</strong>r to obta<strong>in</strong> the bestproduction, particularly <strong>in</strong> terms of quality. Climate change <strong>in</strong> recent years requires similarstudies for ecosystem restoration <strong>in</strong> the range of varieties Romanian w<strong>in</strong>e.2. MATERIALS AND METHODSTo establish the <strong>in</strong>fluence of the ecosystem v<strong>in</strong>eyard and the harvest year werestudied two varieties of black grapes, Cabernet Sauvignon and Merlot, which are varietiesthat occupy the largest area <strong>in</strong> Romanian v<strong>in</strong>eyards, to obta<strong>in</strong> high quality red w<strong>in</strong>es.V<strong>in</strong>eyard ecosystems studied are three w<strong>in</strong>e-grow<strong>in</strong>g areas <strong>in</strong> southern Romania,specialized <strong>in</strong> obta<strong>in</strong><strong>in</strong>g quality red w<strong>in</strong>es: Dragasani (EC I); Valea Calugareasca (EC II)and Urlati (EC III). Studies were conducted <strong>in</strong> 2007-2009.Were analyzed several parameters of quality grapes and w<strong>in</strong>es: sugarsaccumulated, (g/l sugars), total acidity (g/l tartaric acid), production (t/ha); alcoholic117
Proceed<strong>in</strong>g of the 4 rd International Symposium“NEW RESEARCH IN BIOTECHNOLOGY” USAMV Bucharest, Romania, 2011strength (vol% ethilic alcohol), w<strong>in</strong>e total acidity (g/l tartaric acid), volatile acidity (mg/lCH 3 COOH), dry extract (g/l), phenolic compounds (mg/100 ml), anthocyan content (mg/l).Tests were performed accord<strong>in</strong>g to standards <strong>in</strong> force.3. RESULTS AND DISCUSSIONSObservations and analysis showed the <strong>in</strong>fluence of ecosystem v<strong>in</strong>eyard andharvest year on the quantity and quality of grapes and w<strong>in</strong>es. Thus, the Cabernet Sauvignonwas greater accumulation of sugars <strong>in</strong> the center Urlati w<strong>in</strong>e, sugar concentration <strong>in</strong> thethree centers registered <strong>in</strong> values between 205 and 230 g/l; <strong>in</strong> terms of harvest year therewere large differences, as with ecosystems, 2007 the best year, so the accumulation ofsugars largest. 2007 was consi<strong>de</strong>red the best year <strong>in</strong> all w<strong>in</strong>e areas <strong>in</strong> the south and acrossthe country.Merlot showed differences <strong>in</strong> quality and quantity <strong>de</strong>pend<strong>in</strong>g on the v<strong>in</strong>eyard andthe v<strong>in</strong>tage year. Favorable climatic conditions of 2007 were positively <strong>in</strong>fluenced theaccumulation of sugars and balance of taste (sugar/acidity). In terms of v<strong>in</strong>eyard area,although the analysis focused on the same center v<strong>in</strong>eyards, Merlot was better <strong>in</strong> ValeaCalugareasca w<strong>in</strong>e center, an <strong>in</strong>terest<strong>in</strong>g factor is equal accumulation of sugars <strong>in</strong> 2007 and2008.In the case of w<strong>in</strong>es, different accumulation of sugars led to different alcoholconcentrations, but perfectly <strong>in</strong> agreement with the values of this parameter, so theCabernet w<strong>in</strong>e is highest <strong>in</strong> the alcoholic strength <strong>in</strong> Urlati center <strong>in</strong> 2007 (13,3 vol%alcohol) and a lower alcoholic strength, but not <strong>in</strong> disagreement with the potential variety <strong>in</strong>the Dragasani area. Total dry extract good values recor<strong>de</strong>d <strong>in</strong> all years and <strong>in</strong> all threegrow<strong>in</strong>g centers. Chromatic compounds accumulation is done <strong>in</strong> parallel and <strong>in</strong> a positiverelationship with the accumulation of sugars. Often, high concentrations of phenoliccompounds characteristic of the variety is reached before a high concentration of sugars,but only un<strong>de</strong>r a year when climatic factors have allowed.Table 1 – Technological potential of Cabernet Sauvignon and Merlot v<strong>in</strong>es <strong>in</strong> three ecosystems <strong>in</strong> theperiod 2007-2009Chemical and physicalparameters of grapes/total acidity,g/l tartaric acidgrape productiont/haParametrii fizico-chimici ai CabernetCabernetMerlotstrugurilorSauvignonSauvignonMerlotv<strong>in</strong>eyard ecosystem I, 2007 6,85 6,9 15,9 19,0v<strong>in</strong>eyard ecosystem I, 2008 6,85 7,19 17,4 20,2v<strong>in</strong>eyard ecosystem I, 2009 7,50 7,15 17,0 20,0v<strong>in</strong>eyard ecosystem II, 2007 7,25 7,2 16,0 17,8v<strong>in</strong>eyard ecosystem II, 2008 7,65 7,5 15,5 17,5v<strong>in</strong>eyard ecosystem II, 2009 7,89 7,58 15,5 18,3v<strong>in</strong>eyard ecosystem III, 2007 6,90 6,45 13,1 17,5v<strong>in</strong>eyard ecosystem III, 2008 7,14 7,0 14,0 18,0v<strong>in</strong>eyard ecosystem III, 2009 7,70 7,15 14,8 18,3118
Proceed<strong>in</strong>g of the 4 rd International Symposium“NEW RESEARCH IN BIOTECHNOLOGY” USAMV Bucharest, Romania, 2011g/l zaharuri, g/l sugars25020015010050217200190215206 2002302202050EC I2007EC I2008EC I2009EC II2007EC II2008EC II2009EC III2007EC III2008EC III2009Fig. 1 Variation accumulation of sugars <strong>in</strong> Cabernet Sauvignon <strong>in</strong> three v<strong>in</strong>eyard ecosystems <strong>in</strong>2007-2009g/l zaharuri, g/l sugars25020015010050215190 195230 230208220 2152000EC I2007EC I2008EC I2009EC II2007EC II2008EC II2009EC III2007EC III2008EC III2009Fig. 2 Variation accumulation of sugars <strong>in</strong> Merlot <strong>in</strong> three v<strong>in</strong>eyard ecosystems <strong>in</strong> 2007-2009Analyses showed that <strong>in</strong> the case of Cabernet Sauvignon w<strong>in</strong>e, there were stilllarge amounts of phenolic compounds <strong>in</strong> w<strong>in</strong>e center Urlati <strong>in</strong> 2007. Tann<strong>in</strong>s content variedvery little a larger amount of tann<strong>in</strong>s occurr<strong>in</strong>g <strong>in</strong> Urlati, amid higher concentrations <strong>in</strong>phenolic compounds. In anthocyan<strong>in</strong> concentration followed the same curve, higher119
Proceed<strong>in</strong>g of the 4 rd International Symposium“NEW RESEARCH IN BIOTECHNOLOGY” USAMV Bucharest, Romania, 2011accumulation occurr<strong>in</strong>g <strong>in</strong> Urlati center, the difference is quite large between the center andcenter Dragasani.Merlot w<strong>in</strong>e analyzed showed values of key parameters <strong>in</strong> total agreement with thecompositional quality of the grapes: the values of the alcoholic strength of acidity (total andvolatile), extract and color characteristics are higher <strong>in</strong> the center of Valea Calugareasca;values <strong>in</strong> the other two centers were different and less non-characteristic, and <strong>in</strong> 2007 wasstill one that has <strong>in</strong>fluenced this case the best quality w<strong>in</strong>es.Table 2 – Quality parameters of w<strong>in</strong>e Cabernet SauvignonQuality parameters of w<strong>in</strong>e /Parametrii <strong>de</strong> calitate ai v<strong>in</strong>uriloralcoholic strength,vol% alcohol /tariaalcoolicatotal acidity, g/ltartaric acid/aciditatetotaladry extract g/l /extractsecvolatile acidity, mg/lCH 3 COOH/ aciditateavolatilav<strong>in</strong>eyard ecosystem I, 2007 12,0 5,4 26,4 0,4v<strong>in</strong>eyard ecosystem I, 2008 11,6 5,6 26,2 0,2v<strong>in</strong>eyard ecosystem I, 2009 11,0 6,1 26,0 0,3v<strong>in</strong>eyard ecosystem II, 2007 12,4 6,1 32,0 0,3v<strong>in</strong>eyard ecosystem II, 2008 12,0 6,5 31,7 0,3v<strong>in</strong>eyard ecosystem II, 2009 11,7 6,7 30,3 0,4v<strong>in</strong>eyard ecosystem III, 2007 13,3 5,8 33,0 0,4v<strong>in</strong>eyard ecosystem III, 2008 12,7 6,0 31,7 0,3v<strong>in</strong>eyard ecosystem III, 2009 12,0 6,5 30,5 0,5Table 3 - Quality parameters of w<strong>in</strong>e MerlotQuality parameters of w<strong>in</strong>e /Parametrii <strong>de</strong> calitate ai v<strong>in</strong>uriloralcoholic strength,vol% alcohol /tariaalcoolicatotal acidity, g/ltartaric acid/aciditatetotaladry extract g/l/extract secalcoholic strength,vol% alcohol /tariaalcoolicav<strong>in</strong>eyard ecosystem I, 2007 12,4 5,8 25,5 0,4v<strong>in</strong>eyard ecosystem I, 2008 11,0 6,0 24,0 0,4v<strong>in</strong>eyard ecosystem I, 2009 11,0 6,1 24,8 0,3v<strong>in</strong>eyard ecosystem II, 2007 13,2 5,2 30,3 0,4v<strong>in</strong>eyard ecosystem II, 2008 13,0 5,3 30,2 0,2v<strong>in</strong>eyard ecosystem II, 2009 12,1 5,5 30,0 0,4v<strong>in</strong>eyard ecosystem III, 2007 12,7 5,1 27,0 0,5v<strong>in</strong>eyard ecosystem III, 2008 12,4 5,5 27,3 0,3v<strong>in</strong>eyard ecosystem III, 2009 11,3 5,9 25,0 0,3120
Proceed<strong>in</strong>g of the 4 rd International Symposium“NEW RESEARCH IN BIOTECHNOLOGY” USAMV Bucharest, Romania, 2011300250200150100500EC I2007EC I2008EC I2009EC II2007EC II2008EC II2009EC III2007EC III2008EC III2009polyphenols, mg/100 ml" tann<strong>in</strong>s, g/l anthocyan<strong>in</strong>s, mg/lFig. 3 Variation of content <strong>in</strong> phenolic compounds, tann<strong>in</strong>s and anthocyan<strong>in</strong>s at CabernetSauvignon250200150100500EC I2007EC I2008EC I2009EC II2007EC II2008EC II2009EC III2007EC III2008EC III2009polyphenols, mg/100 ml tann<strong>in</strong>s, g/l anthocyan<strong>in</strong>s, mg/lFig. 4 Variation of content <strong>in</strong> phenolic compounds, tann<strong>in</strong>s and anthocyan<strong>in</strong>s at Merlot4. CONCLUSIONS1. The quality of grapes and w<strong>in</strong>es is a result of a multifactorial system, w<strong>in</strong>evariety is always ly<strong>in</strong>g <strong>in</strong> close <strong>in</strong>ter<strong>de</strong>pen<strong>de</strong>nce with ecological and geographicalconditions, with its specific biotope and ecosystem;121
Proceed<strong>in</strong>g of the 4 rd International Symposium“NEW RESEARCH IN BIOTECHNOLOGY” USAMV Bucharest, Romania, 20112. The crop quality <strong>in</strong> a given ecosystem vary with climatic conditions of theyear (soil- local climate-climate year);3. The analyzed varieties, Cabernet Sauvignon and Merlot have behaveddifferently, <strong>de</strong>pend<strong>in</strong>g on environmental conditions and grow<strong>in</strong>g zone but <strong>de</strong>pend<strong>in</strong>g onclimatic conditions of the crop year.REFFERENCES1. Bonardi L., (2007): Des parallelisms oeno-climatiques entre France et Italie du Nord. ColloqueInternational et pluridiscipl<strong>in</strong>aire sous l’egi<strong>de</strong> <strong>de</strong> la chaire UNESCO V<strong>in</strong> et Culture, Dijon,France;2. Carbonneau A., (1993): Facteur <strong>de</strong> qualite la richesse en sucres. Le Progres Agric. Vitic., 9;3. Chab<strong>in</strong> J.P., (2007): Les vignobles beaunois face au rechaffement climatique. ColloqueInternational et Pluridiscipl<strong>in</strong>aire sous l’egi<strong>de</strong> <strong>de</strong> la chairee UNESCO V<strong>in</strong> et Culture, Dijon,France;4. Mark A., Kl<strong>in</strong>gshirm, (2002): The chemistry of w<strong>in</strong>e, University of Alabama;5. Pomohaci Nicolai, Namolosanu Ioan, Antoce Oana Ariana, 1993. Meto<strong>de</strong> <strong>de</strong> analizã si controlutilizate în oenologie, Bucuresti.122
Proceed<strong>in</strong>g of the 4 rd International Symposium“NEW RESEARCH IN BIOTECHNOLOGY” USAMV Bucharest, Romania, 2011SECTION IV: INDUSTRIAL AND ENVIRONMENTALBIOTECHNOLOGYMOLASSES INFLUENCE ON THE EFFICIENCY OF INDUSTRIALBIOTECHNOLOGICAL PROCESSES OF PRODUCING YEAST BIOMASSMIHAELA BEGEA 1,4 , ALEXANDRINA SIRBU 2 , YANNIS KOURKOUTAS 3 ,ROMULUS DIMA 41 University of Agricultural Sciences and Veter<strong>in</strong>ary Medic<strong>in</strong>e Cluj-Napoca, Manastur Street 3, Cluj-Napoca,Romania, ela_begea@yahoo.com2 Constant<strong>in</strong> Brancoveanu University, FMMAE Ramnicu Valcea, Romania, sirbu.alexandr<strong>in</strong>a@rdsl<strong>in</strong>k.ro3 Democritus University of Thrace, Department of Molecular Biology & Genetics, Alexandroupolis, Greece,ikourkou@mbg.duth.gr4 University Politehnica Bucharest, Splaiul In<strong>de</strong>pen<strong>de</strong>ntei 313, S6, 060042 Bucuresti, Romania,r_dima@chim.upb.roAbstract. The aim of this study was to <strong>in</strong>vestigate the behaviour of selected yeast stra<strong>in</strong>s ofSaccharomyces cerevisiae to produce bak<strong>in</strong>g yeast biomass on different substrates. The molassesrepresents the ma<strong>in</strong> raw material for bak<strong>in</strong>g yeast <strong>in</strong>dustry <strong>in</strong> Romania and the most important rolefor an efficient bak<strong>in</strong>g yeast technological process is the quality of the molasses used as raw material.The ma<strong>in</strong> objective of the research was to <strong>in</strong>vestigate the differences <strong>in</strong> yeast biomass accumulationbetween sugar beet and sugar cane molasses supplemented with biot<strong>in</strong>, <strong>in</strong>ositol and pantothenic acid.The yield <strong>in</strong> biomass was calculated for both categories of molasses and a comparison betweentechnological variants was performed <strong>in</strong> or<strong>de</strong>r to settle the most economical variant for the culturemedium. The technological variant us<strong>in</strong>g sugar beet molasses used as raw material supplementedwith biot<strong>in</strong> registered comparable results with the variant us<strong>in</strong>g sugar beet molasses <strong>in</strong> mixture withsugar cane molasses.The results of this study suggest the feasibility of cheaper and more efficient technological procedurethat can be applied <strong>in</strong> the <strong>in</strong>dustrial biotechnological processes.Keywords: molasses, bak<strong>in</strong>g yeast, nutrients, process efficiency1. INTRODUCTIONMany different carbohydrate feedstocks can be used for yeast production, butbecause of low costs most companies use cane or beet molasses. Molasses are <strong>de</strong>nse andviscous liquids, with a high amount of solid residues (68–75%) and 48–52% of sucrose[Burrows, 1970]. The molasses quality can affect the yield and quality of the yeastproduced because its composition is highly variable <strong>de</strong>pend<strong>in</strong>g on the sucrose reff<strong>in</strong><strong>in</strong>gprocedure and on the specific location, soil type, production process and year’s weatherconditions [Kristiansen, 1994: Maqueda et al., 2011].Nowadays, molasses is the standard growth medium for bak<strong>in</strong>g yeast and is thecheapest source of carbohydrate [Goksungur and Zorlu, 2001], but many years passedbefore it replaced saccharified cereals. The substitution of saccharified cereal mash by123
Proceed<strong>in</strong>g of the 4 rd International Symposium“NEW RESEARCH IN BIOTECHNOLOGY” USAMV Bucharest, Romania, 2011molasses improved yeast yield, even <strong>in</strong> the absence of aeration. Historically speak<strong>in</strong>g,Claudon and Vigreux appeared to have been the first to patent <strong>in</strong> 1882 a process <strong>de</strong>scrib<strong>in</strong>gthe use of molasses for grow<strong>in</strong>g yeast and <strong>in</strong> 1895 Elion proposed to use molasses enrichedwith phosphoric acid. The early twentieth century, large amounts of molasses becameavailable at m<strong>in</strong>imal price for yeast manufactur<strong>in</strong>g [Gel<strong>in</strong>as, 2010].In the last four years European Union registered a <strong>de</strong>cl<strong>in</strong>e <strong>in</strong> sugar beet productionafter the limitation of exports by the World Tra<strong>de</strong> Organization. [http://www.agro<strong>in</strong>fo.ro,2011]. As regards the sugar beet situation <strong>in</strong> Romania, <strong>in</strong> this moment the area cultivated isaround 20000 ha and it is sure that sugar beet will be consi<strong>de</strong>red <strong>in</strong> the next future as anenergy crop. The cultivated area has halved after Romanian accession (from 40,000hectares <strong>in</strong> 2006) when it was established <strong>in</strong> negotiations with the EU a quota of sugar forRomania [http://www.capital.ro, 2011]. Un<strong>de</strong>r these conditions, alcohol and yeast factories<strong>in</strong> Romania were forced to resort to imports of sugar cane molasses from countries such asBrazil.Currently applied production technologies for bak<strong>in</strong>g yeast provi<strong>de</strong> cont<strong>in</strong>uousaccumulation of biomass. The ma<strong>in</strong> purpose of manufactur<strong>in</strong>g technology of bak<strong>in</strong>g yeastis to obta<strong>in</strong> a quantity of high quality yeast biomass with m<strong>in</strong>imum consumption of rawmaterials and utilities. The mo<strong>de</strong>rn bak<strong>in</strong>g yeast manufactur<strong>in</strong>g was established around1920. [Gel<strong>in</strong>as, 2010]Saccharomyces cerevisiae known as bak<strong>in</strong>g yeast can be consi<strong>de</strong>red one of themost cultivated microorganism, and has been used extensively for the production of s<strong>in</strong>glecellprote<strong>in</strong> (SCP) used as food and feed. Bak<strong>in</strong>g yeast belongs to the speciesSaccharomyces cerevisiae, accord<strong>in</strong>g to the classification of Hansen <strong>in</strong> 1904, and representsonly a yeast culture [Hansen, 1896]. Bak<strong>in</strong>g yeast is top ferment<strong>in</strong>g yeast stra<strong>in</strong> capable ofproduc<strong>in</strong>g fermentation of sugars <strong>in</strong> the dough with the formation of ethyl alcohol and CO 2 ,rais<strong>in</strong>g agents of dough, and other products, with a role <strong>in</strong> bread-mak<strong>in</strong>g. One of the mostimportant requisites <strong>in</strong> the commercial production of baker’s yeast is rapid growth and highbiomass yield [Benitez et al., 1996].As regards the utilisation of adjuncts <strong>in</strong> or<strong>de</strong>r to <strong>in</strong>crease technological yields, asearly as 1877 specific supplements for liquid media (such as nitrogen and vitam<strong>in</strong>s) wereused. Start<strong>in</strong>g with 1883, molasses supplementation with nitrogen sources as ammoniumsalts was proposed by Scard for promot<strong>in</strong>g yeast growth at alcohol production, a practicethat would later be very important <strong>in</strong> mo<strong>de</strong>rn yeast manufactur<strong>in</strong>g [Gel<strong>in</strong>as, 2010].Nitrogen is normally supplied through the addition of ammonium salts, aqueous ammonia,or anhydrous ammonia [Chen and Chiger, 1985].M<strong>in</strong>eral requirements of molasses <strong>in</strong>clu<strong>de</strong> nitrogen, potassium, phosphate,magnesium, and calcium. As regards potassium and calcium, molasses normally provi<strong>de</strong>ssufficient quantities of these m<strong>in</strong>erals. Phosphates and magnesium are ad<strong>de</strong>d <strong>in</strong> the form ofphosphoric acid or phosphate salts and magnesium salts [Reed and Peppler, 1973]. Besi<strong>de</strong>sthese, molasses needs iron, z<strong>in</strong>c, copper, manganese, and molyb<strong>de</strong>num are also required <strong>in</strong>trace amounts.The yeast growth process also requires several vitam<strong>in</strong>s, such as biot<strong>in</strong>, <strong>in</strong>ositol,pantothenic acid, and thiam<strong>in</strong>e. In the absence of biot<strong>in</strong> bak<strong>in</strong>g yeast is not able to grow.Both cane and beet molasses usually provi<strong>de</strong> enough <strong>in</strong>ositol and pantothenic acid for yeastgrowth <strong>in</strong> or<strong>de</strong>r to obta<strong>in</strong> maximum yields of biomass. Beet molasses is <strong>de</strong>ficient <strong>in</strong> biot<strong>in</strong>124
Proceed<strong>in</strong>g of the 4 rd International Symposium“NEW RESEARCH IN BIOTECHNOLOGY” USAMV Bucharest, Romania, 2011and the variations of this factor expla<strong>in</strong> <strong>in</strong> most of the times, <strong>in</strong> practice, variable yields ofyeast [Reed and Peppler, 1973; Assessment of VOC emissions, 1992; Manualul <strong>in</strong>g<strong>in</strong>erului,2002; White, 1954].The present study is <strong>in</strong> l<strong>in</strong>e with other researches <strong>in</strong> or<strong>de</strong>r to provi<strong>de</strong> the mostappropriate technological solutions as procedures to be applied <strong>in</strong> the <strong>in</strong>dustrialbiotechnological processes, such as food fermentation <strong>in</strong>dustries. The aim of this study wasto <strong>in</strong>vestigate the comparison <strong>in</strong> yeast biomass accumulation between culture media basedon sugar beet and sugar cane molasses, <strong>in</strong> or<strong>de</strong>r to propose the most suitable formulationun<strong>de</strong>r specific conditions of <strong>de</strong>cl<strong>in</strong>e of sugar <strong>in</strong>dustry <strong>in</strong> Romania.2. MATERIALS AND METHODSANALYTICAL METHODS• The soluble dry matter content <strong>in</strong> molasses was <strong>de</strong>term<strong>in</strong>ed by AOAC Official Method932.14, us<strong>in</strong>g a double dilution of molasses;• The moisture content <strong>in</strong> molasses was <strong>de</strong>term<strong>in</strong>ed by AOAC Official Method 966.20(Karl Fisher method);• The total sugar, <strong>in</strong>itial reduc<strong>in</strong>g sugar and sucrose <strong>in</strong> molasses were <strong>de</strong>term<strong>in</strong>ed by Luff-Schoorl method;• The prote<strong>in</strong> content <strong>in</strong> pressed biomass was <strong>de</strong>term<strong>in</strong>ed by Kjeldahl method, calculated asN x 6.25 (AOAC 920.53), us<strong>in</strong>g 0.5 g test portion (AOAC 962.10). Digestion wasperformed for 30 m<strong>in</strong> after solution cleared. The prote<strong>in</strong> was <strong>de</strong>term<strong>in</strong>ed on cell biomassharvested at the end of the experiments;• The ash content <strong>in</strong> molasses was <strong>de</strong>term<strong>in</strong>ed by AOAC Official Method 900.02(gravimetric method, us<strong>in</strong>g 5 g test portion). Result was expressed as percent ash and theash content was calculated by us<strong>in</strong>g the formula given below:Ash (g/l00g) = [(weight of dish with sample after calc<strong>in</strong>ation - weight of emptydish/weight of dish with sample before calc<strong>in</strong>ation - weight of empty dish) x 0.9] x1000.9 – coefficient for transformation of sulphated ash <strong>in</strong>to conventional ash;• The solid content <strong>in</strong> yeast biomass was <strong>de</strong>term<strong>in</strong>ed by AOAC Official Method 961.06(the method of 16 hours dry<strong>in</strong>g);• The yeast cell concentration was estimated by measur<strong>in</strong>g spectrophotometrically <strong>in</strong> UV-Vis the optical <strong>de</strong>nsity (OD) of the culture at 600 nm us<strong>in</strong>g a conversion factor of 0.50OD for 1 ×10 7 cells, and also by weigh<strong>in</strong>g the dried biomass samples on alum<strong>in</strong>iumdishes at 100°C for 24 h;• Life yeast cells (viability) were measured by methylene blue sta<strong>in</strong>.EXPERIMENTAL ORGANISMS (MICRO-ORGANISMS AND INOCULUM)A pure culture of S. cerevisiae (ICA Collection of Microorganisms) was usedthroughout this work for the formation of yeast biomass. The yeast stra<strong>in</strong>s used <strong>in</strong> this workS. cerevisiae bak<strong>in</strong>g yeasts MY2011 previously isolated and selected <strong>in</strong> or<strong>de</strong>r to obta<strong>in</strong>bak<strong>in</strong>g yeast biomass [Regodon et al., 1997].MAINTENANCE MEDIUM125
Proceed<strong>in</strong>g of the 4 rd International Symposium“NEW RESEARCH IN BIOTECHNOLOGY” USAMV Bucharest, Romania, 2011The ma<strong>in</strong>tenance medium was YPG agar. The yeasts were ma<strong>in</strong>ta<strong>in</strong>ed on a slant ofYPGA medium (yeast extract 1%, peptone 1%, glucose 2%, and agar 2% (w/v)) and storedat 4°C.INOCULUMThe culture medium was portioned <strong>in</strong> 1000 ml Erlenmeyer flasks, which werecotton-plugged and sterilized at 121°C for 15 m<strong>in</strong>. When the flasks atta<strong>in</strong>ed roomtemperature, they were <strong>in</strong>oculated (2% v/v) with the yeasts. The culture medium for<strong>in</strong>oculum was malt-agar (malt extract 3%, peptone 0.5%, agar 2%).The yeast were cultivated <strong>in</strong> 1000 ml Erlenmeyer flasks conta<strong>in</strong><strong>in</strong>g 500 ml ofmedium at 30 0 C on a Unimax 1010 orbital rotatory shaker with Incubator 1000 (Heidolph)at 150 rpm for 24 h. Microaerobic conditions were provi<strong>de</strong>d by the use of flasks withcottonwool plugs. At the end of the fermentation process, the f<strong>in</strong>al pH and the yeastbiomasses were <strong>de</strong>term<strong>in</strong>ed.The <strong>in</strong>oculum (10% of the work<strong>in</strong>g volume and roughly 5.2 x 10 7 cells/ml) wastransferred from the flasks to sta<strong>in</strong>less steel bioreactor (total volume of 20 l) fitted with pHmonitor<strong>in</strong>g and controll<strong>in</strong>g equipment and dosage equipment (raw material, nutrient saltsolutions) and which conta<strong>in</strong>ed approx. 15 l liquid volume (work was performed below75% of bioreactor capacity to avoid foam problems).FERMENTATION MEDIAThe preparation of molasses used as fermentation medium comprises the follow<strong>in</strong>ggroups of technological operations: dilution of molasses with potable water at aconcentration of 40% d.m.; acidification of molasses us<strong>in</strong>g concentrated sulphuric acid (pHf<strong>in</strong>al 4.5 – 4.8); sterilisation of molasses; clarification of diluted and sterilized molassesthrough <strong>de</strong>cantation and filtration.The molasses tested were characterized through the follow<strong>in</strong>g parameters:- Sugar beet molasses - soluble dry matter 80.63%; moisture content 22.58%; total sugar57.71% expressed <strong>in</strong> glucose; <strong>in</strong>itial reduc<strong>in</strong>g sugar 9.25%; sucrose 50.48%; ash 5.7%; pH5.7 (<strong>in</strong> solution 10%); nitrogen content 1.23%;- Sugar cane molasses - soluble dry matter 82.2%; moisture content 23.7%; total sugar59.24% expressed <strong>in</strong> glucose; <strong>in</strong>itial reduc<strong>in</strong>g sugar 11.3%; sucrose 55%; ash 7.8%; pH 6(<strong>in</strong> solution 10%); nitrogen content 1.19%.The m<strong>in</strong>erals necessary for yeast were <strong>in</strong>troduced <strong>in</strong>to the culture medium <strong>in</strong> theform of solutions.The yeast multiplication was tested, with and without addition of vitam<strong>in</strong>s (biot<strong>in</strong>,calcium panthotenat and <strong>in</strong>ositol) to the medium based on molasses. The vitam<strong>in</strong>s weread<strong>de</strong>d one by one and as mixture of two or three with<strong>in</strong> the culture medium.The soluble dry matter content for the molasses start<strong>in</strong>g base medium before<strong>in</strong>oculation <strong>in</strong> the bioreactor was 20 0 Brix.The media based on molasses conta<strong>in</strong>ed the follow<strong>in</strong>g <strong>in</strong>gredients (g/l):Medium I: (NH4) 2 S0 4 , 0.6; KH 2 PO 4 , 0.3; <strong>in</strong> 1000ml distilled water;Medium II: MgSO 4 x7H 2 O, 0.3; CuSO 4 x7H 2 O, 0.002; ZnSO 4 x7H 2 O, 0.02; CaCl 2 x2H 2 O,0.08; (NH4) 2 S0 4 , 0.6; KH 2 PO 4 , 0.3; <strong>in</strong> 1000ml distilled water;Medium III: MgSO 4 x7H 2 O, 0.3; CuSO 4 x7H 2 O, 0.002; ZnSO 4 x7H 2 O, 0.02; CaCl 2 x2H 2 O,0.08; (NH4) 2 S0 4 , 0.6; KH 2 PO 4 , 0.3; <strong>in</strong>ositol, 0.23; calcium panthotenat, 0.05; <strong>in</strong> 1000mldistilled water;126
Proceed<strong>in</strong>g of the 4 rd International Symposium“NEW RESEARCH IN BIOTECHNOLOGY” USAMV Bucharest, Romania, 2011Medium IV: MgSO 4 x7H 2 O, 0.3; CuSO 4 x7H 2 O, 0.002; ZnSO 4 x7H 2 O, 0.02; CaCl 2 x2H 2 O,0.08; (NH4) 2 S0 4 , 0.6; KH 2 PO 4 , 0.3; <strong>in</strong>ositol, 0.23; calcium panthotenat, 0.05; biot<strong>in</strong>,0.06x10 -3 ; <strong>in</strong> 1000ml distilled water.Formulations were tested, comb<strong>in</strong><strong>in</strong>g <strong>in</strong> different rations the sugar beet and sugarcane molasses. The <strong>in</strong>itial pH values of all media were adjusted to 4.5 with H 2 SO 4 conc.FERMENTATION CONDITIONSBefore <strong>in</strong>oculation, the culture medium <strong>in</strong> the bioreactor was steam sterilized <strong>in</strong>situ and after cool<strong>in</strong>g was <strong>in</strong>oculated with 10% <strong>in</strong>oculum (24-hours-old).The molasses was fed-batch ad<strong>de</strong>d follow<strong>in</strong>g a program, ma<strong>in</strong>ta<strong>in</strong><strong>in</strong>g the sugarconcentration around 8%, <strong>in</strong> or<strong>de</strong>r to avoid sugar fermentation and ethanol production. Thefeed<strong>in</strong>g diagram with molasses is presented <strong>in</strong> fig. 1.Fig. 1 Molasses addition programs for bak<strong>in</strong>g yeast productionFermentation was performed at a temperature of 30 0 C. Agitation speed andaeration rate <strong>in</strong> the bioreactor were 1000 rpm and 0.6 litres / litres / m<strong>in</strong>, respectively. ThepH was automatically controlled at pH 4.5-4.8 with 2N NaOH. Silicone antifoam (CarlRoth) was used to prevent foam formation. The total fermentation time was 51 hours, andafter completion of the molasses addition, the culture was ma<strong>in</strong>ta<strong>in</strong>ed with aeration for 4hto allow yeast maturation.Parameters such air flow, oxygen concentration <strong>in</strong> the culture, sugars and ammonia<strong>in</strong> the medium are controlled <strong>in</strong> commercial yeast production to improve yield [Kristiansen,1994; Lee et al., 1999; Maqueda et al., 2011], but these parameters were not monitoreddur<strong>in</strong>g this work.At the end of multiplication process (55 hours) the biomass was separated bycentrifugation us<strong>in</strong>g a laboratory centrifuge ROTINA 38 Hettich with 250 ml tubes. Theyeast biomass was centrifuged for 20 m<strong>in</strong>utes at 4000 rpm. In or<strong>de</strong>r to assess the yield <strong>in</strong>biomass, the amount of biomass formed after 55 hours of fermentation was <strong>de</strong>term<strong>in</strong>ed.Cell growth was measured by <strong>de</strong>term<strong>in</strong><strong>in</strong>g the optical <strong>de</strong>nsity at 600 nm us<strong>in</strong>g aspectrophotometer. To <strong>de</strong>term<strong>in</strong>e culture dry weight, culture samples (10 ml) were filtered127
Proceed<strong>in</strong>g of the 4 rd International Symposium“NEW RESEARCH IN BIOTECHNOLOGY” USAMV Bucharest, Romania, 2011through pre-weighed 13-mm membrane filters (Nalgene, 0.45-µm pore size). The filterswere washed with distilled water twice and then dried at 100°C for at least 16 h to constantweight. The <strong>de</strong>term<strong>in</strong>ations were performed <strong>in</strong> duplicate and varied by less than 2%.3. RESULTS AND DISCUSSIONSMicroscopy revealed that most of the yeasts produced were pure culture, withhomogeneous cell size and morphology for molasses productions (Fig. 2), with more than98% of live cells as measured by methylene blue sta<strong>in</strong>.Fig. 2 Cell shape of stra<strong>in</strong>s for MY2011 yeast produced <strong>in</strong> the 20-l bioreactor (16 l of culture) withmolasses. The micrographs were taken after the 24-h production run and the scale bar represents 10µm.YEAST YIELD FOR THE FED-BATCH MOLASSES PRODUCTIONThe yield of yeast production with molasses <strong>de</strong>pen<strong>de</strong>d on the amount of total sugarexist<strong>in</strong>g dur<strong>in</strong>g yeast growth. In figures 3 and 4 is given the yield <strong>in</strong> biomass (YB, <strong>in</strong> gramsof dry yeast/l) for the tested formulations of culture medium: sugar beet molasses (SBM),sugar cane molasses (SCM) and mixtures (half ratio) of sugar beet and sugar cane molasses(SB+C_M). Also the presence of certa<strong>in</strong> nutrients <strong>in</strong>to the medium growth contributes todifferent biomass accumulation (enrichment for). In this work we used four variousmedium, as it was mentioned above.As is shown <strong>in</strong> figure 3, the biomass yield <strong>in</strong>creased from a m<strong>in</strong>imum of 24.9 g/lus<strong>in</strong>g blank medium (I) for sugar beet molasses to a maximum value of 33.3 g/l, whenmedium IV and sugar cane molasses were used for.Figures registered throughout our study <strong>in</strong>dicated that the best yield was obta<strong>in</strong>edus<strong>in</strong>g sugar cane molasses, no matters the media preparation. Obviously, the results wereimproved when they worked with formulation of medium IV <strong>in</strong> comparison with previousones due to specific enrichments.On the basis of the data <strong>in</strong>troduced <strong>in</strong> figures 3 and 4, the follow<strong>in</strong>g remarks canbe drawn on either the <strong>in</strong>fluence of type of molasses or <strong>in</strong>gredients for fermentationpreparation on the biomass accumulation <strong>in</strong> culture medium:1. For all tests there is an <strong>in</strong>crement <strong>in</strong> biomass yield with an upward trend of percentage ofthe cane molasses <strong>in</strong> the culture medium (see also figure 5).128
Proceed<strong>in</strong>g of the 4 rd International Symposium“NEW RESEARCH IN BIOTECHNOLOGY” USAMV Bucharest, Romania, 20112. Increase <strong>in</strong> yield of biomass <strong>in</strong> the case of medium II <strong>in</strong> comparison with medium III issimilar. This is <strong>in</strong> accordance with literature [Reed and Peppler, 1973; Assessment of VOCemissions, 1992] <strong>in</strong> that the cane and beet molasses usually provi<strong>de</strong> enough <strong>in</strong>ositol andpantothenic acid for yeast growth.Medium IMedium IIYB, g/l3432302826241 2 3 4 5YB, g/l3432302826241 2 3 4 5SBM SCM SB+C_MSBM SCM SB+C_MMedium IIIMedium IV34343232YB, g/l302826YB, g/l302826241 2 3 4 5241 2 3 4 5SBM SCM SB+C_MSBM SCM SB+C_MFig. 3 Variation of the field <strong>in</strong> biomass <strong>de</strong>pend<strong>in</strong>g on growth medium composition3432YB, g/l30282624Medium I Medium II Medium III Medium IVSBM SCM SB+C_MFig. 4 Mean values for yeast yield production by us<strong>in</strong>g different fermentation media3. Differences on biomass growth were register between medium II and medium IV whenvarious molasses used, but bivariate correlation coefficient was not significant at p=0.05.129
Proceed<strong>in</strong>g of the 4 rd International Symposium“NEW RESEARCH IN BIOTECHNOLOGY” USAMV Bucharest, Romania, 20114. The results performed on medium III for sugar cane molasses are similar with results formedium IV for sugar beet molasses, which is <strong>in</strong> accordance with [Reed and Peppler, 1973;Assessment of VOC emissions, 1992] f<strong>in</strong>d<strong>in</strong>gs that sugar cane molasses provi<strong>de</strong> <strong>in</strong> someextent biot<strong>in</strong> as growth factor for yeast growth, compared with sugar beet molasses; similaroutcomes are noticed for the medium IV us<strong>in</strong>g sugar beet molasses with addition of biot<strong>in</strong>(32.24 g/l) and medium II us<strong>in</strong>g a mixture of sugar cane and sugar beet molasses (32.02g/l).In other words, our results highl<strong>in</strong>e f<strong>in</strong>d<strong>in</strong>gs [Reed and Peppler, 1973; Assessment of VOCemissions, 1992] that sugar beet molasses is <strong>de</strong>ficient <strong>in</strong> biot<strong>in</strong> and the variations of thisfactor expla<strong>in</strong> <strong>in</strong> practice <strong>in</strong> most of the times the variable yields of yeast. Anyway theaddition of biot<strong>in</strong>, <strong>in</strong> all cases, leads to an <strong>in</strong>crease amount of yield <strong>in</strong> biomass <strong>in</strong> the culturemedium.5. In the case of both types of molasses the largest quantity of biomass is obta<strong>in</strong>ed when allthree growth factors are present; but biot<strong>in</strong> seems to have a <strong>de</strong>cisive role as regards theamount of biomass produced at the end of the multiplication.6. The yeast yields for all media tested were reasonably well as compared with other yeastbiomass productions. In this respect, accord<strong>in</strong>g to our results data, the yield was similarwith other type of yeast biomass, such as those produced with an <strong>in</strong>gredients mix ofmolasses and cheese whey, 32.3–35 g/l [Ferrari et al., 2001].3432YB, g/l302826CM 0% CM 50% CM 100%240 1 2 3 4 5Fig. 5 Yeast yield production <strong>in</strong> relationship with cane molasses (CM) content1304. CONCLUSIONSThe addition of growth factors, such as microelements and other <strong>in</strong>gredientscontributes to improvement of technological yield <strong>in</strong> yeast biomass.The data generally showed that MY2011 yeast registered not significant difference<strong>in</strong> biomass production when the number of supplements <strong>in</strong>creased. Yeast cultivated <strong>in</strong>
Proceed<strong>in</strong>g of the 4 rd International Symposium“NEW RESEARCH IN BIOTECHNOLOGY” USAMV Bucharest, Romania, 2011medium based on sugar beet molasses supplemented with m<strong>in</strong>eral salts and vitam<strong>in</strong>srespon<strong>de</strong>d <strong>in</strong> a similar way to medium based on mixture of molasses supplemented withm<strong>in</strong>erals. Given that the <strong>in</strong>corporation of many <strong>in</strong>gredients requires more <strong>in</strong>put <strong>in</strong>to the<strong>in</strong>dustrial production of yeast biomass, the formulation of media based on mixture ofmolasses with <strong>in</strong>corporation of ammonium salts and m<strong>in</strong>erals is consi<strong>de</strong>red as costeffective<strong>in</strong> condition.The most significant <strong>in</strong>fluence on the yield <strong>in</strong> biomass is represented by biot<strong>in</strong>.The results of this study <strong>in</strong>dicate the feasibility of <strong>in</strong>dustrial application of two solutions, <strong>in</strong>or<strong>de</strong>r to obta<strong>in</strong> a similar yield <strong>in</strong> yeast biomass:→ utilization of sugar beet molasses as ma<strong>in</strong> raw material, supplemented with biot<strong>in</strong>;→ utilization of a mixture of sugar beet and sugar cane molasses, with no addition ofvitam<strong>in</strong>s.ACKNOWLEDGEMENTS. The work was f<strong>in</strong>ancially supported by the projectPOSDRU/89/1.5/S/52432 of 01.04.2010 - Institutional organization of a postdoctoralschool of national <strong>in</strong>terest "Applied biotechnology with impact <strong>in</strong> the Romanian economy";the project was co-fun<strong>de</strong>d by the EU Social Fund <strong>in</strong> the framework of the SectorialOperational Programme 2007-2013 for Human Resources Development.REFERENCES1. Benitez, B., Gasent-Ramirez, J. M., Castrejon, F. and Codon, A. C. (1996): Development of newstra<strong>in</strong>s for the food <strong>in</strong>dustry. Biotechnol. Prog. 12: 149–163.2. Burrows, S. (1970): Baker’s yeast. In: Rose AH, Harrison JS (eds) The yeasts: yeast technology,vol 3. Aca<strong>de</strong>mic Press, London, 349–420.3. Chen, S. L., Chiger, M. (1985): Production of bakers’ yeast. In: Moo-Young M (ed)Comprehensive biotechnology, Vol 3. Pergamon Press, Oxford, 429–462.4. Ferrari, M.D., Bianco, R., Froche, C., Loperena, M.L. (2001): Baker’s yeast production frommolasses/cheese whey mixtures. Biotechnol. Lett. Vol. 23, 1:1–4.5. Gel<strong>in</strong>as, P. (2010): Mapp<strong>in</strong>g Early Patents on Baker’s Yeast Manufacture. ComprehensiveReviews <strong>in</strong> Food Science and Food Safety Vol. 9, 5: 483-497.6. Goksungur,Y., Zorlu, N. (2001): Production of ethanol from beet molasses by calcium alg<strong>in</strong>ateimmobilized yeast cells <strong>in</strong> a packed bioreactor. Turk. J. Biol. 25:265-275.7. Hansen, E.C. (1896): Practical studies <strong>in</strong> fermentation: be<strong>in</strong>g contributions to the life history ofmicro-organisms. London: E. & F. N. Spon., 277.8. Jiru, T.M. (2009): Evaluation of yeast biomass production us<strong>in</strong>g molasses and supplements. AThesis Submitted to the School of Graduate Studies, Faculty of Science Department of Biologyof Addis Ababa University <strong>in</strong> Partial Fulfillment of Degree of Master of Science <strong>in</strong> Biology(Applied Microbiology), Addis Ababa, Ethiopia, 7-17.9. Kristiansen, B. (1994): Integrated <strong>de</strong>sign of fermentation plant. The production of bakers’ yeast.VCH Verlagsgesellschaft mbH, We<strong>in</strong>heim.10. Lee, J., Lee, S.Y., Park, S., Mid<strong>de</strong>lberg, A.P.J. (1999) Control of fedbatch fermentations.Biotechnol. Adv. 17, 1:29–48.11. Maqueda, M., Pérez-Nevado, F., Regodón, J.A., Zamora, E., Álvarez, M.L., Rebollo, J.E.,Ramírez, M. (2011): A low-cost procedure for production of fresh autochthonous w<strong>in</strong>e yeast. J.Ind. Microbiol. Biotechnol. Vol. 38, 3:459–469.12. Reed, G., Peppler, H. (1973): Yeast Technology. Wesport, CT, Avi Publish<strong>in</strong>g Company.131
Proceed<strong>in</strong>g of the 4 rd International Symposium“NEW RESEARCH IN BIOTECHNOLOGY” USAMV Bucharest, Romania, 201113. Regodón, J.A., Pérez, F., Valdés, M.E., De Miguel, C., Ramírez, M. (1997): A simple an<strong>de</strong>ffective procedure for selection of w<strong>in</strong>e yeast stra<strong>in</strong>s. Food Microbiol. Vol. 14, 3:247–254.14. White, J. (1954): Yeast Technology. John Wiley and Sons, <strong>New</strong> York.15. xxx, (2000). Official Methods of Analysis of AOAC International, 17th Edition. Edited byWilliam Horwitz, AOAC International.16. x x x (2002). Manualul <strong>in</strong>g<strong>in</strong>erului <strong>de</strong> <strong>in</strong>dustrie alimentara, Bucuresti, Editura Tehnica, Vol. II,1414-1420.17. x x x (1992): Assessment of VOC emissions and their control from baker's yeast manufactur<strong>in</strong>gfacilities, prepared by Midwest Research Institute for the United States Environmental ProtectionAgency, Office of Air Quality Plann<strong>in</strong>g and Standards, Control Technology Center, 7-17.18. http://www.agro<strong>in</strong>fo.ro/vegetal/vesti-bune-pentru-procesatorii-<strong>de</strong>-sfecla-<strong>de</strong>-zahar.19. http://www.capital.ro/<strong>de</strong>talii-articole/stiri/romania-isi-poate-asigura-necesarul-<strong>de</strong>-zahar-darproduce-numai-o-c<strong>in</strong>cime-d<strong>in</strong>-potential-151510.html.132
Proceed<strong>in</strong>g of the 4 rd International Symposium“NEW RESEARCH IN BIOTECHNOLOGY” USAMV Bucharest, Romania, 2011IN VITRO CULTURES OF BALKAN AND BULGARIAN ENDEMICCENTAUREA SPECIESROSSEN GORGOROV *,1 , MARINA STANILOVA * , SVETLANA BANCHEVA ** Institute of Biodiversity and Ecosystem Research, Bulgarian Aca<strong>de</strong>my of Sciences23, Acad. G. Bonchev Str., 1113 Sofia, Bulgaria1 Correspond<strong>in</strong>g author: E-mail: rossen6540@yahoo.comAbstract. Centaurea caliacrae and C. f<strong>in</strong>azzeri are Balkan en<strong>de</strong>mic species and C. davidovii isen<strong>de</strong>mic for Bulgaria. In this study, <strong>in</strong> vitro cultures of the three species were <strong>in</strong>itiated from seeds asa means of ex situ conservation. Due to the species’ conservation status, the available plant materialwas limited, especially with C. davidovii. An average of 90% of the seeds of C. caliacrae germ<strong>in</strong>atedon MS nutrient medium <strong>in</strong> the first 20 days of cultivation regardless of phytohormone treatment(giberellic acid). Eleven MS-based media were used with different comb<strong>in</strong>ations and concentrationsof cytok<strong>in</strong><strong>in</strong>s and aux<strong>in</strong>s. Green callus formation and occasional organogenesis were the mostfrequent response to plant growth regulators. A few adventitious shoots were formed by cultivatedstems, especially on the medium supplemented with 0,5 g/l benzylam<strong>in</strong>opur<strong>in</strong>e. On the MS medium, C.caliacrae plants grew well, rooted and were successfully transferred to ex vitro conditions with asurvival rate of 84%. A s<strong>in</strong>gle C. davidovii seedl<strong>in</strong>g on phytohormone-free MS medium formedadventitious stems and a callus-like tissue at the base and orig<strong>in</strong>ated a clone, suitable for furtherexperiments with uniform plant material.On the medium supplemented with 3,5 mg/l thidiazuron and1,4 mg/l benzylam<strong>in</strong>opur<strong>in</strong>e, leaf explants formed new leaf clusters from callus which cont<strong>in</strong>uedgrow<strong>in</strong>g when transferred to the MS medium.Keywords: knapweed, ex situ conservation, plant growth regulators1. INTRODUCTIONThe genus Centaurea s. l. is represented <strong>in</strong> the Bulgarian flora by more than 70 species andis among the plant groups whose center of speciation <strong>in</strong>clu<strong>de</strong>s the territory of Bulgaria. It isalso the genus richest <strong>in</strong> en<strong>de</strong>mics <strong>in</strong> the Bulgarian flora (ca. 30%). In the new edition ofthe Red Data Book of Bulgaria (plants) (2011), 14 species are <strong>in</strong>clu<strong>de</strong>d (ca. 23%). Some ofthe Centaurea species are rare and are represented by one or few populations. This suggestsmeasures for their conservation to be taken, both <strong>in</strong> situ and ex situ, especially consi<strong>de</strong>r<strong>in</strong>gthe reproductive problems those species encounter. Their seeds have a generally lowgerm<strong>in</strong>ation rate and are very often damaged by <strong>in</strong>sects before be<strong>in</strong>g dispersed. In thisstudy, <strong>in</strong> vitro culture of three en<strong>de</strong>mic species was <strong>in</strong>itiated as a method for ex situconservation – Centaurea caliacrae Prodán, Centaurea davidovii Urumov and Centaureaf<strong>in</strong>azzeri Adamovič. C. caliacrae is a Balkan en<strong>de</strong>mic, occurr<strong>in</strong>g along the Black sea coast.C. davidovii is a Bulgarian en<strong>de</strong>mic, occurr<strong>in</strong>g only <strong>in</strong> Stara plan<strong>in</strong>a mounta<strong>in</strong>, particularly<strong>in</strong> the Central Balkan national park. Its populations are <strong>de</strong>creas<strong>in</strong>g <strong>in</strong> size (Bancheva &Gorgorov 2010). C. f<strong>in</strong>azzeri is also a Balkan en<strong>de</strong>mic, represented <strong>in</strong> Bulgaria by only onepopulation <strong>in</strong> the Valley of Struma River (Northern part). In addition to <strong>in</strong> situ conservationmeasures, such as establishment of protected territories and habitat conservation, ex situmethods are also advisable, <strong>in</strong>clud<strong>in</strong>g <strong>in</strong> vitro cultivation and micropropagation of the133
Proceed<strong>in</strong>g of the 4 rd International Symposium“NEW RESEARCH IN BIOTECHNOLOGY” USAMV Bucharest, Romania, 2011concerned plants. The <strong>in</strong> vitro cultivation of these three species has not been reportedpreviously.2. MATERIAL AND METHODSSeeds of the three species - Centaurea caliacrae, C. davidovii and C. f<strong>in</strong>azzeri - collectedfrom their natural populations were used as start<strong>in</strong>g material. Due to the conservation statusof the species, only a small number of seeds was used – 72 of C. caliacrae, 45 of C.f<strong>in</strong>azzeri and only 9 of C. davidovii. Thirty-four of C. caliacrae seeds were soaked <strong>in</strong> a0,35% solution of giberellic acid (GA 3 ) for 24 hours before sterilization, and the other 38were soaked <strong>in</strong> water. All seeds were surface sterilized by consecutive r<strong>in</strong>s<strong>in</strong>g with 70%ethanol for one m<strong>in</strong>ute, a solution of NaClO (undiluted commercial bleach, Cl < 5%) for 10m<strong>in</strong>utes, and sterile distilled water. Then they were placed <strong>in</strong> vials conta<strong>in</strong><strong>in</strong>g MS nutrientmedium (Murashige & Skoog 1962) and sealed with plastic caps. Until the appearance of aroot tip, the seeds were kept <strong>in</strong> darkness. All follow<strong>in</strong>g cultures were placed un<strong>de</strong>r aphotoperiod of 16/8 h, light <strong>in</strong>tensity of 2000 lux and temperature of 23-25 ºC.For the subcultivation of the seedl<strong>in</strong>gs, 11 MS-based nutrient media were used,supplemented with different comb<strong>in</strong>ations of plant growth regulators (PGRs), with 30 g/lsucrose and 6,5 g/l Plant agar (Duchefa ® ) <strong>in</strong> plastic conta<strong>in</strong>ers (Table 1). In addition to thesolid media, a liquid CC1 medium <strong>in</strong> flasks on a shaker (at 100 rpm) <strong>in</strong> darkness was used<strong>in</strong> or<strong>de</strong>r to test if the callus would grow better <strong>in</strong> it and if somatic embryogenesis wouldtake place. The pH of all media was adjusted to 5,7-5,8 and they were sterilized byautoclav<strong>in</strong>g at 121ºC.Plants obta<strong>in</strong>ed from <strong>in</strong> vitro seedl<strong>in</strong>gs were used as source of secondary explants: leafand root pieces, as well as whole plants with removed roots.For the ex vitro adaptation of rooted plants, a mixture of soil, coconut fiber and sand <strong>in</strong>proportion 2:1:1 was used.Table 1. Plant growth regulators <strong>in</strong> the nutrient media (BAP: benzylam<strong>in</strong>opur<strong>in</strong>e; NAA: α-naphthaleneacetic acid; 2,4-D: 2,4-dichlorophenoxyacetic acid; TDZ: thidiazuron).Nutrient mediumPlant growth regulators [mg/l]BAP NAA 2,4-D TDZMSC1 0.5 2.0C2 0.5C3 2.0C4 1.0 0.1C5 1.0 0.3C6 4.0 0.1C7 1.4 3.5C8 1.5 2.5 6.0CC1 0.5 0.5CC2 0.5 0.1CG 10134
Proceed<strong>in</strong>g of the 4 rd International Symposium“NEW RESEARCH IN BIOTECHNOLOGY” USAMV Bucharest, Romania, 20113. RESULTS AND DISCUSSIONCentaurea caliacraeThe first C. caliacrae seeds to germ<strong>in</strong>ate were observed at the third day after be<strong>in</strong>g placed<strong>in</strong> the MS medium. A week thereafter half of the seeds germ<strong>in</strong>ated and on the 20 th day, anaverage of 90% of the seeds germ<strong>in</strong>ated. The treatment with GA 3 <strong>in</strong>creased the germ<strong>in</strong>ationrate by only a few percents – 94% of the treated and 87% of the untreated seedsgerm<strong>in</strong>ated. On the MS medium, the seedl<strong>in</strong>gs <strong>de</strong>veloped well and grew normal leaves androots.Secondary explants obta<strong>in</strong>ed from them were transferred to the different media. Greencallus appeared with<strong>in</strong> the first week the leaf and root explants <strong>in</strong> the PGR-supplementedmedia C1, C2, C3, C6, CC1 and CC2. Besi<strong>de</strong>s that callus, a s<strong>in</strong>gle leaf explant on the C2medium formed a spherical white mass of cells, and a s<strong>in</strong>gle leaf explant on the C3 mediumformed a long root. The best-look<strong>in</strong>g calluses were obta<strong>in</strong>ed on media with relatively lowconcentration of both cytok<strong>in</strong><strong>in</strong>s and aux<strong>in</strong>s: CC1 and CC2 (Fig. 1). S<strong>in</strong>gle or a fewexplants <strong>in</strong> the first three media also formed small leaves or roots, but they appearedvitrified and did not grow further, neither on the same media, nor on the MS medium. Thewhole plants always grew callus <strong>in</strong> the cut place, however it was significantly smaller <strong>in</strong> theabsence of PGRs. The plants rooted best <strong>in</strong> the media with no cytok<strong>in</strong><strong>in</strong> (C3 and MS) – 17of 18 plants altogether, but <strong>in</strong> the media conta<strong>in</strong><strong>in</strong>g BAP (C1 and C2) only 2 of 18 plantsformed roots. The plants on the PGR-free medium had smaller calluses and long roots.<strong>New</strong> stems were formed on the C1, C2 and C3 media; the C2 medium had the largestnumber of plants with adventitious stems and up to 3 stems per plant were formed, whichmay be expla<strong>in</strong>ed with the medium be<strong>in</strong>g supplemented with BAP only. On a medium withthe same concentration of cytok<strong>in</strong><strong>in</strong>, Cuenca & al. (1999) have obta<strong>in</strong>ed an average of 4,8new shoots per explant work<strong>in</strong>g with Centaurea paui Loscos ex Willk, a species en<strong>de</strong>micfor Spa<strong>in</strong>. The growth of adventitious stems was observed also <strong>in</strong> 5 plants on the MSmedium after they were transferred there from C2 (Fig. 2). These were 28% of the plantstransferred to MS from C2, however, they did not form any roots after one month ofcultivation. The formation of new shoots with good quality, capable of produc<strong>in</strong>g plants,was only observed with whole stem explants and not with leaf and root explants.On a medium with the same composition as C1, Hammatt & Evans (1985) work<strong>in</strong>gwith Centaurea junoniana Svent. also obta<strong>in</strong>ed hard green callus from leaf explants, and <strong>in</strong>that case shoot organogenesis took place <strong>in</strong> most explants and resulted <strong>in</strong> up to 7 shoots perexplant. Although these authors also suggest small shoots to be transferred to PGR-freemedium for elongation, Centaurea caliacrae leaf-<strong>de</strong>rived shoots did not grow further <strong>in</strong>that medium, possibly due to vitrification.Because of the ten<strong>de</strong>ncy of callus-<strong>de</strong>rived plants to differ genetically from the explantsource, the <strong>in</strong>duction of embryogenic callus was attempted us<strong>in</strong>g <strong>in</strong>itially а variation of themedium, proposed by Rob<strong>in</strong>son & al. (2009) for Emilia zeylanica C. B. Clarke, anAsteracean species. In our experiment, the medium was supplemented with NAA <strong>in</strong>stead of2,4-D (the СС1 medium). Some of the calluses obta<strong>in</strong>ed <strong>in</strong> the above media weretransferred to liquid CC1 medium. After a month, the leaf- and stem-<strong>de</strong>rived callusesformed yellowish-green roun<strong>de</strong>d tissue clusters; their <strong>in</strong>ner tissue was green and hard. The135
Proceed<strong>in</strong>g of the 4 rd International Symposium“NEW RESEARCH IN BIOTECHNOLOGY” USAMV Bucharest, Romania, 2011root-<strong>de</strong>rived calluses also <strong>de</strong>veloped roun<strong>de</strong>d tissue clusters, but they were grey and lessvisible. The spherical cluster of white tissue, formed on a leaf explants <strong>in</strong> the C2 medium,<strong>de</strong>generated.Fig. 1. Callus of C. caliacrae on theCC2 medium (magnification 20x).Fig. 2. A C. caliacrae plant withtwo stems.Some leaf-<strong>de</strong>rived calluses on the solid C6 medium, which has a high BAPconcentration, formed clusters of new stems which had no signs of vitrification (Fig. 3). Ina medium with the same composition, Wildi & al. (1998) obta<strong>in</strong>ed an average of 10 shootsper leaf explant <strong>in</strong> Petasites hybridus Gaertn., Mey. & Scherb.On the CG medium, calluses did form from leaf explants, but they soon turned brownand died. The unusually high concentration of 2,4-D <strong>in</strong> that medium was expected tostimulate somatic embryogenesis by a stress-<strong>in</strong>duced mechanism, but it apparently had atoxic effect <strong>in</strong>stead.Eighteen plants rooted <strong>in</strong> the MS medium were transferred to ex vitro conditions. Theywere placed <strong>in</strong> the soil mixture and were covered with transparent plastic foil for the firstweek. The survival rate was high – 84%, and the plants were placed <strong>in</strong> a greenhouse, wherethey flowered (Fig. 4).Fig. 3. Calluses of C. caliacrae form<strong>in</strong>gnew leaves on the C6 medium.Fig. 4. Flower<strong>in</strong>g C. caliacrae plants after exvitro adaptation.136
Proceed<strong>in</strong>g of the 4 rd International Symposium“NEW RESEARCH IN BIOTECHNOLOGY” USAMV Bucharest, Romania, 2011Centaurea davidoviiOnly one seed of C. davidovii germ<strong>in</strong>ated two months after be<strong>in</strong>g placed <strong>in</strong> the MSmedium. Interest<strong>in</strong>gly, after two more months the plant had two stems with large leaves andsome long roots grow<strong>in</strong>g from a common base of enlarged, callus-like tissue (Fig. 5). Thishappened <strong>in</strong> the absence of PGRs or any other treatment. The two stems were separated andtransferred to fresh MS medium, where they cont<strong>in</strong>ued grow<strong>in</strong>g and form<strong>in</strong>g new leaves.One of the plants grew one more stem. The callus-like tissue had numerous small leavesand was easy to divi<strong>de</strong> <strong>in</strong>to small clusters - 66 altogether, which were transferred to freshMS medium. Eleven of them (16%) grew large leaves (Fig. 6).Fig. 5. C. davidovii on the MS mediumFig. 6. Tissue clusters of C. davidoivii grow<strong>in</strong>gleaves and roots on the MS medium.Leaf and root explants from the 3 stems were placed on C4, C5, C6, C7, C8, CC1, CC2and CG media. Those on the C4, C5 and C6 media formed calluses, but they turned brown<strong>in</strong> 6 weeks and no organogenesis was observed.After two months on the C7 and C8 media, the leaf explants became very enlarged andformed callus, and on C7, small leaflets formed at the marg<strong>in</strong>s of the explants, possibly bysomatic embryogenesis. Kumar & al. (2008) reported somatic embryogenesis <strong>in</strong> Carthamust<strong>in</strong>ctorius L <strong>in</strong> media conta<strong>in</strong><strong>in</strong>g 3,5 mg/l TDZ and 1,4 mg/l 6-[γ,γ dimethylallyl am<strong>in</strong>o]-pur<strong>in</strong>e (2iP) or 6 mg/l TDZ, 1,5 mg/l 2iP and 2,5 mg/l <strong>in</strong>dole-3-butyric acid (IBA). Ourmedia C7 and C8 had the same concentration of PGRs, however we used BAP and NAA<strong>in</strong>stead of 2iP and IBA respectively. Fifty-six excised leaflet clusters were transferred toМS medium, where 27 of them (48%) grew further and formed new leaves (Fig. 7).Callus was also formed on the CC1 and CC2 media. As with C. caliacrae, the explantson the CG medium formed callus, but it turned brown and died.In the five months s<strong>in</strong>ce germ<strong>in</strong>ation, 5 new s<strong>in</strong>gle stems and the above-mentioned 11clumps with large leaves were obta<strong>in</strong>ed from one seedl<strong>in</strong>g. This clone of well-propagat<strong>in</strong>gplants will be used for further experiments with vary<strong>in</strong>g media composition.Centaurea f<strong>in</strong>azzeriOf 45 seeds, 9 (20%) germ<strong>in</strong>ated <strong>in</strong> the first month. None of them were treated with GA 3 .After these seedl<strong>in</strong>gs grow, their subcultivation is <strong>in</strong>ten<strong>de</strong>d to the media <strong>in</strong> which the othertwo species had the best response.137
Proceed<strong>in</strong>g of the 4 rd International Symposium“NEW RESEARCH IN BIOTECHNOLOGY” USAMV Bucharest, Romania, 2011Fig. 7. Small leaflets of C. davidovii formed on a leaf explant on the C7 medium(left) and grow<strong>in</strong>g explants transferred to the MS medium (right).Table 2. Response of the explants to the different media (C - callus; R - roots; IS - <strong>in</strong>direct shootformation; DS - direct shoot formation).Species Centaurea caliacrae Centaurea davidoviiMeidumType ofexplantLeafsegmentsRootsegmentsWholeplantletsMS C, DS C, IS C, RC1 C, R, DS C, IS CC2 C C, R CC3 C, R R, DS C, RC4C5LeafsegmentsC6 C, IS CCCRootsegmentsC7 C, IS C, ISC8C, ISCC1 C CCC2 C CCG C (necrosis) C (necrosis)4. CONCLUSIONSuccessful <strong>in</strong> vitro germ<strong>in</strong>ation of seeds of three en<strong>de</strong>mic species – Centaurea caliacrae, C.davidovii and C. f<strong>in</strong>azzeri – was <strong>de</strong>monstrated. The germ<strong>in</strong>ation rate of C. caliacrae seedswas high regardless of treatment with giberell<strong>in</strong>. The plants grew well <strong>in</strong> vitro on thephytohormone-free MS medium and could be used as an explant source for furtherexperiments, as well as for ex vitro adaptation, which proved to be easy, with a highsurvival rate. The PGR-supplemented media used stimulated ma<strong>in</strong>ly callus formation andsome shoot growth, especially when us<strong>in</strong>g the medium conta<strong>in</strong><strong>in</strong>g 0,5 mg/l BAP. The138
Proceed<strong>in</strong>g of the 4 rd International Symposium“NEW RESEARCH IN BIOTECHNOLOGY” USAMV Bucharest, Romania, 2011formation of a callus-like tissue <strong>in</strong> an untreated seedl<strong>in</strong>g of C. davidovii was observed alongwith strong stem and root growth and formation of adventitious stems. The furthercollection of seeds will make it possible to clarify the frequency of this event and willprovi<strong>de</strong> plant material for future research.REFERENCESBancheva, S., Gorgorov, R.. (2010): Taxonomic revision and conservation status of Centaureadavidovii (sect. Lepteranthus, Asteraceae). Phytologia Balcanica 16(2): 255-261.Cuenca, S., Amo-Marco, J. B., Parra, R. (1999): Micropropagation from <strong>in</strong>florescence stems of theSpanish en<strong>de</strong>mic plant Centaurea paui Loscos ex Willk. (Compositae). Plant Cell Reports 18: 674–679.Hammatt, N., Evans, P. K. (1985): The <strong>in</strong> vitro propagation of an endangered species: Centaureajunoniana Svent. (Compositae). Journal of Horticultural Science 60 (1) 93-97.Kumar, J. V., Ranjitha Kumari, B. D., Castaño, E. (2008): Cyclic somatic embryogenesis an<strong>de</strong>fficient plant regeneration from callus of safflower. Biologia Plantarum 52 (3): 429-436.Murashige, T., Skoog, F., (1962): A revised medium for rapid growth and bioassays with tobaccocultures. Physiol. Plant 15: 473-497.Peev, D. (Editor) (2011) Red Data Book of Bulgaria, Vol. 1 – Plants. Onl<strong>in</strong>e version:http://e-ecodb.bas.bg/rdb/bg/vol1/Rob<strong>in</strong>son J. P., Britto S. J., Balakrishnan, V. (2009): Regeneration of plants through somaticembryogenesis <strong>in</strong> Emilia zeylanica C. B. Clarke - a potential medic<strong>in</strong>al herb. Botany ResearchInternational 2 (1): 36-41.Wildi, E., Schaffner, W., Berger Büter, K. (1998): In vitro propagation of Petasites hybridus(Asteraceae) from leaf and petiole explants and from <strong>in</strong>florescence buds. Plant Cell Reports 18: 336–340.139
Proceed<strong>in</strong>g of the 4 rd International Symposium“NEW RESEARCH IN BIOTECHNOLOGY” USAMV Bucharest, Romania, 2011EPIFLUORESCENCE MICROSCOPY AND TEM INVESTIGATIONS ONBACTERIA IN MARINE MICROCOSMSGHITA S. 1,3 , ARDELEAN I.I. 1,2 PRODAN G. 11 Ovidius University, Constanţa 900470, 2 Institute of Biology, 060031 Bucharest, 3 Constanta Maritime University,900663Abstract. In microcosms supplemented with gasol<strong>in</strong>e and gasol<strong>in</strong>e-enriched mar<strong>in</strong>e populations has<strong>de</strong>veloped a microbiota able to metabolize nutrients and store carbon and energy <strong>in</strong> the form of polyβ-hydroxybutyrategranules (PHB). In nalidixic acid and yeast extract medium the highest level ofviable cells was observed <strong>in</strong> microcosms supplemented with gasol<strong>in</strong>e (1%) and gasol<strong>in</strong>e-enrichedmar<strong>in</strong>e populations (M4). Measurements were performed us<strong>in</strong>g TEM analysis and automaticmeasurement software digital imag<strong>in</strong>g, such as ImageJ to measure cell length and CellC. Inmicrocosm 4 we <strong>de</strong>tected cells (PHB) after sta<strong>in</strong>ed with Nile blue, imply<strong>in</strong>g that un<strong>de</strong>r limitednitrogen and <strong>in</strong> the presence of source carbon, some bacteria can accumulate PHB. Inepifluorescence microscopy PHB granules exhibited an orange fluorescence after sta<strong>in</strong><strong>in</strong>g with Nileblue by blue filter. By TEM technique we followed cell size distribution and morphology of thesamples at the beg<strong>in</strong>n<strong>in</strong>g and end of <strong>in</strong>cubation natural samples. Our results on the <strong>de</strong>velopment celldimensions showed a temporal variation <strong>in</strong> <strong>in</strong>dividual size of bacterial populations <strong>in</strong> theexperimental microcosms.Keywords: microcosms, gasol<strong>in</strong>e, TEM, PHB, Nile blue1. INTRODUCTIONIt is recognized that many microorganisms, distributed <strong>in</strong> different environments, are ableto use hydrocarbons as the sole source of energy and carbon (Atlas, 1981; Inoue &Horikoshi, 1991; Head & Swannell, 1999; Lazăr et al., 1999; van Hamme et al., 2003;Voicu et al., 2003; De Oteyza et al., 2004; Harayama et al., 2004; Head et al., 2006; Seguraet al., 2007; Ştefănescu et al., 2008; Nikolopoulou & Kalogerakis, 2009).The aim of this paper is to count planctonic mar<strong>in</strong>e prokaryotes that are able to oxidize /tolerate gasol<strong>in</strong>e, to follow the dynamics of cell <strong>de</strong>nsity over time by apply<strong>in</strong>gepifluorescence techniques and the algorithms of CellC and Image J software for digitalimages, and to <strong>in</strong>vestigate some ultrastructural <strong>de</strong>tails of these cells.2. MATERIALS AND METHODSSamples and microcosmsWater samples are from the Black Sea (0.5m <strong>de</strong>pth), which was used for the microcosmssetup done <strong>in</strong> Polyethylene transparent bottles. In our experiments, the microcosms <strong>in</strong>volume 1L of natural sea water without sediment, were kept at 18ºC temperature andfluorescent light for two months (from December 2 to January 24). Seawater microcosmwas filtered through 0.45 µm to avoid the presence of protists, <strong>in</strong>clud<strong>in</strong>g heterotrophicnanoflagellates (Vazquez-Dom<strong>in</strong>guez et al., 2005).140
Proceed<strong>in</strong>g of the 4 rd International Symposium“NEW RESEARCH IN BIOTECHNOLOGY” USAMV Bucharest, Romania, 2011The microcosms are as follows: Black Sea natural sample- control (M3); controlsupplemented with gasol<strong>in</strong>e (1% v/w) (M2), control supplemented with gasol<strong>in</strong>e (1% v/w)and nutrients (ammonium nitrate 0.005% w/w) (M1), control supplemented with gasol<strong>in</strong>e(1% v/w) and selected population (1 mL) (M4) and control supplemented with gasol<strong>in</strong>e(1% v/w), nutrients (ammonium nitrate 0.005% w/w) and selected population – 1 mL (M5).Sampl<strong>in</strong>g was done sequentially at 1, 6, 11, 18, 39 and 53 days from the start of theexperiment.Direct viable countsThe method of direct enumeration of viable cells has followed the orig<strong>in</strong>al protocol(Kogure et al., 1979), technique as adapted by Ghiţă et al., 2010. The seawater samples (40mL) conta<strong>in</strong><strong>in</strong>g nutrients (yeast extract, 50 mg / L f<strong>in</strong>al concentration) and antibiotic(nalidixic acid, 20 mg / L f<strong>in</strong>al concentration) were kept at a constant temperature (18°C)<strong>in</strong>cubated <strong>in</strong> light. Subsequently samples were harvested each two hours (consi<strong>de</strong>r<strong>in</strong>g thetime T o , T 1 –after 2 hours, T 2 - after 4 hours; T 3 - after 6 hours, T 4 - after 8 hours, T 5 - after 10hours, T 6 - after 24 hours). Then samples were sta<strong>in</strong>ed with acrid<strong>in</strong>e orange (5µg/mL) andvisualized by epifluorescence microscopy.Epifluorescence microscopySamples were viewed immediately by epifluorescence microscopy (N-400FL, lamp Hg 100W, type on the blue filter- 450-480 nm) with immersion 100X objective and 10X eyepieces.Transmission electron microscopy us<strong>in</strong>g negative sta<strong>in</strong><strong>in</strong>gTo <strong>de</strong>term<strong>in</strong>e cell size at the beg<strong>in</strong>n<strong>in</strong>g (T o ) and at the end of the experiment (T 6 )<strong>in</strong>cubation of samples <strong>in</strong> the presence of <strong>in</strong>hibitor and nutrients <strong>in</strong> the five microcosms, weused the TEM technique by negative sta<strong>in</strong><strong>in</strong>g with 1% acid fosfotungstic (pH 6.8-7.4),measur<strong>in</strong>g 150 cells. Negative sta<strong>in</strong><strong>in</strong>g electron microscopy is used <strong>in</strong> one of the mostwi<strong>de</strong>ly used methods <strong>in</strong> the study of microorganisms. Contact time between biologicalpreparation and dye (1% acid fosfotungstic) is 15 seconds.Samples of microcosm 4 were processed and analyzed by Jastrow method (Gun<strong>de</strong>rsen etal., 1988; Jastrow et al., 1997) to see some adjustments <strong>in</strong> the ultrastructure of prokaryoticcell elongation from cultured cells <strong>in</strong> the presence of yeast extract and nalidixic acid.Capsules that <strong>in</strong>clu<strong>de</strong> biological preparation are pyramid sectioned and subjected to cutt<strong>in</strong>gprocess ultramicrotom (Leica Ultracut R) to a sectional dimension of 600 Å. Observationgrids was ma<strong>de</strong> on microscope CM Phillips 120ST.Nile blue sta<strong>in</strong> for PHBSamples from microcosms were used for mak<strong>in</strong>g smears which were subsequently driedwith thermal fix<strong>in</strong>g and sta<strong>in</strong>ed with Nile blue solution 1% at 55 o C for 10 m<strong>in</strong>utes (Ostle &Holt, 1982).The automatic cell analysis was performed us<strong>in</strong>g the Image J and CellC software.Fluorescence microscopy digital images were analyzed and the object has different<strong>in</strong>tensity than the background. The CellC automatic quantification program presents a set offiles where stored process<strong>in</strong>g data are. Generally removes all <strong>de</strong>tected objects that aresmaller than 1 / 10 the average size of all objects (Sel<strong>in</strong>ummi, 2008). Also, we used Image Jsoftware to measure cell length and to obta<strong>in</strong> statistical values with the size <strong>in</strong> pixels,selected by user.141
Proceed<strong>in</strong>g of the 4 rd International Symposium“NEW RESEARCH IN BIOTECHNOLOGY” USAMV Bucharest, Romania, 20113. RESULTS AND DISCUSSIONIn tabel 1 there are presen<strong>de</strong>d the results concern<strong>in</strong>g size distribution of cells <strong>in</strong>cubated 24hours <strong>in</strong> the presence of nalidixic acid (<strong>in</strong>hibitor of DNA gyrase <strong>in</strong> Gram-negative bacteria)and yeast extract.Table 1. The average length of cells obta<strong>in</strong>ed from measurement of 150 cells by TEM an<strong>de</strong>pifluorescence (EFM) technique; samples were taken at the beg<strong>in</strong>n<strong>in</strong>g of the <strong>in</strong>cubation period ( T 0 )and at 24 hours ( T 6 ).<strong>in</strong>cubationtimeaverage length of cells - µm (TEM)M1 M2 M3 M4 M5T o 0.590 0.800 0.610 0.900 0.830T 6 , 24 h 1.400 2.250 1.150 4.750 2.900<strong>in</strong>cubationtimeaverage length of cells - µm (EFM)M1 M2 M3 M4 M5T o0.729 1.012 0.803 1.121 1.105T 6 , 24 h 2.597 4.264 1.996 7.888 4.118One can see that there are some differences obta<strong>in</strong>ed with respect to cell length measuredby epifluorescence microscopy and by transmission electron microscopy. Figure 1 and 2are show<strong>in</strong>g the correlation between the average length of cells at <strong>in</strong>itial time (T 0 ) and f<strong>in</strong>altime (T 6 ) on direct assessment of the number of viable cells, obta<strong>in</strong>ed by TEM- negativesta<strong>in</strong><strong>in</strong>g and epifluorescence technique/ software Image J.Figure 1. Correlation between TEM and EFM values of the average length cells at the time zero, <strong>in</strong>the five microcosms. Cont<strong>in</strong>uous l<strong>in</strong>e represents the l<strong>in</strong>ear regression: y=1.269x + 0,006(r = 0.983; n = 5)142
Proceed<strong>in</strong>g of the 4 rd International Symposium“NEW RESEARCH IN BIOTECHNOLOGY” USAMV Bucharest, Romania, 2011Figure 2. Correlation between TEM and EFM values of the average length cells at 24 hours of<strong>in</strong>cubation time <strong>in</strong> the presence of nalidixic acid, <strong>in</strong> the five microcosms. Cont<strong>in</strong>uous l<strong>in</strong>e representsthe l<strong>in</strong>ear regression: y=1.561x + 0,284 (r = 0.981; n = 5)The results show a good l<strong>in</strong>ear correlation between cell length measurements obta<strong>in</strong>ed byboth methods (TEM and EFM), with the specification that the size cells based on EFMmethod is generally higher than that obta<strong>in</strong>ed by TEM. This could be attributed to use ofdifferent magnification of the images <strong>in</strong> both methods, and different methods to prepare thebiological probes for either EFM or TEM (Chen et al., 2001). The <strong>de</strong>hydration step couldproduce a <strong>de</strong>crease <strong>in</strong> cell dimensions (Wang et al., 2000; Wrigley N.G., 2004).Our results showed a variation <strong>in</strong> time of the size of <strong>in</strong>dividual bacterial populations <strong>in</strong> thefive natural microcosms.These <strong>in</strong>vestigations allowed us to highlight the very small coccoid forms (diameter < 0.25µm) when they were viewed by epifluorescence; however, when <strong>in</strong>spected by TEM onecan see that some of the cells are actually rods and vibrio (Figure 3).Figure 3. M<strong>in</strong>ibacteria: rods, cocci and vibrio (diameter < 0.25 µm)143
Proceed<strong>in</strong>g of the 4 rd International Symposium“NEW RESEARCH IN BIOTECHNOLOGY” USAMV Bucharest, Romania, 2011The length of these rods and vibrio obta<strong>in</strong>ed by transmission electron microscopymeasurements is likely to exceed 0.5 µm.In Figure 4 are the few examples of measurements performed by TEM on bacteria with<strong>in</strong>the microcosms. In microcosm 2 at zero time average cell length was 0.800 µm, but after24 hours <strong>in</strong>cubation, the average cell length was 2.250 µm; however <strong>in</strong> M4 where there wasan additional nitrogen source, the average cell length was 4.750 µm at T 6 .Figure 4. Bacterial cell size <strong>in</strong> M2 and M4 measured by TEM at T 0 (0 hours) and T 6 (24 hours).The experimental TEM results illustrate the presence of granules (Figure 5) <strong>in</strong> analyzedcells.144Figure 5. Section <strong>in</strong> the cell wall (x 145.000). The arrows <strong>in</strong>dicate small gra<strong>in</strong>s observed at thesurface and <strong>in</strong>si<strong>de</strong> the cell.It is difficult to <strong>in</strong>terpret the electron diffraction for a particular crystall<strong>in</strong>e phase. In M4sample there is the possibility that the gra<strong>in</strong>s could be polyhydroxybutyrate (PHB) becauseof the presence of the crystall<strong>in</strong>e phase with orthorhombic structure, with network
Proceed<strong>in</strong>g of the 4 rd International Symposium“NEW RESEARCH IN BIOTECHNOLOGY” USAMV Bucharest, Romania, 2011parameters 5.77 Å, 13.2 Å and 5.97Å. The SAED images of these uni<strong>de</strong>ntified componentsshow presence of mixed phases, amorphous and crystall<strong>in</strong>e, with some l<strong>in</strong>es that can be<strong>in</strong><strong>de</strong>x<strong>in</strong>g with PHB orthorhombic structure (microcosm 4 at T 0 l<strong>in</strong>es (021), (040), (131),(211), (240), (233), (304) and microcosm 4 at T 6 (120), (121), (040), (022), (122), (132),(042), (241), (013), (033), (331), (203), (014), (442), (423), (334)) with both sample exhibita maxima at (040) l<strong>in</strong>e. The average crystall<strong>in</strong>e size obta<strong>in</strong>ed us<strong>in</strong>g Debye-Scherrer relationis 4.6 nm for sample 4 T0 and 5.4 nm sample 4 T6 (Oprea et al., 2008; Prodan & Ciup<strong>in</strong>ă,2010).Further results obta<strong>in</strong>ed by EFM us<strong>in</strong>g the specific sta<strong>in</strong><strong>in</strong>g for PHB us<strong>in</strong>g Nile blue (Ostle& Holt, 1982) further confirm that the gra<strong>in</strong>s, the <strong>in</strong>clusions conta<strong>in</strong> PHB (figure 6).Figure 6. Nile blue sta<strong>in</strong><strong>in</strong>g of PHB observed by EFMThus, the presence of PHB is argued both by TEM and EFM (Mercan, 2002; Betschei<strong>de</strong>r &Jose, 2009), the obta<strong>in</strong> results suggest<strong>in</strong>g that un<strong>de</strong>r these conditions the cells (that are notable to divi<strong>de</strong> because of the presence of nalidixic acid) are <strong>in</strong> position to synthesize PHB,probably as an expression of an imbalance between nitrogen and organic carbon.4. CONCLUSIONS1. There is a good l<strong>in</strong>ear correlation between cell length obta<strong>in</strong>ed by measur<strong>in</strong>g thecell us<strong>in</strong>g two different methods, namely epifluorescence microscopy andtransmission electron microscopy (r = 0.983).2. The presence of PHB <strong>in</strong> these cells is argued both by TEM and EFM, suggest<strong>in</strong>gan excess of organic carbon source as compared with nitrogen source.REFERENCES1. Atlas, R.M. (1981): Microbial <strong>de</strong>gradation of petroleum hydrocarbons: an environmentalperspective. Microbiol. Rev. Vol. 45: 180-209.2. Betschei<strong>de</strong>r, D. & Jose, J. (2009): Nile blue A for sta<strong>in</strong><strong>in</strong>g Escherichia coli <strong>in</strong> flowcytometer experiments. Analytical Biochemistry. Vol. 384: 194-196.3. Chen, F., Lu, J.R., B<strong>in</strong><strong>de</strong>r, B.J., Liu, Y.C., Hodson, R. (2001): Application of Digital ImageAnalysis and Flow Cytometry To Enumerate Mar<strong>in</strong>e Viruses Sta<strong>in</strong>ed with SYBR Gold.Appl. Environ. Microbiol. Vol. 67: 539–545.145
Proceed<strong>in</strong>g of the 4 rd International Symposium“NEW RESEARCH IN BIOTECHNOLOGY” USAMV Bucharest, Romania, 20114. De Oteyza, T.G., Grimalt, J.O., Diestra, E., Solé, A., Esteve, I. (2004): Changes <strong>in</strong> thecomposition of polar and apolar cru<strong>de</strong> oil fractions un<strong>de</strong>r the action of Microcoleusconsortium. Appl. Microbiol. Biotechnol. Vol. 66: 226-232.5. Ghiţă, S., Sarchizian, I., Ţuţuianu, A., Ghiţă, D., Abdulcherim, E., Ar<strong>de</strong>lean, I.I. (2010):Quantification of actively grow<strong>in</strong>g hydrocarbon-oxydiz<strong>in</strong>g /tolerant bacteria <strong>in</strong> mar<strong>in</strong>emicrocosms supplemented with gasol<strong>in</strong>e. 3 nd International Symposium of <strong>Biotechnology</strong>„SimpBTH 2010” serie F, ISSN 1224-7774, p: 204-212.6. Gun<strong>de</strong>rsen, H.J.G., Bendtsen, T.F., Korbo, M., Marcussen, N., Møller, A., Nielsen, K.(1988): Some new, simple and efficient stereological methods and their use <strong>in</strong> pathologicalresearch and diagnosis. Acta Pathologica, Microbiologica et Immunologica Scand<strong>in</strong>avica.Vol. 96: 379-394.7. Head, I.M. & Swannell, R.P.J., (1999): Bioremediation of petroleum hydrocarboncontam<strong>in</strong>ants <strong>in</strong> mar<strong>in</strong>e habitats. Curr. Op<strong>in</strong>. Biotech. Vol. 10: 234-239.8. Head, I.M., Mart<strong>in</strong>, J.D., Rol<strong>in</strong>g, W.F.M. (2006): Mar<strong>in</strong>e micro-organisms make a meal ofoil. Nat. Rev. Microbiol. Vol. 4: 173-182.9. Harayama, S., Kasai, Y., Hara, A. (2004): Microbial communities <strong>in</strong> oil-contam<strong>in</strong>atedseawater. Curr. Op<strong>in</strong>. Biotech. Vol. 15: 205–214.10. Inoue, A. & Horikoshi, K. (1991): Estimation of solvent-tolerance of bacteria by the solventparameter LogP. J Ferment Bioeng. Vol. 71: 194-196.11. Jastrow, H., von Mach, M.A., Vollrath, L. (1997): The shape of synaptic ribbons <strong>in</strong> the ratp<strong>in</strong>eal gland. Cell and Tissue Research. Vol. 287: 255-261.12. Kogure, K., Simidu, U., Taga, N. (1979): A tentative direct microscopic method for count<strong>in</strong>gliv<strong>in</strong>g mar<strong>in</strong>e bacteria. Can. J. Microbiol. Vol. 25: 415-420.13. Lazăr, I., Dobrotă, S., Voicu, A., Ştefănescu, M., Sandulescu, L., Petrişor, I.G. (1999):Microbial <strong>de</strong>gradation of waste hydrocarbons <strong>in</strong> oily sludge from some Romanian oil fields.Journal of Petroleum Science and Eng<strong>in</strong>eer<strong>in</strong>g. Vol. 22: 151-160.14. Mercan, N. (2002): Production of poly-β-hydroxybutyrate (PHB) by some Rhizobium. TurkJ.Biol. Vol. 26: 215-219.15. Nikolopoulou, M. & Kalogerakis, N. (2009): Biostimulation strategies for fresh andchronically pollutedmar<strong>in</strong>e environments with petroleum hydrocarbons. J. Chem. Technol.Biotechnol. Vol. 84: 802–807.16. Oprea, C., Ciup<strong>in</strong>ă, V., Prodan, G. (2008): Investigation of nanocrystals us<strong>in</strong>g TEMmicrographs and electron diffraction technique. Rom. Journ. Phys. Vol. 53: 223-230.17. Ostle, A.G. & Holt, J.G. (1982): Nile blue A as a fluorescent sta<strong>in</strong> for poly-βhydroxybutyrate.Appl. Environ. Microbiol. Vol. 44: 238-241.18. Prodan, G. & Ciup<strong>in</strong>ă, V. (2010): Rietveld analysis of policrystall<strong>in</strong>e materials us<strong>in</strong>gprecession of electron diffraction. Romanian Biotechnological Letters. Vol. 15: 102-108.19. Segura, A., Hurtado, A., Rivera, B., Lăzăroaie, M.M. (2007): Isolation of new toluenetolerantmar<strong>in</strong>e stra<strong>in</strong>s of bacteria and characterization of their solvent-tolerance properties.Journal of Applied Microbiology. Vol. 104: 1408-1416.20. Sel<strong>in</strong>ummi, J. (2008): On Algorithms for Two and Three Dimensional High ThroughputLight Microscopy, Ph.D Thesis for the <strong>de</strong>gree of Doctor of Technology, 2008.21. Ştefănescu, M., Voicu, A., Lăzăroaie, M., Cârstea, D. (2008): Prelim<strong>in</strong>ary tests concern<strong>in</strong>gsome aquifer polluted microbiota for prospective application of <strong>de</strong>contam<strong>in</strong>ationbiotechnologies. Acta ecologica Carpatica I, Sibiu, Romania, p: 193-208.22. Van Hamme, J.D., S<strong>in</strong>gh, A., Ward, O.P. (2003): Recent Advances <strong>in</strong> PetroleumMicrobiology. Microbiology and Molecular Biology Reviews. Vol. 67: 503-549.23. Vazquez-Dom<strong>in</strong>guez, E., Casamayor, E.O., Catala,` P., Lebaron, P. (2005): DifferentMar<strong>in</strong>e Heterotrophic Nanoflagellates Affect Differentially the Composition of EnrichedBacterial Communities. Microbial Ecology. Vol. 49: 474–485.146
Proceed<strong>in</strong>g of the 4 rd International Symposium“NEW RESEARCH IN BIOTECHNOLOGY” USAMV Bucharest, Romania, 201124. Voicu, A., Dobrotă, S., Ştefănecu, M., Lăzăroaie, M.M., Lazăr, I., Petrişor, I.G. (2003):Stimulation of environmental pollut<strong>in</strong>g oil residues <strong>de</strong>gradation by microbial associations,In: Contam<strong>in</strong>ated Soils, eds. Calabrese E. J., Kostecki P. T., Dragun J., Amherst ScientificPublishers, Amherst, Massachusetts, USA. Vol. 8: 335-342.25. Wang, Z.L., P. Poncharal, P., <strong>de</strong> Heer W.A. (2000): Nanomeasurements of <strong>in</strong>dividual carbonnanotubes by <strong>in</strong> situ TEM. Pure Appl. Chem. Vol. 72: 209–219.26. Wrigley, N.G. (2004): The lattice spac<strong>in</strong>g of crystall<strong>in</strong>e catalase as an <strong>in</strong>ternal standard oflength <strong>in</strong> electron microscopy. Journal of Ultrastructure Research. Vol. 24: 454-464.147
Proceed<strong>in</strong>g of the 4 rd International Symposium“NEW RESEARCH IN BIOTECHNOLOGY” USAMV Bucharest, Romania, 2011THERAPEUTIC EFFECT OF MONASCUS METABOLITESNicoleta Radu 13 , Sidira Marianthi 2 , Mariana Fer<strong>de</strong>s 3 , Mariana Voicescu 41 U.S.A.M.V. Cluj Napoca, Bioeng<strong>in</strong>eer<strong>in</strong>g and <strong>Biotechnology</strong> Department. Correspond<strong>in</strong>g author: Nicoleta Radu,e-mail: nicolbiotec@yahoo.com, phone number: 0730. 728.6942 Department of Molecular Biology & Genetics, Democritus University of Thrace, Alexandroupolis Greece3 Politehnica University of Bucharest, Bioeng<strong>in</strong>eer<strong>in</strong>g and <strong>Biotechnology</strong> Department4 Romanian Aca<strong>de</strong>my,Institute of Physical Chemistry IC Murgulescu, Dept of Supramolecular ChemistryAbstract. Many reports <strong>in</strong>dicate the therapeutic effects for red yeast rice [1-3]. From this po<strong>in</strong>t ofview, experiments performed on cell l<strong>in</strong>e type Hep2 and WiDr <strong>in</strong>dicated an <strong>in</strong>hibitory effect on cancercells. Another study performed on mur<strong>in</strong> cell type RAW 264.7 stimulated with LPS reveal the<strong>in</strong>hibition of nitrogen oxi<strong>de</strong> production <strong>in</strong> comparison with quercet<strong>in</strong> used as witness. Theseproperties is due to presence of some compounds like monakar<strong>in</strong> A-F, monacol<strong>in</strong> K, dimerumic acid,monascopyrid<strong>in</strong>e C-D, xanthomonas<strong>in</strong> A-B, monascumic acid, which exists <strong>in</strong> metabolites producedof Monascus and the presence of ascorbic acid and polifenols. Our study performed with alcoholicred yeast rice extracts <strong>in</strong> the presence of 1% of collagen, reveals a powerful antioxidant effect, <strong>in</strong>which the quench<strong>in</strong>g ratio is 95% <strong>in</strong> comparison with lum<strong>in</strong>ol, used as witness. Studies performed <strong>in</strong>vivo, regard<strong>in</strong>g cicatrisation effect on mouse with the same sample (alcoholic extract of red yeast riceand 1 % collagen) <strong>in</strong>dicate a potential cicatrisation effect, probably due to presence of glucosam<strong>in</strong>ecompound which acts as cicatrisation factor.Keywords: Monascus metabolite, therapeutic effect1481. INTRODUCTIONThe pigments from Monascus metabolites, named red Monascus or Monascus, represent amixture of lypophylic azaphylone. These mixtures conta<strong>in</strong> yellow pigments (ankaflav<strong>in</strong> andmonasc<strong>in</strong>), their oxidised compounds respectively orange pigments (monascorubr<strong>in</strong>e andrubropunctat<strong>in</strong>e) and correspond<strong>in</strong>g compounds with N (red pigment) rubropunctam<strong>in</strong>eand monascorubram<strong>in</strong>e, which <strong>de</strong>rived from isochromene (figure 1) [1-4]. The polyketidiccha<strong>in</strong>s of azaphylones was asambled from acetic acid (which represent the startercompound) and 5 molecules of malonic acid (units of cha<strong>in</strong> extension) [5-8].The chromophores from hexaketidic compounds were obta<strong>in</strong>ed via monascusone A. Theexternal cha<strong>in</strong>s of this compounds constitute a closed system of gama lactons obta<strong>in</strong>edwith con<strong>de</strong>nsation of 2-oxohexanoic acid with 2 –octooctanoic acid <strong>de</strong>rived from fattyacids. The Nitrogen analogues of azaphylones were obta<strong>in</strong>ed by their reaction witham<strong>in</strong>oacids.Another type of compounds produced of Monascus sp. (named monascot<strong>in</strong>ates) wasi<strong>de</strong>ntified from ethyl acetate extracts of Monascus pilosus BCRC 38093 metabolites. Thesecompounds have the structure presented <strong>in</strong> figure 2 and reveals the follow<strong>in</strong>g spectralcharacteristics:Monasnicot<strong>in</strong>ate A (1). Yellow oil. UV λ max (MeOH): 253, 280, 330 nm. IR ν max(near): 1668, 1712 cm -1 (C=0). ESI-MS: 380 ([M+Na] 4 ). HR-ESI-MS: 380,1837 ([M+Na] + ,C 2i H 27 NaN0 + 4 ; calc. 380,18353).
Proceed<strong>in</strong>g of the 4 rd International Symposium“NEW RESEARCH IN BIOTECHNOLOGY” USAMV Bucharest, Romania, 2011Monasnicot<strong>in</strong>ate B (2). Yellow oil. UV λ max (MeOH): 248, 275, 338. IR ν max(near): 1676, 1716 cm -1 (C=0). ESI-MS: 394 ([M+Na] 4 ). HR-ESI-MS: 394,1994([M+Na] + , C 22 H 29 NaNO 4 + ; calc. 394,1998).Monasnicot<strong>in</strong>ate C (3). Yellow oil. UV λ max (MeOH): 251, 282, 327 nm. IR ν max(near): 1672, 1724 cm -1 (C=0). ESI-MS: 408 ([M+Na] 4 ). HR-ESI-MS: 408,2151([M+Na] + , C 22 H 29 NaNO 4 + ; calc. 408,2153).Figure 1. Monascus azaphylone formation149
Proceed<strong>in</strong>g of the 4 rd International Symposium“NEW RESEARCH IN BIOTECHNOLOGY” USAMV Bucharest, Romania, 2011Monasnicot<strong>in</strong>ate D (4). Yellow oil. UV λ max (MeOH): 245, 271, 328. IR ν max(near): 1665, 1716 cm -1 (C=0) ESI-MS: 382 ([M+Na] 4 ). HR-ESI-MS: 382,1994 ([M+Na] + ,C 22 H 29 NaNO 4 + ; calc. 382,1994).Fig. 2 General formula of monasnicot<strong>in</strong>ates [7]Another researchers i<strong>de</strong>ntified <strong>in</strong> acetone extract which conta<strong>in</strong>s orange azaphylones,another 4 compounds, presented <strong>in</strong> figure 3, named monaphilol A-D, compounds whichgive the florescence.Biological evaluation <strong>in</strong>dicated that compounds 1–4 <strong>in</strong>hibited nitric oxi<strong>de</strong> (NO) productionon lipopolysacchari<strong>de</strong>-stimulated RAW 264.7 cells. Compounds 1–4 also exhibitedantiproliferative activities aga<strong>in</strong>st human laryngeal carc<strong>in</strong>oma (HEp-2) and human colona<strong>de</strong>nocar<strong>in</strong>oma (WiDr).Ma<strong>in</strong> characteristics of monaphilols is presented <strong>in</strong> the follow<strong>in</strong>gsection.25Monaphilol A (1): orange dark oil; [α] D = 2648,8° (c= 1,23, acetone); UV(MeOH) λ max (log ε): 469 (4,0), 302 (3,4); IR ν max (KBr) 3401, 2954, 2918, 2859, 1742,1655, 1528, 1437, 1239, 1168, 1073, 902, 827 cm -1 ; ESIMS m/z385 [M + H] + ; HRESIMSm/z385.2016 [M + H] + (calc. 385.2015; C 23 H 29 O s ).2. MATERIAL AND METHODSThe aims of the paper is to evaluate the potential therapeutic effect of e Monascussp.metabolited (by antioxidant and cicatrisation study).Monascus metabolite extracte wasobta<strong>in</strong>ed by dissloved the red pow<strong>de</strong>r (obta<strong>in</strong>ed <strong>in</strong> solid state biosynthesis betwenMonascus sp. and on rice) <strong>in</strong> ethanol.Materials. The lum<strong>in</strong>ol (LH 2 ) - hydrogen peroxi<strong>de</strong> (H 2 O 2 ) system withconcentration of LH 2 = 2.5 x 10 –5 M and H 2 O 2 = 30 mM <strong>in</strong> Tris-HCl buffer, pH 8.10, wasconsi<strong>de</strong>red as reference system. The Monascus metabolites (10% collagen <strong>in</strong> water and50% Monascus metabolites) was diluted <strong>in</strong> water and ethanol of spectroscopic gra<strong>de</strong>; Thestock solution was: 200 µl pigment at 3 ml of water and ethanol, respectively.Methods and apparatus. Absorption spectra have been performed with a Perk<strong>in</strong>Elmer Lambda 35 Spectrometer. The chemilum<strong>in</strong>escence measurements have been150
Proceed<strong>in</strong>g of the 4 rd International Symposium“NEW RESEARCH IN BIOTECHNOLOGY” USAMV Bucharest, Romania, 2011performed with a TD 20/20 chemilum<strong>in</strong>ometer Turner Design. Measurements were carriedout <strong>in</strong> five replicas and averaged, obta<strong>in</strong><strong>in</strong>g a relative scatter<strong>in</strong>g of the results of up to 10%of the average value; The work<strong>in</strong>g volume was 1000 µl.The antioxidant activity of thepigment, A %, was calculated accord<strong>in</strong>g to the equation:A (%) = ( I I)0−I0× 100 (1)Fig.3Structure of monaphiloles A-D [8].Monaphilol B (2): orange dark oil[α] D 25 =2581,8° (c=0,33, acetona); UV(MeOH λ max (log ε): 469 (4.0), 303 (3,4);IR ν max (KBr) 3398, 2958, 2930, 2851,1734, 1655, 1524, 1441, 1263, 1239, 1172,1073, 906, 796 cm -1 . ESIMS m/z 357 [M +H] + ; HRESIMS m/z 357.1698 [M + H] +(calc. 357.1702; C 21 H 2S O s ).Monaphilol C (3): orange dark25oil; [α] D = 2095,7° (c= 3,49, acetona);UV (MeOH) λ max (log ε): 470 (3.9), 307(3.4); IR ν max (KBr) 3366, 2958, 2926,2855, 1746, 1663, 1528, 1449, 1358, 1239,1073, 958, 835 cm -1 ; ESIMS m/z441 [M +H] + ; HRESIMS m/z441.22S6 [M + H] +(calc. 441,2277; C 26 H 33 O 6 ).Monaphilol D (4): orange dark oil25[α] D = 1491,1° (c= 0,45, acetona); UV(MeOH, λ max (log ε:) 470 (4,0), 307 (3,4);IR ν max (KBr) 3366, 2958, 2926, 2859,1738, 1667, 1528, 1441, 1362, 1235, 1168,1069, 891,807 cm -1 ; ESIMS m/z 413 [M +H] + ; HREIMS m/z 413.1997 [M + H] +(calc. 413,1964; C 24 O 29 H 6 ).Where I 0 and I represent CL <strong>in</strong>tensity measured for the reference system and for thereference system <strong>in</strong> the presence of the pigment, respectively. Both values were measured5s after the beg<strong>in</strong>n<strong>in</strong>g of the reaction. The fluorescence emission spectra of Monascusmetabolites were recor<strong>de</strong>d with Jasco FP-6500 Spectrofluorometer.Cicatrisation effect was <strong>in</strong>vestigated <strong>in</strong> vivo,on Wistar mice us<strong>in</strong>g a Monascus extractconditioned with IPM (isopropyl myristate)151
Proceed<strong>in</strong>g of the 4 rd International Symposium“NEW RESEARCH IN BIOTECHNOLOGY” USAMV Bucharest, Romania, 20113. RESULTS AND DISCUSSIONOptical spectroscopic characteristics of the pigment were <strong>in</strong>vestigated. The solubility of thepigment is better <strong>in</strong> ethanol than aqueous solution. For the pigment <strong>in</strong> ethanol, it can beseen <strong>in</strong> Figure 4, two absorption bands at 374 and 508 nm respectively. Us<strong>in</strong>g differentexcitation wavelengths, the fluorescence emission of the pigment was evi<strong>de</strong>nced. Figure 5shows the fluorescence emission spectra of the Monascus metabolites <strong>in</strong> water (Figure 5A)and ethanol solution (Figure 5B). Three well structured emission bands were evi<strong>de</strong>nced at430, 455 and 525 nm respectively <strong>in</strong> aqueous as well as <strong>in</strong> ethanol solution. Figure 6presents the fluorescence emission spectra of the Monascus metabolites <strong>in</strong> thechemilum<strong>in</strong>escent system lum<strong>in</strong>ol- hydrogen peroxi<strong>de</strong>, <strong>in</strong> Tris-HCl pH 8.10, <strong>in</strong> directcomparison with the reference system and also with the Monascus metabolites <strong>in</strong> ethanolsolution. For the LH 2 /Tris-HCl, pH 8.10/ H 2 O 2 , the fluorescence emission at 424 nmcorresponds to LH 2 fluorescence emission. The red shifted emission of 10 nm (434 nm) <strong>in</strong>the presence of the pigment was evi<strong>de</strong>nced. In direct comparison with the free Monascusmetabolites <strong>in</strong> ethanol solution, it was observed that the fluorescence emission band at 525nm <strong>de</strong>creases. The feature may be due to the oxidation of the metabolites by hydrogenperoxi<strong>de</strong>.By the chemilum<strong>in</strong>escence method, the antioxidant activity of the pigment wasestimated, (results presented <strong>in</strong> Table 1). The antioxidant activity found around 90% isattributed to a good stability to the oxidative processes. This behavior is also correlatedwith the <strong>in</strong>creas<strong>in</strong>g <strong>in</strong> the collagen concentration.Table 1. The chemilum<strong>in</strong>escence (CL) parameters <strong>in</strong> the LH 2 - H 2 O 2 system, <strong>in</strong> Tris-HCl buffer, pH8.10 (Reference system) (RS) <strong>in</strong> the presence of the pigment.System I CL , a.u. A, %RS 1799.05 -2% Monascus metabolites 496.9 72.384% Monascus metabolites 252.05 85.996% Monascus metabolites 185.05 89.718% Monascus metabolites 96.55 94.6315% Monascus metabolites 75.095 95.82Tests regard<strong>in</strong>g cicatrisation effect. In the first step, the witness of conditioned reagent(respectively isopropyl myristate and water) was tested <strong>in</strong> or<strong>de</strong>r to establish his <strong>in</strong>fluenceregard<strong>in</strong>g scars retraction. Result obta<strong>in</strong><strong>in</strong>g (data not shown) reveals no <strong>in</strong>fluence ofcondition<strong>in</strong>g reagent. Regard<strong>in</strong>g bioproduct <strong>de</strong>rived from solid state (P), the average valueof surface lesion with the first day was 3,8 cm 2 , <strong>in</strong> the 3-days 2,84 cm 2 and <strong>in</strong> the days 14and 18, the average value was more accentuated for bioproduct which conta<strong>in</strong> Monascussp.metabolite (P) <strong>in</strong> comparison with condition<strong>in</strong>g reagent (figure 7). These results <strong>in</strong>dicatea possible cicatrisation effect of Monascus sp. metabolite obta<strong>in</strong>ed <strong>in</strong> solid statebiosynthesis.152
Proceed<strong>in</strong>g of the 4 rd International Symposium“NEW RESEARCH IN BIOTECHNOLOGY” USAMV Bucharest, Romania, 2011Figure 4. The UV-Vis Absorption spectra of the pigment <strong>in</strong> water and ethanol solutions.Figure 5. Fluorescence emission spectra of the Monascus metabolites <strong>in</strong> water (A) and <strong>in</strong> ethanol (B)solutions at different excitation wavelengths.153
Proceed<strong>in</strong>g of the 4 rd International Symposium“NEW RESEARCH IN BIOTECHNOLOGY” USAMV Bucharest, Romania, 2011Figure 6. Normalized Fluorescence emission spectra of the pigment <strong>in</strong> the lum<strong>in</strong>ol (LH 2 ) (2.5 × 10 -5 M) – hydrogen peroxi<strong>de</strong> (30 mM), <strong>in</strong> Tris-HCl buffer (pH 8.10).Figure 3 Cicatrisation effect of biomaterial obta<strong>in</strong>ed from Monascus1544. CONCLUSIONOptical spectroscopic characteristics of the pigment reveal the follow<strong>in</strong>g: by UV-VIS<strong>in</strong>vestigation, <strong>in</strong> etanol media, two absorption bands at 374 and 508 nm was obta<strong>in</strong>edrespectively. Us<strong>in</strong>g different excitation wavelengths, <strong>in</strong> fluorescence emission three wellstructured emission bands were evi<strong>de</strong>nced at 430, 455 and 525 nm respectively <strong>in</strong> aqueousas well as <strong>in</strong> ethanol solution.Antioxidant activity of the pigment was found around 90% is attributed a good stability tothe oxidative processes. The results reveal the positive effect recor<strong>de</strong>red by Monascus
Proceed<strong>in</strong>g of the 4 rd International Symposium“NEW RESEARCH IN BIOTECHNOLOGY” USAMV Bucharest, Romania, 2011sp.metabolites. In this case, this product <strong>in</strong>creased the rate of cicatrisation process with 70%<strong>in</strong> comparison with placebo tests <strong>in</strong> the case <strong>in</strong> which these bioproducts was adm<strong>in</strong>istered <strong>in</strong>the 4 day of post sk<strong>in</strong> excision. The improvement of scars retraction can be due to presenceof some compound based on glucosam<strong>in</strong>e <strong>de</strong>rivate present <strong>in</strong> the Monascus metabolites.Further study are nee<strong>de</strong>d to <strong>de</strong>term<strong>in</strong>e the therapeutic effect of other active component fromred yeast rice, <strong>in</strong>clud<strong>in</strong>g sterols, isoflavones and tann<strong>in</strong>s.ACKNOWLEDGEMENTS. The work was f<strong>in</strong>ancially supported by the projectPOSDRU/89/1.5/S/52432 from 1.04.2010 - Institutional organization of a postdoctoralschool of national <strong>in</strong>terest "Applied biotechnology with impact <strong>in</strong> the Romanian economy";the project was cofun<strong>de</strong>d by the EU Social Fund <strong>in</strong> the framework of the SectorialOperational Programme 2007-2013 for Human Resources DevelopmentREFERENCES1.Akihisa, T., Tokuda, H., (2005), Azaphilones furanoisophthali<strong>de</strong>s, and am<strong>in</strong>oacids from theextracts of Monascus pilosus-fermented rice (red mould rice) and ther chemopreventive effects.J.Agric. Food Chem., 53, (3) 562-565.2.Hossa<strong>in</strong>, C.F., Okuyama, E., Yamazaki M., (1996). A new series of coumar<strong>in</strong> <strong>de</strong>rivativeshav<strong>in</strong>g monoam<strong>in</strong>e oxidase <strong>in</strong>hibitory activity from Monascus anka. Chem. Pharm. Bull., 44 (8),1535-1539.3. Taira, J., Miyagi, C., Aniya, Y., (2002). Dimerumic acid as an antioxidant of the mold,Monascus anka: the <strong>in</strong>hibition mechanism aga<strong>in</strong>st lipid peroxidation and hemeprote<strong>in</strong>-mediatedoxidation. Biochem. Pharmacol, 63 (5), 1019-1026.4.M<strong>in</strong>g, J.C. , M<strong>in</strong>g D. W., P<strong>in</strong>g S. Y., (2010), Secondary metabolites isolated from the fungusmonascus kaoliang-fermented rice. J. Chil. Chem. Soc, 55(1), 107-1105.Xijun, L., Changlu, W. (2007), I<strong>de</strong>ntified of new red pigment produced by Monascus ruber.Dyes and Pigments, 73, 121-125.6. Suchada, J., Prasat, K, Busaba, Y et all. (2004, )Azaphilone pigments from yellow mutant ofthe fungus Monascus kaoliang, Phytochemistry, 65, 2569-25757.M<strong>in</strong>g, D.W., M<strong>in</strong>g, J.C. (2011), Monasciot<strong>in</strong>ates A-D Four new puirid<strong>in</strong>e Alcaloids from theMonascus Pilosus BCRC 38093. Molecules, 16, 4719-47278. Hsu, Y.W., Hsu, L.C. (2011), <strong>New</strong> bioactive orange pigment with yellow fluorescence fromMonascus fermented Discorea. Journal of Agricultural and Food Chemistry, 59, 4511-4520.155
Proceed<strong>in</strong>g of the 4 rd International Symposium“NEW RESEARCH IN BIOTECHNOLOGY” USAMV Bucharest, Romania, 2011SECTION V: FOOD SAFETYNEW PACKAGING MATERIALS AND THEIR EFFECT ON THESHELF-LIFE OF PACKAGED SALADIONESCU MARIANA 1 , MUSTATEA GABRIEL 1 , IONESCU VALENTIN 1 ,SMEU IRINA 1 , SPADARO GIUSEPPE 1 , VULUGA ZINA 21 INCD – IBA Bucharest, 6 D<strong>in</strong>u V<strong>in</strong>tila Street, 2 Bucharest2 INCDCP - ICECHIM, 202 Splaiul In<strong>de</strong>pen<strong>de</strong>ntei, 6 BucharestAbstract. The quality of fresh products, m<strong>in</strong>imally processed, such as salad, <strong>de</strong>pends on preparationmethod, packag<strong>in</strong>g material and storage conditions. Packag<strong>in</strong>g material affect sensory properties ofsalad, because the <strong>in</strong>tensity of respiration and color change of the product <strong>de</strong>pend on the compositionof the used material.Depend<strong>in</strong>g on the product, process and storage conditions the microbiological shelf-life may be<strong>de</strong>term<strong>in</strong>ed by either the growth of spoilage or pathogenic microorganisms. Traditional methods forthe <strong>de</strong>term<strong>in</strong>ation of shelf-life <strong>in</strong>clu<strong>de</strong> storage of the product at different temperatures and<strong>de</strong>term<strong>in</strong><strong>in</strong>g spoilage by sensory evaluation or microbial count. This will <strong>in</strong>volve the natural flora ofthe product, which may vary between batches. For products where the shelf-life may be set by thegrowth of pathogenic microorganisms this may <strong>in</strong>volve challenge test<strong>in</strong>g the product with theorganism prior to storage and microbial analysis at <strong>in</strong>tervals.In the experiments was used salad – chopped fresh leaves, packed <strong>in</strong> normal atmosphere, us<strong>in</strong>gdifferent types of new packag<strong>in</strong>g materials: nanocomposite-based LDPE/modified silicate monolayerfilms conta<strong>in</strong><strong>in</strong>g starch and hydrolyzed collagen and usually PP films. Bags conta<strong>in</strong><strong>in</strong>g salad werestored at 5 Celsius <strong>de</strong>grees.Packag<strong>in</strong>g material effect on product was followed by microbiological and sensory analysis dur<strong>in</strong>gstorage up to 10 days un<strong>de</strong>r mentioned conditions. Sensory evaluation parameters <strong>in</strong>clu<strong>de</strong>d: color,brown<strong>in</strong>g, odor, <strong>de</strong>gradation and overall quality. Microbiological and sensory analyses results werecorrelated with the permeability properties to O 2 , CO 2 and water vapor.The best option may be consi<strong>de</strong>red LDPE/silica-Amp for which can be estimate a shelf-life longerthan 7 days obta<strong>in</strong>ed with PP films currently used.Keywords: shelf-life, m<strong>in</strong>imally processed food, packag<strong>in</strong>g1. INTRODUCTIONLettuce is an important leafy vegetable and one of the ma<strong>in</strong> sources of dietarycarotenoids (Liu & al. [1], Moeller & al. [2]). The cut and packaged lettuce for food serviceand salad mixes are some <strong>in</strong>creas<strong>in</strong>gly important components of the produce <strong>in</strong>dustry.Increased <strong>de</strong>mand for the convenient, pre-cut salads and lettuce has led the scientists tosearch for ways to select lettuce cultivars that stay fresh, colorful, and crisp. Shelf life andvisual quality of fresh-cut lettuce are affected by many th<strong>in</strong>gs, <strong>in</strong>clud<strong>in</strong>g productionenvironment, vegetative maturity, and type of lettuce chosen. Although an <strong>in</strong>creas<strong>in</strong>g156
Proceed<strong>in</strong>g of the 4 rd International Symposium“NEW RESEARCH IN BIOTECHNOLOGY” USAMV Bucharest, Romania, 2011variety of lettuce types are be<strong>in</strong>g grown, roma<strong>in</strong>e and "crisp-head" (such as iceberg) are themost wi<strong>de</strong>ly produced for salad-cut products.One of the major problems fac<strong>in</strong>g food manufacturers is respond<strong>in</strong>g rapidly to the<strong>de</strong>mands of the major retailers who supply a large proportion of the market.The salad leaves, as other leafy vegetables, damage themselves quite rapidlydur<strong>in</strong>g the storage period, because of their <strong>in</strong>creased respiration rate (Soliva & Mart<strong>in</strong> [3]).The low shelf life of fresh-cut m<strong>in</strong>imally processed lettuce leaves is one of the majorproblems that the producers are fac<strong>in</strong>g with (Brecht & al. [4], Saltveit [5]). As so, thequality of ma<strong>de</strong> up products <strong>de</strong>pends on the method of their preparation, pack<strong>in</strong>g materialand storage conditions (Barry-Ryan [6]). Us<strong>in</strong>g efficient packag<strong>in</strong>g materials is nownecessary for all types of fresh or processed foods. All the qualities and attributes of aproduct, that have been <strong>de</strong>veloped dur<strong>in</strong>g production processes can be lost if it the productdoesn’t reach the consumer <strong>in</strong> good conditions.Pack<strong>in</strong>g materials <strong>in</strong>fluence sensory properties of products, because lettucerespiration <strong>in</strong>tensity and product color changes <strong>de</strong>pend on the composition of the usedmaterials (Del Nobile & al. [7]).One of the major problems fac<strong>in</strong>g food manufacturers is respond<strong>in</strong>g rapidly to the<strong>de</strong>mands of the major retailers who supply a large proportion of the market.MAP can be <strong>de</strong>f<strong>in</strong>ed as an active packag<strong>in</strong>g method that creates a new atmosphere<strong>in</strong>si<strong>de</strong> the package, result<strong>in</strong>g <strong>in</strong> a <strong>de</strong>lay of chemical damage and at the same time, <strong>in</strong>hibitgrowth of microorganisms perish. The ma<strong>in</strong> gases used are oxygen, carbon dioxi<strong>de</strong> andnitrogen. Carbon monoxi<strong>de</strong> has limited applications <strong>in</strong> MAP, but sulfur dioxi<strong>de</strong> is usedmore frequently.2. MATERIALS AND METHODSSample preparationTwo types of lettuce were analyzed: Type A – imported “Endivia mix/Lat<strong>in</strong>o mix”(k<strong>in</strong>dly provi<strong>de</strong>d by Eisberg Romania), known to be quite sensible at O 2 concentrations andtype B – lettuce from a local supplier. The samples were represented by lettuce leaves.After they were washed with cold tap water, the excess of water was manually removed.Samples conta<strong>in</strong><strong>in</strong>g 180 grams each from type A lettuce were packaged <strong>in</strong>nanocomposite-based LDPE/modified silicate monolayer films and samples conta<strong>in</strong><strong>in</strong>g 50grams each from type B lettuce were packaged <strong>in</strong> BOPP films (with and withoutperforations).There were used bags with dimensions of about 30x20 cm. The bags werehermetically sealed and stored at 4-5°C. The samples were observed for 10 days.Films characterizationThe follow<strong>in</strong>g films: nanocomposite-based LDPE/modified silicate monolayer filmsconta<strong>in</strong><strong>in</strong>g starch (D20A-Amp) and hydrolyzed collagen (D20A-C08G), LDPE film, andusually BOPP films (with 5 mm perforations and without perforations) were tested <strong>in</strong> termsof barrier properties. The barrier properties to water vapor and gases expressed by thepermeability were <strong>de</strong>term<strong>in</strong>ed by specific analysis: <strong>de</strong>term<strong>in</strong><strong>in</strong>g transmission rates of watervapor accord<strong>in</strong>g to DIN EN ISO 15106-1: 2005 (method of moisture <strong>de</strong>tection) and<strong>de</strong>term<strong>in</strong><strong>in</strong>g gas transmission rate through plastic films and foils accord<strong>in</strong>g to DIN 53380-1157
Proceed<strong>in</strong>g of the 4 rd International Symposium“NEW RESEARCH IN BIOTECHNOLOGY” USAMV Bucharest, Romania, 2011(manometric method). These tests were ma<strong>de</strong> us<strong>in</strong>g Lyssy L80-5000 water vaporpermeability tester and Lyssy L100-5000 manometric gas permeability tester both fromPBI Dansensor.Physico-chemical analysesWater activity was <strong>de</strong>term<strong>in</strong>ed at basel<strong>in</strong>e, before the wash<strong>in</strong>g process, and that onevery test<strong>in</strong>g day, us<strong>in</strong>g the Aquaspector AQS-2-TC <strong>de</strong>vice.Homogeneous samples were obta<strong>in</strong>ed by cutt<strong>in</strong>g the lettuce leafs with a sterilescalpel.Evi<strong>de</strong>nce of weight loss as a result of <strong>de</strong>hydration vegetables dur<strong>in</strong>g storage was<strong>de</strong>term<strong>in</strong>ed by weigh<strong>in</strong>g with the electronic balance Kern EW1500-2M. Salads were firstweighed.To <strong>de</strong>term<strong>in</strong>e the pH 10g of homogeneous sample were weighed, then 100mLdistillated water were ad<strong>de</strong>d. It was used the Inolab pH meter with comb<strong>in</strong>ed electro<strong>de</strong> andthe samples were homogenized us<strong>in</strong>g a Circular Seward 400 Stomacher.Microbiological analysesSamples were <strong>in</strong>itially analyzed, after the wash<strong>in</strong>g process, consi<strong>de</strong>red day 0, andthen on day 1, 3, 5, 7 and 10. For the microbiological analyses, 10g of lettuce were weighedand then homogenized with 90mL peptone water us<strong>in</strong>g the Circular Seward 400 Stomacherfor 30 seconds. Serial dilutions (1:10) of each homogenized sample were ma<strong>de</strong>. Totalaerobic mesophiles and psychrotrophs were <strong>de</strong>term<strong>in</strong>ed accord<strong>in</strong>g to SR EN ISO4833/2003, us<strong>in</strong>g Plate Count Agar (PCA, Biokar Diagnostics) and <strong>in</strong>cubated at 30°C for 3days. The yeasts and moulds were <strong>de</strong>term<strong>in</strong>ed accord<strong>in</strong>g to SR ISO 21527-1/2009, us<strong>in</strong>gDichloran-Rose Bengal Chlormaphenicol agar (DRBC agar, Biokar Diagnostics), <strong>in</strong>cubatedat 25 °C for 5 days. Coliform bacteria were <strong>de</strong>term<strong>in</strong>ed us<strong>in</strong>g Violet Red Bile Agar withLactose, VRBL (Biokar Diagnostics) – <strong>in</strong>cubated 24h at 37 °C STAS ISO 4832/2009.Escherichia coli was <strong>de</strong>term<strong>in</strong>e accord<strong>in</strong>g to SR ISO 16649-2/2007 us<strong>in</strong>g Tryptone BileGlucuroni<strong>de</strong>, TBX (Lab M Harlequ<strong>in</strong>) – <strong>in</strong>cubated 24h at 44 °C.Sensory qualityThere were evaluated changes <strong>in</strong> visual quality, texture, flavour, off-odours andbrown<strong>in</strong>g.1583. RESULTS AND DISCUSSIONSBarrier properties analysisThe barrier properties to water vapor and gas (oxygen, nitrogen and carbondioxi<strong>de</strong>) are presented <strong>in</strong> Table 1.Effect of storage on water lossIn terms of water activity, there was neither significant difference betweenthe salads packaged <strong>in</strong> different film bags, and the perforations didn’t have any significantrelevance. The <strong>in</strong>itial lettuce water activity, at basel<strong>in</strong>e, before wash<strong>in</strong>g, was 1.023. Thevalues registered on the test<strong>in</strong>g days are listed <strong>in</strong> table 1.The lowest water activity values were registered for sample 1, especially <strong>in</strong> thefirst days of storage. In fig. 1 there can be observed that all the tested lettuce samplesregistered an <strong>in</strong>crease of the water activity values <strong>in</strong> the first 3 days, reach<strong>in</strong>g the maximum
Proceed<strong>in</strong>g of the 4 rd International Symposium“NEW RESEARCH IN BIOTECHNOLOGY” USAMV Bucharest, Romania, 2011po<strong>in</strong>t on the fourth day of storage, and then, a <strong>de</strong>crease <strong>in</strong> values was observed for bothsamples. It was observed that all tested samples had the same evolution regard<strong>in</strong>g thedifferences for the water activity values dur<strong>in</strong>g storage period.Table 1 Permeability of tested filmsSampleThickness(mm)Water vapor permeability(g/m 2·day·atm)PermeabilityGas permeability(cm 3 /m 2·day·atm),23 ºC, 0%RH23 ºC, 15% RH 38 ºC, 10% RH O 2 N 2 CO 2LDPE 0,040 5,02 9,46 4484 973,83 10916D20A- 0,050 4,16 7,29 1720 506,39 5870C08GD20A- 0,040 1,72 5,74 1352 466,02 5261AmpBOPP/BOPP0,050 2,55 9,09 1231 267,61 3324Table 2 Water activity values for type B packaged lettuceSampleWater activity valuesDay 1 Day 2 Day 4 Day 5 Day 7 Day 10BOPP 1.036 1.061 1.099 1.114 1.101 1.072BOPPperforated1.049 1.080 1.107 1.118 1.091 1.069Figure 1 Evolution of water activity values dur<strong>in</strong>g the storage periodMicrobiological stabilityIn both cases, the microbial parameter Escherichia coli was not found, and theresults were expressed as
Proceed<strong>in</strong>g of the 4 rd International Symposium“NEW RESEARCH IN BIOTECHNOLOGY” USAMV Bucharest, Romania, 2011(Figure 6 and 7), dur<strong>in</strong>g the observed period for both “Endivia mix“lettuce (type A) andgreen lettuce type B).ABFigure 2 Mesophilic bacteria cell concentration dur<strong>in</strong>g storage time for both types of lettuces(Endivia mix – A and green lettuce – B)ABFigure 3 Coliforms bacteria variation dur<strong>in</strong>g storage time for both types of lettuces (Endivia mix – Aand green lettuce – B)AB160
Proceed<strong>in</strong>g of the 4 rd International Symposium“NEW RESEARCH IN BIOTECHNOLOGY” USAMV Bucharest, Romania, 2011Figure 4 Yeasts and moulds variation dur<strong>in</strong>g storage time for both types of lettuces(Endivia mix – A and green lettuce – B)Dur<strong>in</strong>g storage, there were high values for mesophilic bacteria cell concentrationfor type A lettuce, as an evi<strong>de</strong>nce of <strong>in</strong>creased sensitivity of salad mix compared with greenlettuce, related to m<strong>in</strong>imal process<strong>in</strong>g (cutt<strong>in</strong>g, wash<strong>in</strong>g).Regard<strong>in</strong>g BOPP film, us<strong>in</strong>g a perforated film (Ø 5mm), did not lead to favorableresults <strong>in</strong> terms of microbiological results.There was a microbiological <strong>de</strong>gradation of green lettuce start<strong>in</strong>g the day 4 ofstorage (higher values for yeasts and molds, total coliforms bacteria and mesophilicbacteria). The microorganisms growth was accord<strong>in</strong>g with <strong>in</strong>creased water activity, start<strong>in</strong>gwith day 4 of storage. It must be consi<strong>de</strong>red the lower value of water vapor permeability ofBOPP film. Regard<strong>in</strong>g Envidia mix lettuce, number of the coliforms bacteria, an <strong>in</strong>dicatorfor safety of the product, is not consi<strong>de</strong>red representative for the comparative study of thethree materials. But after 7 ddays of storage, the lettuce packaged <strong>in</strong> LDPE film wasma<strong>in</strong>ta<strong>in</strong>ed at the lowest value. We mention that the yeasts and molds value rema<strong>in</strong>ed lowerthan 10 cfu/g for 7 days, for both nanocomposite-based LDPE films and <strong>in</strong>creased only forLDPE film.In all cases no molds contam<strong>in</strong>ation was observed, but only with yeast.Sensory propertiesInitial properties of the lettuce:• Appearance: without signs of <strong>in</strong>fection or foreign bodies;• Color: yellow-green to dark green;• Taste and smell: pleasant, slightly bitter, fresh lettuce, without strange taste or smell.Sensory modifications noted dur<strong>in</strong>g the storage period are presented <strong>in</strong> Table 3and 4.Table 3 Sensory modifications of Endivia mix lettuceDate Sample Appearance Color Taste and smell ObservationsLDPE No signs of Specific - From yellowgreenPleasant, slightlyDay 1 D20A- Amp <strong>in</strong>festationto dark green bitter, specificD20A- C08Gfresh lettuceLDPE No signs of Specific - From yellowgreenPleasant, slightlyDay 3 D20A- Amp <strong>in</strong>festationto dark green bitter,specific161
Day 5Day 7162Proceed<strong>in</strong>g of the 4 rd International Symposium“NEW RESEARCH IN BIOTECHNOLOGY” USAMV Bucharest, Romania, 2011D20A- C08Gfresh lettuceLDPED20A- AmpD20A- C08GLDPED20A- AmpD20A- C08GLDPED20A- AmpNo signs of<strong>in</strong>festationNo signs of<strong>in</strong>festationDamagedleafs -10%;Damagedleafs - 1%;Day 10 D20A- C08G Damagedleafs - 2%;Specific - From yellowgreento dark greenSpecific - From yellowgreento dark greenPleasant, slightlybitter, specificfresh lettucePleasant, slightlybitter, specificfresh lettuceBrown leaves 2% Unmodified Con<strong>de</strong>nsation on thebag surface - 5%Specific - From yellowgreento dark greenUnmodifiedSpecific - From yellowgreento darkUnmodifiedgreenCon<strong>de</strong>nsation on thebag surface - 20%Analyz<strong>in</strong>g Table 3 results:- After 7 days of storage, no differences were observed between the three films(LDPE, D20A-Amp and D20A-C08G);- Of the 10 th day differences were found between D20A-Amp and D20A-C08Gfilm and, compared to LDPE, is reported the brown<strong>in</strong>g (2%) and <strong>de</strong>gradation (10%) oflettuce leaves (cca.10%), more powerful <strong>in</strong> LDPE film, not yet observable <strong>in</strong> the other twofilms.- From the 10 th day con<strong>de</strong>nsation was also observed, to a greater extent <strong>in</strong> LDPE(bag surface cca.20%), to a lesser extent <strong>in</strong> D20A-C08G film, respectively unobservable <strong>in</strong>D20A-Amp film.Sensory analysis results are correlated with oxygen, carbon dioxi<strong>de</strong> and watervapor permeability properties.Lettuces packaged <strong>in</strong> D20A-Amp and D20A-C08G films reached a suitable levelof O 2 and CO 2 <strong>in</strong>si<strong>de</strong> the bag, so the lettuces stored <strong>in</strong> these bags ma<strong>in</strong>ta<strong>in</strong><strong>in</strong>g theirfreshness for the entire storage period (10 days).In Figures 5 and 6 are presented the three samples of Endivia lettuce (type A) after7 and 10 days of storage.Table 4 Sensory modifications of green lettuceDate Sample Appearance Color Taste and smell ObservationsBOPP No signs of Specific – Pleasant, slightly bitter,Day 1BOPP<strong>in</strong>festation light-green specific fresh lettuceperforatedBOPP No signs of Specific – Pleasant, slightly bitter,Day 3<strong>in</strong>festation light-green specific fresh lettuceDay 5BOPPperforatedBOPPBOPPperforatedNo signs of<strong>in</strong>festationSpecific –light-greenPleasant, slightly bitter,specific fresh lettuce
Day 7Day 10Proceed<strong>in</strong>g of the 4 rd International Symposium“NEW RESEARCH IN BIOTECHNOLOGY” USAMV Bucharest, Romania, 2011BOPPBOPPperforatedBOPPBOPPperforatedDamagedleafs -10%;Damagedleafs -10%;Damagedleafs -30%;Damagedleafs -50%;Specific –light-greenBrown20%Brown10%Brown35%leavesleavesleavesPleasant, slightly bitter,specific fresh lettuceUnmodifiedPleasant, slightly bitter,specific fresh lettuceUnmodifiedCon<strong>de</strong>nsationon the bagsurface - 10%Con<strong>de</strong>nsationon the bagsurface - 20%Figure 5 Packaged Endivia mix lettuce after 7days of storageFigure 6 Packaged Endivia mix lettuce after 10 days of storageIn Figure 7 are presented the two samples of green lettuce (type B) after 3 days ofstorage. As <strong>de</strong>scribed <strong>in</strong> Table 4 from this figure we can see no modifications regard<strong>in</strong>gsensory attributes (appearance and color).163
Proceed<strong>in</strong>g of the 4 rd International Symposium“NEW RESEARCH IN BIOTECHNOLOGY” USAMV Bucharest, Romania, 2011Figure 7 Packaged green lettuce after 3 days of storage4. CONCLUSIONSDur<strong>in</strong>g storage, for the lettuce packaged <strong>in</strong> BOPP film, the water activity <strong>in</strong>creaseduntil day 4; this can be correlated with lower values recor<strong>de</strong>d for water vapor permeability.Sensory analysis results are correlated with oxygen, carbon dioxi<strong>de</strong> and watervapor permeability properties.Lettuces packaged <strong>in</strong> D20A-Amp and D20A-C08G films reached a suitable levelof O 2 and CO 2 <strong>in</strong>si<strong>de</strong> the bag, so the lettuces stored <strong>in</strong> these bags ma<strong>in</strong>ta<strong>in</strong><strong>in</strong>g theirfreshness for the entire storage period (10 days).Dur<strong>in</strong>g storage, for Env<strong>in</strong>ia mix lettuce (type A), higher values for total mesophilicbacteria were recor<strong>de</strong>d, as evi<strong>de</strong>nce of <strong>in</strong>creased sensitivity of Endivia lettuce comparedwith green lettuce, related to m<strong>in</strong>imal process<strong>in</strong>g (cutt<strong>in</strong>g, wash<strong>in</strong>g).The results <strong>in</strong>dicated that the permeability of the packag<strong>in</strong>g film affects theatmosphere <strong>in</strong>si<strong>de</strong> the bag, product quality and shelf life.After complet<strong>in</strong>g the experiments, comparative analysis of the two types of lettucesalmples showed a higher microbiological stability for type A (Endivia mix lettuce), up to10 days of storage; D20A-Amp film is consi<strong>de</strong>red a viable alternative for lettuce packag<strong>in</strong>g.ACKNOWLEDGMENTS. The f<strong>in</strong>ancial support of "Parteneriate" Program of NationalManagement Program Centre, by means of project no. 71-029/ 2007 for achiev<strong>in</strong>g thiscontribution is gratefully acknowledged.164REFERENCES1. X. LIU, S. ARDO, M. BUNNING, J. PARRY, K. ZHOU, C. STUSHNOFF, F. STONIKER, L.Yu, P. KENDALL, Total phenolic content and DPPH radical scaven<strong>in</strong>g activity of lettuce(Lactuca sativa L.) growth <strong>in</strong> Colorado, LWT, 2007, 40: 552-557.2. S. MOELLER, P.F. JACQUES, J.B. Blumberg, The potential role of dietary xanthophylls <strong>in</strong>cataract and age-related macular <strong>de</strong>generation. J. Am. Col. Nutr., 19: 522-527, (2000).
Proceed<strong>in</strong>g of the 4 rd International Symposium“NEW RESEARCH IN BIOTECHNOLOGY” USAMV Bucharest, Romania, 20113. S.C. SOLIVA-FORTUNY, O. MARTI-BELLOSO, <strong>New</strong> advances <strong>in</strong> extend<strong>in</strong>g the shelf life offresh-cut fruits: A review. Trends Food Sci. Tech., 27:3-13,(2003).4. J.K. BRECHT, K.V. CHAU, S.C. FONSECA, F.A.R. OLIVEIRA, F.M. SILVAE, M.C.N.NUNES, R.J. BENDER, Ma<strong>in</strong>ta<strong>in</strong><strong>in</strong>g optimal atmosphere conditions for fruits and vegetablesthroughout the postharvest handl<strong>in</strong>g cha<strong>in</strong>, Postharvest Biol. Tech., 27: 87-101, (2003).5. M.E. SALTVEIT, Is it possible to fi<strong>in</strong>d an optimal controlled atmosphere ºC, Postharvest Biol.Tech., 27: 3-13, (2003).6. C. BARRY-RYAN, D. O’BEIRN, Ascorbic Acid Retention <strong>in</strong> Shred<strong>de</strong>d Aisberg Lettuce asAffected by M<strong>in</strong>imal Process<strong>in</strong>g. J. Food Sci., 64(3), pp 498-500, (1999).7. M. DEL NOBILE, A. BAIANO, A. BENEDETTO, A. MASSIGNAN, Respiration rate ofm<strong>in</strong>imally processed lettuce as affected by packag<strong>in</strong>g, J. Food Eng., 74(1), pp. 60-69, (2006).165
Proceed<strong>in</strong>g of the 4 rd International Symposium“NEW RESEARCH IN BIOTECHNOLOGY” USAMV Bucharest, Romania, 2011THE EFFECTS OF THE COMPONENTS SPECIFIC MIGRATION FORTHE FOOD STUFF CONSERVATION IN METALLIC CANSBUCULEI AMELIA 1 , REBENCIUC IOANA 1 , GHEORGHE CAMPEANU 2 , VALENTINI. IONESCU³, MARIANA I. IONESCU³, GABRIELA CONSTANTINESCU(POP) 1 ,ADRIANA DABIJA 11 USV Stefan cel Mare, Str.Universitatii nr.13, Suceava,Romania2 University of Agronomical Sciences and Veter<strong>in</strong>ary Medic<strong>in</strong>e Bucharest, 011464, Bucharest, Romania3 Institutul <strong>de</strong> Bioresurse Alimentare,str. D<strong>in</strong>u V<strong>in</strong>tila, nr.6,sector 2, Bucuresti, Romania* Correspond<strong>in</strong>g author: ameliab@usv.roAbstract. Be<strong>in</strong>g known the effects of the components migration from the package <strong>in</strong> the food productit is necessary to be <strong>de</strong>term<strong>in</strong>ed the <strong>de</strong>gree of stability of the protection lacquers that are found <strong>in</strong> thestructure of food metallic packag<strong>in</strong>gs.The goals of the paper were:- the <strong>de</strong>tection and quantification of certa<strong>in</strong> migrants with toxic potential from certa<strong>in</strong> <strong>in</strong>nersi<strong>de</strong> protection lacquers of the food metallic cans;- the analysis of the temporal stability of the lacquer layer <strong>in</strong> the case of the metallic cans forcerta<strong>in</strong> food products.The approach<strong>in</strong>g methods comprised not only the analysis of the package but also that of the productpreserved. The specific components migration (bisphenol A) <strong>in</strong> food simulants was analyzed <strong>in</strong> twoways: the UV-VIS method and the GC-MS method and the analysis of the package heavy metalmigration as well as the migration of the heavy metals from the product by the atomic absorptionspectroscopy (AAS).From the analysis of the <strong>in</strong>ner si<strong>de</strong> of the can and the organoleptic and physico-chemical analysis ofthe product „Fois gras” the yellow lacquer type we observed that the phenomena is moreaccentuated than <strong>in</strong> the case of the product „Pork meat <strong>in</strong> natural juice”. This th<strong>in</strong>g wasn’t seen <strong>in</strong>the cases with white lacquer.Keywords: metallic cans, t<strong>in</strong> layer, white lacquer, yellow lacquer, AAS, GC-MS, UV-VIS1. INTRODUCTIONThe anticorrosive protection materials used <strong>in</strong> the food doma<strong>in</strong> ensure the safety ofthe metal surfaces <strong>in</strong> front of the atmospheric corrosion, the protection from the reactionwith the food product conta<strong>in</strong>ed and the protection of the food conta<strong>in</strong>ed. The protection ofthe food stuff conta<strong>in</strong>ed from metal contam<strong>in</strong>ation contributes at the reduction of the costsalong the time and at the protection of the environment. [6,7]The safety of the packag<strong>in</strong>g materials is based on the fact that dur<strong>in</strong>g the food stuffcontact the unsure chemical substances don’t migrate from the material to the food stuff.From all the material types the epoxyphenolic lacquers are the most important be<strong>in</strong>guniversally used for body cans as well as for seal<strong>in</strong>gs, for two or three pieces metallic cansas well as for pressed cans. [1]The epoxyphenolic lacquers based on bisphenol A (BPA) are often called GOLDphenolic lacquers due to their yellow-glodish specific colour and are used for most of theapplications that <strong>in</strong>clu<strong>de</strong> extremely corrosive food stuff. [2]166
Proceed<strong>in</strong>g of the 4 rd International Symposium“NEW RESEARCH IN BIOTECHNOLOGY” USAMV Bucharest, Romania, 2011The establish<strong>in</strong>g of the sterilization methods as well as their correct application arevery important for the slightest mistakes regard<strong>in</strong>g the sterilization formula (not respect<strong>in</strong>gthe time, temperature and pressure conditions) can have severe consequences upon thepreservation and the quality of the product. At high temperature (sterilization) the res<strong>in</strong>sthat compose the protection lacquers can <strong>de</strong>compose and result <strong>in</strong> components with hightoxic potential (bisphenol) and can migrate from the package to the food stuff. [3,4]The traditional method for fabricat<strong>in</strong>g food cans <strong>in</strong> the food can <strong>in</strong>dustry implies theus<strong>in</strong>g of t<strong>in</strong> covered with protection lacquers. This trend is <strong>in</strong> a cont<strong>in</strong>uous change due tothe us<strong>in</strong>g reglementations (european and national) regard<strong>in</strong>g the dangerous endocr<strong>in</strong>eeffects of the bisphenol found <strong>in</strong> the protection lacquers (Moller şi alţii, 2004). The framereglemenation 1935/2004/CE, as well as the new CE directives regard<strong>in</strong>g the materials thatcome <strong>in</strong> contact with the food stuff impose migration limits for the specific components.On national level we can mention HG nr. 1197/2002 for the approv<strong>in</strong>g of the Regulationsregard<strong>in</strong>g the materials and objects that come <strong>in</strong> contact with the food stuff and theadditional th<strong>in</strong>gs regard<strong>in</strong>g the us<strong>in</strong>g of the epoxy <strong>de</strong>rivates <strong>in</strong> materials and objects thatcome <strong>in</strong> contact with the food stuff. [5] Be<strong>in</strong>g known the effects of the componentsmigration from the package <strong>in</strong> the food stuff it’s necessary to <strong>de</strong>term<strong>in</strong>e the <strong>de</strong>gree ofstability of the materials by global migration and specific migration testes for thecomponents.2. MATERIALS AND METHODSWe studied <strong>in</strong> practical conditions the package and content of the can <strong>in</strong> the case oftwo different food stuff <strong>in</strong> cans fabricated with different t<strong>in</strong>s and lacquers all for to comparethe protection abilities of several lacquer systems and for extend<strong>in</strong>g the shelf life.We used for the experiments the follow<strong>in</strong>g types of t<strong>in</strong> lacquered cans: wel<strong>de</strong>d cans(3 pieces) Ø 99x48; pressed cans (2 pieces) Ø 73x30. For seal<strong>in</strong>g these cans we used : Ø99DV caps and Ø 73DV caps all lacquered <strong>in</strong> the correspond<strong>in</strong>g lacquer<strong>in</strong>g systems.We used the follow<strong>in</strong>g lacquers: WHITE PL- <strong>in</strong>ner protection white lacquer ofepoxyphenolic type; HE GOLD – <strong>in</strong>ner protection yellow lacquer epoxyphenolic type andPL GOLD – <strong>in</strong>ner protection yellow lacquer of modified epoxyphenolic type.The lab analysis of the lacquers observed:- the global migration of the components <strong>in</strong> the food simulants A, B and D and theorganoleptic exam of the samples and liquids after extraction:- the specific components migration <strong>in</strong> the simulant A : the bisphenol A content(BPA) by two methods: UV-VIS spectrometry and gas chromatography coupled with massspectroscopy GC-MS;-the heavy metals migration from the package <strong>in</strong> the simulant B by atomicabsorption spectroscopy (AAS) with graphite oven.The check<strong>in</strong>g of the quality of the cans was led on a relevant lot taken from a meatproducts manufacturer production (pork meat <strong>in</strong> natural juice and fois gras).The fill<strong>in</strong>g and sterilization of the cans was led accord<strong>in</strong>g to the specificity of theproduct. The can taken from the manufacturer accord<strong>in</strong>g to STAS 3730-92 were stored <strong>in</strong>the conditions specified for the product. The canned products were regularly analyzed from167
Proceed<strong>in</strong>g of the 4 rd International Symposium“NEW RESEARCH IN BIOTECHNOLOGY” USAMV Bucharest, Romania, 2011the organoleptic, physico-chemical and microbiological po<strong>in</strong>t of view dur<strong>in</strong>g the entirestorage period.Table 1. The lacquer systems and products analyzedCans dimensions Ø 99x48 wel<strong>de</strong>d cans (3 pieces) Ø 73x30 pressed cans (2 pieces)(mm)ProductLacquer systemPork meat <strong>in</strong> natural juice Fois grasInner si<strong>de</strong>:WHITE PL lacquerInner and outer si<strong>de</strong> :WHITE PL lacquerInner si<strong>de</strong>: HE GOLD lacquerOuter si<strong>de</strong>:PL GOLD lacquerOuter si<strong>de</strong>:PL GOLD lacquerInner si<strong>de</strong>: HE GOLD lacquerOuter si<strong>de</strong>:PL GOLD lacquerThe characteristics of the lacquer layer:The analysis of the <strong>in</strong>ner lacquer layer of a representative group of opened cans wasdone piece by piece and compared with the products standard conditions. The layer’sporosity was <strong>de</strong>term<strong>in</strong>ed with the porosymeter for both the empty and the filled an<strong>de</strong>mptied (after a while) cans and the after a certa<strong>in</strong> time of storage. The <strong>in</strong>itial lacquer layercharacteristics and the porosity dur<strong>in</strong>g the storage time are presented <strong>in</strong> table no. 3 and 4.The organoleptic, physico-chemical and microbiological analysis of the two types offood products (pork meat and fois gras) canned <strong>in</strong> the metallic cans was periodically ledafter 12 months of storage.3. RESULTS AND DISCUSSIONSThe results of the lab analysis of the used protection lacquers are presented <strong>in</strong> table2.From the analysis of the results presented <strong>in</strong> table 2 we can conclu<strong>de</strong> the follow<strong>in</strong>gs:- there were neither organoleptic modifications regard<strong>in</strong>g the appearance and smellof the tubes nor of the extraction liquids;- the values obta<strong>in</strong>ed for the components global migration <strong>in</strong> all extractionenvironments were below the admitted value of 60 ppm;The results of the global migration tests and of the organoleptic exam<strong>in</strong>ation were <strong>in</strong>accordance with HG nr. 1197/2002, that conta<strong>in</strong>s specific directives such as 72/2002/CEand amendments .- the heavy metals releases were below the admitted values : the Pb was below 0,02ppm, and the Cd was below the <strong>de</strong>tection limit of the <strong>de</strong>vice 0,12 ppb (the values were <strong>in</strong>accordance with the limits imposed <strong>in</strong> the Or<strong>de</strong>r no. 975/1998- repealed <strong>in</strong> the presenttime).- the specific migration of bisphenol A (BPA) by the 2 methods UV-VISspectrometry and gas chromatography coupled with mass spectroscopy GC- MS <strong>in</strong>dicatedasit was expected- substantial differences between the obta<strong>in</strong>ed values of the sameanalyzed water extract.168
Proceed<strong>in</strong>g of the 4 rd International Symposium“NEW RESEARCH IN BIOTECHNOLOGY” USAMV Bucharest, Romania, 2011Table 2. The lab analysis of the cans protection lacquersLacquerSimulantExtractionconditions/ExtractionratioA: distilledwater1h, 121 o C/1:1GOLD B: 3 % acetic 1h, 121 o C/HE acid solution 1:1D: isooctane24h, 40 o C/1:1A: distilled 1h, 121 o C/water 1:1ALB PL B: 3 % acetic 1h, 121 o C/acid solution 1:1D: isooctane24h, 40 o C/1:1A: distilled 1h, 121 o C/water 1:1GOLD B: 3 % acetic 1h, 121 o C/PL acid solution 1:1D: iso-octane 24h, 40o C/1:1OrganolepticmodificationsSample/ExtractUnmodified /UnmodifiedUnmodified /UnmodifiedUnmodified /UnmodifiedUnmodified /UnmodifiedUnmodified /UnmodifiedUnmodified /UnmodifiedUnmodified /UnmodifiedUnmodified /UnmodifiedUnmodified /UnmodifiedGlobalmigration,ppmMetals release,ppmPhenolic <strong>de</strong>rivates,(Bisphenol A),ppmPb Cd UV-VIS GC-MS7,75 - - 1,6 BPA: 0,609,75 0,012
Proceed<strong>in</strong>g of the 4 rd International Symposium“NEW RESEARCH IN BIOTECHNOLOGY” USAMV Bucharest, Romania, 2011Table 3. The <strong>in</strong>itial characteristics of the lacquer layer – meat products cansProduct/ Inner lacquerCharacteristics Pork meat/ White Pork meat/ yellow Fois gras/Whitelacquer lacquer lacquerLayer resistance atsterilization <strong>in</strong>:- solution B, C, D, EappropriateFois gras/ YellowlacquerappropriateGr/m 2 (dry lacquer) 8,2 – 8,36 10,76 – 12, 04 7,24 – 7,40 10,76 – 12, 04Layer adherence:- before sterilization- after sterilizationgoodgoodgoodgood302520151050Pork meat/ White lacquerPork meat/ Yellow lacquerInitiallyAfetr 1 year of shelfstorage170Fig.1. The check<strong>in</strong>g of the porosity of the lacquer layer after the empt<strong>in</strong>g of the cansAfter 12 months and 24 months of storage the organoleptic properties and most ofthe physico-chemical properties of the product „Pork meat <strong>in</strong> natural juice” didn’tsignificantly changed <strong>in</strong> comparison with the <strong>in</strong>itial moment for neither of the two lacquertypes the exception be<strong>in</strong>g ma<strong>de</strong> by the easily hydrolysable nitrogen. Dur<strong>in</strong>g the storageafter the 12 months and 24 months we observed slight <strong>in</strong>creases of the easily hydrolysablenitrogen content <strong>in</strong> comparison with the <strong>in</strong>itial moment for both lacquer types. These weredue to the slightly <strong>de</strong>gradation of the product dur<strong>in</strong>g the storage and not to the lacquer layeritself. The metal content (Fe, Sn) of the product canned <strong>in</strong> metallic cans protected by whitelacquer and yellow lacquers layers didn’t significantly vary dur<strong>in</strong>g the 12 months and 24months of storage the product be<strong>in</strong>g <strong>in</strong> accordance with the requirements of STR 610-85”Meat cans; fois gras and meat paste”.After 12 and 24 months of storage the organoleptic properties and most of thephysico-chemical properties of the product „Fois gras” didn’t significantly changed <strong>in</strong>comparison with the <strong>in</strong>itial moment for neither of the two lacquer types the exception be<strong>in</strong>gma<strong>de</strong> by the easily hydrolysable nitrogen.Dur<strong>in</strong>g the storage after the 12 and 24 months we observed slight <strong>in</strong>creases of theeasily hydrolysable nitrogen content <strong>in</strong> comparison with the <strong>in</strong>itial moment for the white
Proceed<strong>in</strong>g of the 4 rd International Symposium“NEW RESEARCH IN BIOTECHNOLOGY” USAMV Bucharest, Romania, 2011lacquer type. This was due to the slightly <strong>de</strong>gradation of the product dur<strong>in</strong>g the storage andnot to the lacquer layer itself.Table 4. The organoleptic analysis of the product «Pork meat <strong>in</strong> natural juice » (white lacquer)ResultsAfter 1 year After 2 yearCharacteristicsInitially of shelf of shelfstorage storageCan’sappearance:- outer si<strong>de</strong>- <strong>in</strong>ner si<strong>de</strong>Content’sappearance:- at 10 0 CClean, hermetically sealed, with flat cap,unrusted, non <strong>de</strong>formed at the body orend<strong>in</strong>gs, without cracks or contentleakageThe cap and metallic can don’t haveblack or rust spots, or exfoliations andwav<strong>in</strong>g of the lacquer layerThe compact mass is formed by piecesof meat <strong>in</strong> jellified juice hav<strong>in</strong>g at thesurface a layer of fat.- at 40 0 C The meat pieces are obta<strong>in</strong>ed bychopp<strong>in</strong>g at the m<strong>in</strong>er <strong>de</strong>vice with 20mm holes, opalescent juice.Meat’s colourFat’s colourJuice’s colourSmell and tasteMeat’sconsistencySpecific for the boiled meatWhiteyellowishYellowishYellow almost light brownPleasant, specific for the boiled meatand spices, without strange smell ortasteNormal for the boiled meatInitially2 year1 year2 yearThe results of the microbiological analysisAfter the microbiological analysis of the meat cans <strong>in</strong> natural juice and of the foisgras cans we conclu<strong>de</strong>d the follow<strong>in</strong>gs:- the <strong>in</strong>cubation of the cans by thermostat didn’t lead to the appearance of cans thatpresented biological <strong>de</strong>formations or/ and leakages.- after the cultivation <strong>in</strong> a<strong>de</strong>quate environment of microorganisms we didn’tregistered modifications of the environment (environment alter<strong>in</strong>g, <strong>de</strong>posits or layersformation);- the cans presented a good stability <strong>in</strong> time/ shelf life.171
Proceed<strong>in</strong>g of the 4 rd International Symposium“NEW RESEARCH IN BIOTECHNOLOGY” USAMV Bucharest, Romania, 2011Table 5. The organoleptic analysis of the product «Pork meat <strong>in</strong> natural juice » (yellow lacquer)ResultsAfter 2After 1 yearCharacteristicsyear ofInitially of shelfshelfstoragestorageCan’sappearance:- outer si<strong>de</strong>- <strong>in</strong>ner si<strong>de</strong>Content’sappearance:- at 10 0 CClean, hermetically sealed, withflat cap, unrusted, non <strong>de</strong>formedat the body or end<strong>in</strong>gs, withoutcracks or content leakageThe capandmetalliccan don’thaveblack orrust spots,orexfoliations andwav<strong>in</strong>g ofthelacquerlayerTraces of marbl<strong>in</strong>g onthe can’s wallThe compact mass is formed bypieces of meat <strong>in</strong> jellified juicehav<strong>in</strong>g at the surface a layer offat.- at 40 0 C The meat pieces are obta<strong>in</strong>ed bychopp<strong>in</strong>g at the m<strong>in</strong>er <strong>de</strong>vice with20 mm holes, opalescent juice.Meat’s colour Specific for the boiled meatFat’s colour White-yellowish WhiteyellowishJuice’s colourSmell and tasteMeat’sconsistencyYellow almost light brownPleasant, specific for the boiledmeat and spices, without strangesmell or tasteNormal for the boiled meatInitially2 year2 year1 year172
Proceed<strong>in</strong>g of the 4 rd International Symposium“NEW RESEARCH IN BIOTECHNOLOGY” USAMV Bucharest, Romania, 2011Table 6. The physico-chemical analysis of the product “Pork meat <strong>in</strong> natural juice”CharacteristicsAfter 1 year of shelf After 2 years of shelfInitiallystoragestorageWhite Yellow White Yellow WhiteYellow lacquerlacquer lacquer lacquer lacquer lacquerMeat and fat, % 75,2 76,7 78,9 77,8 79,3 78.1Fat , % 15,5 15,5 13,1 11,9 15,84 14,42Sodium chlori<strong>de</strong>,%2,1 2,1 2,0 2,0 1,93 2,1Easilyhydrolysablenitrogen,expressed <strong>in</strong>36,0 36,0 44,0 42,3 42,84 40,8ammonia mg/100gProte<strong>in</strong>s, % 20,20 20,20 20,79 19,81 20,5 20,24pH 6,5 6,5 6,0 6,0 6,0 6,0Metals , ppm:- iron 11,20 11,20 12,76 11,80 14,42 14,11- t<strong>in</strong> ≤0,20 ≤0,20 0,83 2,65 0,88 2,66Table 7. The organoleptic analysis of the product “Fois gras” (white lacquer)ResultsAfter 1 year After 2 yearCharacteristicsInitially of shelf of shelfstorage storageCan’s appearance:- outer si<strong>de</strong>- <strong>in</strong>ner si<strong>de</strong>Content’sappearance:- at 10 0 CColourSmell and tasteClean, hermetically sealed, with flat cap,unrusted, non <strong>de</strong>formed at the body orend<strong>in</strong>gs, without cracks or content leakageThe cap and metallic can don’t have black orrust spots, or exfoliations and wav<strong>in</strong>g of thelacquer layerUnctuous homogene paste that presents a th<strong>in</strong>liquid layerP<strong>in</strong>k-yellowishPleasant, characteristic with the flavour of thespices ad<strong>de</strong>d without strange smell or taste173
Proceed<strong>in</strong>g of the 4 rd International Symposium“NEW RESEARCH IN BIOTECHNOLOGY” USAMV Bucharest, Romania, 2011Table 8. The organoleptic analysis of the product “Fois gras” (yellow lacquer)ResultsAfter 1 year After 2 yearCharacteristicsInitially of shelf of shelfstorage storageCan’s appearance:- outer si<strong>de</strong>Clean, hermetically sealed, with flat cap,unrusted, non <strong>de</strong>formed at the body orend<strong>in</strong>gs, without cracks or content leakage- <strong>in</strong>ner si<strong>de</strong>Content’sappearance:- at 10 0 CColourSmell and tasteThe cap andmetallic candon’t haveblack or rustspots, orexfoliationsand wav<strong>in</strong>gof the lacquerlayerTraces of marbl<strong>in</strong>g on thecan’s wallUnctuous homogene paste that presents a th<strong>in</strong>liquid layerP<strong>in</strong>k-yellowishPleasant, characteristic with the flavour of thespices ad<strong>de</strong>d without strange smell or tasteTable 9. The physico-chemical analysis of the product “Fois gras”CharacteristicsAfter 1 year of shelf After 1 year of shelfInitiallystoragestorageWhite YellowWhite lacquer Yellow White Yellowlacquer lacquerlacquer lacquer lacquerFat , % 21,7 21,7 22,0 20,0 21,33 21,15Sodium chlori<strong>de</strong>, % 1,7 1,7 1,7 1,7 1,81 1,75Easily hydrolysablenitrogen, expressed <strong>in</strong> 18,0 18,0 23,1 14,3 21,81 14,1ammonia mg/100 gProte<strong>in</strong>s, % 13,80 13,80 12,87 13,14 13,62 13,4pH 6,0 6,0 5,5 5,5 5,5 5,5Metals , ppm:- t<strong>in</strong> - - - - 5,30 5,30174CONCLUSIONSThe results of our studies were the follow<strong>in</strong>g:- the results of the lab exam<strong>in</strong>ation respectively of the global migration tests and theorganoleptic exam are <strong>in</strong> accordance with HG nr. 1197/2002, that conta<strong>in</strong>s specificdirectives such as 72/2002/CE and amendments.
Proceed<strong>in</strong>g of the 4 rd International Symposium“NEW RESEARCH IN BIOTECHNOLOGY” USAMV Bucharest, Romania, 2011- for evaluat<strong>in</strong>g the BPA (bisphenol A ) release as a request of the 2002/72/CEdirective we consi<strong>de</strong>red as more appropriate the GC-MS method that allows the accuratei<strong>de</strong>ntification and dosage of bisphenol A (BPA) <strong>in</strong> comparison with the UV-VISspectrophotometric method .- the check<strong>in</strong>g of the cans quality was led on a lot taken from a meat productsmanufacturer (pork meat <strong>in</strong> natural juice and fois gras).- after 12 and 24 months of storage the organoleptic properties and most of thephysico-chemical properties of the products („Pork meat <strong>in</strong> natural juice” and “Fois gras”)didn’t significantly changed <strong>in</strong> comparison with the <strong>in</strong>itial moment for neither of the twolacquer types.- from analyz<strong>in</strong>g the <strong>in</strong>ner appearance of the can we saw that at 12 and 24 months itpresented all over it traces of marbl<strong>in</strong>g <strong>in</strong> the case of the product „Fois gras”- yellow layertype the phenomena be<strong>in</strong>g more accentuated than <strong>in</strong> the case of the other product.- the metal content (Fe, Sn) of the product canned <strong>in</strong> metallic cans protected by whitelacquer and yellow lacquers layers didn’t significantly vary dur<strong>in</strong>g the 12 and 24 months ofstorage the product be<strong>in</strong>g <strong>in</strong> accordance with the requirements of STR 610-85 ”Meat cans;fois gras and meat paste”.- all the analyzed quality <strong>in</strong>dicators are <strong>in</strong> accordance with the standard of theproduct.- after the microbiological analysis of the meat cans we conclu<strong>de</strong>d that the cans havea very good shelf life/ time stability.REFERENCES1. Jordanova, I., Dobias, J., Voldrich, M., Poustka, J., 2003 : Determ<strong>in</strong>ation of Bisphenol A,Bisphenol F, Bisphenol A Diglycidyl Ether and Bisphenol F, Bisphenol F Diglycidyl EtherMigrated from Food Cans us<strong>in</strong>g Gas Chromatography-Mass Spectrometry, Czech J.Food Sci.,21 , p.85-90;2. Moller, L., Helweg, C., Pratt, C., Worup, A., Skak, C., (2004) Evaluation of Alternatives forCompounds un<strong>de</strong>r Risk Assessment <strong>in</strong> the EU, Bisphenol A, Report Environmental ProjectNo. 9013. Popa, C., Turtoi, M., Turtoi, Ghe., 1998, Materiale utilizate în <strong>in</strong>dustria alimentară, Ambalaje,Manualul Ing<strong>in</strong>erului <strong>de</strong> Industrie Alimentară, Ed. Tehnică, Bucureşti.4. Popa, M., Belc, N., 2003, Ambalare, Raport S<strong>in</strong>tetic Fair-Flow;5. Turtoi, M., 2001, Materiale <strong>de</strong> ambalaj şi ambalaje pentru produsele alimentare, Ed. ALMA –Galaţi;6. ***,(2002) Ensur<strong>in</strong>g the safety of consumers can coat<strong>in</strong>gs for direct food contact, section 4 off<strong>in</strong>al report, part 1, CANCO Workshop;7. ***, Articol Sayers Publish<strong>in</strong>g Group Ltd., (2004) The Canmaker on l<strong>in</strong>e.175
Proceed<strong>in</strong>g of the 4 rd International Symposium“NEW RESEARCH IN BIOTECHNOLOGY” USAMV Bucharest, Romania, 2011ANALYSIS AND QUANTIFICATION OF TRANS-RESVERATROL INWINE FROM MUNTENIA AND OLTENIA REGION, ROMANIAELISABETA-IRINA GEANA, ANDREEA-MARIA IORDACHE, ROXANA-ELENAIONETENational R&D Institute of Cryogenics and Isotopic Technologies – ICSI Rm. Valcea, 4 Uz<strong>in</strong>ei St., Rm. Valcea,RomaniaAbstract. Known for its several beneficial effects on human health (antioxidant, antibacterial,cardioprotective, antitumor, estrogenic, antiplatelet, anti-<strong>in</strong>flammatory, etc), the first supplementknown to activate a longevity gene, resveratrol, is one of the major active compounds of stilbenes. Itis a phytoalex<strong>in</strong> found <strong>in</strong> grapes, grape products, w<strong>in</strong>e, peanuts, cranberries, strawberry, and someother botanical sources, <strong>in</strong> variable amounts, both as free and as piceid.The aim of this work is the <strong>de</strong>velopment of a high performance liquid chromatographic (HPLC)method for the <strong>de</strong>term<strong>in</strong>ation of trans-resveratrol <strong>in</strong> w<strong>in</strong>es from Muntenia and Oltenia region<strong>de</strong>limited appellation (Romania). The method permits direct <strong>in</strong>jection of the sample followed by PDA<strong>de</strong>tection, reveal<strong>in</strong>g to be time-sav<strong>in</strong>g and overcom<strong>in</strong>g the need of sample pretreatment steps.Detection limit was 0.008 mg/L. Global uncerta<strong>in</strong>ty associated with the results, accord<strong>in</strong>g toEURACHEM/CITAC rules was 23.5%.Resveratrol content was <strong>de</strong>term<strong>in</strong>ed for 24 Romanian AO (appellation of orig<strong>in</strong>) w<strong>in</strong>es; theconcentration found rang<strong>in</strong>g between 0.132 and 6.589 mg/L. The w<strong>in</strong>es from Muntenia region havegrater content of trans-resveratrol than w<strong>in</strong>es from Oltenia region. The levels of trans-resveratrolwere clearly higher <strong>in</strong> the red w<strong>in</strong>es compared to the white w<strong>in</strong>es (never exceed<strong>in</strong>g 0.159 mg/L).Keywords: trans-resveratrol, w<strong>in</strong>es, HPLC1. INTRODUCTIONResveratrol (3,5,4’-trihydroxystilbene) (Fig. 1) is a phytoalex<strong>in</strong> of a phenolicnature, belong<strong>in</strong>g to the stilbene family. Naturally it exists <strong>in</strong> two isomeric forms (cis andtrans) and as piceid, the 3 β-glucosi<strong>de</strong> of resveratrol. It occurs <strong>in</strong> grapes, grape products andsome other botanical sources (peanuts, soy, tea), <strong>in</strong> variable amounts, both as free and aspiceid [1].Figure 1. Structure of trans-resveratrol176
Proceed<strong>in</strong>g of the 4 rd International Symposium“NEW RESEARCH IN BIOTECHNOLOGY” USAMV Bucharest, Romania, 2011The presence of trans-resveratrol <strong>in</strong> w<strong>in</strong>e is an important qualitative parameter dueits several beneficial effects on human health: has anti-oxidant and anti-<strong>in</strong>flammatoryactivity, is <strong>in</strong> relation with anti-<strong>in</strong>itiation, anti-promotion and anti-progression activities <strong>in</strong>malignant tumors and is recognized as a chemotherapeutic agent <strong>in</strong> humans [2].Trans-resveratrol plays also an important role <strong>in</strong> the organoleptic characteristics ofw<strong>in</strong>e, conferr<strong>in</strong>g astr<strong>in</strong>gency and structure to the beverage by formation of complexes withthe prote<strong>in</strong>s of saliva [3].W<strong>in</strong>e, particularly red w<strong>in</strong>e, is the ma<strong>in</strong> source of <strong>in</strong>troduction of trans-resveratrol<strong>in</strong> the human diet. In grape berries, resveratrol synthesis is primarly located at the sk<strong>in</strong> cellsand it is absent or low, <strong>in</strong> the fruit flesh [4].Red w<strong>in</strong>e generally conta<strong>in</strong>s higer amounts of trans-resveratrol than white w<strong>in</strong>e.This is presumably due to the longer extraction time dur<strong>in</strong>g contact between grape sk<strong>in</strong> andjuice <strong>in</strong> the production of red w<strong>in</strong>e [5]. The variety of grapes also plays an important role <strong>in</strong>resveratrol synthesis which may be genetically controlled. Resveratrol concentration<strong>in</strong>creased dur<strong>in</strong>g fermentation of the sk<strong>in</strong>s but the amount extracted was <strong>de</strong>pen<strong>de</strong>d on thevariety and enological conditions [6].Traditional methods to <strong>de</strong>term<strong>in</strong>e polyphenols <strong>in</strong> natural extracts are usuallyperformed by high performance liquid chromatography analysis (HPLC) andspectrophotometric measurements [7]. Methods based on gas chromatography and gaschromatography-mass spectrometry (GC-MS) have been proposed for trans-resveratrol.However, <strong>de</strong>rivatization is required prior to GC analysis of this analyte to enhancevolatility; this time consum<strong>in</strong>g procedure may result <strong>in</strong> some trans to cis isomerization ofresveratrol. The <strong>de</strong>velopment of LC-MS techniques are nowadays the best analyticalapproach for the analysis of this k<strong>in</strong>d of compounds <strong>in</strong> grape extract and w<strong>in</strong>e, although thishyphenated techniques is very expensive and consequently not wi<strong>de</strong>ly used <strong>in</strong> rout<strong>in</strong>elaboratories of w<strong>in</strong>e <strong>in</strong>dustry [8].This work presents a reversed phase RP-HPLC method for the <strong>de</strong>term<strong>in</strong>ation oftrans-resveratrol <strong>in</strong> w<strong>in</strong>e samples. Analyses were carried out by direct HPLC <strong>in</strong>jection ofthe sample <strong>in</strong> solvent elution. A group of 24 w<strong>in</strong>es from Muntenia and Oltenia Romanianregions, different cultivars and v<strong>in</strong>tage year was analysed by HPLC-PDA, <strong>in</strong> or<strong>de</strong>r to assessthe <strong>in</strong>fluence of these parameters on the trans-resveratrol concentration.2. MATERIALS AND METHODSReagents and chemicals - The trans-resveratrol standard (99% GC) was purchasedfrom Sigma-Aldrich. Methanol, acetonitrile and glacial acetic acid (100% p.a.) were HPLCgra<strong>de</strong> and obta<strong>in</strong>ed from Merck. Twice distilled and <strong>de</strong>m<strong>in</strong>eralised water produced by TKAsystems was used for preparation of the aqueous solutions.Standard solutions - A stock solution of 20 mg/L of trans-resveratrol prepared <strong>in</strong> a12% alcoholic (aqueous) solution. The solid standard was <strong>in</strong>itially dissolved <strong>in</strong> a m<strong>in</strong>imumvolume of ethanol, before the addition of water, <strong>in</strong> or<strong>de</strong>r to guarantee a completedissolution. Immediately prior to analysis, a set of standards with 0.25, 0.5, 1, 1.5, 2, 3, 5and 10 mg/L were prepared from the stock solution, diluted <strong>in</strong> a 12% alcoholic (aqueous)solution. Special care was taken <strong>in</strong> relation to the <strong>de</strong>gradation of the standard solutions,keep<strong>in</strong>g them protected from air and light exposure.177
Proceed<strong>in</strong>g of the 4 rd International Symposium“NEW RESEARCH IN BIOTECHNOLOGY” USAMV Bucharest, Romania, 2011Sample handl<strong>in</strong>g - In this study 24 w<strong>in</strong>e samples (10 white and 14 red) fromMuntenia and Oltenia region were analyzed. The analyzed red w<strong>in</strong>e varieties were FeteascaNeagra, Cabernet Sauvignon, Merlot, P<strong>in</strong>ot Noire and those of white w<strong>in</strong>es varieties wereFeteasca Regala, Tamaioasa Romaneasca, Sauvignon Blanc, Feteasca Alba, Riesl<strong>in</strong>g Italianand Muscat Ottonel. All samples were filtered through 0.45 µm filters prior to analysis andkept protected from light at 4 °CHPLC analysisThe chromatographic analysis was carried out with a Thermo F<strong>in</strong>nigan SurveyorPlus chromatograph equipped with a photodio<strong>de</strong> array <strong>de</strong>tector at 310 nm, Surveyorautosampler, Surveyor LC Pump (Quaternary gradient). Data analysis was done us<strong>in</strong>g theChrome Quest Chromatography Workstation.The analytical column aquasil C18, 250×4.6mm with the sorbent particle size of 5 µm. The mobile phase mixed ofwater:acetonitrile:acetic acid = 70:29.9:0.1 has flown through the system at a rate of 1ml/m<strong>in</strong>. Samples of 20 µl volume were <strong>in</strong>jected <strong>in</strong>to the analytical column. All analyseswere carried out at ambient temperature. Quantification was based on the peak area, us<strong>in</strong>gthe external standard method.3. RESULTS AND DISCUSSIONSValidation studiesCalibration curve was performed by analysis <strong>in</strong> duplicate of eight standards oftrans-resveratrol cover<strong>in</strong>g the range 0.25-10 mg/L. The constructed calibration curveshoved excellent l<strong>in</strong>earity (correlation coefficient: 0.9991) (fig. 2).500000040000003000000Area2000000100000017800 1 2 3 4 5 6 7 8 9 10 11concentration (mg/L)Figure 2. Calibration curve for trans-resveratrolThe l<strong>in</strong>earity of the <strong>de</strong>tector response for the prepared standards was assessed bymeans of a l<strong>in</strong>ear regression analysis regard<strong>in</strong>g the amounts of each standard <strong>in</strong>troduced <strong>in</strong>the loop of the chromatographic system and the area of the correspond<strong>in</strong>g peak on thechromatogram.Detection and quantification limits were calculated by measur<strong>in</strong>g the response ofanalytical background by runn<strong>in</strong>g six blanks (12% alcoholic solution), us<strong>in</strong>g the maximumsensitivity allowed by the system and calculat<strong>in</strong>g the standard <strong>de</strong>viation of this response
Proceed<strong>in</strong>g of the 4 rd International Symposium“NEW RESEARCH IN BIOTECHNOLOGY” USAMV Bucharest, Romania, 2011(STD). The <strong>de</strong>tection limit, DL was estimated by multiply<strong>in</strong>g the STD by a factor of 3, andthe quantification limit, QL was <strong>de</strong>f<strong>in</strong>ed as 10 times the STD. The values obta<strong>in</strong>ed were0.008 mg/L for DL and 0.026 mg/L for QL.The precision or the <strong>de</strong>gree of reproducibility is expressed as the coefficient ofvariation (CV). Precision was <strong>de</strong>term<strong>in</strong>ed by perform<strong>in</strong>g six replicate analyses of the samesample on six different days. The value obta<strong>in</strong>ed for precision was 9.8 % for direct <strong>in</strong>jectionof the sample <strong>in</strong> chromatographic system.The uncerta<strong>in</strong>ty was estimate accord<strong>in</strong>g EURACHEM/CITAC. This estimationaccounts for the most significant sources of uncerta<strong>in</strong>ty that are thought to <strong>in</strong>terfere <strong>in</strong> thef<strong>in</strong>al result. In this work, the contributions to uncerta<strong>in</strong>ty were ascribed to: the uncerta<strong>in</strong>ty<strong>in</strong> the preparation of standards, the uncerta<strong>in</strong>ty of the calibration curve and the uncerta<strong>in</strong>ty<strong>in</strong> the precision of the method. The global uncerta<strong>in</strong>ty was estimated at 23.5 % forconcentration above 0.25 mg/L.Quantification of trans-resveratrol <strong>in</strong> Romanian w<strong>in</strong>eThe <strong>de</strong>term<strong>in</strong>ation of the trans-resveratrol alone proved to be accurate us<strong>in</strong>g asimple procedure, without sample pre-treatment other than filtration, allow<strong>in</strong>g for a lessthan 15 m<strong>in</strong>ute analysis run time.However, the chromatograms of the standards are free from <strong>in</strong>terferences, with thepeak of trans-resveratrol clearly separated (Fig. 3a). Regard<strong>in</strong>g the w<strong>in</strong>e samples it isnoticeable that <strong>in</strong> the red w<strong>in</strong>e (Fig. 3b) the <strong>in</strong>terferences are more significant than <strong>in</strong> whitew<strong>in</strong>es (Fig. 3c), <strong>in</strong> spite of the lower amounts found <strong>in</strong> the latter samples.In the work of Ratola et all [9], Portuguese red w<strong>in</strong>e from different regions hadtrans-resveratrol content from 0.55 to 1.24 mg/L and white w<strong>in</strong>es had values rang<strong>in</strong>g fromnot <strong>de</strong>tected to 0.19 mg/L. Other studies report trans-resveratrol content rang<strong>in</strong>g from 0.508to 2.534 mg/L for greek w<strong>in</strong>es [10] and values ranged from 0.25 to 8.87 mg/L for Italianw<strong>in</strong>es [11].The amount of trans-resveratrol <strong>in</strong> the different analyzed w<strong>in</strong>es variedconsi<strong>de</strong>rably <strong>de</strong>pend<strong>in</strong>g on the grape variety, environmental factors <strong>in</strong> the v<strong>in</strong>eyard andw<strong>in</strong>e-process<strong>in</strong>g techniques. In our study, the occurrence of trans-resveratrol was confirmed<strong>in</strong> all of the analyzed 14 red w<strong>in</strong>e samples, with concentration rang<strong>in</strong>g between 0.025 and6.598 mg/L (Table 1). For the white w<strong>in</strong>e, 5 of the 10 tested revealed the presence of thecompound at concentration between 0.132- 0.159 mg/L (Table 2).It is known that trans-resveratrol is produced by grape berries <strong>in</strong> response to fungal<strong>in</strong>fection and UV irradiation [12]. Thus, it is possible that sun exposure of grapes grown atMuntenia region may be a factor <strong>in</strong> <strong>in</strong>creased resveratrol level compared with the grapesfrom Oltenia region. In addition, the red grape varieties Feteasca Neagra may be geneticallyricher <strong>in</strong> this compound than other varieties.Graphical representation of mean concentration of trans-resveratrol found <strong>in</strong> thisresearch, <strong>de</strong>pend<strong>in</strong>g on the red w<strong>in</strong>e variety show that the content of trans-resveratrol<strong>de</strong>creased <strong>in</strong> or<strong>de</strong>r Feteasca Neagra, Merlot, P<strong>in</strong>ot Noire, Cabernet Sauvignon (Fig. 4).Concern<strong>in</strong>g white w<strong>in</strong>e, higher concentration of trans-resveratrol was found <strong>in</strong> MuscatOttonel variety.179
PDA-310nmEtalon 2 ppm300280260240220200180160140120100806040200Proceed<strong>in</strong>g of the 4 rd International Symposium“NEW RESEARCH IN BIOTECHNOLOGY” USAMV Bucharest, Romania, 2011300280260NameRetention TimeArea240220200amAU18016014012010080resveratrol 9.428 880792mAU60402000 1 2 3 4 5 6 7 8 9 10 11 12 13 14 15M<strong>in</strong>utes300280PDA-310nmM 319VNameRetention TimeArea300280260260bmAU240220200180160140resveratrol 9.583 1540691240220200180160140mAU1201201001008080606040402020000 1 2 3 4 5 6 7 8 9 10 11 12 13 14 15M<strong>in</strong>utes300280260PDA-310nmM 327VNameRetention TimeArea300280260240240220220200200180180cmAU160140160140mAU120120100100806040200resveratrol 9.268 195448060402000 1 2 3 4 5 6 7 8 9 10 11 12 13 14 15M<strong>in</strong>utesFigure 3. Chromatogram for: (a) a trans-resveratrol standard solution; (b) a red w<strong>in</strong>e sample; (c) awhite w<strong>in</strong>e sample180
Proceed<strong>in</strong>g of the 4 rd International Symposium“NEW RESEARCH IN BIOTECHNOLOGY” USAMV Bucharest, Romania, 2011Table 1 Trans-resveratrol content of Romanian red w<strong>in</strong>es grouped on varieties, geographical orig<strong>in</strong>and harvest yearVariety Region Harvest yearTrans-resveratrol(mg/L)Muntenia (Valea Calugareasca) 2008 4.363Feteasca NeagraOltenia 2008 1.501Muntenia (Valea Calugareasca) 2009 6.589Muntenia (Dealu Mare) 2009 0.256Oltenia (Olt) 2009 1.717Muntenia (Tohani - Dealu Mare) 2008 0.262Cabernet SauvignonMuntenia (Urlati) 2008 0.499Oltenia (Mehed<strong>in</strong>ti -V<strong>in</strong>ju Mare) 2008 0.025Oltenia - (Mehed<strong>in</strong>ti -V<strong>in</strong>ju Mare) 2009 0.149Muntenia (Tohani - Dealu Mare) 2008 3.307MeroltMuntenia (Tohani – Dealu Mare) 2008 2.771Oltenia - (Mehed<strong>in</strong>ti -V<strong>in</strong>ju Mare) 2008 1.621P<strong>in</strong>ot NoireMuntenia (Valea Calugareasca) 2008 2.369Muntenia (Valea Calugareasca) 2009 1.198Table 2. Trans-resveratrol content of Romanian white w<strong>in</strong>es grouped on varieties, geographicalorig<strong>in</strong> and harvest yearVariety Region Harvest year Transresveratrol(mg/L)Feteasca Regala Muntenia (Dealu Mare-Pietroasele) 2008 n.d.Muntenia (Dealu Mare-Pietroasele) 2009 0.132Tamaioasa Romaneasca Muntenia (Dealu Mare-Pietroasele) 2008 n.d.Sauvignon Blanc Muntenia (Tohani – Dealu Mare) 2008 0.074Muntenia (Tohani – Dealu Mare) 2009 0.138Feteasca Alba Muntenia (Tohani – Dealu Mare) 2008 n.d.Muntenia (Tohani – Dealu Mare) 2009 n.d.Riesl<strong>in</strong>g Italian Muntenia (Valea Calugareasca) 2008 n.d.Muntenia (Valea Calugareasca) 2009 0.141Muscat Ottonel Muntenia (Urlati) 2009 0.159n.d. not <strong>de</strong>tected (<strong>de</strong>tection limit = 0.008 mg/L)4. CONCLUSIONSThis work enabled the implementation of an easy and reliable methodology fortrans-resveratrol analysis <strong>in</strong> w<strong>in</strong>e. The use of direct <strong>in</strong>jection <strong>in</strong> HPLC with PDA <strong>de</strong>tectionis a practical method of analysis used by many laboratories. Validation studies for themethod show a <strong>de</strong>tection limit of 0.008 mg/L, quantification limit of 0.026 mg/L and aglobal uncerta<strong>in</strong>ty of 23.5%.181
Proceed<strong>in</strong>g of the 4 rd International Symposium“NEW RESEARCH IN BIOTECHNOLOGY” USAMV Bucharest, Romania, 2011concentration (mg/L)54.543.532.521.510.50FeteascaNeagraCabernetSauvignonMeroltP<strong>in</strong>ot Noirew<strong>in</strong>e varietyFigure 4. Representation of experimental average concentration of trans-resveratrol <strong>de</strong>pend<strong>in</strong>g on thered w<strong>in</strong>e varietyAs expected, the levels of trans-resveratrol are clearly higher <strong>in</strong> red w<strong>in</strong>es, most ofthe white w<strong>in</strong>es be<strong>in</strong>g actually un<strong>de</strong>r the <strong>de</strong>tection level of the method (0.008 mg/L). Thelevel of trans-resveratrol found here are comparable to those found by other authors [9-11],which <strong>de</strong>monstrates the suitability of this very simple analytical technique.For a public health po<strong>in</strong>t of view, the values obta<strong>in</strong>ed may suggest that theconsumption of w<strong>in</strong>e from Feteasca Neagra variety represent a reliable source of health.182REFERENCES1. Hart J,H., (1981), Role of phytostilbenes <strong>in</strong> <strong>de</strong>cay and disease resistance, Annual Review ofPhytopathology, 19, 437-458.2. Moreno-Labanda J.F., Mallavia R., Perez-Fons L., Lizama V., Saura D., Micol V., (2004),Determ<strong>in</strong>ation of piceid and resveratrol <strong>in</strong> Spanish w<strong>in</strong>es <strong>de</strong>riv<strong>in</strong>g from Monastrell (Vitisv<strong>in</strong>ifiera L.) grape variety, J. Agric. Food Chem. 52, 5396-5403.3. Malovana S., Garcia Montelongo F.J., Perez J.P., Rodriguez-Delgado M.A., (2001),Optimisation of sample preparation for the <strong>de</strong>term<strong>in</strong>ation of trans-resveratrol and otherpolyphenolic compounds <strong>in</strong> w<strong>in</strong>e by high performance liquid chromatography, Anal. Chim. Acta428, 245-253.4. Jean<strong>de</strong>t P., Bessis R., Gautheron B., (1991), The production of resveratrol (3,5,4’-trihydroxystilbene) by grape berries <strong>in</strong> different <strong>de</strong>velopmental stages, Am. J. Enol. Vitic., 42(1),41-46.5. Lamuela-Revantos R.M., Romero-Perez A.I., Waterhouse A.L. and <strong>de</strong> la Torre-Boronat M.C.,(1995), Direct HPLC analysis of cis and trans resveratrol and piceid isomers <strong>in</strong> Spanish redVitis v<strong>in</strong>ifiera w<strong>in</strong>es, Journal of Agricultural and food Chermistry 43, 281-283.6. Threlfall R.T., Morris J.R. and Mauromoustakos A., (1999), Effect of variety, ultraviolet lightexposure and enological methods on the trans-resveratrol level of w<strong>in</strong>e, Am. J. Enol. Vitic.50(1), 57-64.
Proceed<strong>in</strong>g of the 4 rd International Symposium“NEW RESEARCH IN BIOTECHNOLOGY” USAMV Bucharest, Romania, 20117. Flam<strong>in</strong>i R., (2003), Mass spectrometry <strong>in</strong> grape and w<strong>in</strong>e chemistry. Part I: Polyphenols, MassSpectr Rev 22, 218-250.8. Goldberg D.M., yan J., Ng E., Diamandia E.P., Karumanchiri A., Soleas G., Waterhouse A.L.,(1994), Direct <strong>in</strong>jection gas chromatographic mass spectrometric assay for trans-resveratrol,Anal. Chem. 66, 3959-3963.9. Ratola N., Faria J.L., Alves A., (2004), Analysis and quantification of trans-resveratrol <strong>in</strong> w<strong>in</strong>esfrom Alentejo region (Portugal), food Technol. Biotechnol. 42 (2), 125-13010. Ratola N., Faria J.L., Alves A., (2004), Analysis and quantification of trans-resveratrol <strong>in</strong> w<strong>in</strong>esfrom Alentejo region (Portugal), food Technol. Biotechnol. 42 (2), 125-130.11. Buiareli F., Coccioli F., Jasionowska R., Merolle M., Terracciano A., (2006), Chromatographicanalysis of trans-resveratrol <strong>in</strong> Italian w<strong>in</strong>es: comparison between FL, UV and MS <strong>de</strong>tection,Chromatographia 64, 475-481.12. Buiareli F., Coccioli F., Jasionowska R., Merolle M., Terracciano A., (2006), Chromatographicanalysis of trans-resveratrol <strong>in</strong> Italian w<strong>in</strong>es: comparison between FL, UV and MS <strong>de</strong>tection,Chromatographia 64, 475-481.183
184Proceed<strong>in</strong>g of the 4 rd International Symposium“NEW RESEARCH IN BIOTECHNOLOGY” USAMV Bucharest, Romania, 2011CAROTENE CONTENT FROM MILK SAMPLES OBTAINED INDIFFERENT FEEDING CONDITIONSFULVIA A. MANOLACHE 1 , DENISA E. DUŢĂ 1 , VALENTIN IONESCU 1 , LUMINITACATANA 1 , VASILE A. BLAJ 2 , AMALIA MITELUŢ 31 National Institute of Research&Development for Food Bioresources – IBA Bucharest, hfulvia@yahoo.com,<strong>de</strong>nisa_duta@yahoo.com, lumi_catana@yahoo.co.uk, valent<strong>in</strong>.ionescu@bioresurse.ro2Grassland Research and Development Institute, Braşov, blajadi@yahoo.com3 University of Agronomic Sciences and Veter<strong>in</strong>ary Medic<strong>in</strong>e Bucharest -Faculty of <strong>Biotechnology</strong>,amalia@agral.usamv.roAbstract. Carotene is important <strong>in</strong> human health and nutrition, because is a precursor to vitam<strong>in</strong> A.In spite of lower percentage <strong>in</strong> milk, carotene is <strong>in</strong>volved <strong>in</strong> the sensorial properties of dairy productsthrough their colorant and antioxidant properties. The aim of this research was to study thevariability of carotene content accord<strong>in</strong>g to farm feed<strong>in</strong>g practices. Carotene content was <strong>de</strong>term<strong>in</strong>edus<strong>in</strong>g UV-VIS 550 spectrophotometer. Milk samples were analyzed from physico-chemical po<strong>in</strong>t ofview. The metal content (Cu, Fe and Zn) of each sample was <strong>de</strong>term<strong>in</strong>ed by Atomic AbsortionSpectrophotometer (Analyst 400). The obta<strong>in</strong>ed results showed a variation of beta carotene contentaccord<strong>in</strong>g to the feed<strong>in</strong>g mo<strong>de</strong> of cows.Keywords: milk, carotene, spectrophotometer, Atomic Absorbtion1. INTRODUCTIONCarotenoids are notable for their wi<strong>de</strong> distribution, structural diversity, and variousfunctions. Animals are <strong>in</strong>capable of carotenoid biosynthesis, and hence <strong>de</strong>pend on dietarycarotenoids, which are selectively or unselectively absorbed, converted to vitam<strong>in</strong> A.[4]Even it is obviously <strong>in</strong> several countries that carotene contribution <strong>in</strong> human diet iscom<strong>in</strong>g <strong>in</strong> large percentage from carrots, as well as from other fruits and vegetables, asmaller concentration is available from diary products, giv<strong>in</strong>g a better position to milk <strong>in</strong>consumer acknowledge. More, the carotenes may play a rol <strong>in</strong> stabilis<strong>in</strong>g the oxidablecompounds of milk. Despite their benefic roles, a special attention should be paid tocarotene transfer from feed<strong>in</strong>g to cow milk.[3]Data from literature shows about 10 i<strong>de</strong>ntified carotenes <strong>in</strong> feed (ex. Carotene,xantofile), their concentration <strong>de</strong>pend<strong>in</strong>g on <strong>de</strong>velopment status and their conservationperiod. The sensitivity of β-carotene dur<strong>in</strong>g rum<strong>in</strong>ation is <strong>de</strong>pend<strong>in</strong>g a lot of the feed<strong>in</strong>gsource. From the class of rum<strong>in</strong>ants, only cattle accumulates high concentration ofcarotenes, especially β-carotene, most probably due to the low efficiency of vitam<strong>in</strong> Asynthesis <strong>in</strong> enterocytes. Carotenes from cow milk are mostly β-carotenes trans and, <strong>in</strong>lower concentration, lute<strong>in</strong>. In milk, the concentration varies more <strong>in</strong> the case of β-carotenethan for ret<strong>in</strong>oic those plasmatic concentration is well fixed. The β-carotene concentration<strong>in</strong> milk is <strong>de</strong>pend<strong>in</strong>g on ditetic suplements used. The animal and the factors related to himis affect<strong>in</strong>g the milk production (i.e race).[2]In this article the presented research results are concern<strong>in</strong>g the level of β-carotenefrom milk of the cows grew <strong>in</strong> pla<strong>in</strong> and mounta<strong>in</strong> areas, differentiated fed due to season.
Proceed<strong>in</strong>g of the 4 rd International Symposium“NEW RESEARCH IN BIOTECHNOLOGY” USAMV Bucharest, Romania, 20112. MATERIALS AND METHODS2.1 SAMPLES OF MILKFor complet<strong>in</strong>g the experiments, milk samples from two areas have been analyzed: frompla<strong>in</strong> area and from mounta<strong>in</strong> area from cows fed with different types of feed. 11 milksamples of cows fed both summer and w<strong>in</strong>ter periods from pla<strong>in</strong> area of IBNA Balotestihave been analyzed. From the mounta<strong>in</strong> area of Blana Bucegi milk samples of cows graz<strong>in</strong>gon different pasture have been analyzed.Table 1. Milk samples used <strong>in</strong> experimentsSample cod Feed<strong>in</strong>g mo<strong>de</strong> Orig<strong>in</strong>P1,P2, P3 comb<strong>in</strong>ed fod<strong>de</strong>r, hay - alfalfa, corn silage IBNA BalotestiA1,A2,A3C1,C2,C3D1,D2,D3E1,E2,E3natural pasture fertilizednatural pastures, limed, chemical fertilised,padockedsown pasture, limed, chemical fertilised,padockednatural pastures near the experimental fiel<strong>de</strong>xperimentalfieldsBlana Bucegi(1800 m)TI,T2,T3natural pastures from the experimental fieldP4,P5,P6,P7,P8,P9,P10,P11 comb<strong>in</strong>ed fod<strong>de</strong>r, green fod<strong>de</strong>r IBNA BalotestiMilk samples A1..3; C1..3 ; D1..3; E1..3; T1..3 have been taken <strong>in</strong> august from 15cows fed on 5 different pastures each of 0,75 ha. On each pastures 3 cows have been fedabout 85 days on summer time. The pastures differ on type, level and fertilization level aswell as the exploit<strong>in</strong>g way. Before analysis, the samples have been frozen at -18 0 C.2.2 METHODSUV-VISThe concentration of β-carotene from the consi<strong>de</strong>red milk samples has been <strong>de</strong>term<strong>in</strong>edwith UV-VIS 550 spectrophotometer. The milk samples have been thawed, heated at roomtemperature, homogenized and then analyzed. Saponification of fat from milk has beendone at cold with hydro-alcoholic solution of potassium hydroxi<strong>de</strong> and carotene extractionwas done with n-hexane. The extract purification has been done on chromatographiccolumn (activated alum<strong>in</strong>um oxy<strong>de</strong> and anhydrous sodium sulphate). The β-caroteneextract colour<strong>in</strong>g <strong>in</strong>tensity <strong>in</strong> hexane has been measured with the spectrophotometer (λ=450nm, the reference sample was n-hexane).The content of β-carotene, <strong>in</strong> µg at 100 ml of product, was calculated with the follow<strong>in</strong>gformula:C × VVβ-carotene = 1× 100[µg/100ml]of which:C – the concentration of β-carotene, red on calibration curve <strong>in</strong> µg/mlV 1 – the extract volume of β-carotene <strong>in</strong> hexane, <strong>in</strong> ml185
Proceed<strong>in</strong>g of the 4 rd International Symposium“NEW RESEARCH IN BIOTECHNOLOGY” USAMV Bucharest, Romania, 2011V – the sample volume for <strong>de</strong>term<strong>in</strong>ation, <strong>in</strong> mlThe physico-chemicals characteristics of the consi<strong>de</strong>red milk samples have been<strong>de</strong>term<strong>in</strong>ed accord<strong>in</strong>gly with standardized methods shown <strong>in</strong> table no. 2Table 2. The Standards used at physico-chemical analysis of milk samplesQuality <strong>in</strong>dicators M.U. MethodFat % STAS 6352/1-88Dry substance % AOAC 990:20/2005Prote<strong>in</strong> % SR EN ISO 8968-3:2007Acidity0 T SR ISO 6092:2008The <strong>de</strong>term<strong>in</strong>ation of heavy metals and m<strong>in</strong>eral elementsTo do the <strong>de</strong>term<strong>in</strong>ation, an AAnalyst 400 Perk<strong>in</strong> Elmer atomic absortionspectrophotometer has been used (air-acetylene, with corection of absortion (lamp D2) toanalyse metals and m<strong>in</strong>eral elements: Zn, Fe, Cu, Ca, Mg)The recommen<strong>de</strong>d wave lenght for the above mentioned elements are:Cu = 324,8 nm; Fe = 248,3 nm; Zn = 213,9 nm; Ca = 422,7 nm; Mg = 285,2 nm.The analyte concentration for each element was <strong>de</strong>term<strong>in</strong>ed with the sampl<strong>in</strong>g curve:Absorbance = f (concentration), completed with the respective sampl<strong>in</strong>g solutionsM<strong>in</strong>eral element Determ<strong>in</strong>ation: sampl<strong>in</strong>g curve for Mg was completed between 0 and0,5 ppm, and for Ca between 0 and 5 ppm.Metal Determ<strong>in</strong>ation: sampl<strong>in</strong>g curve for Cu was completed between 0 and 4 ppm, for Febetween 0 and 3 ppm and for Zn between 0 and 0,75 ppm.3. RESULTS AND DISCUSSIONSConcentration of β-caroteneTo quantify the level of β carotene from the consi<strong>de</strong>red milk samples, we did a calibrationcurve between 0 and 2 µg β carotene/ml. (the l<strong>in</strong>earity coefficient R 2 =0.9994).0,150,12Calibration curve of Beta CarotenAbsorbance0,090,060,03y = 0,2384x - 0,0013R 2 = 0,999400 0,1 0,2 0,3 0,4 0,5 0,6Concentration of Beta-Caroten (µg/mL)186Figure 1. Calibration curve of β carotene
Proceed<strong>in</strong>g of the 4 rd International Symposium“NEW RESEARCH IN BIOTECHNOLOGY” USAMV Bucharest, Romania, 2011The β-carotene content, <strong>in</strong> µg at 100 ml of product, <strong>de</strong>term<strong>in</strong>ed for the consi<strong>de</strong>red samples,is presented <strong>in</strong> graphic below.35Beta caroten content3025Concentration20151050P1 P2 P3 P4 P5 P6 P7 P8 P9 P10 P11 A1 A2 A3 C1 C2 C3 D1 D2 D3 E1 E2 E3 T1 T2 T3SamplesFigure 2. The β-carotene contentIn the case of milk samples (P1,P2,P3) taken from the cows fed with w<strong>in</strong>ter feed(comb<strong>in</strong>ed fod<strong>de</strong>r, hay - alfalfa, corn silage) no <strong>de</strong>tection of the β-carotene content. Thisresults can be expla<strong>in</strong>ed by the fact that this feed has a low β-carotene content (0-0,08 mgβ-carotene <strong>in</strong> 100 g of feed) and after cow metabolism it was not further found <strong>in</strong> milk.[1]In the case of the milk from cows fed on summer time (comb<strong>in</strong>ed fod<strong>de</strong>r, green fod<strong>de</strong>r) atIBNA Balotesti, the β-carotene content has been <strong>de</strong>tected at samples P4,P5,P6, between1,25-5 µg β-carotene per 100 ml. After the study was completed, we noted that β-caroteneaccumulation <strong>in</strong> cow milk is <strong>in</strong>fluenced both of the feed β-carotene content and the eachcow metabolism.Largest values of the β-carotene concentration have been recor<strong>de</strong>d <strong>in</strong> the milksamples taken at Blana Bucegi, where the cows have been fed with green feed on openspace. In this case, the β-carotene content varied between large limits of 6,25 – 28,75 µg β-carotene per 100 ml. The β-carotene concentration is referr<strong>in</strong>g to <strong>in</strong>dividual milk samples,the m<strong>in</strong>imum value is referr<strong>in</strong>g to the milk sample from cow no. 3 (C3), fed on parcel C(natural pastures, limed, chemical fertilised, padocked). The maximum value is referr<strong>in</strong>g toβ-carotene content of the milk sample from cow no. 1 (E1), fed on natural pastures closedto experimental area (pasture E).Besi<strong>de</strong>s the variation of β-carotene content <strong>de</strong>pend<strong>in</strong>g of the pastures where cowwas fed, there are differences between β-carotene content of milk samples from cows whichwere fed on the same pastures (6,88-15,63 µg β-carotene per 100 ml for the cows fed on thenatural pasture with<strong>in</strong> the experimental area, pasture T). These results can be expla<strong>in</strong>ed dueto the crumbl<strong>in</strong>g <strong>de</strong>gree, digestion and metabolisation <strong>de</strong>gree of the feed with<strong>in</strong> eachanimal.Physico-chemical characteristicsThe consi<strong>de</strong>red milk samples have been analyzed also from physico-chemical po<strong>in</strong>t of viewand the results are presented <strong>in</strong> the graphic below.187
Proceed<strong>in</strong>g of the 4 rd International Symposium“NEW RESEARCH IN BIOTECHNOLOGY” USAMV Bucharest, Romania, 2011Physico-chemical characterization of samples45.0040.0035.0030.0025.0020.0015.0010.005.000.00P1P2P3P4P5P6P7P8ValueP9P10P11A1A2A3C1C2C3D1D2D3E1E2E3T1T2T3SamplesSU (%) Prote<strong>in</strong> (%) Fat (%) Acidity(°T) pHFigure 3. The variation of physico-chemical properties of samplesAccord<strong>in</strong>gly with the obta<strong>in</strong>ed results, the prote<strong>in</strong> content of milk samples, takenfrom the consi<strong>de</strong>red cows, varied between 2,88-3,79%. The m<strong>in</strong>immum value has beenregistered <strong>in</strong> the case of sample P8 from a cow fed on pla<strong>in</strong> area with green feed andcomb<strong>in</strong>ed fod<strong>de</strong>r. The maximum value is referr<strong>in</strong>g to sample P7.The content <strong>in</strong> fat of milk samples from consi<strong>de</strong>red cows, varied between 2,68-4,16%, the m<strong>in</strong>immum value has been registered <strong>in</strong> the case of a milk sample from cow no.2, fed on a natural pastures, limed, chemical fertilised, padocked. The maximum value hasbeen registered <strong>in</strong> the case of a milk sample P4 from a cow fed on pla<strong>in</strong> area with greenfeed and comb<strong>in</strong>ed fod<strong>de</strong>r.The variation of metal content (Cu, Fe,Zn) and m<strong>in</strong>eral elements (Ca,Mg) for theconsi<strong>de</strong>red milk samples is presented <strong>in</strong> the table below.Value100806040200Metal and m<strong>in</strong>eral contentP1P2P3P4P5P6P7P8P9P10P11A1A2A3C1C2C3D1D2D3E1E2E3T1T2T3SampleCu (mg/L) Fe (mg/L) Zn (mg/L) Ca (mg/100mL Mg (mg/100mL )188Figure 4. The variation of metal and m<strong>in</strong>eral content
Proceed<strong>in</strong>g of the 4 rd International Symposium“NEW RESEARCH IN BIOTECHNOLOGY” USAMV Bucharest, Romania, 2011As it is shown <strong>in</strong> the graphic above, the iron content of the consi<strong>de</strong>red milk samples varies<strong>in</strong> large limits: 0,139 mg/l-3,889 mg/l, the m<strong>in</strong>immum value at milk sample A2, from cowno. 2, grew on pastures A (natural pasture last time fertilised on 2010). The maximum valuehas been registered <strong>in</strong> the case of milk sample C1, from cow no. 1, fed on parcel C (naturalpastures, limed, chemical fertilised, padlocked).Concern<strong>in</strong>g the calcium content, the biggest value has been registered <strong>in</strong> the caseof sample A1, from cows fed with comb<strong>in</strong>ed fod<strong>de</strong>r, hay - alfalfa, corn silage, on pla<strong>in</strong> area.4. CONCLUSIONS1. Follow<strong>in</strong>g the study, we noted that β-carotene accumulation <strong>in</strong> cow milk is<strong>in</strong>fluenced both β-carotene content <strong>in</strong> feed and each cow metabolism.2. The milk samples taken from Blana Bucegi, where the cows have been fed withgreen feed on open space, have been presented the biggest concentrations <strong>in</strong> β-carotene, <strong>in</strong> between 6,25 – 28,75 µg β-carotene on 100 ml.3. The iron content of the consi<strong>de</strong>red milk samples varied between 0,139 mg/l-3,889mg/l. The m<strong>in</strong>immum value has been registered <strong>in</strong> the case of milk sample from acow which has been fed on a natural pastures (last time fertilised on 2010, sampleA2) and the maximum value has been registered <strong>in</strong> the case of a milk sample froma cow fed on natural pastures, limed, chemical fertilised, padocked (sample C1).The milk from cows fed with comb<strong>in</strong>ed fod<strong>de</strong>r hay - alfalfa, corn silage, grew onpla<strong>in</strong> area, has been presented the largest content <strong>in</strong> calcium: 84,15 mg/100 mL(sample A1).REFERENCES1. Fulvia A. Hîncu, Denisa E. Duţă, Valent<strong>in</strong> Ionescu, Vasile A. Blaj, Amalia Mitelut(2010)”Determ<strong>in</strong>ation of biochemical marker of carotene type <strong>in</strong> harvested green fod<strong>de</strong>rfrom Bucegi area”, Preceed<strong>in</strong>gs of the 3rd International Symposium on “<strong>New</strong> Research <strong>in</strong><strong>Biotechnology</strong>” Bucharest, Romania, Supplementary Volume, ISSN 1224-77742. Noziere, P. si colab. (2006) Carotenoids for rum<strong>in</strong>ants: From forages to dairy products,Animal Feed Sc. and Tech., vol 131 (3-4), p. 418-4503. Noziere, P. si colab. (2006) Variation <strong>in</strong> fat-soluble micronutrients <strong>in</strong> milk, Journal ofDairy Science, vol. 89, 7, p.2634-26484. Rodriguez-Amaya, B., Delia, Kimura, Mieko (200) HarvestPlus Handbook for CarotenoidAnalysis, HarvestPlus Technical Monograph 2, IFPRI and CIAT, SUA189
190Proceed<strong>in</strong>g of the 4 rd International Symposium“NEW RESEARCH IN BIOTECHNOLOGY” USAMV Bucharest, Romania, 2011RESEARCH ON MYCOTOXIN CONTENT OF TRITICUM AESTIVUM INROMANIAN SOUTH CROPSAMALIA MITELUŢ 1 , ALINA CULEŢU 1,2 , IRINA SMEU 2 , MONA POPA 11 University of Agronomic Sciences and Veter<strong>in</strong>ary Medic<strong>in</strong>e, Faculty of <strong>Biotechnology</strong>, Bd. Mărăsti, no.59,Bucharest, Romania, e-mail: amaliamitelut@yahoo.com2 National Institute of Research & Development for Food Bioresources – IBA Bucharest, Str. D<strong>in</strong>u V<strong>in</strong>tilă, no.1-6,Bucharest, Romania, e-mail: al<strong>in</strong>aculetu@yahoo.comAbstract. In this study, there have been analyzed 69 wheat samples (Triticum aestivum, Dropiavariety) from 8 different regions situated <strong>in</strong> southern Romania; samples were provi<strong>de</strong>d <strong>in</strong> 2010 rightafter harvest<strong>in</strong>g.For these samples were <strong>de</strong>term<strong>in</strong>ed microbiological analysis (total number of germ, yeastsand molds), mycotox<strong>in</strong> content (<strong>de</strong>oxynivalenol – DON, zearalenone – ZEA) and also physicalchemicaltests (percentage of impurities and foreign bodies, number of moldy gra<strong>in</strong>s).Follow<strong>in</strong>g the <strong>in</strong>terpretation of results it was found that <strong>in</strong> all wheat samples studied, the mycotox<strong>in</strong>content was below the maximum levels allowed for unprocessed cereals established by CE no.1881/2006 regulation, except for Teleorman county were 2 samples exceed the limit for ZEA content.There were samples <strong>in</strong> which mycotox<strong>in</strong> content was not <strong>de</strong>tected: 92.7% of samplesanalyzed for ZEA, respectively 34.8% for DON content, the values be<strong>in</strong>g below the limit of <strong>de</strong>tectionof the method used for analysis.This paper is part of a research project fund<strong>in</strong>g by National Research Program PN II(no.52-132/2008).Keywords: Triticum aestivum, Dropia variety, <strong>de</strong>oxynivalenol, zearalenone1. INTRODUCTIONMycotox<strong>in</strong>s are secondary metabolites produced by fungi, with different andcomplex chemical structures and common characteristics, such as: resistance to thermal<strong>de</strong>gradation, persistence dur<strong>in</strong>g process<strong>in</strong>g of products. Once formed mycotox<strong>in</strong> will reachthe f<strong>in</strong>al consumer products.Wheat can be contam<strong>in</strong>ated with mycotox<strong>in</strong>s produced by a variety of fungi, <strong>in</strong>particular by Fusarium species [1]. Growth of these fungi and formation of mycotox<strong>in</strong>s canoccur, <strong>de</strong>pend<strong>in</strong>g on some conditions, such as: crop growth, harvest, transport, storage(fungi multiply when relative humidity is 80 – 85%, and temperature is high, above 26 0 C)and process<strong>in</strong>g [2].The most important Fusarium mycotox<strong>in</strong>s that can frequently occur at biologicallysignificant concentrations <strong>in</strong> cereals are: fumonis<strong>in</strong>s, zearalenone (ZEA) andtrichothecenes: <strong>de</strong>oxynivalenol (DON), nivalenol and T-2 tox<strong>in</strong>. Mycotox<strong>in</strong>s DON andZEA are produced by Fusarium gram<strong>in</strong>earum, Fusarium culmorum and Fusariumcrookwellense.DON (also called vomitox<strong>in</strong>) is the most important trichothecenes because of its high<strong>in</strong>ci<strong>de</strong>nce <strong>in</strong> cereals, <strong>in</strong>clud<strong>in</strong>g maize, wheat, barley, oats, but it is not one of the mostacutely toxic of this group of mycotox<strong>in</strong>s [3].
Proceed<strong>in</strong>g of the 4 rd International Symposium“NEW RESEARCH IN BIOTECHNOLOGY” USAMV Bucharest, Romania, 2011ZEA may be present <strong>in</strong> cereal crops <strong>in</strong> cooler and moist regions worldwi<strong>de</strong>.Mycotox<strong>in</strong>s not only cause serious damages <strong>in</strong> yields and quality of gra<strong>in</strong>s, butalso can <strong>in</strong>duce a variety of adverse health effects <strong>in</strong> humans and animals, <strong>de</strong>pend<strong>in</strong>g oncontam<strong>in</strong>ation levels of the products. Due to the <strong>in</strong>creased concern about protection of theconsumer, mycotox<strong>in</strong>s are monitored <strong>in</strong> the European Union with official regulations [4].Thus, mycotox<strong>in</strong>s are strictly regulated <strong>in</strong> the Commission Regulation EC no. 1881/2006[5]; for <strong>in</strong>stance, maximum level for DON <strong>in</strong> unprocessed wheat is set to 1250 g/kg,respectively, 100 g/kg for ZEA.In this work, a monitor<strong>in</strong>g of wheat samples (Dropia variety) from the po<strong>in</strong>t ofview of mycotox<strong>in</strong> content has been performed <strong>in</strong> some regions from southern Romania.2. MATERIALS AND METHODSSamples preparationThe selected samples for analysis were wheat Triticum aestivum, grown <strong>in</strong>southern Romania, collected from local producers <strong>in</strong> 2010. There have been analyzed 69wheat samples com<strong>in</strong>g from 8 different geographical regions: Dolj (13 samples), Călăraşi(12 samples), Olt (8 samples), Dâmboviţa (4 samples), Buzău (9 samples), Brăila (4samples), Mehed<strong>in</strong>ţi (3 samples) and Teleorman (16 samples). All the samples belonged toDropia variety, which is prepon<strong>de</strong>rant <strong>in</strong> south region for bakery wheat. In this study, thesamples were analyzed right after harvest<strong>in</strong>g.Samples preparation consists <strong>in</strong> gr<strong>in</strong>d<strong>in</strong>g of almost 500 g wheat <strong>in</strong> or<strong>de</strong>r to obta<strong>in</strong>a homogeneous pow<strong>de</strong>r.Extraction procedure for ZEA mycotox<strong>in</strong>: 25 mL mixture methanol / water (70/30)is ad<strong>de</strong>d to 5 g ground sample, stirred (at 180 rpm, 10 m<strong>in</strong>utes, room temperature),followed by extract filtration on Whatman no.1 paper. The same procedure for DONextraction, except that only water is used as solvent.Methods used for analysisDetection and quantification of mycotox<strong>in</strong> content was <strong>de</strong>term<strong>in</strong>ed us<strong>in</strong>g ELISAtype immuno-enzymatic method (Ridascreen Zearalenon kit for ZEA, respectively,Ridascreen Deoxynivalenol kit for DON – producer R–Biopharm, Germany). Optical<strong>de</strong>nsity are read (at 450 nm) with Sunrise spectrophotometer (Tecan, Austria), equippedwith Rida ® SOFT W<strong>in</strong> program (R–Biopharm, Germany). Two repetitive samples havebeen used and the average media of these samples has been employed <strong>in</strong> data analysis.Procedure for microbiological analysis is based on count<strong>in</strong>g colonies ofmicroorganisms obta<strong>in</strong>ed on solid media, by <strong>in</strong>cubation. Thus, microbiological <strong>in</strong>dicators,such as total number of germ on Plate Count Agar and number of yeasts and molds onGlucose – Chloramphenicol Agar were <strong>de</strong>term<strong>in</strong>ed.The <strong>de</strong>term<strong>in</strong>ation of impurities was carried out accord<strong>in</strong>g to SR ISO 7970:2001 –Wheat (Triticum aestivum L.). Specifications – which refers to the average quality of wheat[6].191
192Proceed<strong>in</strong>g of the 4 rd International Symposium“NEW RESEARCH IN BIOTECHNOLOGY” USAMV Bucharest, Romania, 20113. RESULTS AND DISCUSSIONSThe microbiological analysis: total number of germ (NTG), yeasts and molds(YM), mycotox<strong>in</strong> content (DON, ZEA) and percentage of impurities and foreign bodies andmoldy gra<strong>in</strong>s are presented <strong>in</strong> Table 1 for the wheat samples analyzed <strong>in</strong> all the 8 counties.For 33.3% of the samples analyzed, impurities and foreign bodies content exceedsthe maximum accepted percentage of 15% due to the percentage of kernels affected bypests (bug especially) and sprouted or fungal contam<strong>in</strong>ation.In the same county, Dropia variety had different mycotox<strong>in</strong> values, vary<strong>in</strong>g frombelow the limit of <strong>de</strong>tection to higher values. For example, <strong>in</strong> Teleorman county DONcontent varied from not <strong>de</strong>tected values to 279.94 g/kg. Also, same situation <strong>in</strong> Dolj, Buzăuand Brăila. This can be due to the local environmental condition (soil conditions,meteorological conditions, harvest<strong>in</strong>g agricultural technologies).Table 1. Results obta<strong>in</strong>ed for wheat samples of 2010 crop for different counties.LocalityNTG(ufc/g)YM(ufc/g)DON(g/kg)ZEA(g/kg)Impurities(%)Moldygra<strong>in</strong>s (%)Dolj countyMischii 1.20·10 6 1.70·10 4 11.87 n.d.* 6.33 0Teslu 4.80·10 5 2.00·10 4 31.01 n.d.* 4.53 0.1Scaesti 4.50·10 5 7.30·10 3 11.97 n.d.* 13.37 0Ciupercenii-Noi 3.20·10 5 1.00·10 3 12.96 n.d.* 4.08 0Macesu <strong>de</strong> Sus 8.20·10 4 4.00·10 3 43.94 n.d.* 1.24 0Daneti 2.00·10 6 4.50·10 4 554.39 n.d.* 32.42 0.33Plenita 1.50·10 5 1.00·10 4 n.d.* n.d.* 4.8 0Motatei 4.00·10 4 9.00·10 3 6.51 n.d.* 7.11 0.2Izvoare 9.00·10 4 4.00·10 3 10.14 n.d.* 5.01 0Rast 2.60·10 5 6.40·10 3 6.41 n.d.* 4.73 0.35Dragotesti 2.50·10 5 2.00·10 4 12.02 n.d.* 4.9 0Leu 1.00·10 6 6.00·10 3 25.5 n.d.* 10.34 0.03Calafat 5.50·10 6 1.00·10 3 5.05 n.d.* 3.76 0Călăraşi countyBelciugatele 2.60·10 6 8.00·10 3 7.29 n.d.* 11.49 0.15Lupsanu 1.10·10 5 8.00·10 3 6.67 n.d.* 16.72 0.4Plataresti 1.70·10 5 1.20·10 4 298.72 n.d.* 4.39 0Dor Marunt 1.40·10 5 4.00·10 3 5.11 n.d.* 14.69 0.18St. Voda 6.40·10 5 2.10·10 4 9.67 n.d.* 38.52 0.15Al. Odobescu 2.70·10 5 1.90·10 4 6.44 n.d.* 20.85 0.13Mitreni 4.70·10 5 3.50·10 4 9.59 n.d.* 19.32 1.23In<strong>de</strong>pen<strong>de</strong>ntei 8.20·10 4 1.20·10 4 8.54 n.d.* 15.01 0.2Vlad Tepes 3.10·10 5 7.00·10 3 5.25 n.d.* 22.82 0.03Fun<strong>de</strong>ni 4.10·10 5 8.00·10 3 397.8 0.3709 4.43 0Sohatu 7.00·10 4 4.00·10 3 125.84 n.d.* 1.71 0.02Galb<strong>in</strong>asi 1.90·10 5 1.80·10 4 147.56 n.d.* 15.19 0Olt countySlat<strong>in</strong>a Z3 3.20·10 5 5.00·10 4 52.78 n.d.* 10.73 0.1
Proceed<strong>in</strong>g of the 4 rd International Symposium“NEW RESEARCH IN BIOTECHNOLOGY” USAMV Bucharest, Romania, 2011LocalityNTG(ufc/g)YM(ufc/g)DON(g/kg)ZEA(g/kg)Impurities(%)Moldygra<strong>in</strong>s (%)Stud<strong>in</strong>a Z9 1.10·10 6 1.40·10 4 0.09 n.d.* 18.74 0.48Corabia Z10 7.20·10 5 1.00·10 4 44.2 n.d.* 15.4 0.07Samburesti Z1 4.40·10 5 9.00·10 4 45.4 n.d.* 7.25 0Piatra Olt Z5 5.30·10 5 8.20·10 4 29.04 n.d.* 10.39 0Bals Z4 4.50·10 5 1.10·10 4 233.46 n.d.* 13.76 0Valea Mare Z6 1.90·10 5 1.00·10 3 15.79 n.d.* 6.05 0Ianca Z11 8.70·10 5 2.10·10 4 18.36 n.d.* 17.88 0.22Dâmboviţa countyDobra 1.60·10 5 7.00·10 3 27.01 n.d.* 6.71 0Contesti 8.00·10 4 1.00·10 2 686.51 n.d.* 4.99 0Selbru, Vis<strong>in</strong>a 4.30·10 5 1.20·10 4 58.55 n.d.* 8.89 0Dragodana, Matasaru 1.60·10 5 7.30·10 4 390.17 n.d.* 4.85 0Buzău countyPogoanele, Scutelnici 1.30·10 6 3.60·10 4 n.d.* n.d.* 10.26 0.25Vadu Pasii, Sageata 1.50·10 5 1.20·10 3 n.d.* n.d.* 7.46 0.2Pad<strong>in</strong>a, Luciu 2.50·10 5 9.40·10 3 n.d.* n.d.* 16.04 0.3Puiesti, Boldu 2.20·10 5 7.00·10 2 n.d.* n.d.* 9.42 0.32Susetu, C.A.Roseti 5.30·10 5 5.00·10 3 n.d.* n.d.* 12.02 0.15Mihailesti 1.40·10 5 1.10·10 4 n.d.* n.d.* 26.89 0.13Gl. Silistea 2.50·10 5 6.00·10 3 n.d.* n.d.* 9.32 0.08P. Calmau 1.90·10 5 7.40·10 3 17.98 n.d.* 16.36 0.32Puiesti, Boldu 5.10·10 5 5.50·10 3 31.28 n.d.* 9.81 0.02Brăila countyBrăila Z1 3.40·10 5 1.30·10 4 64.07 10.101 5.55 0.08Brăila Z2 3.10·10 6 6.70·10 4 n.d.* n.d.* 12.55 0.72Brăila Z3 1.00·10 5 1.60·10 3 n.d.* n.d.* 17.26 0.13Brăila Z4 3.50·10 5 3.90·10 3 94.96 0.63224 7.71 0.65Mehed<strong>in</strong>ţi countyBurila Mare 1.30·10 5 1.70·10 3 n.d.* n.d.* 3.17 0.2Vanju Mare 3.10·10 6 2.50·10 3 n.d.* n.d.* 9.73 0.05Garla Mare 1.40·10 5 1.80·10 4 n.d.* n.d.* 6.46 0.07Teleorman countyNasturelu 1.00·10 5 3.30·10 3 n.d.* n.d.* 14.81 0Smardioasa 3.50·10 5 5.20·10 4 n.d.* n.d.* 28.94 0.23Turnu Magurele 1.40·10 7 4.00·10 3 n.d.* n.d.* 11.74 0.17Balaci 3.50·10 5 1.70·10 4 22.37 n.d.* 20.84 0Magura 4.10·10 5 7.00·10 3 74.59 n.d.* 15.25 0.1Zimnicea 2.40·10 6 7.90·10 5 n.d.* n.d.* 12.1 1.06Traian 2.20·10 6 1.10·10 3 n.d.* n.d.* 24.37 0Bogdana 4.60·10 5 1.70·10 3 185.1 112.657 24.48 0.08Botoroaga 1.60·10 5 5.20·10 3 17.5 n.d.* 15.05 0.28Ciolanesti 3.50·10 5 3.10·10 3 n.d.* n.d.* 7.39 0Calmatui 4.80·10 5 9.10·10 3 n.d.* n.d.* 27.17 0Piatra 1.10·10 5 2.00·10 3 n.d.* n.d.* 11.88 0.07Mosteni 7.50·10 5 5.20·10 3 279.94 191.052 26.5 0.05Vitanesti 1.50·10 5 1.40·10 5 n.d.* n.d.* 6.04 0193
Proceed<strong>in</strong>g of the 4 rd International Symposium“NEW RESEARCH IN BIOTECHNOLOGY” USAMV Bucharest, Romania, 2011LocalityNTG YM DON ZEA Impurities Moldy(ufc/g) (ufc/g) (g/kg) (g/kg) (%) gra<strong>in</strong>s (%)Rosiori <strong>de</strong> Ve<strong>de</strong> 1.10·10 5 3.60·10 3 n.d.* n.d.* 4.87 0.05Vi<strong>de</strong>le 7.00·10 5 3.00·10 3 n.d.* n.d.* 7.7 0* not <strong>de</strong>tectedIn Figure 1 is presented the evolution of DON content <strong>in</strong> all the wheat samples. Asit can be noticed, the highest value for DON is registered <strong>in</strong> Dâmboviţa (686.51 g/kg),followed by Dolj (554.39 g/kg) and Călăraşi (397.8 g/kg).In all wheat samples studied, the mycotox<strong>in</strong> content was below the maximumlevels allowed for unprocessed cereals established by CE no. 1881/2006 regulation; exceptfor Teleorman county where samples from Bogdana and Mosteni locality exceed the limitfor ZEA content (100 g/kg), namely 112.657 g/kg, respectively 191.052 g/kg (Fig.2).800700600DON, µg/kg5004003002001000Dolj Călăraşi Olt Dâmboviţa Buzău Brăila Mehed<strong>in</strong>ţi TeleormanFig.1. Evolution of DON content <strong>in</strong> wheat samples from the counties analyzed.There were samples <strong>in</strong> which mycotox<strong>in</strong> content was not <strong>de</strong>tected: 92.7% ofsamples analyzed for ZEA, respectively 34.8% for DON content, the values be<strong>in</strong>g belowthe limit of <strong>de</strong>tection of the method used for analysis. So, DON presence is higher thanZEA <strong>in</strong> wheat samples studied.In 5 counties, namely, Dolj, Olt, Dâmboviţa, Buzău and Mehed<strong>in</strong>ţi, ZEA contentwas not <strong>de</strong>tected <strong>in</strong> all the wheat samples studied. The only values <strong>de</strong>tected for ZEAcontent <strong>in</strong> some localities from Călăraşi, Brăila and Teleorman are presented <strong>in</strong> Fig.2.Also, <strong>in</strong> all the samples from Călăraşi, Olt and Dâmboviţa, DON content was<strong>de</strong>tected.In Fig.3 is shown a comparison between the highest values for DON found <strong>in</strong> awheat sample from each of the county analyzed and the correspond<strong>in</strong>g value for ZEA forthe same sample.194
Proceed<strong>in</strong>g of the 4 rd International Symposium“NEW RESEARCH IN BIOTECHNOLOGY” USAMV Bucharest, Romania, 2011ZEA, µg/kg200180160140120100806040200Călăraşi Brăila TeleormanFig.2. ZEA content <strong>in</strong> wheat samples analyzed.Mycotox<strong>in</strong>, µg/kg7006005004003002001000Dolj Olt Buzău Mehed<strong>in</strong>ţiDON ZEAFig.3. Comparison between DON and ZEA content <strong>in</strong> the same locality.4. CONCLUSIONSIn this study, for all wheat samples (Triticum aestivum, Dropia variety) studiedfrom 8 different regions situated <strong>in</strong> southern Romania, the mycotox<strong>in</strong> content was belowthe maximum levels allowed for unprocessed cereals established by European Regulation,except for Teleorman county were 2 samples exceed the limit for ZEA content.In the same county, Dropia variety had different mycotox<strong>in</strong> loads, vary<strong>in</strong>g frombelow the limit of <strong>de</strong>tection, of the method used for analysis, to higher values.195
Proceed<strong>in</strong>g of the 4 rd International Symposium“NEW RESEARCH IN BIOTECHNOLOGY” USAMV Bucharest, Romania, 2011DON presence is higher than ZEA <strong>in</strong> wheat samples studied. The analyses havebeen done immediately after harvest; therefore the content of mycotox<strong>in</strong>s is low. This<strong>in</strong>dicates a good quality of the wheat samples studied <strong>in</strong> this regard.ACKNOWLEDGEMENTS. The authors thank to the f<strong>in</strong>ancial support from NationalResearch Program PN II with<strong>in</strong> the project no. 52-132/2008 and to National Institute ofResearch & Development for Food Bioresources – IBA Bucharest to provi<strong>de</strong> necessary<strong>in</strong>formation concern<strong>in</strong>g the wheat quality of 2010 year.REFERENCES[1]. Kohl, J., De Haas, H., Kastele<strong>in</strong>, P., Burgers, S.L.G.E., Waalwijk, C. (2007): Populationdynamics of Fusarium spp. and Microdochium nivale <strong>in</strong> crops and crop residues of w<strong>in</strong>ter wheat.Phytopathology. Vol.97: 971-978.[2]. Beyer, M., Klix, M.B., Kl<strong>in</strong>k, H., Verreet, J.A. (2006): Quantify<strong>in</strong>g the effects of previous crop,tillage, cultivar and triazole fungici<strong>de</strong>s on the <strong>de</strong>oxynivalenol content of wheat gra<strong>in</strong>. Journal of PlantDiseases and Protection. Vol.113: 241-246.[3]. Rotter B., Prelusky D.B., and Petska J.J. (1996): Toxicology of <strong>de</strong>oxynivalenol (vomitox<strong>in</strong>).Journal of Toxicology and Environmental Health, Vol.48: 1-34.[4]. Van Egmond, H.P., Schothorst, R.C., Jonker, M.A. (2007): Regulations relat<strong>in</strong>g to mycotox<strong>in</strong>s <strong>in</strong>food. Perspectives <strong>in</strong> a global and European context. Analytical and Bioanalytical Chemistry, Vol.389: 147-157.[5]. Commission of the European Communities (2006): Commission Regulation (EC) No 1881/2006of 19 December 2006 sett<strong>in</strong>g maximum levels for certa<strong>in</strong> contam<strong>in</strong>ants <strong>in</strong> foodstuffs. Official Journalof the European Union L364, pp 5–24.[6]. Belc. N. et all. (2010): Catalogul anual cu date priv<strong>in</strong>d calitatea grâului, pe zone <strong>de</strong> cultură, pentrusoiurile <strong>de</strong> grâu cultivate în România, Recolta 2010, Vol.15.196
Proceed<strong>in</strong>g of the 4 rd International Symposium“NEW RESEARCH IN BIOTECHNOLOGY” USAMV Bucharest, Romania, 2011THE POLYOLEFIN PACKAGE INFLUENCE UPON THE QUALITY OFTHE BREAD ENRICHED WITH EXOGENOUS BUCKWHEAT ADDINGREBENCIUC IOANA 1 , BUCULEI AMELIA 1 , GABRIELA CONSTANTINESCU(POP) 1 ,ADRIANA DABIJA 11 USV Stefan cel Mare, Str.Universitatii nr.13, Suceava,Romania* Correspond<strong>in</strong>g author: ioanar@fia.usv.roAbstract. The test<strong>in</strong>g of the package for the bread products had as purpose not only the evaluation ofthe “food contact” quality but also the barrier properties for gases and water vapors. As a breadproduct we chose the bread enriched with exogenous buckwheat add<strong>in</strong>g. There were tested four typesof polyolef<strong>in</strong> packag<strong>in</strong>gs for the global migration of the components <strong>in</strong> different food simulants andwe also led the heavy metals <strong>de</strong>term<strong>in</strong>ation us<strong>in</strong>g a atomic absorption spectrophotometer. For thepermeability tests we used <strong>de</strong>vices for <strong>de</strong>term<strong>in</strong><strong>in</strong>g the permeability at gases and water vapors. Thebread enriched with exogenous buckwheat add<strong>in</strong>g was analyzed from the po<strong>in</strong>t of view of thetechnological quality <strong>in</strong>dicators and the nutritional po<strong>in</strong>t of view by analyz<strong>in</strong>g for the later them<strong>in</strong>eral substances content. The experiments un<strong>de</strong>rl<strong>in</strong>ed on one hand the benefits of the buckwheatadd<strong>in</strong>g <strong>in</strong> the panification process and proved on the other hand the fact that the packag<strong>in</strong>gprolongues the shelf life ensur<strong>in</strong>g the microbiological quality and the relative constant preservationof the characteristics of the f<strong>in</strong>ished product.Keywords: polyolef<strong>in</strong> package, buckwheat bread, global migration, witness sample,permeability1. INTRODUCTIONThe us<strong>in</strong>g of the buckwheta add<strong>in</strong>g <strong>in</strong> bread fabrication was due to the fact that thisone is found at the bor<strong>de</strong>r between food stuff and medic<strong>in</strong>e.Common buckwheat(Fagopyrium esculentum Moench) is recognized as an important functional food <strong>in</strong> somecountries such as Ch<strong>in</strong>a, Japan and Taiwan.[3] Phenolic compounds <strong>in</strong> buckwheat havebeen shown to possess antioxidant activity. Four flavonol glycosi<strong>de</strong>s <strong>in</strong>clud<strong>in</strong>g rut<strong>in</strong>,quarter<strong>in</strong>g, kaemferol-3-rut<strong>in</strong>osi<strong>de</strong> and a trace amount of a flavanol triglyco- si<strong>de</strong> werefound <strong>in</strong> the methanol extract of buckwheat.[4] Compared to most fruits, vegetables andgra<strong>in</strong> crops, buckwheat conta<strong>in</strong>s more rut<strong>in</strong>, which is a quercet<strong>in</strong>-3-rut<strong>in</strong>osi<strong>de</strong> withantioxidant, anti-<strong>in</strong>flammatory and ant carc<strong>in</strong>ogenic effects, and can also reduce thefragility of blood vessels related to hemorrhagic disease and hypertension <strong>in</strong> humans.[1] Inaddition, buckwheat was found to be a prebiotic food because it could <strong>in</strong>crease lactic acidbacteria <strong>in</strong> rat <strong>in</strong>test<strong>in</strong>e. It is claimed that buckwheat gra<strong>in</strong> extract could be used <strong>in</strong> thetreatment of allergic <strong>in</strong>flammation.[5] Buckwheat could be <strong>in</strong>corporated <strong>in</strong>to bread andprovi<strong>de</strong> buck- wheat enhanced wheat bread with more functional components and moreeffective antioxidant properties.[2]For the prolong<strong>in</strong>g of the preservation time and the ensur<strong>in</strong>g of the product quality keep<strong>in</strong>gis advisable for the products to be packed.[7]The olefynic materials usually used for the bread products packag<strong>in</strong>g are th<strong>in</strong> filmsmost of them of polypropylene (PP), polyethylene (PE) or multilayer type.[6] In this study197
Proceed<strong>in</strong>g of the 4 rd International Symposium“NEW RESEARCH IN BIOTECHNOLOGY” USAMV Bucharest, Romania, 2011we analyzed the permeability for gases and water vapors for the bread packag<strong>in</strong>gs for the<strong>in</strong>ner-outer and viceversa oxygene transfer and water vapors is l<strong>in</strong>ked to the apearance ofseveral alterations of the packed product.The pack<strong>in</strong>g layers permeability is the <strong>de</strong>term<strong>in</strong>ant parameter for evaluat<strong>in</strong>g theirbarrier properties <strong>in</strong> the mass transfer (Journal of Food Eng<strong>in</strong>eer<strong>in</strong>g 89, 2008). For toappreciate a material’s <strong>in</strong>nocuity <strong>in</strong> direct contact with the food stuff there was <strong>de</strong>term<strong>in</strong>edthe ced<strong>in</strong>g <strong>de</strong>gree for the different compounds of a package <strong>in</strong> an extraction liquid.1982. MATERIALS AND METHODSIn or<strong>de</strong>r to obta<strong>in</strong> some available experimental data, wheat flour obta<strong>in</strong><strong>in</strong>g fromFLAMURA wheat variety gr<strong>in</strong>d<strong>in</strong>g <strong>in</strong> Chop<strong>in</strong> Laboratory Mill was used like controlsample. The technological characteristics of flour are shown <strong>in</strong> Table 1.Moisture%Ash%Table 1. Analytical parameters of Control flourWet gluten%Prote<strong>in</strong>%Hydrationcapacity%Fall<strong>in</strong>gNumbersec13.42 0.68 31.1 13,3 62.6 329Buckwheat flour was provi<strong>de</strong>d by local producers.The analytical flour quality was <strong>de</strong>term<strong>in</strong>ed accord<strong>in</strong>g to the <strong>in</strong>ternational standardmethods (ash content – ICC104/1, wet gluten – ICC105/2, prote<strong>in</strong> content – ICC106/2,hydration capacity with Phar<strong>in</strong>ograph - ICC115/1 and Zeleny <strong>in</strong><strong>de</strong>x – ICC116/1).Like raw material I used also compacted fresh yeast (Saccharomyces cerevisiae)from S.C. ROMPAK, Pascani, with 32.5% dry matter and 46.54% prote<strong>in</strong> content (N x6.25).Dough was prepared us<strong>in</strong>g a straight dough method. After bak<strong>in</strong>g, the samples werecool<strong>in</strong>g 6-8 hours <strong>in</strong> controlled atmosphere (UV lamps).In or<strong>de</strong>r to be scor<strong>in</strong>g (after 24 hours), and to be exam<strong>in</strong>ed from microbiologicalpo<strong>in</strong>t of view (after 72 hours), the samples were sliced for packed <strong>in</strong> plastic bagsMicrobiological quality of bread with buckwheat, over 3 days at room temperaturewas evaluated accord<strong>in</strong>g with SR EN ISO 4832/2006 quality standard.The m<strong>in</strong>eral substances were evaluated us<strong>in</strong>g EDX-900.For the bread pack<strong>in</strong>g there were used polypropylene bags (PP), high <strong>de</strong>nsitypolyethylene (HDPE), low <strong>de</strong>nsity polyethylene (LDPE), multilayer foil (PE/ adhesive /PA/ adhesive/ PE) supplied by Sudpack.The <strong>de</strong>term<strong>in</strong>ation of the permeability at gases was led accord<strong>in</strong>g to the BS EN ISO2556/2003 standard, us<strong>in</strong>g the Dansensor 1 L 100-5000 <strong>de</strong>vice. The <strong>de</strong>term<strong>in</strong>ation of thepermeability at water vapors was led accord<strong>in</strong>g to the SR EN ISO 15106-1/2005 standard,us<strong>in</strong>g the Dansensor 1 L 80-5000 <strong>de</strong>vice.For the components global <strong>de</strong>term<strong>in</strong>ation we used as food simulants distilled water,3% acetic acid and isooctane accord<strong>in</strong>g to STAS 1186-1/2003. The work<strong>in</strong>g method for<strong>de</strong>term<strong>in</strong><strong>in</strong>g the Pb and Cd migration from the plastic materials is similar to the one <strong>in</strong> SRISO 1: 19997, the exception be<strong>in</strong>g ma<strong>de</strong> by the acetic acid solution that <strong>in</strong> our case had a
Proceed<strong>in</strong>g of the 4 rd International Symposium“NEW RESEARCH IN BIOTECHNOLOGY” USAMV Bucharest, Romania, 2011concentration of 3% and the extract was analyzed after the sterilization and concentrationby atomic absorption spectrophotometry <strong>in</strong> oxyacetylene flame of A Analyst 400 type witha background sound correction.3. RESULTS AND DISCUSSIONSThe analysis of the gases and water vapors permeability of the polyolef<strong>in</strong> packag<strong>in</strong>gconsisted <strong>in</strong> the <strong>de</strong>term<strong>in</strong>ation of the transmission speed of the gas through th<strong>in</strong> foils un<strong>de</strong>ratmospheric pressure <strong>in</strong> the case of the gases and the <strong>de</strong>term<strong>in</strong>ation of the transmissionspeed of the water vapors for the water vapors permeability.The test<strong>in</strong>g of the permeability of the polyolef<strong>in</strong> foils un<strong>de</strong>rl<strong>in</strong>ed the high watervapors and gases barrier of the multilayer foil followed by the PP and HDPE foils. Thelowest barrier properties were presented by the LDPE foil.The migration test conditions <strong>in</strong> distilled water and acetic acid were: 10 days at40◦C, and for the isooctane 24 hours at 40◦C.No.SampleTable 2. The permeability analysis resultsPermeability at gases(cm 3 /m 2 /day)oxygene CO 2 (23 0 C)(23 0 C),cm 3 /m 2 /day1 PP foil bag 1900 8900 4,212 HDPE foil bag 2123 96000 5,73 LDPE foil bag 6398 36000 25,14 PE multilayer foil bag andweld<strong>in</strong>g layer Surlynionomer and EVOH barrier16 2,7 1Permeability atvapors (g/m 2 /zi)Water vapors(23 0 C)After the evaluation of the global migration level we observed that all the migrationvalues are un<strong>de</strong>r the limit of 60 ppm (10mg/dm 2 ), imposed by the laws.After the organoleptic exam<strong>in</strong>ation and the realization of the extractions <strong>in</strong> theestablished conditions of the work<strong>in</strong>g field the package samples studied <strong>de</strong>st<strong>in</strong>ed for foodcontact didn’t present visible changes of the colour and appearance of the surface <strong>in</strong>comparison with the witness samples. At the same time the food simulants didn’t presentcolour, transparency (opalescence), smell or taste (where possible) changes <strong>in</strong> comparisonwith the witness samples.The evaluation of the AAS analysis of the heavy metals migration took <strong>in</strong>to accountthe ORD. Nr.975/1998, that specified the limits for: Pb:0,1ppm and Cd absent. Weobserved that most of the values were un<strong>de</strong>r the LD <strong>de</strong>tection limit of the <strong>de</strong>vice, with twoexceptions <strong>in</strong> the case of Pb (the PP and LDPE foils).The analysis of the technological and physico-chemical quality of the bread packed<strong>in</strong> polyolef<strong>in</strong> packageFor evaluat<strong>in</strong>g the quality of the bread with buckwheat add<strong>in</strong>g we ma<strong>de</strong> two samplesone with high gluten wheat flour and one with 10% Buckwheat flour add<strong>in</strong>g.199
Proceed<strong>in</strong>g of the 4 rd International Symposium“NEW RESEARCH IN BIOTECHNOLOGY” USAMV Bucharest, Romania, 2011Table 3. The results of the global migration tests <strong>in</strong> the simulants A, B and D and the heavy metalsmigrationNameOrganoleptic modifications1. PP foilbag2. HDPEfoil bag3. LDPEfoil bag4. PEmultilayer foil bagandweld<strong>in</strong>glayerSurlynionomerandEVOHbarrierExtractionenvironmentDistilledwaterAceticacid sol.3%IsooctaneDistilledwaterExtractionconditions/extraction ratioSampleExtractGlobalmigrationppmMetals ced<strong>in</strong>gppmPb Cd10 days, 40 o C/1:2 Unmodified Unmodified 5,25 - -10 days, 40 o C/1:2 Unmodified Unmodified 5,5 0,01748h, t.c./1:2 Unmodified Unmodified 7,25 - -10 days, 40 o C/1:2 Unmodified Unmodified 6.0 - -Aceticacid sol.3%10 days, 40 o C/1:2 Unmodified Unmodified 6.5 -
Proceed<strong>in</strong>g of the 4 rd International Symposium“NEW RESEARCH IN BIOTECHNOLOGY” USAMV Bucharest, Romania, 2011P4- Bread packed <strong>in</strong> LDPE foil with 10% buckwheatP5- Bread packed <strong>in</strong> multilayer foil with 10% buckwheatTable 4. Recipe for bread with buckwheat flourIngredients and technological regime UM QuantitiesRaw materials and <strong>in</strong>gredientsWheat flourgramsBuckwheat flourgrams500Fresh yeast grams 8Salt grams 7Water cm 3 270 to 300Technological parametersKnead<strong>in</strong>g time m<strong>in</strong> 10-15Proffer time m<strong>in</strong> 20-25Temperature of blanks0 C 30-32Bak<strong>in</strong>g time m<strong>in</strong> 30-35Bak<strong>in</strong>g temperature m<strong>in</strong> 240-260Table 5. The physico-chemical analysis of the samplesPhysico-chemical <strong>in</strong>dicatorWitness sample(bread withoutSample with 10%buckwheat add<strong>in</strong>gbuckwheatadd<strong>in</strong>g )Height/ dimenssion ratio 0.62 0.64Volume, cm 3 /100g 300 320Porosity, [%] 35 30Elasticity, [%] 78 63,65Acidity, acidity gra<strong>de</strong>s/100 g0.6 1,4Humidity, [%] 69.46 78,78M<strong>in</strong>eralsubstancesWitnesssampleBreadwith 10%buckwheatTable 6. The m<strong>in</strong>eral composition of the bread samples before pack<strong>in</strong>gCl K P Ca S Fe Cu Mn Zn Br Rb61,09 24,30 9,519 3,067 1,555 0,193 0,063 0,086 0,136 0,035 0,01961,26 27,71 11,602 5,161 1,555 3,173 0,063 0,086 0,136 0,035 0,019Analyz<strong>in</strong>g the obta<strong>in</strong>ed data we saw a relative constant ma<strong>in</strong>tenance of the physicochemical<strong>in</strong>dicators except<strong>in</strong>g the humidity which is obviously higher at the unpackedbread <strong>in</strong> comparison with the packed one. The highest humidity level was at the P5multilayer foil package for the other samples be<strong>in</strong>g observed a reduction of the values <strong>in</strong>comparison with the witness samples. The physico-chemical and technological <strong>in</strong>dicatorsthat were the closest to the values obta<strong>in</strong>ed before tha pack<strong>in</strong>g were <strong>de</strong>term<strong>in</strong>ed for the201
Proceed<strong>in</strong>g of the 4 rd International Symposium“NEW RESEARCH IN BIOTECHNOLOGY” USAMV Bucharest, Romania, 2011bread packed <strong>in</strong> the multilayer foil bag. The packag<strong>in</strong>g didn’t <strong>in</strong>fluence the m<strong>in</strong>eralsubstances content.Table 7. The physico-chemical analysis of the packed bread samplesPhysico-chemical WitnessThe sample after 4 days<strong>in</strong>dicator sampleafter 3 P1 P2 P3 P4hours Unpacked Bread Bread Breadof bread with packed <strong>in</strong> packed <strong>in</strong> packed <strong>in</strong>bak<strong>in</strong>g 10% PP foil HDPE foil LDPE foilbuckwheat with 10% with 10% with 10%buckwheat buckwheat buckwheatP5Breadpacked <strong>in</strong>multilayerfoil with10%buckwheatHeight/0,64 0,64 0,60 0,58 0,41 0,63dimenssion ratioVolume, 320 310 315 315 315 315cm 3 /100gPorosity, [%] 30 30 25 24 21 28Elasticity, [%] 63,65 61,65 56,23 56,01 53,13 61,98Acidity, acidity 1,4 1,4 1,4 1,4 1,4 1,4gra<strong>de</strong>s/100 gHumidity, [%] 78,78 81,7 73,77 73,12 68.21 76.64The microbiological analysis of the sampleBecause the f<strong>in</strong>al contam<strong>in</strong>ation <strong>de</strong>pends of the <strong>in</strong>itial level of microorganisms, itwas evaluate the evolution of microbiota start<strong>in</strong>g by 3 hours after breads back<strong>in</strong>g till thefourth day of storage. A qualitative microbiological <strong>de</strong>term<strong>in</strong>ation was led to each sample.Initially the contam<strong>in</strong>ation level for all five samples subjected to analysis was null.The packed bread samples didn’t present <strong>in</strong> the first three days any important modificationsfrom the microbiological po<strong>in</strong>t of view.In the fourth day we observed modifications of the surface at P5 (the bread packed <strong>in</strong>multilayer foil) and also at the unpacked bread duet o the appearance of mold at the surface(fig. 1). After the sampl<strong>in</strong>g and microscopic exam<strong>in</strong>ation we <strong>de</strong>term<strong>in</strong>ed that the moldbelongs to the Aspergillus (fig. 2) and Mucor types (fig. 3).Fig 1 Mold at the buckwheat bread surface202
Proceed<strong>in</strong>g of the 4 rd International Symposium“NEW RESEARCH IN BIOTECHNOLOGY” USAMV Bucharest, Romania, 2011Fig.2. Aspergillius flavusFig.3. Mucor mucedoThe Aspergillius flavus colonies are light- green coloured hav<strong>in</strong>g a f<strong>in</strong>e granularappearance. The aspergilla ends are globular at the microscope; the susta<strong>in</strong><strong>in</strong>g filaments arestrong and well <strong>de</strong>veloped with biseries serigma.The Mucor mucedo colonies <strong>de</strong>veloped on the surface of the bread are soft of whitegreyshcolour. At the microscope the hyphae are well branched and l<strong>in</strong>ked <strong>in</strong> a thicknetwork.This mold <strong>de</strong>velopment is <strong>de</strong>term<strong>in</strong>ed by the high water content of the two samples(81,7% humidity at the witness sample and 76.64% at the P5 sample) <strong>in</strong> comparison withthe other samples.CONCLUSIONSSubstitut<strong>in</strong>g 10% of wheat flour <strong>in</strong> the bread formula with buckwheat flour wouldnot <strong>in</strong>terfere with bread specific volume and score.The <strong>in</strong>creas<strong>in</strong>g of the m<strong>in</strong>eral substances (K,P,Ca,Fe) <strong>in</strong> the bread with buckwheatadd<strong>in</strong>g is benefic for the body for the calcium ions balance the cellular membranes thepotassium adjusts the hydro-sal<strong>in</strong> and <strong>in</strong>tracellular metabolism as well as the osmoticpressure and the iron enters the myoglob<strong>in</strong> structure transport<strong>in</strong>g the oxygene and thephosphorus is of great importance for the stability of the human bone structure.The studied foils present a average permeability at gases, and a good permeability atwater vapors and smells. The best water vapors and gases permeability is attributed to themultilayer foil followed by the PP and HDPE foils. In the case of evaluat<strong>in</strong>g the globalmigration level we observed that all the results are un<strong>de</strong>r the limit imposed by the law. Theheavy metals migration analysis showed a slight <strong>in</strong>creasement of the Pb <strong>in</strong> the case of PPand LDPE foils without mak<strong>in</strong>g them unproper for us<strong>in</strong>g.REFERENCES1. AACC. (1988). Approved methods. St. Paul, MN, USA: The American Association of CerealChemists.2. AOAC (1990). Official methods of analysis (15th ed.). Wash<strong>in</strong>gton, DC, USA: Association ofOfficial Analytical Chemists.3. Kim, C. D., Lee, W.-K., No, K. O., Park, S. K., Lee, M. H., Lim, S. R., et al. (2003). Anti- allergicaction of buckwheat (Fagopyrum esculentum)203
Proceed<strong>in</strong>g of the 4 rd International Symposium“NEW RESEARCH IN BIOTECHNOLOGY” USAMV Bucharest, Romania, 20114. Sun, T., & Ho, C.-T. (2005). Antioxidant activities of buckwheat extracts. Food Chemistry, 90,743–749.5. Li-Yun L<strong>in</strong> Hsiu-Man Liu, Ya-Wen Yu a, Sheng-Dun L<strong>in</strong> Jeng-Leun Mau , Quality and antioxidantproperty of buckwheat enhanced wheat bread, Food Chemistry 112, (2009), 987-9816. Ooraikul, B., (1991). Modified atmosphere packag<strong>in</strong>g of bakery Products.7. Tian, Q., Li, D., & Patil, B. S. (2002). I<strong>de</strong>ntification and <strong>de</strong>term<strong>in</strong>ation of flavonoids <strong>in</strong> buckwheat(Fagopyrum esculentum Moench, Polygonaceae) by high - performance liquid chromatographywith electrospray ionization mass spectrometry and photodio<strong>de</strong> array ultraviolet <strong>de</strong>tection.Phytochemical Analysis, 13, 251–256.8. Standardul european EN 1186-9:2002204
Proceed<strong>in</strong>g of the 4 rd International Symposium“NEW RESEARCH IN BIOTECHNOLOGY” USAMV Bucharest, Romania, 2011SECTION VI: MISCELLANEOUSRESEARCH ABOUT INFLUENCE OF DENSITY AND FERTILISATIONON PROTEIN AND STARCH CONTENT IN SOME GENOTYPES OFBARLEY, VARIETY DISTICHUM“Dunarea <strong>de</strong> Jos” University, Faculty of Eng<strong>in</strong>eer<strong>in</strong>g from Braila, RomaniaNICOLETA AXINTI, DANIELA TRIFANAbstract. This paper presents results on the evolution of prote<strong>in</strong> and starch content of barleyvarieties, variety distichum, Annabelle, Thur<strong>in</strong>gia, and Cristalia comb<strong>in</strong>ed un<strong>de</strong>r differentialfertilization (N0P0, N40P40, N80P80, N120P120) and different seed<strong>in</strong>g <strong>de</strong>nsities (400 bg/m 2 , 600bg/m 2 ).The average results obta<strong>in</strong>ed for the factors studied <strong>in</strong> the three experimental years (2007-2008,2008-2009 and 2009-2010), <strong>in</strong> the Va<strong>de</strong>ni, Braila county, shows that total prote<strong>in</strong> varied between9.85% and 13.2% and starch content between 61.86% and 64.1%.Keywords: barley, <strong>de</strong>nsity, fertilization, prote<strong>in</strong> content, starch content1. INTRODUCTIONThe ma<strong>in</strong> components of barley gra<strong>in</strong> to be taken <strong>in</strong>to account <strong>in</strong> <strong>de</strong>term<strong>in</strong><strong>in</strong>g the<strong>de</strong>st<strong>in</strong>ation for the manufacture of malt and beer are prote<strong>in</strong> and starch content. The contentof prote<strong>in</strong> substances, expressed as a percentage of dry matter, is a characteristic of thevariety, but at the same time is strongly <strong>in</strong>fluenced by climatic conditions and the wayculture, vary wi<strong>de</strong>ly with<strong>in</strong> one and the same variety from year to year and from one placeto another. A gra<strong>in</strong> of starch content <strong>de</strong>term<strong>in</strong>ed by the highest amount of extract and varieswi<strong>de</strong>ly between 57-65% of dry matter. To the extent that the value of this <strong>in</strong>dicator ishigher, shows better quality barley for malt<strong>in</strong>g. [1], [2], [3].This <strong>in</strong>dicator is <strong>in</strong> an <strong>in</strong>verse ratio to the prote<strong>in</strong> content. Research conducted <strong>in</strong>different soil conditions have shown that along with genetic factors, climatic factorscontribute to changes <strong>in</strong> technology broadly chemical composition and quality of crops(Borlan Z., et al., 1994)Fertilizers <strong>in</strong>fluence the quality of barley, therefore they should be appliedaccord<strong>in</strong>g to the purpose for which the culture (feed or malt for beer).2. MATERIALS AND METHODSThe <strong>in</strong>vestigations were ma<strong>de</strong> dur<strong>in</strong>g the agricultural years 2007-2008, 2008-2009,2009-2010, <strong>in</strong> the Va<strong>de</strong>ni, Braila County, on a limestone soil type aluvial soil. Thebiological material used was the experience of three spr<strong>in</strong>g barley varieties: Annabell,Thur<strong>in</strong>gia, and Cristalia.205
Proceed<strong>in</strong>g of the 4 rd International Symposium“NEW RESEARCH IN BIOTECHNOLOGY” USAMV Bucharest, Romania, 2011Experience trifactorial AxBxC type was placed by the method of parcelssubdivi<strong>de</strong>d <strong>in</strong> three repetitions. Factors studied were:Factor A - fertilization, with graduations:a 1 - N0P0a 2 - N40P40a 3 - N80P80a 4 - N120P120Factor B - variety, with graduations:b 1 - Annabellb 2 - Thur<strong>in</strong>giab 3 - CristaliaFactor C - sow<strong>in</strong>g <strong>de</strong>nsity with graduations:c 1 - 400 bg/m 2c 2 - 600 bg/m 2The objectives of this work is the <strong>de</strong>term<strong>in</strong>ation of prote<strong>in</strong> and starch accumulatedby the three spr<strong>in</strong>g barley varieties un<strong>de</strong>r the <strong>in</strong>fluence of the <strong>in</strong>teraction level offertilization and plant<strong>in</strong>g <strong>de</strong>nsity <strong>in</strong> the three years of research. Determ<strong>in</strong>ation of prote<strong>in</strong>and starch was done by a simple and mo<strong>de</strong>rn, us<strong>in</strong>g the <strong>de</strong>vice OmegAnalyzer G.Statistical process<strong>in</strong>g of results was done by the method of analysis of variance,us<strong>in</strong>g MS Office Excel - ANOVA test. As a witness to use the average of the variants.2063. RESULTS AND DISCUSSIONSThe results were summarized and recor<strong>de</strong>d <strong>in</strong> the tables below.To obta<strong>in</strong> beer content of beans barley prote<strong>in</strong> substances should not be over 12%of dry matter above this limit as barley malts malţifică difficult and results <strong>in</strong> a lower yield<strong>in</strong> the extract.With regard to cru<strong>de</strong> prote<strong>in</strong> content of spr<strong>in</strong>g barley, the variety Annabell, <strong>in</strong>2008, it ranged from 9,5% <strong>in</strong> variant N0P0x600bg/m 2 reach<strong>in</strong>g 12,0% <strong>in</strong> versionN120P120x400bg/m 2 values content prote<strong>in</strong>, the variety ranges from 10,1% <strong>in</strong> Thur<strong>in</strong>giaN0P0x600bg/m 2 and 12,5% <strong>in</strong> version N120P120x400bg/m 2 .Cristalia variety recor<strong>de</strong>d values of cru<strong>de</strong> prote<strong>in</strong> content from 10% <strong>in</strong> versionN0P0x600 bg/m 2 and 12,2% <strong>in</strong> version N120P120x600 bg/m 2 .In 2009 the prote<strong>in</strong> content ranged from 10,2% <strong>in</strong> variety Annabell (variantN0P0x600bg/m 2 ) and 12,2% (variant N120P120x400bg/m 2 ), between 10,5% (variantN0P0x600bg/m 2 ) and 12,8% (variant N120P120x400bg/m 2 ), the variety Thur<strong>in</strong>gia and thecru<strong>de</strong> prote<strong>in</strong> content variety Cristalia ranged from 10% (variant N0P0x600bg/m 2 ) and12,6% (variant N120P120x400bg/m 2 ).Cru<strong>de</strong> prote<strong>in</strong> content recor<strong>de</strong>d <strong>in</strong> 2010 by the three varieties analyzed rangedfrom 9,7% (variant N0P0x600bg/m 2 ) and 12,0% (variant N120P120x400bg/m 2 ) between10,3% (variant N0P0x600bg/m 2 ) and 12,6% (range N120P120x400bg/m 2 ), and between10% (range N0P0x600bg/m 2 and version N0P0x400bg/m 2 ) and 12,3% (variantN120P120x600 bg/m 2 ).Mean highest prote<strong>in</strong> content was recor<strong>de</strong>d version Thur<strong>in</strong>giaxN120P120x400bg/m 2 and the lower version CristaliaxN40P40X600 bg/m 2. (fig.1)
Proceed<strong>in</strong>g of the 4 rd International Symposium“NEW RESEARCH IN BIOTECHNOLOGY” USAMV Bucharest, Romania, 2011The content of starch gra<strong>in</strong>s, <strong>in</strong>fluence the highest amount of extract and highvalues of this <strong>in</strong><strong>de</strong>x leads to a good malt<strong>in</strong>g quality. Thus, varieties with a starch content ofat least 57-60% will be very good for malt<strong>in</strong>g.Table 1. Summary of results regard<strong>in</strong>g the <strong>in</strong>fluence of experimental factors on the prote<strong>in</strong> content <strong>in</strong>barley gra<strong>in</strong>sVariantProte<strong>in</strong> content (% <strong>in</strong> dry substance)2008 2009 2010 Average of years% difference % difference % difference % differencea1b1c1 11.8 0.94 *** 12.1 1.24 *** 11.9 1.04 *** 11.9 1.04 ***a1b1c2 12.0 1.14 *** 12.2 1.34 *** 12.0 1.14 *** 12.1 1.24 ***a1b2c1 12.4 1.54 *** 12.8 1.19 *** 12.4 1.54 *** 12.53 1.67 ***a1b2c2 12.5 1.64 *** 12.7 2.24 *** 12.6 1.74 *** 12.6 1.74 ***a1b3c1 12.2 1.34 *** 12.4 1.54 *** 12.3 1.44 *** 12.3 1.44 ***a1b3c2 12.1 1.24 *** 12.6 1.74 *** 12.1 1.44 *** 12.26 1.40 ***a2b1c1 10.5 -0.36 O 11.2 0.34 10.8 -0.06 10.83 -0.03a2b1c2 10.8 -0.06 11.1 0.24 10.6 -0.26 10.83 -0.03a2b2c1 11.0 0.14 11.3 0.44* 11.2 0.36* 11.17 0.31a2b2c2 11.2 0.34 11.4 0.54** 11.3 0.44* 11.3 0.44*a2b3c1 10.8 -0.06 11.0 0.14 10.7 -0.16 10.83 -0.03a2b3c2 10.9 0.04 11.1 0.24 10.9 0.04 10.96 0.1a3b1c1 10.0 -0.86 OOO 10.5 -0.36 O 10.6 -0.26 10.37 -0.49 OOa3b1c2 10.2 -0.66 OOO 10.4 -0.46 OO 10.5 -0.36 O 10.37 -0.49 OOa3b2c1 10.8 -0.06 11.0 -0.14 11.0 0.14 10.93 0.07a3b2c2 10.9 0.04 11.1 0.24 10.8 -0.06 10.93 0.07a3b3c1 10.5 -0.33 10.7 -0.16 10.6 -0.26 10.6 -0.26a3b3c2 10.6 -0.26 10.6 -0.26 10.5 -0.36 O 10.53 -0.33a4b1c1 9.5 -1.36 O 10.2 -0.66 OOO 9.7 -1.16 O 9.8 -1.06 OOOa4b1c2 9.8 -1.06 OOO 10.3 -0.46 OO 9.9 -0.96 O 10.1 -0.76 OOOa4b2c1 10.1 -0.76 OO 10.5 -0.36 O 10.3 -0.56 OO 10.3 -0.56 OOa4b2c2 10.3 -0.56 OO 10.7 -0.16 10.4 -0.46 OO 10.46 -0.4 Oa4b3c1 10.0 -0.86 OOO 10.0 -0.86 OOO 10.0 -0.86 OOO 10.0 -0.86 OOOa4b3c2 10.1 -0.76 OOO 10.2 -0.76 OOO 10.0 -0.86 OOO 10.1 -0.76 OOOControl Average 10.86 -L 5% = 0,3417% DL 1% = 0,457% DL 0,1% = 0,598%In 2008 the starch content ranged from 60,0% <strong>in</strong> variety Annabell (variantN0P0x600bg/m 2 ) and 64,1% (variant N80P80x600bg/m 2 ), between 56,9% (variantN0P0x400bg/m 2 ) and 63,0% (variant N80P80x400bg/m 2 ), the variety Thur<strong>in</strong>gia and thestarch content variety Cristalia ranged from 59,0% (variant N0P0x400bg/m 2 ) and 63,7%(variant N80P80x400bg/m 2 ) (fig.2).In 2009 the starch content ranged from 56,8% <strong>in</strong> variety Annabell (variantN0P0x600bg/m 2 ) and 60,7% (variant N80P80x400bg/m 2 ), between 55,0% (variantN0P0x400bg/m 2 ) and 60,7% (variant N80P80x400bg/m 2 ), the variety Thur<strong>in</strong>gia and thestarch content variety Cristalia ranged from 56,3% (variant N0P0x600bg/m 2 ) and 59,4%(variant N80P80x400bg/m 2 ).207
Proceed<strong>in</strong>g of the 4 rd International Symposium“NEW RESEARCH IN BIOTECHNOLOGY” USAMV Bucharest, Romania, 2011The starch content recor<strong>de</strong>d <strong>in</strong> 2010 by the three varieties analyzed ranged from56,6% <strong>in</strong> variety Annabell (variant N0P0x400bg/m 2 ) and 63,2% (variant N80P80x600bg/m 2 ), between 56,2% (variant N0P0x600bg/m 2 ) and 60,1% (range N80P80x400bg/ m 2 ),the variety Thur<strong>in</strong>gia and the starch content variety Cristalia ranged from 57,5% (variantN0P0x600bg/m 2 ) and 62,8% (variant N80P80x400bg/m 2 ).Table 2. Summary of results regard<strong>in</strong>g the <strong>in</strong>fluence of experimental factors on the starch content ofbarley gra<strong>in</strong>sVariantStarch content (% )2008 2009 2010 Years average% difference % difference % difference % differencea1b1c1 60.7 1.82 57.8 -1.08 58.8 -0.08 59.1 0.22a1b1c2 60.2 1.32 58.2 -0.68 58.6 -0.28 59.00 0.12a1b2c1 58.8 -0.08 55.0 -3.88 OO 57.9 -0.98 57.23 -1.65a1b2c2 57.0 -1.88 55.2 -3.68 OO 57.0 -1.88 56.40 -2.48a1b3c1 59.1 0.22 56.9 -1.98 58.9 0.02 58.30 -0.58a1b3c2 58.8 -0.08 56.6 -1.98 60.0 1.12 58.46 -0.42a2b1c1 64.1 5.22*** 60.1 1.22 63.2 4.32** 62.46 3.58**a2b1c2 64.0 5.12*** 60.7 1.82 62.9 4.02** 62.53 3.65**a2b2c1 62.7 3.82** 58.2 -0.68 60.0 1.12 60.30 1.42a2b2c2 63.0 4.12** 57.9 -0.98 60.1 1.22 60.33 1.45a2b3c1 63.4 4.52** 58.8 -0.08 62.3 3.42** 61.50 2.62a2b3c2 63.7 4.82*** 59.4 0.52 62.8 3.92** 61.96 3.08*a3b1c1 61.3 2.42 58.7 -0.18 59.7 0.82 59.90 1.02a3b1c2 60.8 1.92 57.9 -0.98 59.3 0.42 59.33 0.45a3b2c1 57.9 -0.98 55.9 -2.98 O 57.0 -1.88 56.93 -1.95a3b2c2 58.2 -0.68 55.6 -3.28 O 56.8 -2.08 56.86 -2.02a3b3c1 60.1 1.22 58.2 -0.68 58.9 0.02 59.06 0.18a3b3c2 60.7 1.82 57.7 -1.18 58.2 -0.68 58.86 -0.02a4b1c1 60.0 1.12 56.8 -2.08 58.9 0.02 58.56 -0.32a4b1c2 60.3 1.42 57.9 -0.98 56.6 -2.28 58.26 -0.62a4b2c1 57.3 -1.58 55.3 -3.58 OO 56.2 -2.68 56.26 -2.62a4b2c2 56.9 -1.98 55.0 -3.88 OO 56.5 -2.38 56.13 -2.75 Oa4b3c1 59.2 0.32 56.3 -2.58 57.5 -1.38 57.66 -1.22a4b3c2 59.0 0.12 56.6 -2.28 58.0 -0.88 57.86 -1.02Control Average 58.88DL 5% =2,67% DL 1% =3,57% DL 0,1% =4,68208
Proceed<strong>in</strong>g of the 4 rd International Symposium“NEW RESEARCH IN BIOTECHNOLOGY” USAMV Bucharest, Romania, 2011Fig. 1. Cru<strong>de</strong> prote<strong>in</strong> content <strong>in</strong> every variant of experienceCont<strong>in</strong>utul <strong>de</strong> amidon %7065605550454035302520151050a1b1c1a1b1c2a1b2c1a1b2c2a1b3c1a1b3c2a2b1c1a2b1c2a2b2c1a2b2c2a2b3c12008 2009 2010 MEDIAFig. 2. Starch content <strong>in</strong> every variant of experience4. CONCLUSIONSa2b3c2a3b1c1a3b1c2a3b2c1a3b2c2a3b3c1a3b3c2a4b1c1a4b1c2a4b2c1a4b2c2a4b3c1a4b3c2martorInteraction of three factors of experience shows that N120P120 doses, regardlessof seed<strong>in</strong>g <strong>de</strong>nsity are favorable for barley for brew<strong>in</strong>g, result<strong>in</strong>g <strong>in</strong> a prote<strong>in</strong> content thatexceeds 11.5%.The smallest prote<strong>in</strong> content <strong>in</strong> gra<strong>in</strong>s was recor<strong>de</strong>d at the variant58.88209
Proceed<strong>in</strong>g of the 4 rd International Symposium“NEW RESEARCH IN BIOTECHNOLOGY” USAMV Bucharest, Romania, 2011N0P0xAnnabellx600bg/m 2 with 9,8% and the biggest <strong>in</strong> variant N120P120xThur<strong>in</strong>giax400bg/m 2 with 12,6%.The smallest starch content <strong>in</strong> gra<strong>in</strong>s was recor<strong>de</strong>d at the variantN0P0xThur<strong>in</strong>giax400bg/m 2 with 56,13% and the biggest <strong>in</strong> variantN120P120xAnnabellx400 bg/m 2 with 62,53%.REFERENCESBîlteanu Gh., (2003): Fitotehnie, Editura Ceres, Bucureşti, 973-40-0620-7Berzescu P., şi colab., (1981): Tehnologia berii şi a malţului, Editura Ceres, Bucureşti,Borlan Z., Hera Cr., (1980): Ghid pentru alcătuirea planului <strong>de</strong> fertilizări, Editura Ceres, Bucureşti,Buzatu C., (2009): Research regard<strong>in</strong>g biological and qualitz characteristics of some autumn barleyvarieties <strong>in</strong> Romania s Western Pla<strong>in</strong>s, JOURNAL of Horticulture, Forestry and <strong>Biotechnology</strong> ,Timişoara, vol.13, 2066-1797.Tarjoc F.C., Tabără V., (2011) Influence of foliar fertilization on some qualitative elements of barleyfor the brew<strong>in</strong>g <strong>in</strong>dustry <strong>in</strong> climatic conditions of Timişoara, Bulet<strong>in</strong> Agir, nr.2, 2247-3548 .210
Proceed<strong>in</strong>g of the 4 rd International Symposium“NEW RESEARCH IN BIOTECHNOLOGY” USAMV Bucharest, Romania, 2011STUDY OF CORRELATIONS BETWEEN MAIN QUALITY INDICES OFBARLEY AND TECHNOLOGICAL PARAMETERSNICOLETA AXINTI 1 , DANIELA TRIFAN 11 “Dunărea <strong>de</strong> Jos” University from Galaţi, Faculty of Eng<strong>in</strong>eer<strong>in</strong>g from Brăila, Romania, No. 29, CălăraşilorStr., nicoleta.ax<strong>in</strong>ti@ugal.ro, dtrifan@ugal.roAbstract. The paper aims to establish the <strong>in</strong>ter<strong>de</strong>pen<strong>de</strong>nce between the ma<strong>in</strong> quality <strong>in</strong>dices of barley(TCW, MH, assortment, prote<strong>in</strong> content, starch content, range) and ma<strong>in</strong> technological parameters ofbrew<strong>in</strong>g (malt yield, Kolbach <strong>in</strong><strong>de</strong>x and Hartong <strong>in</strong><strong>de</strong>x, Extract). It was <strong>de</strong>term<strong>in</strong>ate the l<strong>in</strong>earcorrelation coefficients between pairs of values <strong>in</strong> some genotypes of barley (Annabell, Thur<strong>in</strong>gia,Tunika, Boreal) grown <strong>in</strong> Braila Pla<strong>in</strong>, <strong>in</strong> three experimental years (2007 - 2010). Experiencehighlights the importance of quality <strong>in</strong>dicators to obta<strong>in</strong> quality malt for brew<strong>in</strong>g.Keywords: barley, <strong>de</strong>nsity, fertilization, prote<strong>in</strong> content, starch content1. INTRODUCTIONBarley is the gra<strong>in</strong> used s<strong>in</strong>ce antiquity to obta<strong>in</strong> malt and beer, both because ofwi<strong>de</strong> spread culture and characteristics of gra<strong>in</strong> dur<strong>in</strong>g germ<strong>in</strong>ation. The beer <strong>in</strong>dustry,mak<strong>in</strong>g a product with superior taste characteristics and correspond<strong>in</strong>g colloidal stability<strong>de</strong>pends primarily on the quality of hexastichym or distichum barley used as raw material.Barley appreciation for malt production is necessary, as gra<strong>in</strong> quality largely<strong>de</strong>term<strong>in</strong>es the quality of malt and beer, and manufactur<strong>in</strong>g yields. This is done both byappearance and by physical and chemical properties.Quality barley for brew<strong>in</strong>g has a more complex character, due to the large numberof <strong>in</strong>dices that <strong>de</strong>f<strong>in</strong>e and hav<strong>in</strong>g a specific heredity and the fact that they occur <strong>in</strong> differentphases of the process of obta<strong>in</strong><strong>in</strong>g malt.Quality requirements for malt<strong>in</strong>g of barley are quite strict and are directly relatedto process<strong>in</strong>g efficiency and product quality achieved <strong>in</strong> malt and beer <strong>in</strong>dustry. Many ofthe necessary quality characteristics of barley for beer, are un<strong>de</strong>r the control of themanufacturer, others are caused by weather conditions dur<strong>in</strong>g vegetation and harvest<strong>in</strong>g.2. MATERIALS AND METHODSThe <strong>in</strong>vestigations were ma<strong>de</strong> dur<strong>in</strong>g the agricultural years 2007-2008, 2008-2009,2009-2010, <strong>in</strong> the Va<strong>de</strong>ni, Braila County, on an alluvial soil. The biological material used<strong>in</strong> experience was three spr<strong>in</strong>g barley varieties: Annabell, Thur<strong>in</strong>gia, Tunika, and a varietyof w<strong>in</strong>ter barley Boreal.Statistical <strong>in</strong>terpretation of results from laboratory tests were performed us<strong>in</strong>g MSExcel - correlation test.211
VarietyProceed<strong>in</strong>g of the 4 rd International Symposium“NEW RESEARCH IN BIOTECHNOLOGY” USAMV Bucharest, Romania, 20113. RESULTS AND DISCUSSIONSThe results were summarized and recor<strong>de</strong>d <strong>in</strong> the tables below.TGM(g)Table 1. Average values of ma<strong>in</strong> quality <strong>in</strong>dicesQuality <strong>in</strong>dicesHM(Kg)Assortiment(%)Prote<strong>in</strong>content(%)Starchcontent(%)Kolbach<strong>in</strong><strong>de</strong>xHartog<strong>in</strong><strong>de</strong>x45 o CExtract%Annabell 44,7 65,8 90,1 9,7 64,4 38,8 37,4 78,6Thur<strong>in</strong>gia 45,1 61,3 92,5 10,8 63,3 45,3 40,5 79,0Tunika 45,3 65,7 91,2 10,6 65,8 40,7 38,2 79,4Boreal 44,5 58,9 61,0 11,0 63,0 37,6 36,9 77,8Average 44,9 62,9 83,7 10,5 64,1 40,6 38,3 78,7Table 2. Summary of correlations between the ma<strong>in</strong> <strong>in</strong>dices of quality of barley gra<strong>in</strong>s and ma<strong>in</strong>technological parametersAssortmTCW HM ent Prote<strong>in</strong> Starch Kolbach Hartong0,488HM*Assortment0,756**0,750**0,095 -0,771 -0,501ooooProte<strong>in</strong>StarchKolbachHartongYieldExtract0,648**0,685**0,653**0,962**0,872**0,565**-0,013 0,641**-0,050 0,616**0,686 0,891** **-0,395o0,233 -0,0640,246 -0,108 0,999**-0,179 0,735 0,629** **0,594**Study<strong>in</strong>g correlations between <strong>in</strong>dices as <strong>de</strong>term<strong>in</strong>ed from laboratory tests werefound several important correlations. TCW (thousand corn weight) have favorably<strong>in</strong>fluence all the <strong>in</strong>dicators analyzed, correlat<strong>in</strong>g positive significant and very significantwith Assortiment, Kolbach <strong>in</strong><strong>de</strong>x, Hartong <strong>in</strong><strong>de</strong>x, starch content of gra<strong>in</strong>s and extract.It is remarkable that the coefficient of correlation between the TCW and gra<strong>in</strong>starch content (0,648) was much higher negative correlation coefficient between the contentof starch gra<strong>in</strong>s and their prote<strong>in</strong> content (-0,395).212
Proceed<strong>in</strong>g of the 4 rd International Symposium“NEW RESEARCH IN BIOTECHNOLOGY” USAMV Bucharest, Romania, 2011Prote<strong>in</strong> content <strong>in</strong> gra<strong>in</strong>s had a ten<strong>de</strong>ncy to negative <strong>in</strong>fluence other elementsanalyzed. It was significantly dist<strong>in</strong>ctly negatively correlated with HM (-0,771),Assortment (-0,501) and significantly starch content of gra<strong>in</strong>s (-0,395).Prote<strong>in</strong> (% )11.2111110.810.810.610.6y = -10.417x 2 + 939.97x - 2114010.4R 2 = 0.282810.2109.89.79.644.4 44.5 44.6 44.7 44.8 44.9 45 45.1 45.2 45.3 45.4TCW (g)Prote<strong>in</strong> (%) Poly. (Prote<strong>in</strong> (%))Starch (% )6665.865.565y = -10.417x 2 + 939.97x - 21140R 2 = 0.282864.564.46463.563.3636362.544.4 44.5 44.6 44.7 44.8 44.9 45 45.1 45.2 45.3 45.4TCW (g)Starch (%) Poly. (Starch (%))k o lb a h <strong>in</strong> d e x (% )504545.34040.737.638.8353025y = -10.417x 2 + 939.97x - 21140R 2 = 0.28282015105044.4 44.5 44.6 44.7 44.8 44.9 45 45.1 45.2 45.3 45.4TCW (g)Kolbah <strong>in</strong><strong>de</strong>x (%) Poly. (Kolbah <strong>in</strong><strong>de</strong>x (%))H a rto g <strong>in</strong> d e x (% )4140.540.54039.53938.538.23837.53736.9y 37.4 = -10.417x 2 + 939.97x - 21140R 2 = 0.282836.53644.4 44.5 44.6 44.7 44.8 44.9 45 45.1 45.2 45.3 45.4TCW (g)Hartog <strong>in</strong><strong>de</strong>x (%) Poly. ( Hartog <strong>in</strong><strong>de</strong>x (%))M H (% )676665.865.765646362y = -10.417x 2 + 939.97x - 2114061R 2 = 0.282861.3605958.95844.4 44.5 44.6 44.7 44.8 44.9 45 45.1 45.2 45.3 45.4TCW (g)H M (kg )67666565.865.764636261y = -10.417x 2 + 939.97x - 21140R 2 = 0.282861.3605958.95844.4 44.5 44.6 44.7 44.8 44.9 45 45.1 45.2 45.3 45.4TCW (g)MHPoly. (MH)MH Poly. (MH)213
Proceed<strong>in</strong>g of the 4 rd International Symposium“NEW RESEARCH IN BIOTECHNOLOGY” USAMV Bucharest, Romania, 2011A s s o rtim e n t (% )120100806040206192.5 91.2 90.1y = -1.9773x 2 + 250.8x - 7851.5R 2 = 1058 59 60 61 62 63 64 65 66 67MH (kg)Assortment (%) Poly. (Assortment (%))P ro te <strong>in</strong> (% )11.2111110.810.810.610.610.4y = -0.0128x 2 + 1.4703x - 31.25410.2R 2 = 0.6078109.89.79.658 59 60 61 62 63 64 65 66 67MH (kg)Prote<strong>in</strong> (%) Poly. (Prote<strong>in</strong> (%))S ta r c h (% )6665.56564.56463.56363y = 0.0348x 2 - 4.0294x + 179.61R 2 = 0.780363.365.864.4K o lb a h <strong>in</strong> d e x (% )504540353025201510537.645.3y = -0.6565x 2 + 82.149x - 2523.4R 2 = 0.967940.738.862.558 59 60 61 62 63 64 65 66 67MH (kg)Starch (%) Poly. (Starch (%))058 59 60 61 62 63 64 65 66 67MH (kg)Kolbah <strong>in</strong><strong>de</strong>x (%) Poly. (Kolbah <strong>in</strong><strong>de</strong>x (%))41.579.64179.479.440.540.579.2407979H a r to g <strong>in</strong> d e x (% )39.53938.538y = -0.31x 2 + 38.775x - 1171.4R 2 = 0.976238.2E x tra c t (% )78.878.678.478.2y = -0.0761x 2 + 9.6674x - 227.45R 2 = 0.790278.637.537.43736.936.558 59 60 61 62 63 64 65 66 67MH (kg)Hartog <strong>in</strong><strong>de</strong>x (%) Poly. ( Hartog <strong>in</strong><strong>de</strong>x (%))7877.877.877.658 59 60 61 62 63 64 65 66 67MH (kg)Extract (%) Poly. (Extract (%))126910119.710.6 10.868P ro te <strong>in</strong> (% )864y = 0.0153x 2 - 2.3583x + 97.748R 2 = 0.8824S ta rc h (% )67666564y = -0.0189x 2 + 2.9232x - 45.109R 2 = 0.514264.465.82636363.300 10 20 30 40 50 60 70 80 90 100Assortment (%)620 10 20 30 40 50 60 70 80 90 100Assortment (%)214Prote<strong>in</strong> (%) Poly. (Prote<strong>in</strong> (%))Starch (%) Poly. (Starch (%))
Proceed<strong>in</strong>g of the 4 rd International Symposium“NEW RESEARCH IN BIOTECHNOLOGY” USAMV Bucharest, Romania, 20115045K o lb a h <strong>in</strong> d e x (% )4540353025201510y = 0.0861x 2 - 12.979x + 509R 2 = 0.982337.638.845.340.7H a r to g <strong>in</strong> d e x (% )40353025201510y = 0.0413x 2 - 6.2297x + 263.25R 2 = 0.972440.536.9 37.4 38.25500 10 20 30 40 50 60 70 80 90 100Assortment (%)Kolbah <strong>in</strong><strong>de</strong>x (%) Poly. (Kolbah <strong>in</strong><strong>de</strong>x (%))00 10 20 30 40 50 60 70 80 90 100Assortment (%)Hartog <strong>in</strong><strong>de</strong>x (%) Poly. ( Hartog <strong>in</strong><strong>de</strong>x (%))79.579.466.579796665.565.8E xtra ct (% )78.57877.5y = 0.0035x 2 - 0.4925x + 94.839R 2 = 0.816377.878.6Starch (%)6564.56463.56364.4y = -5.7799x 2 + 118.26x - 538.85R 2 = 0.752263.36362.5770 10 20 30 40 50 60 70 80 90 100Assortment (%)Extract (%) Poly. (Extract (%))629.6 9.8 10 10.2 10.4 10.6 10.8 11 11.2Prote<strong>in</strong> (%)Starch (%) Poly. (Starch (%))Kolbah <strong>in</strong><strong>de</strong>x (%)504545.34040.738.837.63530y = -11.022x 2 + 228.55x - 1141.225R 2 = 0.3593201510509.6 9.8 10 10.2 10.4 10.6 10.8 11 11.2Prote<strong>in</strong> (%)Kolbah <strong>in</strong><strong>de</strong>x (%) Poly. (Kolbah <strong>in</strong><strong>de</strong>x (%))Hartog <strong>in</strong><strong>de</strong>x (%)4140.540.54039.53938.538.238y = -4.8428x 2 + 100.5x - 481.85R 2 = 0.326137.5 37.43736.936.59.6 9.8 10 10.2 10.4 10.6 10.8 11 11.2Prote<strong>in</strong> (%)Hartog <strong>in</strong><strong>de</strong>x (%) Poly. ( Hartog <strong>in</strong><strong>de</strong>x (%))80.550Extract (%)8079.57978.578.6y = -3.9074x 2 + 80.324x - 332.9R 2 = 0.971479.479Kolbah <strong>in</strong><strong>de</strong>x (%)4540353025201537.645.338.8y = 0.0065x 2 - 1.0106x + 78.626R 2 = 0.004240.77877.810577.59.6 9.8 10 10.2 10.4 10.6 10.8 11 11.2Prote<strong>in</strong> (%)Extract (%) Poly. (Extract (%))062.5 63 63.5 64 64.5 65 65.5 66Starch (%)Kolbah (%) Poly. (Kolbah <strong>in</strong><strong>de</strong>x (%))<strong>in</strong><strong>de</strong>x215
Proceed<strong>in</strong>g of the 4 rd International Symposium“NEW RESEARCH IN BIOTECHNOLOGY” USAMV Bucharest, Romania, 2011Hartog <strong>in</strong><strong>de</strong>x (%)4140.540.54039.5y = -0.0042x 2 + 0.4003x + 29.69639R 2 = 0.011738.538.23837.537.43736.936.562.5 63 63.5 64 64.5 65 65.5 66Starch (%)Hartog (%) Poly. ( Hartog <strong>in</strong><strong>de</strong>x (%))<strong>in</strong><strong>de</strong>xExtract (%)79.679.479.479.2797978.878.678.678.4y = -0.0236x 2 + 3.4346x - 44.50778.2R 2 = 0.54087877.877.877.662.5 63 63.5 64 64.5 65 65.5 66Starch (%)(%) Poly. (Extract Extract (%))804140.540.579.579.440Extract (%)7978.578.6y = -0.3914x 2 + 30.625x - 519.31R 2 = 0.999679Hartog <strong>in</strong><strong>de</strong>x (%)39.53938.538y = 0.0102x 2 - 0.3815x + 36.79R 2 = 138.27877.877.536.5 37 37.5 38 38.5 39 39.5 40 40.5 41Hartong <strong>in</strong><strong>de</strong>x (%)37.537.43736.936.50 5 10 15 20 25 30 35 40 45 50Kolbah <strong>in</strong><strong>de</strong>x (%)ExtractPoly. (Extract)Cifra Hartog Poly. (Cifra Hartog )Study<strong>in</strong>g correlations between <strong>de</strong>term<strong>in</strong>ed quality <strong>in</strong>dices from laboratory tests were foundseveral important connections. Between hectoliter mass and prote<strong>in</strong> content <strong>in</strong> gra<strong>in</strong>s it wasobserved a negative correlation with a dist<strong>in</strong>ct significant correlation coefficient of - 0.771and significant positive correlations were obta<strong>in</strong>ed separately with the assortment (0.750),starch content (0.872), yield of extract (0.686).Significant positive correlations were obta<strong>in</strong>ed separately and between variety and starch(0.565), respectively Kolbach <strong>in</strong><strong>de</strong>x (0.641), Hartong <strong>in</strong><strong>de</strong>x (0.616) and extract yield(0.891) between starch content and extract yield, with a coefficient of correlation r = 0.735.Significant negative correlations were ma<strong>de</strong> separately between HM and prote<strong>in</strong> contentwith a correlation coefficient r = - 0.771, between variety and prote<strong>in</strong> content with acoefficient of correlation r = - 0.501, and significantly correlation between starch contentand prote<strong>in</strong> content r = - 0.395.2164. CONCLUSIONS- The thousand gra<strong>in</strong> weight (TGW) is a very important <strong>in</strong>dicator for the quality ofbarley for brew<strong>in</strong>g, positively correlated with all other quality <strong>in</strong>dicators.- Barley assortment <strong>in</strong>fluences positive all quality <strong>in</strong>dicators except only prote<strong>in</strong>content, which is negatively significantly dist<strong>in</strong>ctive correlated with this.- Between Kolbach <strong>in</strong><strong>de</strong>x and Hartong <strong>in</strong><strong>de</strong>x there is a very significant positivecorrelation (0.999), while between prote<strong>in</strong> content and starch content there is asignificant negative correlation (- 0.395).- Therefore should be created varieties of barley with a TGM higher and with higherassortment, <strong>in</strong> or<strong>de</strong>r to obta<strong>in</strong> quality malt.- Tunika and Thur<strong>in</strong>gia varieties have achieved the best results <strong>in</strong> our experience,cultivated on alluvial soil <strong>in</strong> Vă<strong>de</strong>ni area.
Proceed<strong>in</strong>g of the 4 rd International Symposium“NEW RESEARCH IN BIOTECHNOLOGY” USAMV Bucharest, Romania, 2011REFERENCESBîltean,u Gh. (2003): Fitotehnie, Editura Ceres, Bucureşti.Berzescu P., şi colab. (1981): Tehnologia berii şi a malţului, Editura Ceres, Bucureşti,.Borlan, Z., Hera, Cr. (1980): Ghid pentru alcătuirea planului <strong>de</strong> fertilizări, Editura Ceres, Bucureşti.Buzatu, C. (2009): Research regard<strong>in</strong>g biological and qualitz characteristics of some autumn barleyvarieties <strong>in</strong> Romania s Western Pla<strong>in</strong>s, JOURNAL of Horticulture, Forestry and <strong>Biotechnology</strong> ,Timişoara, vol.13, , pag.502 – 505Tarjoc, F,.C., Tabără, V. (2011): Influence of foliar fertilization on some qualitative elements ofbarley for the brew<strong>in</strong>g <strong>in</strong>dustry <strong>in</strong> climatic conditions of Timişoara, Bulet<strong>in</strong> Agir, nr.2, pag. 42-44.Trifan, D., Leonte, C., Ax<strong>in</strong>ti, N. (2011): Morphological and physiological variability of some hybridfrench bean populations, Journal of Environmental Protection and Ecology (JEPE), Vol. 10, No.3,1476.217
Proceed<strong>in</strong>g of the 4 rd International Symposium“NEW RESEARCH IN BIOTECHNOLOGY” USAMV Bucharest, Romania, 2011COMPARATIVE STUDY OF NEW INDETERMINATE TOMATOCULTIVARS IN VEGETABLE PRODUCTION AREA OF MATCA:QUALITY ASPECTS1 SC MARCOSER SRL, MATCA, GALATI2 USAMV BUCHARESTM. PETRACHE 1 , C. POHRIB 1 , G. CAMPEANU 2, GABRIELA NEATA 2 ,Abstract. Two new tomato varieties (Lycopersicum esculentum Mill.), hybrids F1 (Amanda F1, LadyRosa F1), with <strong>in</strong><strong>de</strong>term<strong>in</strong>ate growth, Israeli orig<strong>in</strong> from Zeraim Ge<strong>de</strong>ra seed company have beentested for their quality characteristics compare with Menhir F1 (Netherlands, Nunhems seedscompany) as control variety. The tests have been ma<strong>de</strong> <strong>in</strong> the experimental plots of SC MARCOSERSRL from vegetable production area of Matca, Galati County. For these tomato varieties was testedsome agrochemicals parameters and biological factors <strong>in</strong> or<strong>de</strong>r to establish the quality of the tomatofresh fruit. Ascorbic acid levels were found between 12.7 and 15.1 mg per 100g of fresh weight <strong>in</strong> redripe tomatoes and for lycopene the values vary from 19.1 to 23.5 mg/kg of fresh weight. The studyshows that Lady Rosa F1 cultivar has the highest quality comparative with Amanda F1 and MenhirF1.Keywords: tomato hybrid, fruit quality, <strong>in</strong><strong>de</strong>term<strong>in</strong>ate, C vitam<strong>in</strong>, lycopene1. INTRODUCTIONFresh tomato and other tomato products make a significant contribution to humannutrition due to the concentration and availability of several nutrients <strong>in</strong> these products andto their wi<strong>de</strong> spread consumption. Vitam<strong>in</strong> C, ascorbic acid, is a vitam<strong>in</strong> necessary fornormal metabolism, wound heal<strong>in</strong>g and collagen synthesis. Lycopene is the most prom<strong>in</strong>entcarotenoid <strong>in</strong> ripe red tomatoes where it commonly constitutes around 90-99% of the totalcarotenoids (Dumas et al., 2003).Influence of variety and differences <strong>in</strong> the amount of nutrients like potassium,vitam<strong>in</strong>s, antioxidants conta<strong>in</strong>ed <strong>in</strong> different varieties have been confirmed. In the researchof Sahl<strong>in</strong> et al. (2004) it was shown that levels of C vitam<strong>in</strong>, Potassium and antioxidantsvary between tomato varieties.In last ten years was an <strong>in</strong>creased <strong>in</strong>terest from Romanian consumers for highquality tomatoes, quality expressed more by taste and nutritional factors then a perfectshape. These high exigent for quality <strong>de</strong>man<strong>de</strong>d to test and <strong>in</strong>troduce to the market newvarieties to satisfy this shift of consumers expectation.The yield capacity <strong>de</strong>pends on the hereditary base of the cultivars and on theenvironmental conditions, <strong>in</strong>clud<strong>in</strong>g the conditions of culture (Gould, 1992). It also<strong>de</strong>pends on the <strong>in</strong>teraction between the genotype and the environmental conditions (Bletsosand Goulas, 2002; Susic et al., 2002)Zeraim Ge<strong>de</strong>ra Seeds Company, which has ones of the most valuable genetic baseand hybridation l<strong>in</strong>es for tomatoes.218
Proceed<strong>in</strong>g of the 4 rd International Symposium“NEW RESEARCH IN BIOTECHNOLOGY” USAMV Bucharest, Romania, 2011This work aimed to evaluate the quality of three tomato genotypes on titrableacidity (TA), pH, total soluble gluci<strong>de</strong>s, lycopene, ascorbic acid, and potassium, phosphatesand nitrates contents <strong>in</strong> tomato.2. MATERIALS AND METHODSThe experiments was ma<strong>de</strong> at the SC MARCOSER SRL experimental plots, <strong>in</strong> thebiggest cold greenhouse vegetable production area <strong>in</strong> Romania - Matca village, located <strong>in</strong>Galati county <strong>in</strong> the East part of the country <strong>in</strong> the period January-June 2011.For experiments were used two new <strong>in</strong><strong>de</strong>term<strong>in</strong>ate tomato varieties: Amanda F1and Lady Rosa F1 form Zeraim Ge<strong>de</strong>ra, Israel compare with Menhir F1 from NunhemsHolland.The technology of cultivation was standard with small particularities of Matca areatechnology: sow<strong>in</strong>g <strong>in</strong> 10 January, plant<strong>in</strong>g <strong>in</strong> unheated greenhouse <strong>in</strong> 20 March, very earlycycle of only 4 clusters.The analysis was ma<strong>de</strong> dur<strong>in</strong>g <strong>in</strong>tense vegetative <strong>de</strong>velopment of the fruits fornitrates, phosphates and potassium accumulation and after harvest for the rest ofparameters.3. RESULTS AND DISCUSSIONSThe results of analysis for nitrates, phosphates and potassium accumulation dur<strong>in</strong>gvegetative <strong>de</strong>velopment of tomatoes fruits are presented <strong>in</strong> Table 1:Table1. Agrochemical composition of tomato fruitsNo crt Variety N-NO 3 , ppm P-PO 4 , ppm K, ppm05.06.20111 Amanda 238,3 175,8 9862 Lady Rosa 285,2 165,3 11023 Menhir 256,7 156,3 97320.06.20111 Amanda 204,0 198,7 18702 Lady Rosa 219,3 189,3 18903 Menhir 228,2 196,5 195030.06.20111 Amanda 200,7 210,5 15032 Lady Rosa 198,3 215,3 16873 Menhir 204,3 205,4 1489The content of nitrates calculated as average values per variety has oscillated fromhigh values on the beg<strong>in</strong>n<strong>in</strong>g of <strong>de</strong>velopment (285,2 ppm at Lady Rosa F1) to lower valuesat harvest of the fruits (198,3 ppm at Lady Rosa F1). For all cultivars the nitrates quantities219
Proceed<strong>in</strong>g of the 4 rd International Symposium“NEW RESEARCH IN BIOTECHNOLOGY” USAMV Bucharest, Romania, 2011at harvest period are lower than maximum quantities allowed by standards for freshtomatoes fruits (300 ppm), the lower value be<strong>in</strong>g found for Lady Rosa F1.Regard<strong>in</strong>g phosphates and potassium it can be observed that the quantities aregrow<strong>in</strong>g dur<strong>in</strong>g <strong>de</strong>velopment and have high values at harvest which means a very goodquality of tomatoes especially <strong>in</strong> the case of Lady Rosa F1.The results of biochemical parameters of tomatoes fruits are presented <strong>in</strong> Table 2.220Nocrt.Table 2. Biochemical results of tomatoes fruitsC Vitam<strong>in</strong>, SolubleVariety TA, %mg/100g gluci<strong>de</strong>s, %Lycopene,mg/kg1 Amanda 0,510 12,625 4,798 19,118 4,6503 Lady Rosa 0,578 15,100 4,550 23,350 4,3752 Menhir 0,428 16,100 4,780 15,995 4,275The tritable acidity varies from 0,428 % at Menhir F1 cultivar to 0,578% at LadyRosa F1. The ascorbic acid levels <strong>in</strong> fresh fruits analyzed reveal that Menhir F1 has thehighest value of 16,1 mg/100g fresh fruit and the low level it was found at Amanda F1 with12,625 mg/100g fresh fruit.Regard<strong>in</strong>g the soluble gluci<strong>de</strong>s the most tasty cultivar is Amanda F1 with 4,798%concentration of soluble gluci<strong>de</strong>s and also this variety has the high pH of 4,65 comparewith Lady Rosa F1 and Menhir F1 which have 4,375 respectively 4,275.Regard<strong>in</strong>g lycopene quantities the highest value was found at Lady Rosa F1cultivar, this variety hav<strong>in</strong>g the most <strong>in</strong>tense red color compare with the other two cultivars.4. CONCLUSIONSIn the case of agrochemical parameters analyzed it can be say that the nitratesquantities have <strong>de</strong>creased at all varieties tested and the lower value it was found at LadyRosa F1 with 198,3 ppm.Regard<strong>in</strong>g phosphates and potassium accumulation, these two parameters be<strong>in</strong>gresponsible for a good resistance at transport and shelf life of the fruits, all varietiesaccumulated, dur<strong>in</strong>g vegetative <strong>de</strong>velopment high quantities and the best results was foundat Lady Rosa F1 cultivar.From the po<strong>in</strong>t of view of biological factors analyzed all of varieties testedrevealed good results. The high concentration <strong>in</strong> ascorbic acid was found at Menhir F1 andthe highest concentration of gluci<strong>de</strong>s was found at Amanda F1 cultivar. Regard<strong>in</strong>g totalacidity and lycopene concentration the Lady Rosa F1 had the best results.In conclusion all cultivars testes have the quality standards for human consumptionand the best results were found at LADY ROSA F1 cultivar.REFERENCES1. Bletsos, F. A., C. Goulas, 2002, Fresh Consumption Tomato Performance of a LocalLandrace and Derived L<strong>in</strong>es, Acta Horticulturae, 579, 95-100.pH
Proceed<strong>in</strong>g of the 4 rd International Symposium“NEW RESEARCH IN BIOTECHNOLOGY” USAMV Bucharest, Romania, 20112. Dumas Y., Dadomo, M. Di Lucca, G.; Grolier, P. - Effects of environmental factors andagricultural techniques on antioxidant content of tomatoes. J. Sci. Food Agric. 2003, 83,369-3823. Gould, W. A., 1992, Tomato Production, Process<strong>in</strong>g and Quality Evaluation, 3 ed., CTIPublications, <strong>in</strong> Baltimore, MD4. Gould, W. A., 1992, Tomato Production, Process<strong>in</strong>g and Quality Evaluation, 3 ed., CTIPublications, <strong>in</strong> Baltimore, MD.5. Sahl<strong>in</strong> E, Savage GP, Lister CE. 2004. Investigation of the antioxidant properties oftomatoes after process<strong>in</strong>g. J Food Comp Anal 17: 635–647.6. Susic, Z., N. Pavlovic, D. Cvikic, T. Sretenovic-Rajicic, 2002. Studies of correlation betweenyield and fruit characteristics of (Lycopersicon esculentum Mill.) hybrids and their parentalgenotypes, Acta Horticulturae., 579, 163-166.221
Proceed<strong>in</strong>g of the 4 rd International Symposium“NEW RESEARCH IN BIOTECHNOLOGY” USAMV Bucharest, Romania, 2011STUDIES REGARDING THE EFFECT OF MULCHING WITHTRANSPARENT FILM IN GREENHOUSES OF MATCA VEGETABLEAREA ON QUALITY OF TOMATOES1 SC MARCOSER SRL, MATCA, GALATI2 USAMV BUCHARESTC. POHRIB 1 , M. PETRACHE 1 , G. CAMPEANU 2, GABRIELA NEATA 2Abstract. A study was carried out to <strong>de</strong>term<strong>in</strong>e the effect of mulch<strong>in</strong>g with transparent film compareto no mulch<strong>in</strong>g on quality of cv. AMANDA F1 tomato fruits (Lycopersicum esculentum Mill.) <strong>in</strong> coldgreenhouses <strong>in</strong> vegetable area of Matca. Total nitrogen, total phosphate, total potassium,microelements, acidity, C vitam<strong>in</strong>, soluble gluci<strong>de</strong> and lycopene were <strong>de</strong>term<strong>in</strong>ed dur<strong>in</strong>g the harvestperiod. The study shows that mulch<strong>in</strong>g had a positive effect on fruit quality.F1.Keywords: mulch<strong>in</strong>g, transparent film, cold greenhouse, tomato, quality1. INTRODUCTIONThe advantages of us<strong>in</strong>g plastic mulches for the production of high-valuevegetable crops have been recognized s<strong>in</strong>ce the late 1950s (Emmert 1957, Schales andSheldrake 1965, Waggoner et al. 1960). Polyethylene (PE) mulches have <strong>in</strong>duced large<strong>in</strong>creases <strong>in</strong> growth and yields for a variety of crops, <strong>in</strong>clud<strong>in</strong>g tomato (TAKATORI et al.,1964; VANDENBERG & TIESSEN, 1972; MULLINS et al., 1992; LAMONT Jr., 1993).These growth and yield <strong>in</strong>creases have been attributed to changes <strong>in</strong> soil and airtemperature near the cover, soil water balance, and nutrient availability compared tounmulched soil (CLARKSON & FRAZIER, 1957; CLARKSON, 1960; BRUNINI et al.,1976; HAYNES, 1987).In this study was analyzed the quality parameters of tomato fresh fruit <strong>in</strong>greenhouse with transparent film mulch<strong>in</strong>g compare with unmulched greenhouse.2. MATERIALS AND METHODSThe experiments was ma<strong>de</strong> at the SC MARCOSER SRL experimental plots, <strong>in</strong> thebiggest cold greenhouse vegetable production area <strong>in</strong> Romania - Matca village, located <strong>in</strong>Galati county <strong>in</strong> the East part of the country <strong>in</strong> the period January-June 2011.There was used two greenhouses of 400 sqm (20mx20m), <strong>in</strong> one (V1) was<strong>in</strong>stalled transparent film on all soil surface and <strong>in</strong> second greenhouse wasn’t <strong>in</strong>stalled themulch film (M0).In both greenhouses was planted a very early maturity, Amanda F1 tomato varietyfrom Zeraim Ge<strong>de</strong>ra, Israel.Distance between rows: 60 x 90 cm.Distance between plants: 30 cmDensity: 45 000 plants/ha.222
Proceed<strong>in</strong>g of the 4 rd International Symposium“NEW RESEARCH IN BIOTECHNOLOGY” USAMV Bucharest, Romania, 2011For experiment were monitored 10 plants <strong>in</strong> 3 random repetitions <strong>in</strong> bothgreenhouses.The parameters analyzed were total nitrogen, total phosphate, total potassium,microelements, acidity, C vitam<strong>in</strong>, soluble gluci<strong>de</strong> and lycopene for tomatoes fresh fruitsafter harvest.3. RESULTS AND DISCUSSIONSFrom Table 1 it can be seen that the fruits from V1 (the greenhouse with mulchfilm) accumulated more dry weight the M0 variant and also the conductivity is higher.Table 1. Values for dry weight, pH and conductivityGreenhouseDry weight(%)pHConductivity(mS/cm)M0 (without mulch) 6,8 4,25 5,1V1 (with mulch 7 4,31 5,12Regard<strong>in</strong>g accumulation of total nitrogen, total phosphate and potassium there isdifference of results as next: the total nitrogen is lower <strong>in</strong> V1 (0,2667%) than M0(0,2386%) that suggest<strong>in</strong>g a better f<strong>in</strong>al quality for the tomato fruits which are grow<strong>in</strong>gwith mulch film. Regard<strong>in</strong>g phosphate and potassium (Table 2) the results suggest a higheraccumulation of these elements <strong>in</strong> the tomato fruit from the greenhouse with mulch film. Abig concentration of potassium <strong>in</strong> tomato fruits will make a higher resistance of the fruit attransport and a longer shelf life.Table 2. Total nitrogen, phosphate and potassium (% from dry weight)Greenhouse Nt (%) P2O5 (%) K2O (%)M0 (without mulch) 0,2667 0,059 0,3V1 (with mulch 0,2386 0,06 0,31Regard<strong>in</strong>g concentrations of microelements there are different results, if theconcentration for Cu, Zn and Fe are lower <strong>in</strong> the greenhouse without mulch<strong>in</strong>g film for Mn,Mg and Ca the concentrations are lower <strong>in</strong> the greenhouse with plastic mulch (Table 3 andTable 4).Table 3. Concentration of Cu, Zn, Mn and Fe ((% from dry weight)Greenhouse Cu (ppm) Zn (ppm) Mn (ppm) Fe (ppm)M0 (without mulch) 0,41 0,96 0,93 3,65V1 (with mulch 0,65 1,19 0,91 5,36223
224Proceed<strong>in</strong>g of the 4 rd International Symposium“NEW RESEARCH IN BIOTECHNOLOGY” USAMV Bucharest, Romania, 2011Table 4. Concentration of Mg and Ca(% from dry weight)Greenhouse Mg (ppm) Ca (ppm)M0 (without mulch) 124,85 106,59V1 (with mulch 118,4 79,4Regard<strong>in</strong>g biochemical parameters tested the results revealed that the levels ofascorbic acids and lycopene are higher <strong>in</strong> the mulched greenhouse compare withunmulched greenhouse (Table 5).GreenhouseM0 (withoutmulch)Acidity,%Table 5. Biochemical parametersAscorbic acid, Soluble gluci<strong>de</strong>s,mg/100gp.p.%Lycopene,mg/kg0,56 12,4 4,81 13V1 (with mulch 0,56 12,6 4,8 29,65As it shows <strong>in</strong> Table 5 the soluble gluci<strong>de</strong>s concentration is higher <strong>in</strong> M0 and theacidity is the same <strong>in</strong> both experimental variants.4. CONCLUSIONSThe results obta<strong>in</strong> <strong>in</strong> this study show that <strong>in</strong> both experimental variants can beproduced tomato fruits which has the quality for human consumption.With small exceptions regard<strong>in</strong>g some microelements and soluble gluci<strong>de</strong>s the restof agrochemical and biochemical analyses ma<strong>de</strong> <strong>in</strong> this study reveal that grow<strong>in</strong>g tomatoes<strong>in</strong> greenhouses with transparent mulch film has a positive <strong>in</strong>fluence on the quality of freshfruit tomatoes.REFERENCES1. Bragantia, v.35, n.4, p.49-54, 1976. HAYNES, R.J. The use of polyethylene mulches to changesoil microclimate as revealed by enzyme activity and biomass nitrogen, sulphur andphosphorus. Biology and Fertility of Soil, v.5, n.3, p.235-40, 1987.2. BRUNINI, O., SANTOS, J.M., ALFONSI, R.R., et al. Estudo micrometeorológico comcenouras (Varieda<strong>de</strong> Nantes): I. Influência da temperatura do solo.3. CLARKSON, V. A. Effect of black polyethylene mulch on soil and microclimate temperatureand nitrate level. Agronomy Journal, v.52, n.6, p.307-9, 1960.4. CLARKSON, V. A.; FRAZIER, W. A. Effect of paper and polyetylene mulches and plastic capson cantaloupe yields and earl<strong>in</strong>ess. Proceed<strong>in</strong>gs of American Society for HorticulturalScience, v.69, p.401-4, 1957.5. Emmert, E. 1957. Black polyethylene for mulch<strong>in</strong>g vegetables. Proceed<strong>in</strong>gs, American Societyof Horticultural Science 69: 464-469.6. LAMONT Jr., W.J. Plastic mulches for the production of vegetable crops. Hort Tecnology,v.3, n.l, p.35-9, 1993.
Proceed<strong>in</strong>g of the 4 rd International Symposium“NEW RESEARCH IN BIOTECHNOLOGY” USAMV Bucharest, Romania, 20117. MULLINS, C.A.; STRAW, R.A.; RUTLEDGE, A.D. Tomato production with fertigation andblack plastic mulch. Tennessee Farm and Home Science, p.23-8, 1992.8. Schales, F.D. and R. Sheldrake. 1965. Mulch effects on soil conditions and muskmelonresponse. Proceed<strong>in</strong>gs, American Society for Horticultural Science 88: 425-430.9. TAKATORI, F.H., LIPPERT, L.F., WHITING, F.L. The effect of petroleum mulch andpolyethylene films on soil temperature and plant growth. Proceed<strong>in</strong>gs of American Society forHorticultural Science, v.85, p.532-40, 1964.10. VANDENBERG, J.; TIESSEN, H. Influence of wax-coated and polyethylene-coated papermulch on growth and flower<strong>in</strong>g of tomato. HortScience, v.7, n.5, p. 464-65, 1972.11. Waggoner, P.E., P.M. Miller, and H.C. DeRoo. 1960. Plastic mulch<strong>in</strong>g: Pr<strong>in</strong>ciples andbenefits. Connecticut Agricultural Experiment Station Bullet<strong>in</strong>, <strong>New</strong> Haven 634-44 pp.225
Proceed<strong>in</strong>g of the 4 rd International Symposium“NEW RESEARCH IN BIOTECHNOLOGY” USAMV Bucharest, Romania, 2011THE INFLUENCE OF RIPENING TEMPERATURE ON DIVERSITY OFNON-STARTER LACTIC BACTERIA IN SEMI-HARD CHEESESKey words: NSLAB, cheese, ripen<strong>in</strong>g, Lactobacillus spp.INGA CIPROVICA 1 , ALLA MIKELSONEThe role of non-starter lactic bacteria (NSLAB) <strong>in</strong> <strong>de</strong>term<strong>in</strong>ation of cheese quality is stillunclear. The only way how to ensure quality of cheese is corrections <strong>in</strong> technological process. Theaim of the study was to evaluate impact of the selected ripen<strong>in</strong>g temperature on the growth rate ofNSLAB <strong>in</strong> Latvian semi-hard Holan<strong>de</strong>s and Krievijas cheeses.The samples of unripened semi-hard cheeses have been analysed. Cheeses were producedat two cheese factories and ripened at laboratories of LUA for 60 days at 6 and 12 °C. Both ripen<strong>in</strong>gregimes help un<strong>de</strong>rstand better the <strong>in</strong>fluence of microflora on the quality of cheese, <strong>in</strong>clud<strong>in</strong>g theformation of sensory properties.The follow<strong>in</strong>g analyses are performed <strong>in</strong> the study: pH, water activity (a w ), CFU ofLactobacillus spp., i<strong>de</strong>ntification of Lactobacillus species and isolation of DNA for confirmation ofisolated Lactobacillus species. The obta<strong>in</strong>ed sequences are analysed at Sta<strong>de</strong>n Package 1.6.0 releaseand compared to sequences available <strong>in</strong> the BLAST (www.ncbi.nlm.nih.gov.)In or<strong>de</strong>r to control the rate of cheese ripen<strong>in</strong>g and the growth dynamics of mesophilicNSLAB, some researchers have suggested <strong>de</strong>creas<strong>in</strong>g of ripen<strong>in</strong>g temperature. Decreas<strong>in</strong>g ofripen<strong>in</strong>g temperature slows down the growth rate of mesophilic NSLAB, but it is impossible toliberate cheese from their presence. The differences are observed <strong>in</strong> qualitative composition of cheesemicroflora. L.curvatus dom<strong>in</strong>ated dur<strong>in</strong>g the rest of the ripen<strong>in</strong>g time at 6 °C and L.plantarum 1 was<strong>de</strong>tected at 12°C <strong>in</strong> cheese samples. DNA fragment sequenc<strong>in</strong>g of most frequently i<strong>de</strong>ntifiedL.plantarum 1 and L.curvatus revealed that nucleoti<strong>de</strong> sequence of L.curvatus of ripened cheese at6°C for 60 days conforms with the stra<strong>in</strong> L.paracesei subsp. paracasei JCM8133; <strong>in</strong> cheese ripenedat 12 °C for 60 days - L.paracasei MH55. In their turn, the isolated L.plantarum 1 from cheesesamples ripened at 12 °C for 60 days conform to L.plantarum DSPV 354T.This study reveals that the concentration of NSLAB differs between cheeses ripened at 6 °C(5.26-6.90 log CFU g -1 ) and 12 °C (5.26-7.62 log CFU g -1 ) at least by 1 log. Higher concentrationswere found <strong>in</strong> cheeses ripened at 12 °C. These f<strong>in</strong>d<strong>in</strong>gs should be tak<strong>in</strong>g account, because thetemperature at ripen<strong>in</strong>g is subord<strong>in</strong>ated to the rate of biochemical processes <strong>in</strong> manufacture of aparticular cheese variety. Any change has a significant impact on the whole complex of sensoryproperties of cheese.1. INTRODUCTIONRaw milk is a natural growth medium for microorganisms. Compositionand quality of milk microflora are <strong>de</strong>term<strong>in</strong>ed not only by hygiene observation <strong>in</strong>the places of milk production, rapidity of milk cool<strong>in</strong>g and temperature, but also bymicroflora <strong>in</strong> the air of dairy environment, on the surface of equipments and1 Latvia University of Agriculture Faculty of Food Technology2 Liela street, Jelgava, LV 3001, LATVIA, phone/fax +371 63022829, E-mail: Inga.Cipovica@llu.lv226
Proceed<strong>in</strong>g of the 4 rd International Symposium“NEW RESEARCH IN BIOTECHNOLOGY” USAMV Bucharest, Romania, 2011premises. An <strong>in</strong>tegral part of milk microflora is non-starter lactic acid bacteria.Pasteurization regime selected <strong>in</strong> cheese manufactur<strong>in</strong>g is able to <strong>de</strong>stroy essentialmicroflora, enzymes and pathogens <strong>in</strong> milk. It should be noted that <strong>in</strong>activationlevel of microorganisms <strong>de</strong>pends on the count of microorganisms, growth phaseand other factors. Bactofugation, microfiltration, and application of food additives,cannot significantly <strong>de</strong>crease the proportion of Lactobacillus spp. and Leuconostocspp. <strong>in</strong> milk. Defects caused by non-starter lactic acid bacteria are found <strong>in</strong> all dairyproducts, but the most problematic they are <strong>in</strong> cheeses.Early blow<strong>in</strong>g caused by non-starter lactic acid bacteria is often mixed upwith coliform bacteria. Non-starter lactic acid bacteria, mostly heterofermentative,produce diacetyl and aceto<strong>in</strong>, and high amounts of carbon dioxi<strong>de</strong>. Carbon dioxi<strong>de</strong>forms many small holes <strong>in</strong> cheese, and sometimes a significant gas pressure results<strong>in</strong> a sponge-like cheese texture. I<strong>de</strong>ntical <strong>de</strong>fect is caused by coliform bacteria.This <strong>de</strong>fect occurs dur<strong>in</strong>g the beg<strong>in</strong>n<strong>in</strong>g of cheese ripen<strong>in</strong>g while there is lactose <strong>in</strong>it. Technological methods to fight coliform bacteria differ as well. If milk isproduced accord<strong>in</strong>g to hygienic requirements, food additives are not necessary for<strong>de</strong>creas<strong>in</strong>g of activity of coliform bacteria. Over consumption of sodiumnitrate/sodium nitrite is not beneficial for consumers. Cheesemakers are confusedabout the <strong>de</strong>fect, its orig<strong>in</strong> and possible solution. Enzymes produced byLactobacillus spp. are able to hydrolyze case<strong>in</strong> form<strong>in</strong>g bitter pepti<strong>de</strong>s, which<strong>in</strong>fluence flavour characteristics of cheese.The non-starter lactic acid bacteria could not be evaluatedunambiguously. Individual stra<strong>in</strong>s of species are used for acceleration ofcheese ripen<strong>in</strong>g, stimulation of hydrolysis of prote<strong>in</strong>s and enhancement ofconcentration of free am<strong>in</strong>o acids contribut<strong>in</strong>g to flavour and aroma of awell ripened cheese. It should be noted that the role of non-starter lactic acidbacteria <strong>in</strong> <strong>de</strong>term<strong>in</strong>ation of the cheese quality is still unclear. The aim ofthe study was to evaluate impact of the selected ripen<strong>in</strong>g temperature on thegrowth rate of NSLAB <strong>in</strong> Latvian semi-hard Holan<strong>de</strong>s and Krievijascheeses.2.MATERIALS AND METHODSThe samples (n=18) of unripened semi-hard Krievijas and Holan<strong>de</strong>scheeses have been chosen for analysis. Cheeses were produced at two cheesefactories <strong>in</strong> Latvia and ripened at laboratories of Latvia University of Agriculture.Cheeses are manufactured accord<strong>in</strong>g to the technical requirements of the enterpriseor the Branch Standards: LPCS 10: 2001 and LPCS 11: 2001. The technology of227
Proceed<strong>in</strong>g of the 4 rd International Symposium“NEW RESEARCH IN BIOTECHNOLOGY” USAMV Bucharest, Romania, 2011cheeses is related to Gouda type cheeses, there are some differences regard<strong>in</strong>g toad<strong>de</strong>d amount of starter, pH of gra<strong>in</strong>s and whey mixture before heat<strong>in</strong>g forHolan<strong>de</strong>s cheese and prolonged press<strong>in</strong>g before br<strong>in</strong><strong>in</strong>g of Krievijas cheese for<strong>in</strong>tensification of lactic acid fermentation process.The samples of unripened cheese were packed <strong>in</strong> a polymer material film,and ripened for 60 days at 6 °C and 12 °C. Ripen<strong>in</strong>g temperature was chosentak<strong>in</strong>g as a basis conclusions <strong>in</strong> research articles relat<strong>in</strong>g variability of microflora(6 °C), and the recommen<strong>de</strong>d ripen<strong>in</strong>g parameters (12 °C) for Krievijas andHolan<strong>de</strong>s cheeses. The both ripen<strong>in</strong>g regimes help un<strong>de</strong>rstand better the <strong>in</strong>fluenceof microflora on the quality of cheese, <strong>in</strong>clud<strong>in</strong>g the formation of sensoryproperties.Determ<strong>in</strong>ation of the pH was performed to cheese samples, accord<strong>in</strong>g toLVS ISO 5546:2010 ‘Case<strong>in</strong>s and case<strong>in</strong>ates – <strong>de</strong>term<strong>in</strong>ation of the pH’, by us<strong>in</strong>gpH-meter, 3520 pH Meter’-JENWAY (Barloworld Scientific Ltd., Essex, UK).Determ<strong>in</strong>ation of water activity was performed for cheese samples, byus<strong>in</strong>g Meter AquaLab LITE (Decagon Inc, USA). Samples for <strong>de</strong>term<strong>in</strong>ation ofwater activity were measured with accuracy ± 0,015. Prior to sample analyz<strong>in</strong>gcalibration of the equipment was performed by means of 0.5M KCl (Lot 932375,Decagon).Determ<strong>in</strong>ation of Lactobacillus spp. was performed <strong>in</strong> analysed samples, accord<strong>in</strong>gto LVS ISO 15214:1998 by us<strong>in</strong>g MRS agar media (Scharlau, Spa<strong>in</strong>). Media wasprepared accord<strong>in</strong>g to LVS CEN ISO/TS 11133-1:2009. Sample dilutions wereperformed accord<strong>in</strong>g to LVS EN ISO 8261:2002 and ISO 6887-5:2010.Colony form<strong>in</strong>g units of the lactic acid bacteria were <strong>de</strong>term<strong>in</strong>ed by meansof ISO 15214:1998. The chosen parameters for cultivation of lactic acid bacteria <strong>in</strong>MRS agar were 72 hours at 37 °C, tak<strong>in</strong>g as a basis regimes recommen<strong>de</strong>d <strong>in</strong> thescientific literature (Coeuret et al., 2003).I<strong>de</strong>ntification of Lactobacillus spp. colonies was performed tak<strong>in</strong>g as a basisfermentation of carbohydrates by us<strong>in</strong>g API 50 CHL (BioMerieux, France). Theprogram APILAB Plus version 4.0 (BioMerieux) was used for i<strong>de</strong>ntification of theisolated colonies up to species.Isolation of DNA was performed for most frequently i<strong>de</strong>ntifiedrepresentatives of Lactobacillus spp. species - L.plantarum 1, L.curvatus, by us<strong>in</strong>gPowerSoil DNA Isolation Kit (MO BIO Laboratories Inc.).Polymerase cha<strong>in</strong> reaction analysis was performed for confirmation of theisolated Lactobacillus species. The obta<strong>in</strong>ed sequences were analyzed at Sta<strong>de</strong>nPackage 1.6.0. release (http://sta<strong>de</strong>n.sourceforge.net/) and compared to sequencesavailable <strong>in</strong> the data base BLAST (www.ncbi.nlm.nih.gov ).Data analyse was performed by us<strong>in</strong>g StatistiXL and Microsoft Excel programs.228
Proceed<strong>in</strong>g of the 4 rd International Symposium“NEW RESEARCH IN BIOTECHNOLOGY” USAMV Bucharest, Romania, 20113. RESULTSIn the beg<strong>in</strong>n<strong>in</strong>g of cheese ripen<strong>in</strong>g the concentration of starter lactic acidbacteria <strong>de</strong>creases rapidly, thus liberat<strong>in</strong>g space for multiplication of non-starterlactic acid bacteria.In the Tables 1, summarization about the lactic acid bacteria speciesisolated from Krievijas cheese is provi<strong>de</strong>d, as well as variability of species un<strong>de</strong>rthe <strong>in</strong>fluence of temperature and duration of ripen<strong>in</strong>g is given.In the beg<strong>in</strong>n<strong>in</strong>g of ripen<strong>in</strong>g Krievijas cheese II presence of starter microflorawas <strong>de</strong>tected and prevalence of L.curvatus until the 30 th ripen<strong>in</strong>g day attemperature 6 °C was observed. From a sample ripened for 45 days at temperature6 °C L.helveticus was isolated. Williams and Banks (1997) report on isolation ofL.helveticus from Cheddar cheese ripened for 6 – 9 months, consi<strong>de</strong>r<strong>in</strong>g thisspecies as non-starter lactic acid bacteria. Dur<strong>in</strong>g ripen<strong>in</strong>g of Krievijas cheese I andII at temperature 12 o C, a presence of L.plantarum 1 was <strong>de</strong>tected.Table 2The changes of Lactobacillus spp. dur<strong>in</strong>g Krievijas cheese ripen<strong>in</strong>gRipen<strong>in</strong>gat 6 o Cat 12 o Ctime, days Krievijas cheese I Krievijas cheese II Krievijas cheese I Krievijas cheese IILc.lactisLc.lactis subsp.lactis 1,Lc.lactis subsp.lactis 1, Lc.lactis subsp.lactisUnripened subsp.lactis 1, Lc.lactisL.curvatus 1, Lc.lactisL.curvatus subsp.lactis 2,subsp.lactis 2,L.curvatusL.curvatus15 daysLc.lactis subsp.lactis 2,L.curvatusL.plantarum 130 days L.curvatus45 daysL.curvatusL.helveticus L.curvatus L.plantarum S460 daysL.paracasei subsp.paracasei JCM 8133L.paracasei MH55,L.plantarum DSPV354TDNA fragment sequenc<strong>in</strong>g of most frequently i<strong>de</strong>ntified L.plantarum 1 andL.curvatus revealed that nucleoti<strong>de</strong> sequence of L.curvatus of ripened cheese for 60days at 6 °C conforms to the stra<strong>in</strong> L.paracasei subsp.paracasei JCM 8133, but <strong>in</strong>cheese ripened for 60 days at 12 °C – to the stra<strong>in</strong> L.paracasei MH55. In their turn,the isolated L.plantarum 1 from cheese samples ripened for 45 and 60 days at 12°C conform to the stra<strong>in</strong>s L.plantarum S4 and L.plantarum DSPV 354Trespectively.API 50 CHL system applied for i<strong>de</strong>ntification of Lactobacillusphenotypically showed satisfactory results when <strong>de</strong>term<strong>in</strong><strong>in</strong>g genus ofmicroorganisms. Accord<strong>in</strong>g to Tynkkynen (1999) and co-authors, its precision isconsi<strong>de</strong>rably lower when i<strong>de</strong>ntify<strong>in</strong>g microorganisms up to species. This could beexpla<strong>in</strong>ed by the fact that the system <strong>in</strong>itially was <strong>in</strong>ten<strong>de</strong>d for i<strong>de</strong>ntification of229
Proceed<strong>in</strong>g of the 4 rd International Symposium“NEW RESEARCH IN BIOTECHNOLOGY” USAMV Bucharest, Romania, 2011Lactobacillus genus for medical needs (Coeuret et al., 2003) as a supplementarysystem for atypical fermentation mo<strong>de</strong>ls (Arhné et al., 1989; Chamba, 2000;Coeuret et al., 2003). Muyanja (2003), Temmerman (2004) and co-authorsconclu<strong>de</strong>d that the phenotypical methods are limited <strong>in</strong> respect of reproductivity,with low taxonomic resolution, and they often allow i<strong>de</strong>ntification only at the levelof genus.Table 3The changes of Lactobacillus spp. dur<strong>in</strong>g Holan<strong>de</strong>s cheese ripen<strong>in</strong>gRipen<strong>in</strong>gat 6 o Cat 12 o Ctime, days Holan<strong>de</strong>s cheese I Holan<strong>de</strong>s cheese II Holan<strong>de</strong>s cheese I Holan<strong>de</strong>s cheese IILc.lactisLc.lactisLc.lactis subsp.lactis 2,subsp.lactis 2, subsp.lactis 1,UnripenedLc.lactis subsp.lactis 1Lc.lactisLc.lactisLc.lactis subsp.lactis 1,subsp.lactis 1 subsp.lactis 2Lc.lactis subsp.lactis 215 days30 days45 days60 days230Lc.lactis subsp.lactis 1,L. paracaseisubsp.paracasei 1L. paracaseisubsp.paracasei 2,L.curvatusL. paracaseisubsp.paracasei 1, L.curvatusL. paracaseisubsp.paracasei 2L. paracaseisubsp.paracasei 1,L. paracaseisubsp.paracasei 3L. paracaseisubsp.paracasei 3,L.curvatusL.curvatusL. paracaseisubsp.paracasei 2,L.rhamnosusL. paracaseisubsp.paracasei 1,L. paracaseisubsp.paracasei 2L. paracaseisubsp.paracasei 1L. paracaseisubsp.paracasei 1,L.rhamnosusLc.lactis subsp.lactis2, L. paracaseisubsp.paracasei 1L.plantarum 1In the unripened Holan<strong>de</strong>s cheese I and II presence of starter microflorawas <strong>de</strong>tected (Tab. 2). In Holan<strong>de</strong>s cheese I, start<strong>in</strong>g from the 15 th day of ripen<strong>in</strong>guntil the end of ripen<strong>in</strong>g, L. paracasei subsp.paracasei dom<strong>in</strong>ated. From thesample ripened at temperature 6 °C, L.curvatus was isolated as well, but from thesample ripened at 12 °C - L.rhamno Holan<strong>de</strong>s cheese II dom<strong>in</strong>ation of L. paracaseisubsp.paracasei was observed until the 45 th day, ripen<strong>in</strong>g at temperature 6 o C, andprevalence of L.plantarum 1 from the 30 th until the 60 th day of ripen<strong>in</strong>g, attemperature 12 o C. Accord<strong>in</strong>g to the data by Copolla et al. (1997) and Fitzsimons(1999), most frequently L.casei, L.paracasei, L.plantarum, L.rhamnosus andL.curvatus are isolated from cheeses.Accord<strong>in</strong>g to the f<strong>in</strong>d<strong>in</strong>gs by Fitzsimons et al. (2001) and Williams et al.(2002), the dom<strong>in</strong>at<strong>in</strong>g non-starter lactic acid bacteria species usually changedur<strong>in</strong>g the cheese ripen<strong>in</strong>g, and are represented by one Lactobacillus species by theend of ripen<strong>in</strong>g. In the op<strong>in</strong>ion of these authors, L.paracasei, L.plantarum andL.brevis dom<strong>in</strong>ate <strong>in</strong> unripened cheeses, but L.paracasei – <strong>in</strong> ripened cheeses.
Proceed<strong>in</strong>g of the 4 rd International Symposium“NEW RESEARCH IN BIOTECHNOLOGY” USAMV Bucharest, Romania, 2011Diversity of microflora and its growth <strong>in</strong>tensity <strong>in</strong> analyzed cheeses <strong>de</strong>pend onwater activity, salt content, pH, ripen<strong>in</strong>g temperature and oxidation-reductionpotential. Therefore the dynamics of the colony form<strong>in</strong>g units of non-starter lacticacid bacteria un<strong>de</strong>r the <strong>in</strong>fluence of some factors is evaluated.Quantity of microflora is characterized by the count of colony form<strong>in</strong>gunits of lactic acid bacteria <strong>in</strong> experimental Krievijas (Fig. 1) and Holan<strong>de</strong>s (Fig. 2)cheeses.Non-starter lactic acid bacteria growth rate <strong>in</strong> the beg<strong>in</strong>n<strong>in</strong>g of ripen<strong>in</strong>gwas observed <strong>in</strong> Krievijas cheeses I and II, moreover, the growth rate was higher at12 °C than at temperature 6 °C. More rapid growth rates are expla<strong>in</strong>ed bytemperature closer to optimum of the mesophilic bacteria activity and availabilityof nutrients.Shakel-Ur-Rehman (2000) and co-authors report that <strong>in</strong> cheese ripened attemperature 1 °C, population of the non-starter lactic acid bacteria is for 3 log lessthan <strong>in</strong> cheese ripened at 8 °C. Other authors have similar op<strong>in</strong>ions that ripen<strong>in</strong>gtemperature <strong>in</strong>fluences consi<strong>de</strong>rably the growth of non-starter lactic acid bacteria <strong>in</strong>cheese (Folkertsma et al., 1996; Fenelon et al., 1999).1-Krievijas cheese I, 6 o C; 2-Krievijas cheese I, 12 o C; 3-Krievijas cheese II, 6 o C; 4-Krievijas cheese II,12 o CFigure 1. The dynamics of colony form<strong>in</strong>g units of non-starter lactic acid bacteria <strong>in</strong>Krievijas cheeses dur<strong>in</strong>g ripen<strong>in</strong>gWhen analyz<strong>in</strong>g Holan<strong>de</strong>s cheeses, similar situation was observed.Lactobacillus spp. its maximum concentration <strong>in</strong> Holan<strong>de</strong>s cheese I and II reachedaround the 30 th day when ripened at 12 °C, and around the 45 th day, when ripenedat 6 °C. Changes <strong>in</strong> the count of colony form<strong>in</strong>g units of non-starter lactic acid231
Proceed<strong>in</strong>g of the 4 rd International Symposium“NEW RESEARCH IN BIOTECHNOLOGY” USAMV Bucharest, Romania, 2011bacteria show that their <strong>in</strong>crease <strong>de</strong>pends on temperature at ripen<strong>in</strong>g, compositionand characteristics of the starter, availability of nutrients and other factors.1-Holan<strong>de</strong>s cheese I, 6 o C; 2-Holan<strong>de</strong>s cheese I, 12 o C; 3-Holan<strong>de</strong>s cheese II, 6 o C; 4-Holan<strong>de</strong>s cheeseII, 12 o CFigure 2. The dynamics of colony form<strong>in</strong>g units of non-starter lactic acid bacteria <strong>in</strong>Holan<strong>de</strong>s cheeses dur<strong>in</strong>g ripen<strong>in</strong>gpH is one of the most important factors dur<strong>in</strong>g cheese ripen<strong>in</strong>g, enhanc<strong>in</strong>gactivity of enzymes and regulat<strong>in</strong>g the growth of microorganisms. Due toproduction technology peculiarities of Krievijas cheese, the pH <strong>in</strong> cheese afterpress<strong>in</strong>g rises up to 5.2 – 5.3. The most part of lactose is fermented till br<strong>in</strong><strong>in</strong>g,creat<strong>in</strong>g characteristic acidity of Krievijas cheese (pH 5.22 – 5.25), whichcorresponds to the results of Krievijas cheeses I and II (Fig. 3), respectively, pH5.25 and 5.22.Increase of pH <strong>in</strong> Krievijas cheeses dur<strong>in</strong>g the beg<strong>in</strong>n<strong>in</strong>g of ripen<strong>in</strong>g up tothe 15 th day must be expla<strong>in</strong>ed by cont<strong>in</strong>uation of lactic acid fermentation and useof lactic acid <strong>in</strong> further chemical processes. Dispersion analysis revealedsignificant differences (p
Proceed<strong>in</strong>g of the 4 rd International Symposium“NEW RESEARCH IN BIOTECHNOLOGY” USAMV Bucharest, Romania, 20111-Krievijas cheese I, 6 o C; 2-Krievijas cheese I, 12 o C; 3-Krievijas cheese II, 6 o C; 4-Krievijas cheeseII, 12 o CFigure 3. The dynamics of pH <strong>in</strong> Krievijas cheeses dur<strong>in</strong>g ripen<strong>in</strong>gIn or<strong>de</strong>r to make sure of <strong>in</strong>fluence of the pH on the water activity, correlationanalysis of the mentioned parameters was performed. The obta<strong>in</strong>ed results reveal astrong negative l<strong>in</strong>ear correlation (Krievijas cheeses r=0.87; Holan<strong>de</strong>s cheesesr=86) between the parameters un<strong>de</strong>r study. This supports op<strong>in</strong>ion of several authors(Fox et al., 2000; Folkertsma et al., 1996; Aston et al., 1985) that dur<strong>in</strong>g cheesematuration while the amount of water-soluble nitrogen compounds and the use oflactic acid <strong>in</strong>crease, the rise of the pH value and reduction of water activity takesplace. Water activity <strong>in</strong> experimental Krievijas cheeses dur<strong>in</strong>g ripen<strong>in</strong>g varied from0.994 up to 0.960, but <strong>in</strong> Holan<strong>de</strong>s cheeses from 0.995 up to 0.971.1-Holan<strong>de</strong>s cheese I, 6 o C; 2-Holan<strong>de</strong>s cheese I, 12 o C; 3-Holan<strong>de</strong>s cheese II, 6 o C; 4-Holan<strong>de</strong>s cheeseII, 12 o CFigure 4. The dynamics of pH of Holan<strong>de</strong>s cheeses dur<strong>in</strong>g ripen<strong>in</strong>g233
234Proceed<strong>in</strong>g of the 4 rd International Symposium“NEW RESEARCH IN BIOTECHNOLOGY” USAMV Bucharest, Romania, 2011In or<strong>de</strong>r to control the rate of cheese ripen<strong>in</strong>g and the growth dynamics ofmesophilic non-starter lactic acid bacteria, some researchers have suggested<strong>de</strong>creas<strong>in</strong>g of ripen<strong>in</strong>g temperature. Decreased ripen<strong>in</strong>g temperature slows downthe growth rate of mesophilic non-starter lactic acid bacteria, but it is impossible toliberate cheese from their presence. Also this study reveals that the concentrationof non–starter lactic acid bacteria differs between cheeses ripened at 6 and12 ° C at least by 1 log. Higher concentrations were found <strong>in</strong> cheeses ripened at12 ° C. These f<strong>in</strong>d<strong>in</strong>gs should be tak<strong>in</strong>g <strong>in</strong>to account, because the temperature atripen<strong>in</strong>g is subord<strong>in</strong>ated to the rate of biochemical processes <strong>in</strong> manufacture of aparticular cheese variety. Any change has a significant impact on the wholecomplex of the sensory properties of cheese.4. CONCLUSIONS1. I<strong>de</strong>ntified Lactobacillus spp. well-adapted to variable parameters of cheeseripen<strong>in</strong>g, and their population and growth rate are <strong>de</strong>pendant on diversity ofsubstrate <strong>in</strong> cheeses.2. The prevalence species of non-starter lactic acid bacteria <strong>in</strong> cheeses variesdur<strong>in</strong>g ripen<strong>in</strong>g and at the end of ripen<strong>in</strong>g were represented by one species ofLactobacillus genus, more often L.curvatus, L.paracasei subsp.paracasei or L.plantarum.3. Diversity of lactic acid bacteria species <strong>in</strong> Krievijas and Holan<strong>de</strong>s cheeses<strong>de</strong>pends on selected ripen<strong>in</strong>g temperature and time. Representatives ofLactobacillus genus and its colony form<strong>in</strong>g units differs between same varietycheeses manufactured at different plants.4. The close correlation was <strong>de</strong>term<strong>in</strong>ed between changes of pH and a w <strong>in</strong>analyzed Krievijas and Holan<strong>de</strong>s cheeses. This <strong>in</strong>dicates <strong>in</strong>tensity ofbiochemical and microbiological processes dur<strong>in</strong>g ripen<strong>in</strong>g.REFERENCES1. Arhné, S., Mol<strong>in</strong>, G., Stahl, S. (1989) Plasmids <strong>in</strong> Lactobacillus stra<strong>in</strong>s isolated from meat andmeat products, Systematic and Applied Microbiology, Vol.11, 1989, p.320–325.2. Aston, J.W., Giles, J.E., Durward, T.G, Dulley, J.R. (1985) Effect of elevated ripen<strong>in</strong>gtemperatures on proteolysis and flavour <strong>de</strong>velopment <strong>in</strong> Cheddar cheese. Journal of DairyResearch, Vol.52, 1985, p.565–572.3. Chamba, J.F. (2000) Emmental cheese: a complex microbial ecosystem. Consequences onselection and use of starters. Sciences <strong>de</strong>s Aliments, Vol.20, 2000, p.37–54.4. Coeuret, V., Dubernet, S., Bernardieau, M., Gueguen, M., Vernoux, J.P. (2003) Isolation,characterization and i<strong>de</strong>ntification of lactobacilli focus<strong>in</strong>g ma<strong>in</strong>ly on cheeses and other dairyproducts. Lait, Vol.83, 2003, p.269–306.5. Coppola, R., Nanni, M., Iorizzo, M., Sorrent<strong>in</strong>o, A., Sorrent<strong>in</strong>o, E., Grazia, L. (1997) Survey oflactic acid bacteria dur<strong>in</strong>g the advanced stages of the ripen<strong>in</strong>g of Parmigiano Reggano cheese.Journal of Dairy Research, Vol.64, 1997, p.305–310.
Proceed<strong>in</strong>g of the 4 rd International Symposium“NEW RESEARCH IN BIOTECHNOLOGY” USAMV Bucharest, Romania, 20116. Fenelon, M., Ryan, M.P., Rea, M., Gu<strong>in</strong>ee, T.P., Ross, R.P., Hill, C., Harr<strong>in</strong>gton, D. (1999)Elevated temperature ripen<strong>in</strong>g of reduced fat Cheddar ma<strong>de</strong> with or without Lactic<strong>in</strong> 3147–produc<strong>in</strong>g starter culture. Journal of Dairy Science, Vol.82, 1999, p.10–22.7. Fitzsimons, N.A., Cogan, T.M., Condon, S., Beresford, T (2001) Spatial and temporal distributionof non–starter lactic bacteria <strong>in</strong> Cheddar cheese. Journal of Applied Microbiology, Vol.90, 2001,p.600–608.8. Fitzsimons, N.A., Cogan, T.M., Condon, S., Beresford, T. (1999) Phenotypic and genotypiccharacterization of non–starter lactic bacteria <strong>in</strong> mature Cheddar cheese. Applied andEnvironmental Microbiology, Vol.65, 1999, p.3418–3426.9. Folkertsma, B., Fox, P.F., McSweeney, P.L.H. (1996) Accelerated ripen<strong>in</strong>g of Cheddar cheese atelevated temperatures. International Dairy Journal. Vol.6, 1996, p.1117–1134.10. Fox, P.F., Gu<strong>in</strong>ee, T.P., Cogan, T.M., McSweeney P.L.H. (2000) Fundamentals of CheeseScience. Gaithersburg, MD: Aspen, 2000, p.587.11. Muyanja, C., Narvhus, J. A., Treimo, J., Langsrud, T. (2003) Isolation, characterisation andi<strong>de</strong>ntification of lactic acid bacteria from bushera: a Ugandan traditional fermented beverage.International Journal of Food Microbiology, Vol.80, 2003, p.201–210.12. Shakel–Ur–Rehman, Banksm, J.M., McSweeney, P.L.H., Fox, P.F. (2000) Effect of ripen<strong>in</strong>gtemperature on the growth and significance of non–starter lactic acid bacteria <strong>in</strong> Cheddar cheesema<strong>de</strong> from raw or pasteurised milk. International Dairy Journal. Vol.10, 2000, p.45–53.13. Temmerman, R., Huys, G., Sw<strong>in</strong>gs, J. (2004) I<strong>de</strong>ntification of lactic acid bacteria culture–<strong>de</strong>pen<strong>de</strong>nt and culture–<strong>in</strong><strong>de</strong>pen<strong>de</strong>nt methods. Trends <strong>in</strong> Food Science and Technology, Vol.15,2004, p.348–359.14. Tynkkynen, S., Satokari, R., Saarela, M., Mattila–Sandholm, T., Saxel<strong>in</strong>, M. (1999) Comparisonof ribotyp<strong>in</strong>g, randomly amplified polymorphic DNA analysis and pulsed–field gelelectrophoresis <strong>in</strong> typ<strong>in</strong>g of Lactobacillus rhamnosus and L. casei stra<strong>in</strong>s. AppliedEnvironmental Microbiology, Vol.65, 1999, p.3908–3914.15. Williams, A.G., Choi, S.C., Banks, J.M. (2002) Variability of the species and stra<strong>in</strong> phenotypecomposition of the non–starter lactic acid bacterial population of Cheddar cheese manufactured<strong>in</strong> a commercial creamery. Food Research International, Vol.35, 2002, p.483–493.16. Williams, A.G., Banks, J.M. (1997) Proteolytic and other hydrolytic activities <strong>in</strong> non–starterlactic acid bacteria (NSLAB) isolated from Cheddar cheese manufactured <strong>in</strong> the UnitedK<strong>in</strong>gdom. International Dairy Journal, Vol.7, 1997, p.763–774.235
Proceed<strong>in</strong>g of the 4 rd International Symposium“NEW RESEARCH IN BIOTECHNOLOGY” USAMV Bucharest, Romania, 2011SPONSORSDEXTER COM236