- Page 2:
SEJOUR BÉBÉ GRATUITLe séjour est
- Page 5 and 6:
; ...
- Page 8 and 9:
TABLE OF CONTENTSCHAPTERPAGEI. Oper
- Page 10:
Table of ContentsIXCHAPTERPAGEVI. S
- Page 13 and 14:
XIITABLEPAGE15B. Geographic Distrib
- Page 16 and 17:
Operations in Fiscal Year 1988 3Dec
- Page 18 and 19:
Operations in Fiscal Year 1988 5CHA
- Page 20 and 21:
Covendimm in Fiscal Year 1988 7CHAR
- Page 22 and 23:
Operations in Fiscal Year 1988 9N,M
- Page 24 and 25:
Operations in Fiscal Year 1988 11CH
- Page 26 and 27:
Operations in Fiscal Year 1988 13C
- Page 28 and 29:
Operations in Fiscal Year 1988 15CH
- Page 30 and 31:
Operations in Fiscal Year 1988 17CH
- Page 32 and 33:
Operations in Fiscal Year 1988 19CH
- Page 34 and 35:
Operations in Fiscal Year 1988 21"N
- Page 36 and 37:
Operations in Fiscal Year 1988 23Tr
- Page 38 and 39:
IINLRB JurisdictionThe Board's juri
- Page 40 and 41:
NLRB Jurisdiction 27that the employ
- Page 42:
NLRB Jurisdiction 29of participatio
- Page 45 and 46:
32 Fifty-Third Annual Report of the
- Page 47 and 48:
34 Fifty-Third Annual Report of the
- Page 49 and 50:
36 Fifty-Third Annual Report of the
- Page 51 and 52:
38 Fffty-Third Annual Report of the
- Page 53 and 54:
40 Fifty-Third Annual Report of the
- Page 55 and 56:
42 Fifty-Thht Annual Report of the
- Page 57 and 58:
44 Fifty-Third Annual Report of the
- Page 59 and 60:
46 Fifty-Third Annual Report of the
- Page 61 and 62:
48 Fifty-Tbird Annual Report of the
- Page 63 and 64:
50 Fifty-Third Annual Report of the
- Page 65 and 66:
52 Fifty-Third Annual Report of the
- Page 67 and 68:
54 Fifty-Third Annual Report of the
- Page 70 and 71:
VUnfair Labor PracticesThe Board is
- Page 72 and 73:
Unfair Labor Practices . 59tection
- Page 74 and 75:
Unfair Labor Practices - 61violated
- Page 76 and 77:
Unfair Labor Practices 63dude, by r
- Page 78 and 79:
Unfair Labor Practices 65with the w
- Page 80 and 81:
Unfair Labor Practices 677. Other I
- Page 82 and 83:
Unfair Labor Practices 69need under
- Page 84 and 85:
Unfair Labor Practices 71cifically,
- Page 86 and 87:
Unfair Labor Practices 73In Delta-M
- Page 88 and 89:
Unfair 'Labor Practices 75future co
- Page 90 and 91:
Unfair Labor Practices 77business e
- Page 92 and 93:
Unfair Labor Practices 79E. Employe
- Page 94 and 95:
Unfair Labor Practices 81was irrele
- Page 96 and 97:
Unfair Labor Practices 83reasonably
- Page 98 and 99:
Unfair Labor Practices 85the future
- Page 100 and 101:
Unfair Labor Practices 87certificat
- Page 102 and 103:
Unfair Labor Practices 89al manager
- Page 104 and 105:
Unfair Labor Practices • 91the Bo
- Page 106 and 107:
Unfair Labor Practices 93approach h
- Page 108 and 109:
Unfair Labor Practices 95In attempt
- Page 110 and 111:
Unfair Labor Practices 97and work f
- Page 112 and 113:
Unfair Labor Practices 99fiscal yea
- Page 114 and 115:
Unfair Labor Practices 101ation" in
- Page 116 and 117:
Unfair Labor Practices 103when he s
- Page 118 and 119:
Unfair Labor Pracdces 1054. Couplin
- Page 120 and 121:
Unfair Labor Practices 107Chairman
- Page 122 and 123:
Unfair Labor Practices 109Member Jo
- Page 124 and 125:
Unfair Labor Practices 111terprise
- Page 126 and 127:
Unfair Labor Practices 113I. Recogn
- Page 128 and 129:
:-. - - --,Unfair Labor Practices 1
- Page 130 and 131:
Unfair Labor Practices 117spondent
- Page 132 and 133:
Unfair Label: Practices 119In Banda
- Page 134 and 135:
Unfair Labor Practices 121show that
- Page 136 and 137:
Unfair Labor Practices 123mained op
- Page 138 and 139:
Unfair Labor Practices 125have the
- Page 140 and 141:
Unfair Labor Practices 127The Board
- Page 142:
Unfair Labor Practices 129ted by th
- Page 145 and 146:
132 Fifty-Third Annual Report of th
- Page 147 and 148:
134 Fifty-Third Annual Report of th
- Page 149 and 150:
136 Fifty-Third Annual Report of th
- Page 151 and 152:
138 FIfty-Third Annual Report of th
- Page 153 and 154:
140 Fffty-Third Annual Report of th
- Page 155 and 156:
142 Fifty-Third Annual Report of th
- Page 157 and 158:
14 Fifty-Third Annual Report of the
- Page 159 and 160:
146 Fifty-Third Annual Report of th
- Page 161 and 162:
148 Fifty-Third Annual Report of th
- Page 163 and 164:
150 Fffty-Third Annual Report of th
- Page 165 and 166:
152 Fifty-Third Annual Report of th
- Page 167 and 168:
154 Fifty-Third Annual Report of th
- Page 170 and 171:
IxContempt LitigationIn fiscal year
- Page 172 and 173:
Contempt Litigation 159with 20 civi
- Page 174 and 175:
Contempt Litigation 161ued." In one
- Page 176 and 177:
Contempt Litigation 163Drug Researc
- Page 178 and 179:
XSpecial and Miscellaneous Litigati
- Page 180 and 181:
Special and Miscellaneous Litigatio
- Page 182 and 183:
Special and Miscellaneous Litigatio
- Page 184 and 185:
Special and Miscellaneous Litigatio
- Page 186 and 187:
INDEX OF CASES DISCUSSEDPageAqua-Ch
- Page 188:
Index of Cases DiscussedUnited Buil
- Page 191 and 192:
178 Fifty-Third Annual Report of th
- Page 193 and 194:
180 Fifty-Third Annual Report of th
- Page 195 and 196:
182 Fifty-Third Annual Report of th
- Page 198 and 199:
SUBJECT INDEX TO ANNUAL REPORT TABL
- Page 200 and 201: 1157Vptzi,1 Fla4rGa,N : Slwis!,*lop
- Page 202 and 203: Appendix 189Table 2.-Types of Unfai
- Page 204 and 205: Appendix 191illpa Onas00000, 0 0000
- Page 206 and 207: Appendix 193Table 3B.—Formal Acti
- Page 208 and 209: Table 4.—Remedial Actions Taken i
- Page 210 and 211: Appendix1971121 1 i()120 .8 1 (..)1
- Page 212 and 213: Table 5.—Industrial Distribution
- Page 214 and 215: F21rezozp',5:x3 g g .• 2Kg. vo AE
- Page 216 and 217: [:Min1:.1-1t. 1.1:I 1 :*.7T5Ja islE
- Page 218 and 219: vA R....(4)irIxf IF1 1F R1°1i lill
- Page 220 and 221: Table 7.-Analysis of Methods of Dis
- Page 222 and 223: akOtia"Wt gi g gliMI g1 ..9.t^ 8i &
- Page 224 and 225: Appendix, 211. 0 M N NO0g m a aod M
- Page 226 and 227: Appendix 213Table 11.-Types of Elec
- Page 228 and 229: Table 11B.-Representadon Elections
- Page 230 and 231: Apiindix 217Table 11E.-Results of R
- Page 232 and 233: Table 13.-Final Outcome of Represen
- Page 234 and 235: cOO!ivq-1•-•ta'81§ --LA- Ia4.
- Page 236 and 237: Table 14.-Valid Votes Cast in Repre
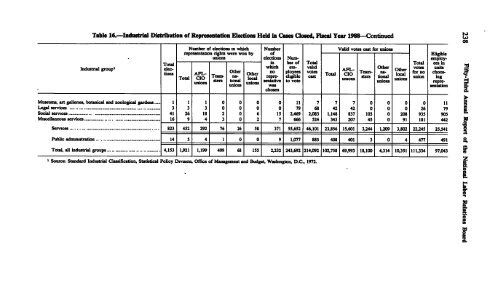
- Page 238 and 239: Table 14.—Valid Votes Cast in Rep
- Page 240 and 241: Appendix 227II1011.8§ 0>v>31 8819.
- Page 242 and 243: i &IIi i1HIF5oFogiti'.R1igIgq.F,Lc
- Page 244 and 245: 4?.zgcEtzg zi l 1 ,F5g.11 11 I'855)
- Page 246 and 247: Appendix233a7118126Wilnolvti200 A*
- Page 248 and 249: Table 15C.—Geographic Distributio
- Page 252 and 253: ig§g§gg88888888.888°M8MtM"geeSee
- Page 254 and 255: 1100P010100MMn4.08"r!"q30.1J .1.0%t
- Page 256 and 257: Appendix243sirze-r:viocSciAn i 1 i
- Page 258 and 259: Appendix24511 liSi:g• il. Ln..Stj
- Page 260 and 261: Appendix 247Table 22.—Advisory Op