
You also want an ePaper? Increase the reach of your titles
YUMPU automatically turns print PDFs into web optimized ePapers that Google loves.
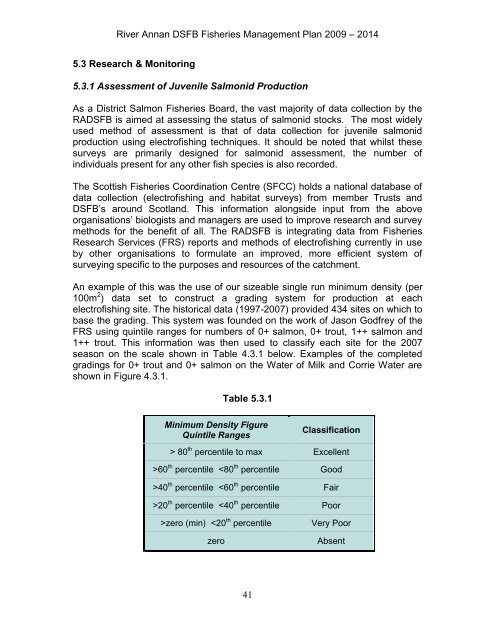
River <strong>Annan</strong> DSFB Fisheries <strong>Management</strong> <strong>Plan</strong> 2009 – 20145.3 Research & Monitoring5.3.1 Assessment of Juvenile Salmonid ProductionAs a District Salmon Fisheries Board, the vast majority of data collection by theRADSFB is aimed at assessing the status of salmonid stocks. The most widelyused method of assessment is that of data collection for juvenile salmonidproduction using electrofishing techniques. It should be noted that whilst thesesurveys are primarily designed for salmonid assessment, the number ofindividuals present for any other fish species is also recorded.The Scottish Fisheries Coordination Centre (SFCC) holds a national database ofdata collection (electrofishing and habitat surveys) from member Trusts andDSFB‟s around Scotland. This information alongside input from the aboveorganisations‟ biologists and managers are used to improve research and surveymethods for the benefit of all. The RADSFB is integrating data from FisheriesResearch Services (FRS) reports and methods of electrofishing currently in useby other organisations to formulate an improved, more efficient system ofsurveying specific to the purposes and resources of the catchment.An example of this was the use of our sizeable single run minimum density (per100m 2 ) data set to construct a grading system for production at eachelectrofishing site. The historical data (1997-2007) provided 434 sites on which tobase the grading. This system was founded on the work of Jason Godfrey of theFRS using quintile ranges for numbers of 0+ salmon, 0+ trout, 1++ salmon and1++ trout. This information was then used to classify each site for the 2007season on the scale shown in Table 4.3.1 below. Examples of the completedgradings for 0+ trout and 0+ salmon on the Water of Milk and Corrie Water areshown in Figure 4.3.1.Table 5.3.1Minimum Density FigureQuintile RangesClassification> 80 th percentile to max Excellent>60 th percentile 40 th percentile 20 th percentile zero (min)