
Create successful ePaper yourself
Turn your PDF publications into a flip-book with our unique Google optimized e-Paper software.
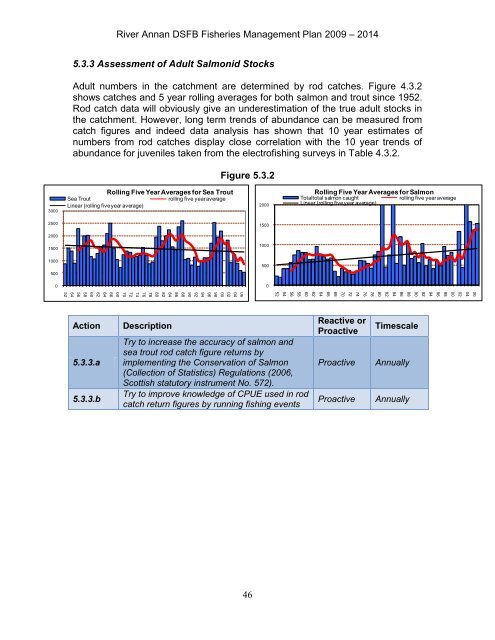
River <strong>Annan</strong> DSFB Fisheries <strong>Management</strong> <strong>Plan</strong> 2009 – 20145.3.3 Assessment of Adult Salmonid StocksAdult numbers in the catchment are determined by rod catches. Figure 4.3.2shows catches and 5 year rolling averages for both salmon and trout since 1952.Rod catch data will obviously give an underestimation of the true adult stocks inthe catchment. However, long term trends of abundance can be measured fromcatch figures and indeed data analysis has shown that 10 year estimates ofnumbers from rod catches display close correlation with the 10 year trends ofabundance for juveniles taken from the electrofishing surveys in Table 4.3.2.Figure 5.3.23000Rolling Five Year Averages for Sea TroutSea Troutrolling five year averageLinear (rolling five year average)2000Rolling Five Year Averages for SalmonTotaltotal salmon caughtrolling five year averageLinear (rolling five year average)250015002000150010001000500500000604020098969492908886848280787674727068666462605856545206040200989694929088868482807876747270686664626058565452Action5.3.3.a5.3.3.bDescriptionTry to increase the accuracy of salmon andsea trout rod catch figure returns byimplementing the Conservation of Salmon(Collection of Statistics) Regulations (2006,Scottish statutory instrument No. 572).Try to improve knowledge of CPUE used in rodcatch return figures by running fishing eventsReactive orProactiveProactiveProactiveTimescaleAnnuallyAnnually46