Genome Mapping Professor Simon G. Gregory
Genome Mapping Professor Simon G. Gregory
Genome Mapping Professor Simon G. Gregory
You also want an ePaper? Increase the reach of your titles
YUMPU automatically turns print PDFs into web optimized ePapers that Google loves.
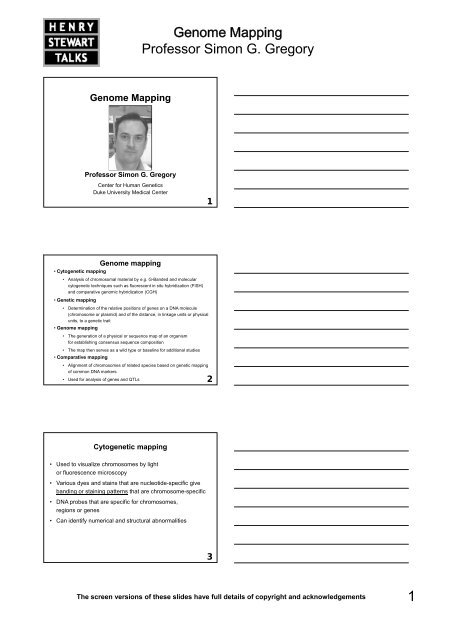
<strong>Genome</strong> <strong>Mapping</strong><strong>Professor</strong> <strong>Simon</strong> G. <strong>Gregory</strong>Why study chromosomal aberrations?• Chromosomal rearrangements are implicated in many disorderssuch as Infertility, Mental Retardation, Autism, Schizophrenia, Cancer– Cancer• The identification and characterization of theseabnormalities are important for understanding the pathogenesisof cancer• Selection of optimal targets for cancer therapyon an individual level• Clinical applications– Multiple congenital abnormalities– Mental retardation (mild to profound) of unknown origin or associatedwith minor or major malformations– Multiple unexplained spontaneous abortions– Family history of Down syndrome or other chromosome abnormality– Ultrasound abnormalities during pregnancy4Cytogenetic mapping (2)• The treatment of chromosomes arrested at metaphase and digestionwith trypsin and Giemsa stained creates differential chromosome bandingpatterns and the generation of light (R-bands) and dark (G-bands)• Giemsa staining is reliant upon nucleotide content and the staining patterntherefore reflects the base composition and correlates other propertiesof the different regionsG-bandsDark stainingGiemsa bandsAT richLate replicatingEarly condensationSINE poor, LINE richGene poorLess frequentrecombinationR-bandsLight StainingGiemsa bandsGC richEarly replicatingLate condensationSINE rich, LINE poorGene richMore frequentrecombination5Basic chromosome structure1. SizeScientists use three keyfeatures to identifychromosomes2. Bandingpattern3. Centromerepositionshortarmsatellitecentromeretelomere/subtelomereChromosome 1MetacentricChromosome 4Submetacentriclong armChromosome 14Acrocentric6The screen versions of these slides have full details of copyright and acknowledgements2
p 2 1<strong>Genome</strong> <strong>Mapping</strong><strong>Professor</strong> <strong>Simon</strong> G. <strong>Gregory</strong>G-banding: band nomenclatureand levels of resolutionp1q2qX7Cytogenetic mapping (3)KaryotypeIdeogram8Molecular cytogenetic techniques• Evaluating DNA sequences or chromosome numberor structure on chromosomes or in nuclei (in situ)– Chromosomes– Regions/bands– Genes• Fluorescence in situ hybridization (FISH)• Comparative Genomic Hybridization (CGH)Chromosome“painting”probeCentromereprobeLocus-specificprobe9The screen versions of these slides have full details of copyright and acknowledgements3
<strong>Genome</strong> <strong>Mapping</strong><strong>Professor</strong> <strong>Simon</strong> G. <strong>Gregory</strong>Fluorescence in situ hybridization (FISH)• DNA probes detected by fluorescent moleculesor fluorescently-labeled nucleotides– Nick translation– Random priming– PCR• Types of probes– Locus/gene-specific• Plasmid, BAC, PAC, cosmid, fosmid– Repetitive (centromere, telomere, other satellite)– Chromosome-specific• Whole painting probes - micro dissected chromosomes,PCR with degenerate Alu primer10FISHCentromere probeWhole chromosome“painting” probe11DNA or chromatin fiber-FISH“Molecular combing”gDNAProtein12The screen versions of these slides have full details of copyright and acknowledgements4
<strong>Genome</strong> <strong>Mapping</strong><strong>Professor</strong> <strong>Simon</strong> G. <strong>Gregory</strong>Comparative genomic hybridization (CGH)• Detect differences in copynumber and dosage– Detect monosomyor trisomy• Compare twodifferent samples–Normal versus cancer– Hybridize samplesto “normal” chromosomes• Total DNA labeledwith fluorescent dyes– Reference/Normal: red– Test/Cancer: greenReference TestCompetitor red dUTP green dUTPMetaphase Fluorescentchromosome image profileenh(1p)dim(1q31)Hybridisationfor 48-72 hoursImage through triple-band filterGreen; increase in copy numberRed; decrease in copy number13Resolution of cytological techniques• G-banding ≥10Mb (a band size)• FISH 10kb - 1Mb (depending on probe)– Interphase analysis 3-500kb– Fibers 10kb-1Mb– Metaphase analysis 500kb - 1Mb– Metaphase CGH ~1- 5Mb14• Chromosome banding characterisation of chromosome aberrations(duplications, deletions and translocations) associatedwith clinical phenotypes– Limited detectable resolution- The maximum genome-wideresolution is limited to 850 banding pattern.• DNA, oligonucleotide and single nucleotidepolymorphism based microarraysare standard analysisDECIPHERhttps://decipher.sanger.ac.uk/application/15The screen versions of these slides have full details of copyright and acknowledgements5
<strong>Genome</strong> <strong>Mapping</strong><strong>Professor</strong> <strong>Simon</strong> G. <strong>Gregory</strong>Genetic mapping• Utilizes recombination events during meiosis between markersto establish genetic distances (centimorgan)• Requires polymorphic markers that are informative withina population of known relationship• Markers used– RFLPs’ (bi-allelic and limited in number and distribution)– VNTR’s (clustered at telomeres and not stable)– Microsatellite markers (di- tri- tetra- nucleotide repeats)– Single nucleotide polymorphisms (SNPs)…ACTT(CA 12 )TTGC…ACTT(CA 8 )TTGC…16Genes and diseaseMonogenic diseases(Single gene)• Huntington disease• SpinocerebellarAtaxia• Spastic Paraplegia• Tuberous SclerosisComplex diseases(Many genes)• Multiple Sclerosis• Cardiovasculardisease• Alzheimer disease• Parkinson diseaseEnvironmentaldiseases• Influenza• Hepatitis• Measles- Environment- Genes17Genetic disease• Mendelian diseases (rare)– Single gene• Mutations‣ Cystic Fibrosis‣ Huntington disease‣ Spastic Paraplegia‣ Tuberous Sclerosis• Complex disease (common)– Multiple genes• Polymorphisms‣ Multiple Sclerosis‣ Cardiovascular disease‣ Alzheimer disease‣ Parkinson disease18The screen versions of these slides have full details of copyright and acknowledgements6
<strong>Genome</strong> <strong>Mapping</strong><strong>Professor</strong> <strong>Simon</strong> G. <strong>Gregory</strong>Genetic markers and linkage?• A genetic marker is polymorphic (different) betweenindividuals and has a unique location in the genome• The probability of recombination in meiosis dependson the distance between two loci– The farther apart, the more opportunities for crossing-over• Very little recombination between two loci means tightphysical linkage• The frequency of recombination between a disease geneand a marker with known position tells us whetherthe disease locus is close to or far apart from the marker• Linkage of polymorphic markers to the disease (usually) withinlarge affected families identifies a critical region / genes22Genetic linkage81 77170 170123 123123 113171 173207 207161 161254 252197 183150 144164 162173 173191 183121 12781 79166 170123 127123 111171 169207 213161 161254 252185 183154 144162 162173 173191 183117 127217 229‐ Male‐ Female‐ Affected81 81 77 79 81 81170 166 170 170 170 166123 123 123 127 123 127123 123 123 111 123 111171 171 171 169 171 169207 207 207 213 207 213161 161 161 161 161 161254 254 254 252 254 252197 183 197 183 197 183150 144 150 144 150 144164 162 162 162173 173 173 173191 183 191 183 183 183121 127 121 127 127 127217 229 217 229 219 22979 67166 170123 123109 119175 171213 207155 152252 258185 191150 152162 164173 173201 191117 119217 217Cross-over of homologouschromosomes in prophase of Meiosis IGenetic marker81 67 81 79170 170 170 166 170123 123 123 127 123123 119 123 111 119171 171 171 169 171207 207 207 213 207161 152 161 152254 258 254 252 258197 191 197 183 191150 152 150 144 152162 164 162 164173 173 173 173183 191 183 191127 119 127 119219 217 219 229 21723Linked marker• If a genetic marker is segregating with the diseasein a family, the marker is “linked” to the disease12 2212 2212 22 22 12 22 12 2224The screen versions of these slides have full details of copyright and acknowledgements8
<strong>Genome</strong> <strong>Mapping</strong><strong>Professor</strong> <strong>Simon</strong> G. <strong>Gregory</strong>Unlinked marker• If a genetic marker is NOT segregating with the diseasein a family, the marker is “unlinked” to the disease12 2212 2212 12 22 22 12 22 22256• <strong>Genome</strong>-wide linkage analyses - adding up evidencefrom across the families and the genomeparkin intron 7, LOD*=5.0scoreLOD s432• LOD score = A log 10 statistical estimateof whether two loci are likely to lie neareach other on a chromosomeand are therefore likely to be inheritedtogether; A LOD score of 3 or moreis generally taken to indicatethat the two loci are close00 50 100 150 200Map position (cM)26• The generation of a physical or sequence map of an organismfor establishing consensus sequence composition– Hierarchical approach• Physical Map• Sequence generation– Shotgun approach<strong>Genome</strong> mapping (2)• Whole genome sequence generation– Sequence assembly• Assembly algorithms– <strong>Genome</strong> annotation• Alignment of cDNA or gene fragments– <strong>Genome</strong> mapping and sequencing of evolutionary or commerciallyvaluable organisms27The screen versions of these slides have full details of copyright and acknowledgements9
<strong>Genome</strong> <strong>Mapping</strong><strong>Professor</strong> <strong>Simon</strong> G. <strong>Gregory</strong>The human genome in contextBacteriophage φX174 – Sanger et al., 1977Bacteriophage λ – Sanger et al., 1982Mitochondria – Shotgun strategy Anderson et al., 1981S. cerevisiae – Hierarchical strategy Olson et al., 1986C. elegans – Hierarchical strategy Coulson et al., 19863,000,000)Kb (log 10 )1,83097,000125,000120,00012,0004,600485Bacteriophage φX174Bacteriophage λE. coli C. elegans H. sapiensS. cerevisiaeH.influenzae A. thaliana28The human genome project• To determine the sequence of the 3.2 billion basesin the genome• To decode d the sequence in order to extracttthe biological information within• To apply this information to the study of disease,biology and evolution29Human genome project ethos“All human genomic sequence information should be freelyavailable and in the public domain in order to encourageresearch and development and to maximize its benefitto society”The Bermuda Statement, February 1996• Data deposited in public database every 24 hours• No patents are filed30The screen versions of these slides have full details of copyright and acknowledgements10
<strong>Genome</strong> <strong>Mapping</strong><strong>Professor</strong> <strong>Simon</strong> G. <strong>Gregory</strong>The Wellcome Trust Sanger InstituteWashington University, <strong>Genome</strong> Sequencing CenterWhitehead Institute for Biomedical Research/MITJoint <strong>Genome</strong> Institute, U.S. Department of EnergyBaylor College of MedicineGenoscopeInstitute for Molecular Biotechnology, Jena, GermanyRIKEN <strong>Genome</strong> Sciences CenterUniversity of Oklahoma, Advanced <strong>Genome</strong> Technology CenterThe Institute for <strong>Genome</strong> ResearchThe Wellcome TrustUniversity of Washington <strong>Genome</strong> CenterOther CentresSanger Institute 28.4%University of Washington Multimegabase Sequencing CenterKeio UniversityStanford Human <strong>Genome</strong> CenterUniversity of Texas, Southwestern Medical CenterJapanese Foundation for Cancer ResearchMax Planck Institute for Molecular Genetics<strong>Genome</strong> Therapeutics CorporationCenter for Genetics in Medicine (Perkin Elmer/Washington Univ.)Tokai UniversityCold Spring Harbor LaboratoryGesellschaft fur Biotechnologische Forschung mbHJapan Science and Technology CorporationHuman <strong>Genome</strong> Center, Institute of Genetics, Chinese Academy of SciencesStanford DNA Sequencing and Technology Development CenterUniversity of Utah <strong>Genome</strong> CenterCytogenetics and Molecular Genetics, Women's & Children's Hospital, AdelaideThe Yang-Ming University <strong>Genome</strong> CenterCoordination of humangenome mappingand sequencing 3rdJanuary 2003Baylor College of Medicine9.4%Washington University,<strong>Genome</strong> 19.9%Whitehead Institutefor BiomedicalResearch/MIT13.5%Joint <strong>Genome</strong>Institutes,U.S. Departmentof Energy11.3%31Hierarchical strategy• Physical (clone) maps, marker based and region / chromosome specificACGTGTCGA3,000 Mb's(3,000,000,000 bp)BAC’s0.1Mb(100 kb)Sequencingsub-clones1.5 kb(1500 bp)Sequence263 Mb(e.g. chromosome 1)32<strong>Mapping</strong> strategy15 markers/MbRestriction fingerprinting& STS assignment(CA) n (CA) n (CA) nEST EST ESTFS FS FSRestrictionfingerprintingEST15X coverageRPCI 1-6 PACRPCI 11/13 BACRPCI 11/13 BACEST (CA) n (CA) n(CA) n FS EST EST EST FS FS5x draftFinishedAnnotated33The screen versions of these slides have full details of copyright and acknowledgements11
<strong>Genome</strong> <strong>Mapping</strong><strong>Professor</strong> <strong>Simon</strong> G. <strong>Gregory</strong>What is comparative mapping?• Comparing sequences of different organisms• A tool for decoding genomic information stored in DNA• Functional sequences evolve more slowlythan non-functional sequences• Sequences that remain conserved throughout evolutionmay perform a biological function37Comparative sequence analysis• Identify conserved regions– Genes– Regulatory sequences• Identify species specific sequences– Genes that contribute to unique characteristics• Understand structure and function of genes for disease studies– Identify new model organisms• Evolutionary reconstructions of genes and genomes• Apply knowledge to medicine, biotechnology, agriculture,conservation, etc.38Selection of species for DNA comparisonsHuman vs. Chimpanzee Mouse Opossum PufferfishSize (Gbp) 3.0 2.5 4.2 0.4Time sincedivergence~6 MYA ~90 MYA ~150 MYA ~450 MYASequenceconservation(in coding>99% ~80% ~70-75% ~65%regions)Aidsidentification ofRecentlychangedsequencesand genomicrearrangementsBoth coding& non-codingsequencesBoth coding& non-codingsequencesPrimarilycodingsequencesBackground noise High Moderate Low Lower39The screen versions of these slides have full details of copyright and acknowledgements13
<strong>Genome</strong> <strong>Mapping</strong><strong>Professor</strong> <strong>Simon</strong> G. <strong>Gregory</strong>TimeGene 1Homology, orthology, paralogyOriginalfunctionmaintainedGeneSpeciationOrthologuesFunctionalorthologuesDuplicationParaloguesOriginalfunctionmaintainedParaloguesGene 2 Gene 3Novelfunction• HomologuesGenes derived fromcommon ancestral gene• OrthologuesGenes in different speciesthat are derived fromthe same gene in lastcommon ancestor• ParaloguesGene families that havediverged within a singlespecies, often by duplication40Comparative mapping - mouseclone by cloneBACsAve. size 200 kbmapWGSsequenceassemblysequenceassemblypUCs41Physical mapping strategyBACfingerprinting(Marra et al., 1997)305,000 ClonesDnMitBAC libraries(Osoegawa et al., 2000)379,000 Clones BAC endsequencing(Zhao et al., 2001)410,000 BESHuman chromosome 1(<strong>Gregory</strong> et al., 2005)42The screen versions of these slides have full details of copyright and acknowledgements14
<strong>Genome</strong> <strong>Mapping</strong><strong>Professor</strong> <strong>Simon</strong> G. <strong>Gregory</strong>H5H22M1310M17H7M1M9M4M10H2H17Human chromosome 6Mouse chromosome 11Dashed lines = inverted synteny43• Comparative sequence alignment• Novel exons• Putative regulatory elements44Sequencing, the next generationPlatformReadlength ScaleRuntimeTotalbp readCostper bpMaturity oftechnologySanger 1,000 96 2 hr 96 kb 0.5 matureBiotage 50 96 1 hr 4.8 kb 6.0 mature350454400K 8 hr 100 Mb
<strong>Genome</strong> <strong>Mapping</strong><strong>Professor</strong> <strong>Simon</strong> G. <strong>Gregory</strong>Acknowledgements• Beth Sullivan – Duke Institute for <strong>Genome</strong> Sciences and Policy• Allison Ashley-Koch – Duke Center for Human Genetics• Matthew Breen – North Carolina State University• Julie Horvath – Duke Institute for <strong>Genome</strong> Sciences and Policy• Greg Wray – Duke Institute for <strong>Genome</strong> Sciences and Policy4647The screen versions of these slides have full details of copyright and acknowledgements16


