- Page 1 and 2:
MarketingManagement,Millenium Editi
- Page 3 and 4:
SECTION ONE
- Page 5 and 6:
2 CHAPTER 1 MARKETING IN THE TWENTY
- Page 7 and 8:
4 CHAPTER 1 MARKETING IN THE TWENTY
- Page 9 and 10:
6 CHAPTER 1 MARKETING IN THE TWENTY
- Page 11 and 12:
8 CHAPTER 1 MARKETING IN THE TWENTY
- Page 13 and 14:
10 CHAPTER 1 MARKETING IN THE TWENT
- Page 15 and 16:
12 CHAPTER 1 MARKETING IN THE TWENT
- Page 17 and 18:
14 CHAPTER 1 MARKETING IN THE TWENT
- Page 19 and 20:
ConclusionThis vignette focused on
- Page 21 and 22:
18 CHAPTER 1 MARKETING IN THE TWENT
- Page 23 and 24:
40 CHAPTER 3 WINNING MARKETS THROUG
- Page 25 and 26:
42 CHAPTER 3 WINNING MARKETS THROUG
- Page 27 and 28:
44 CHAPTER 3 WINNING MARKETS THROUG
- Page 29 and 30:
46 CHAPTER 3 WINNING MARKETS THROUG
- Page 31 and 32:
48 CHAPTER 3 WINNING MARKETS THROUG
- Page 33 and 34:
50 CHAPTER 3 WINNING MARKETS THROUG
- Page 35 and 36:
52 CHAPTER 3 WINNING MARKETS THROUG
- Page 37 and 38:
54 CHAPTER 3 WINNING MARKETS THROUG
- Page 39 and 40:
56 CHAPTER 3 WINNING MARKETS THROUG
- Page 41 and 42:
58 CHAPTER 3 WINNING MARKETS THROUG
- Page 43 and 44:
60 CHAPTER 3 WINNING MARKETS THROUG
- Page 45:
62 CHAPTER 3 WINNING MARKETS THROUG
- Page 48 and 49:
formation is developed through inte
- Page 50:
pound employees treat citizens pick
- Page 53 and 54:
M A R K E T I N GmemoSecondary Sour
- Page 56:
■■■Survey research: Surveys a
- Page 63:
marketing researcher’s report may
- Page 67 and 68:
120AnalyzingMarketingOpportunitiesA
- Page 69 and 70:
■A sales budget is a conservative
- Page 74 and 75:
picking 400 of the most innovative
- Page 77 and 78:
and low company market budget are 0
- Page 79 and 80:
132AnalyzingMarketingOpportunities8
- Page 81:
SECTION TWO
- Page 84:
One major trend is the increasing p
- Page 88 and 89:
The explosive world population grow
- Page 90 and 91:
Yet marketers must be careful not t
- Page 92 and 93:
egional differences: People in Seat
- Page 94 and 95:
■ The Walt Disney Company The Wal
- Page 97 and 98:
Accelerating Pace of Technological
- Page 99 and 100:
and more business takes place in cy
- Page 101 and 102:
children and are reinforced by majo
- Page 103 and 104:
N O T E S1561. Gene Del Vecchio,
- Page 106 and 107:
Once a company has carefully segmen
- Page 109 and 110:
■was able to develop a new electr
- Page 113 and 114:
LayfutureplansYes Yes Yes Yes Yes Y
- Page 115:
that can be reviewed by a new-produ
- Page 119 and 120:
Package DesignBrand NameRetail Pric
- Page 122:
affecting profitability under an as
- Page 125 and 126:
■■■The rank-order method asks
- Page 127 and 128:
strategies, the greater the regiona
- Page 129 and 130:
In the movie business, it’s not u
- Page 131 and 132:
various prospect groups on these ch
- Page 133 and 134:
■■■Early adopters share some
- Page 135 and 136:
The first is relative advantage—t
- Page 138 and 139:
N O T E S1. New Products Management
- Page 140 and 141:
37. See Cooper and Kleinschmidt, Ne
- Page 142 and 143:
AnalyzingConsumer Marketsand BuyerB
- Page 144 and 145:
How and Why Consumers Buy 89➤Soci
- Page 146 and 147:
How and Why Consumers Buy 91Another
- Page 148 and 149:
How and Why Consumers Buy 93Althoug
- Page 150 and 151:
How and Why Consumers Buy 95➤pers
- Page 152 and 153:
The Consumer Buying Decision Proces
- Page 154 and 155:
The Consumer Buying Decision Proces
- Page 156 and 157:
The Consumer Buying Decision Proces
- Page 158 and 159:
Notes 103influences are operating.
- Page 160 and 161:
Notes 105Cohen, “An Examination o
- Page 162 and 163:
108 CHAPTER 6 ANALYZING BUSINESS MA
- Page 164 and 165:
Table 3.3Characteristics of Busines
- Page 166 and 167:
112 CHAPTER 6 ANALYZING BUSINESS MA
- Page 168 and 169:
114 CHAPTER 6 ANALYZING BUSINESS MA
- Page 170 and 171:
116 CHAPTER 6 ANALYZING BUSINESS MA
- Page 172 and 173:
118 CHAPTER 6 ANALYZING BUSINESS MA
- Page 174 and 175:
120 CHAPTER 6 ANALYZING BUSINESS MA
- Page 176 and 177:
122 CHAPTER 6 ANALYZING BUSINESS MA
- Page 178 and 179:
144 CHAPTER 8 IDENTIFYING MARKET SE
- Page 180 and 181:
146 CHAPTER 8 IDENTIFYING MARKET SE
- Page 182 and 183:
148 CHAPTER 8 IDENTIFYING MARKET SE
- Page 184 and 185:
150 CHAPTER 8 IDENTIFYING MARKET SE
- Page 186 and 187:
152 CHAPTER 8 IDENTIFYING MARKET SE
- Page 188 and 189:
154 CHAPTER 8 IDENTIFYING MARKET SE
- Page 190 and 191:
156 CHAPTER 8 IDENTIFYING MARKET SE
- Page 192 and 193:
158 CHAPTER 8 IDENTIFYING MARKET SE
- Page 194 and 195:
160 CHAPTER 8 IDENTIFYING MARKET SE
- Page 196 and 197:
162 CHAPTER 9 POSITIONING PRODUCTS
- Page 198 and 199:
164 CHAPTER 9 POSITIONING PRODUCTS
- Page 200 and 201:
166 CHAPTER 9 POSITIONING PRODUCTS
- Page 202 and 203:
168 CHAPTER 9 POSITIONING PRODUCTS
- Page 204 and 205:
170 CHAPTER 9 POSITIONING PRODUCTS
- Page 206 and 207:
172 CHAPTER 9 POSITIONING PRODUCTS
- Page 208 and 209:
174 CHAPTER 9 POSITIONING PRODUCTS
- Page 210 and 211:
176 CHAPTER 9 POSITIONING PRODUCTS
- Page 212 and 213:
178 CHAPTER 9 POSITIONING PRODUCTS
- Page 214 and 215:
180 CHAPTER 9 POSITIONING PRODUCTS
- Page 216 and 217:
182 CHAPTER 9 POSITIONING PRODUCTS
- Page 218 and 219:
Managing ProductLines and BrandsWe
- Page 220 and 221:
The Product and the Product Mix 185
- Page 222 and 223:
Brand Decisions 187After performing
- Page 224 and 225:
Brand Decisions 189Brand EquityBran
- Page 226 and 227:
Brand Decisions 191Why do middlemen
- Page 228 and 229:
Brand Decisions 193and shredded whe
- Page 230 and 231:
Packaging and Labeling 195ing itsel
- Page 232 and 233:
Notes 197stretching or line filling
- Page 234 and 235:
Designing andManaging ServicesWe wi
- Page 236 and 237:
The Nature of Services 201see the e
- Page 238 and 239:
Marketing Strategies for Service Fi
- Page 240 and 241:
Marketing Strategies for Service Fi
- Page 242 and 243:
Marketing Strategies for Service Fi
- Page 244 and 245:
Marketing Strategies for Service Fi
- Page 246 and 247:
Managing Product Support Services 2
- Page 248 and 249:
Notes 213(such as facilitating serv
- Page 250 and 251:
Designing PricingStrategies andProg
- Page 252 and 253:
Setting the Price 217➤➤ignoring
- Page 254 and 255:
Setting the Price 219Price elastici
- Page 256 and 257:
Setting the Price 221Next, the firm
- Page 258 and 259:
Setting the Price 223Figure 4-12Bre
- Page 260 and 261:
Setting the Price 225to achieve max
- Page 262 and 263:
Adapting the Price 227Table 4.4Pric
- Page 264 and 265:
➤Adapting the Price 229Location p
- Page 266 and 267:
Initiating and Responding to Price
- Page 268 and 269:
Notes 233➤ Launching a low-price
- Page 270 and 271:
SECTION FIVE
- Page 272 and 273:
236 CHAPTER 13 SELECTING AND MANAGI
- Page 274 and 275:
238 CHAPTER 13 SELECTING AND MANAGI
- Page 276 and 277:
240 CHAPTER 13 SELECTING AND MANAGI
- Page 278 and 279:
242 CHAPTER 13 SELECTING AND MANAGI
- Page 280 and 281:
244 CHAPTER 13 SELECTING AND MANAGI
- Page 282 and 283:
246 CHAPTER 13 SELECTING AND MANAGI
- Page 284 and 285:
248 CHAPTER 13 SELECTING AND MANAGI
- Page 286 and 287:
250 CHAPTER 13 SELECTING AND MANAGI
- Page 288 and 289:
Designing andManagingIntegratedMark
- Page 290 and 291:
Developing Effective Marketing Comm
- Page 292 and 293:
Developing Effective Marketing Comm
- Page 294 and 295:
Developing Effective Marketing Comm
- Page 296 and 297:
Developing Effective Marketing Comm
- Page 298 and 299:
Developing and Managing the Adverti
- Page 300 and 301:
Developing and Managing the Adverti
- Page 302 and 303:
Developing and Managing the Adverti
- Page 304 and 305:
Developing and Managing the Adverti
- Page 306 and 307:
Sales Promotion Strategies 289promo
- Page 308 and 309:
Sales Promotion Strategies 291Table
- Page 310 and 311:
Public Relations Strategies 293tion
- Page 312 and 313:
Notes 295that evaluates the strateg
- Page 314:
Notes 2971998, p. D3; “Ethical Fu
- Page 317 and 318:
MESSAGEMISSION• Sales goals• Ad
- Page 319 and 320:
■ Alka-Seltzer Alka-Seltzer antac
- Page 322 and 323:
ThemeCreative Copy7-Up is not a col
- Page 324 and 325:
meet its ethical standards while en
- Page 327 and 328:
Another reason for review is the co
- Page 330 and 331:
592The timing pattern should consid
- Page 332:
■ Pizza Hut Pizza Hut levies a 4
- Page 336 and 337:
accepted by top management as an ef
- Page 338:
M A R K E T I N Gmemo600Sales Promo
- Page 343 and 344:
ventories in preparation for releas
- Page 345:
Clearly, creative public relations
- Page 349 and 350:
media by establishing the ad’s de
- Page 351 and 352:
N O T E Spart fiveManaging andDeliv
- Page 353 and 354:
part fiveManaging andDelivering Mar
- Page 355 and 356:
Managing theSales ForceWe will addr
- Page 357 and 358:
Designing the Sales Force 301reps l
- Page 359 and 360:
Managing the Sales Force 303money.
- Page 361 and 362:
Managing the Sales Force 305Supervi
- Page 363 and 364:
Managing the Sales Force 307away fr
- Page 365 and 366:
Principles of Personal Selling 309c
- Page 367 and 368:
Principles of Personal Selling 311
- Page 369 and 370:
Notes 313Choosing the sales force s
- Page 371 and 372:
Notes 31527. For an excellent summa
- Page 374:
The world is rapidly shrinking with
- Page 380 and 381:
372part threeDevelopingMarketingStr
- Page 382:
Although many countries in central
- Page 385 and 386: ever, it offers a chance to start f
- Page 387: this time, the company is operating
- Page 391 and 392: PROMOTIONCompanies can run the same
- Page 393 and 394: Very often a company finds some ent
- Page 395 and 396: may be international subsidiaries,
- Page 397 and 398: What are some questions concerning
- Page 399 and 400: 32. Elliott Masie, “Global Pricin
- Page 401 and 402: 318 CHAPTER 17 MANAGING DIRECT AND
- Page 403 and 404: 320 CHAPTER 17 MANAGING DIRECT AND
- Page 405 and 406: 322 CHAPTER 17 MANAGING DIRECT AND
- Page 407 and 408: 324 CHAPTER 17 MANAGING DIRECT AND
- Page 409 and 410: 326 CHAPTER 17 MANAGING DIRECT AND
- Page 411 and 412: 328 CHAPTER 17 MANAGING DIRECT AND
- Page 413 and 414: 330 CHAPTER 17 MANAGING DIRECT AND
- Page 415: 332 CHAPTER 17 MANAGING DIRECT AND
- Page 419 and 420: F I G U R E 6-5Stages in the Evolut
- Page 421 and 422: Other companies that have shifted t
- Page 423 and 424: PMAPMPA(a) Vertical product teamRPM
- Page 425 and 426: markets. They must analyze where th
- Page 427 and 428: 690part fiveManaging andDelivering
- Page 429 and 430: 692part fiveManaging andDelivering
- Page 431 and 432: 694part fiveManaging andDelivering
- Page 433 and 434: then. Two groups of experienced mar
- Page 441 and 442: 704part fiveManaging andDelivering
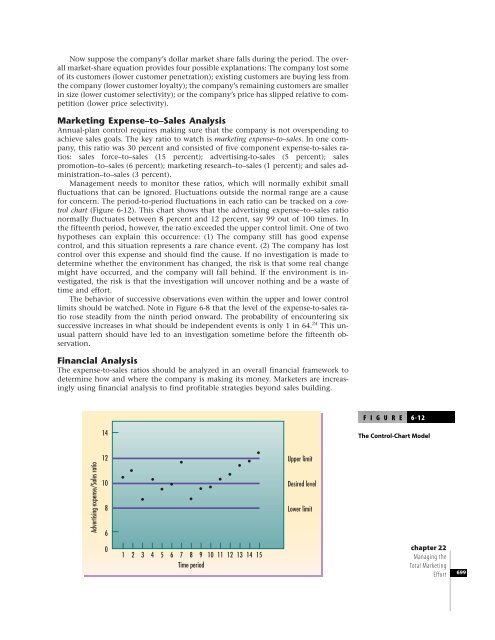
- Page 443 and 444: SalesfallManagementincreases salesi
- Page 445 and 446: MARKETINGmemoMarketing Effectivenes
- Page 451 and 452: 2. Modern marketing departments can
- Page 453 and 454: N O T E S716part fiveManaging andDe
- Page 455 and 456: 718part fiveManaging andDelivering