list of evidences 10d Barrie - The Shroud of Turin Website
list of evidences 10d Barrie - The Shroud of Turin Website
list of evidences 10d Barrie - The Shroud of Turin Website

Create successful ePaper yourself
Turn your PDF publications into a flip-book with our unique Google optimized e-Paper software.
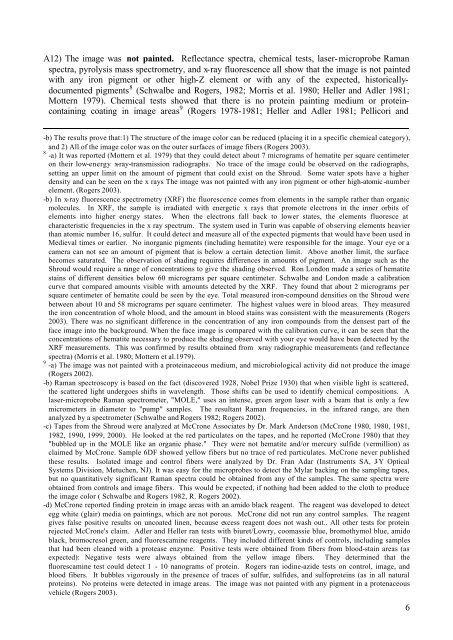
A12) <strong>The</strong> image was not painted. Reflectance spectra, chemical tests, laser-microprobe Ramanspectra, pyrolysis mass spectrometry, and x-ray fluorescence all show that the image is not paintedwith any iron pigment or other high-Z element or with any <strong>of</strong> the expected, historicallydocumentedpigments 8 (Schwalbe and Rogers, 1982; Morris et al. 1980; Heller and Adler 1981;Mottern 1979). Chemical tests showed that there is no protein painting medium or proteincontainingcoating in image areas 9 (Rogers 1978-1981; Heller and Adler 1981; Pellicori and-b) <strong>The</strong> results prove that:1) <strong>The</strong> structure <strong>of</strong> the image color can be reduced (placing it in a specific chemical category),and 2) All <strong>of</strong> the image color was on the outer surfaces <strong>of</strong> image fibers (Rogers 2003).8 -a) It was reported (Mottern et al. 1979) that they could detect about 7 micrograms <strong>of</strong> hematite per square centimeteron their low-energy x-ray-transmission radiographs. No trace <strong>of</strong> the image could be observed on the radiographs,setting an upper limit on the amount <strong>of</strong> pigment that could exist on the <strong>Shroud</strong>. Some water spots have a higherdensity and can be seen on the x rays <strong>The</strong> image was not painted with any iron pigment or other high-atomic -numberelement. (Rogers 2003).-b) In x-ray fluorescence spectrometry (XRF) the fluorescence comes from elements in the sample rather than organicmolecules. In XRF, the sample is irradiated with energetic x rays that promote electrons in the inner orbits <strong>of</strong>elements into higher energy states. When the electrons fall back to lower states, the elements fluoresce atcharacteristic frequencies in the x ray spectrum. <strong>The</strong> system used in <strong>Turin</strong> was capable <strong>of</strong> observing elements heavierthan atomic number 16, sulfur. It could detect and measure all <strong>of</strong> the expected pigments that would have been used inMedieval times or earlier. No inorganic pigments (including hematite) were responsible for the image. Your eye or acamera can not see an amount <strong>of</strong> pigment that is below a certain detection limit. Above another limit, the surfacebecomes saturated. <strong>The</strong> observation <strong>of</strong> shading requires differences in amounts <strong>of</strong> pigment. An image such as the<strong>Shroud</strong> would require a range <strong>of</strong> concentrations to give the shading observed. Ron London made a series <strong>of</strong> hematitestains <strong>of</strong> different densities below 60 micrograms per square centimeter. Schwalbe and London made a calibrationcurve that compared amounts visible with amounts detected by the XRF. <strong>The</strong>y found that about 2 micrograms persquare centimeter <strong>of</strong> hematite could be seen by the eye. Total measured iron-compound densities on the <strong>Shroud</strong> werebetween about 10 and 58 micrograms per square centimeter. <strong>The</strong> highest values were in blood areas. <strong>The</strong>y measuredthe iron concentration <strong>of</strong> whole blood, and the amount in blood stains was consistent with the measurements (Rogers2003). <strong>The</strong>re was no significant difference in the concentration <strong>of</strong> any iron compounds from the densest part <strong>of</strong> theface image into the background. When the face image is compared with the calibration curve, it can be seen that theconcentrations <strong>of</strong> hematite necessary to produce the shading observed with your eye would have been detected by theXRF measurements. This was confirmed by results obtained from x-ray radiographic measurements (and reflectancespectra) (Morris et al. 1980; Mottern et al.1979).9 -a) <strong>The</strong> image was not painted with a proteinaceous medium, and microbiological activity did not produce the image(Rogers 2002).-b) Raman spectroscopy is based on the fact (discovered 1928, Nobel Prize 1930) that when visible light is scattered,the scattered light undergoes shifts in wavelength. Those shifts can be used to identify chemical compositions. Alaser-microprobe Raman spectrometer, "MOLE," uses an intense, green argon laser with a beam that is only a fewmicrometers in diameter to "pump" samples. <strong>The</strong> resultant Raman frequencies, in the infrared range, are thenanalyzed by a spectrometer (Schwalbe and Rogers 1982; Rogers 2002).-c) Tapes from the <strong>Shroud</strong> were analyzed at McCrone Associates by Dr. Mark Anderson (McCrone 1980, 1980, 1981,1982, 1990, 1999, 2000). He looked at the red particulates on the tapes, and he reported (McCrone 1980) that they"bubbled up in the MOLE like an organic phase." <strong>The</strong>y were not hematite and/or mercury sulfide (vermillion) asclaimed by McCrone. Sample 6DF showed yellow fibers but no trace <strong>of</strong> red particulates. McCrone never publishedthese results. Isolated image and control fibers were analyzed by Dr. Fran Adar (Instruments SA, J-Y OpticalSystems Division, Metuchen, NJ). It was easy for the microprobes to detect the Mylar backing on the sampling tapes,but no quantitatively significant Raman spectra could be obtained from any <strong>of</strong> the samples. <strong>The</strong> same spectra wereobtained from controls and image fibers. This would be expected, if nothing had been added to the cloth to producethe image color ( Schwalbe and Rogers 1982, R. Rogers 2002).-d) McCrone reported finding protein in image areas with an amido black reagent. <strong>The</strong> reagent was developed to detectegg white (glair) media on paintings, which are not porous. McCrone did not run any control samples. <strong>The</strong> reagentgives false positive results on uncoated linen, because excess reagent does not wash out.. All other tests for proteinrejected McCrone's claim. Adler and Heller ran tests with biuret/Lowry, coomassie blue, bromothymol blue, amidoblack, bromocresol green, and fluorescamine reagents. <strong>The</strong>y included different kinds <strong>of</strong> controls, including samplesthat had been cleaned with a protease enzyme. Positive tests were obtained from fibers from blood-stain areas (asexpected): Negative tests were always obtained from the yellow image fibers. <strong>The</strong>y determined that thefluorescamine test could detect 1 - 10 nanograms <strong>of</strong> protein. Rogers ran iodine-azide tests on control, image, andblood fibers. It bubbles vigorously in the presence <strong>of</strong> traces <strong>of</strong> sulfur, sulfides, and sulfoproteins (as in all naturalproteins). No proteins were detected in image areas. <strong>The</strong> image was not painted with any pigment in a protenaceousvehicle (Rogers 2003).6