Climate Change in the Champlain Basin - The Nature Conservancy
Climate Change in the Champlain Basin - The Nature Conservancy
Climate Change in the Champlain Basin - The Nature Conservancy

You also want an ePaper? Increase the reach of your titles
YUMPU automatically turns print PDFs into web optimized ePapers that Google loves.
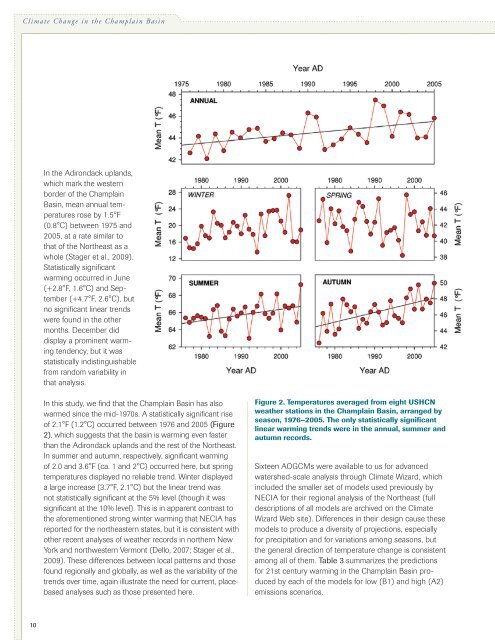
<strong>Climate</strong> <strong>Change</strong> <strong>in</strong> <strong>the</strong> Champla<strong>in</strong> Bas<strong>in</strong>In <strong>the</strong> Adirondack uplands,which mark <strong>the</strong> westernborder of <strong>the</strong> Champla<strong>in</strong>Bas<strong>in</strong>, mean annual temperaturesrose by 1.5°F(0.8°C) between 1975 and2005, at a rate similar tothat of <strong>the</strong> Nor<strong>the</strong>ast as awhole (Stager et al., 2009).Statistically significantwarm<strong>in</strong>g occurred <strong>in</strong> June(+2.8°F, 1.6°C) and September(+4.7°F, 2.6°C), butno significant l<strong>in</strong>ear trendswere found <strong>in</strong> <strong>the</strong> o<strong>the</strong>rmonths. December diddisplay a prom<strong>in</strong>ent warm<strong>in</strong>gtendency, but it wasstatistically <strong>in</strong>dist<strong>in</strong>guishablefrom random variability <strong>in</strong>that analysis.In this study, we f<strong>in</strong>d that <strong>the</strong> Champla<strong>in</strong> Bas<strong>in</strong> has alsowarmed s<strong>in</strong>ce <strong>the</strong> mid-1970s. A statistically significant riseof 2.1°F (1.2°C) occurred between 1976 and 2005 (Figure2), which suggests that <strong>the</strong> bas<strong>in</strong> is warm<strong>in</strong>g even fasterthan <strong>the</strong> Adirondack uplands and <strong>the</strong> rest of <strong>the</strong> Nor<strong>the</strong>ast.In summer and autumn, respectively, significant warm<strong>in</strong>gof 2.0 and 3.6°F (ca. 1 and 2°C) occurred here, but spr<strong>in</strong>gtemperatures displayed no reliable trend. W<strong>in</strong>ter displayeda large <strong>in</strong>crease (3.7°F, 2.1°C) but <strong>the</strong> l<strong>in</strong>ear trend wasnot statistically significant at <strong>the</strong> 5% level (though it wassignificant at <strong>the</strong> 10% level). This is <strong>in</strong> apparent contrast to<strong>the</strong> aforementioned strong w<strong>in</strong>ter warm<strong>in</strong>g that NECIA hasreported for <strong>the</strong> nor<strong>the</strong>astern states, but it is consistent witho<strong>the</strong>r recent analyses of wea<strong>the</strong>r records <strong>in</strong> nor<strong>the</strong>rn NewYork and northwestern Vermont (Dello, 2007; Stager et al.,2009). <strong>The</strong>se differences between local patterns and thosefound regionally and globally, as well as <strong>the</strong> variability of <strong>the</strong>trends over time, aga<strong>in</strong> illustrate <strong>the</strong> need for current, placebasedanalyses such as those presented here.Figure 2. Temperatures averaged from eight USHCNwea<strong>the</strong>r stations <strong>in</strong> <strong>the</strong> Champla<strong>in</strong> Bas<strong>in</strong>, arranged byseason, 1976–2005. <strong>The</strong> only statistically significantl<strong>in</strong>ear warm<strong>in</strong>g trends were <strong>in</strong> <strong>the</strong> annual, summer andautumn records.Sixteen AOGCMs were available to us for advancedwatershed-scale analysis through <strong>Climate</strong> Wizard, which<strong>in</strong>cluded <strong>the</strong> smaller set of models used previously byNECIA for <strong>the</strong>ir regional analysis of <strong>the</strong> Nor<strong>the</strong>ast (fulldescriptions of all models are archived on <strong>the</strong> <strong>Climate</strong>Wizard Web site). Differences <strong>in</strong> <strong>the</strong>ir design cause <strong>the</strong>semodels to produce a diversity of projections, especiallyfor precipitation and for variations among seasons, but<strong>the</strong> general direction of temperature change is consistentamong all of <strong>the</strong>m. Table 3 summarizes <strong>the</strong> predictionsfor 21st century warm<strong>in</strong>g <strong>in</strong> <strong>the</strong> Champla<strong>in</strong> Bas<strong>in</strong> producedby each of <strong>the</strong> models for low (B1) and high (A2)emissions scenarios.10