Climate Change in the Champlain Basin - The Nature Conservancy
Climate Change in the Champlain Basin - The Nature Conservancy
Climate Change in the Champlain Basin - The Nature Conservancy

Create successful ePaper yourself
Turn your PDF publications into a flip-book with our unique Google optimized e-Paper software.
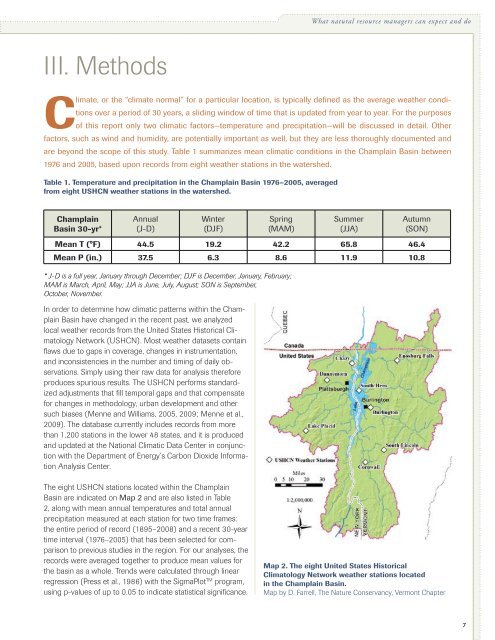
What natural resource managers can expect and doIII. Methods<strong>Climate</strong>, or <strong>the</strong> “climate normal” for a particular location, is typically def<strong>in</strong>ed as <strong>the</strong> average wea<strong>the</strong>r conditionsover a period of 30 years, a slid<strong>in</strong>g w<strong>in</strong>dow of time that is updated from year to year. For <strong>the</strong> purposesof this report only two climatic factors—temperature and precipitation—will be discussed <strong>in</strong> detail. O<strong>the</strong>rfactors, such as w<strong>in</strong>d and humidity, are potentially important as well, but <strong>the</strong>y are less thoroughly documented andare beyond <strong>the</strong> scope of this study. Table 1 summarizes mean climatic conditions <strong>in</strong> <strong>the</strong> Champla<strong>in</strong> Bas<strong>in</strong> between1976 and 2005, based upon records from eight wea<strong>the</strong>r stations <strong>in</strong> <strong>the</strong> watershed.Table 1. Temperature and precipitation <strong>in</strong> <strong>the</strong> Champla<strong>in</strong> Bas<strong>in</strong> 1976–2005, averagedfrom eight USHCN wea<strong>the</strong>r stations <strong>in</strong> <strong>the</strong> watershed.Champla<strong>in</strong>Bas<strong>in</strong> 30-yr*Annual(J-D)W<strong>in</strong>ter(DJF)Spr<strong>in</strong>g(MAM)Summer(JJA)Autumn(SON)Mean T (°F) 44.5 19.2 42.2 65.8 46.4Mean P (<strong>in</strong>.) 37.5 6.3 8.6 11.9 10.8* J-D is a full year, January through December; DJF is December, January, February;MAM is March, April, May; JJA is June, July, August; SON is September,October, November.In order to determ<strong>in</strong>e how climatic patterns with<strong>in</strong> <strong>the</strong> Champla<strong>in</strong>Bas<strong>in</strong> have changed <strong>in</strong> <strong>the</strong> recent past, we analyzedlocal wea<strong>the</strong>r records from <strong>the</strong> United States Historical ClimatologyNetwork (USHCN). Most wea<strong>the</strong>r datasets conta<strong>in</strong>flaws due to gaps <strong>in</strong> coverage, changes <strong>in</strong> <strong>in</strong>strumentation,and <strong>in</strong>consistencies <strong>in</strong> <strong>the</strong> number and tim<strong>in</strong>g of daily observations.Simply us<strong>in</strong>g <strong>the</strong>ir raw data for analysis <strong>the</strong>reforeproduces spurious results. <strong>The</strong> USHCN performs standardizedadjustments that fill temporal gaps and that compensatefor changes <strong>in</strong> methodology, urban development and o<strong>the</strong>rsuch biases (Menne and Williams, 2005, 2009; Menne et al.,2009). <strong>The</strong> database currently <strong>in</strong>cludes records from morethan 1,200 stations <strong>in</strong> <strong>the</strong> lower 48 states, and it is producedand updated at <strong>the</strong> National Climatic Data Center <strong>in</strong> conjunctionwith <strong>the</strong> Department of Energy’s Carbon Dioxide InformationAnalysis Center.<strong>The</strong> eight USHCN stations located with<strong>in</strong> <strong>the</strong> Champla<strong>in</strong>Bas<strong>in</strong> are <strong>in</strong>dicated on Map 2 and are also listed <strong>in</strong> Table2, along with mean annual temperatures and total annualprecipitation measured at each station for two time frames:<strong>the</strong> entire period of record (1895–2008) and a recent 30-yeartime <strong>in</strong>terval (1976–2005) that has been selected for comparisonto previous studies <strong>in</strong> <strong>the</strong> region. For our analyses, <strong>the</strong>records were averaged toge<strong>the</strong>r to produce mean values for<strong>the</strong> bas<strong>in</strong> as a whole. Trends were calculated through l<strong>in</strong>earregression (Press et al., 1986) with <strong>the</strong> SigmaPlot TM program,us<strong>in</strong>g p-values of up to 0.05 to <strong>in</strong>dicate statistical significance.Map 2. <strong>The</strong> eight United States HistoricalClimatology Network wea<strong>the</strong>r stations located<strong>in</strong> <strong>the</strong> Champla<strong>in</strong> Bas<strong>in</strong>.Map by D. Farrell, <strong>The</strong> <strong>Nature</strong> <strong>Conservancy</strong>, Vermont Chapter7