Climate Change in the Champlain Basin - The Nature Conservancy
Climate Change in the Champlain Basin - The Nature Conservancy
Climate Change in the Champlain Basin - The Nature Conservancy

You also want an ePaper? Increase the reach of your titles
YUMPU automatically turns print PDFs into web optimized ePapers that Google loves.
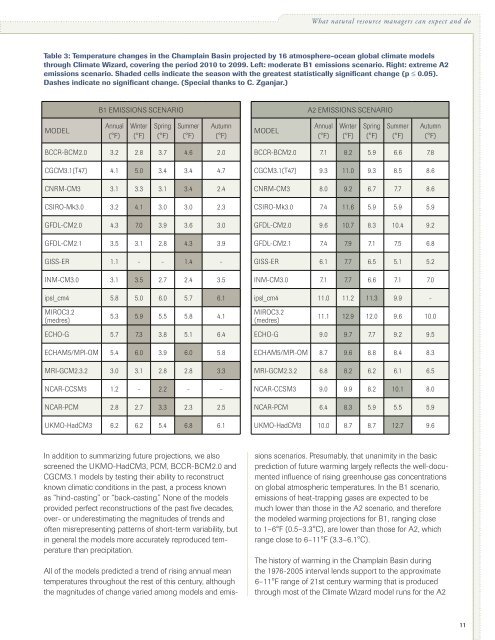
What natural resource managers can expect and doTable 3: Temperature changes <strong>in</strong> <strong>the</strong> Champla<strong>in</strong> Bas<strong>in</strong> projected by 16 atmosphere-ocean global climate modelsthrough <strong>Climate</strong> Wizard, cover<strong>in</strong>g <strong>the</strong> period 2010 to 2099. Left: moderate B1 emissions scenario. Right: extreme A2emissions scenario. Shaded cells <strong>in</strong>dicate <strong>the</strong> season with <strong>the</strong> greatest statistically significant change (p ≤ 0.05).Dashes <strong>in</strong>dicate no significant change. (Special thanks to C. Zganjar.)B1 EMISSIONS SCENARIOA2 EMISSIONS SCENARIOMODELAnnual(°F)W<strong>in</strong>ter(°F)Spr<strong>in</strong>g(°F)Summer(°F)Autumn(°F)MODELAnnual(°F)W<strong>in</strong>ter(°F)Spr<strong>in</strong>g(°F)Summer(°F)Autumn(°F)BCCR-BCM2.0 3.2 2.8 3.7 4.6 2.0CGCM3.1(T47) 4.1 5.0 3.4 3.4 4.7CNRM-CM3 3.1 3.3 3.1 3.4 2.4CSIRO-Mk3.0 3.2 4.1 3.0 3.0 2.3GFDL-CM2.0 4.3 7.0 3.9 3.6 3.0GFDL-CM2.1 3.5 3.1 2.8 4.3 3.9GISS-ER 1.1 - - 1.4 -INM-CM3.0 3.1 3.5 2.7 2.4 3.5ipsl_cm4 5.8 5.0 6.0 5.7 6.1MIROC3.2(medres)5.3 5.9 5.5 5.8 4.1ECHO-G 5.7 7.3 3.8 5.1 6.4ECHAM5/MPI-OM 5.4 6.0 3.9 6.0 5.8MRI-GCM2.3.2 3.0 3.1 2.8 2.8 3.3NCAR-CCSM3 1.2 - 2.2 - -NCAR-PCM 2.8 2.7 3.3 2.3 2.5UKMO-HadCM3 6.2 6.2 5.4 6.8 6.1BCCR-BCM2.0 7.1 8.2 5.9 6.6 7.8CGCM3.1(T47) 9.3 11.0 9.3 8.5 8.6CNRM-CM3 8.0 9.2 6.7 7.7 8.6CSIRO-Mk3.0 7.4 11.6 5.9 5.9 5.9GFDL-CM2.0 9.6 10.7 8.3 10.4 9.2GFDL-CM2.1 7.4 7.9 7.1 7.5 6.8GISS-ER 6.1 7.7 6.5 5.1 5.2INM-CM3.0 7.1 7.7 6.6 7.1 7.0ipsl_cm4 11.0 11.2 11.3 9.9 -MIROC3.2(medres)11.1 12.9 12.0 9.6 10.0ECHO-G 9.0 9.7 7.7 9.2 9.5ECHAM5/MPI-OM 8.7 9.6 8.8 8.4 8.3MRI-GCM2.3.2 6.8 8.2 6.2 6.1 6.5NCAR-CCSM3 9.0 9.9 8.2 10.1 8.0NCAR-PCM 6.4 8.3 5.9 5.5 5.9UKMO-HadCM3 10.0 8.7 8.7 12.7 9.6In addition to summariz<strong>in</strong>g future projections, we alsoscreened <strong>the</strong> UKMO-HadCM3, PCM, BCCR-BCM2.0 andCGCM3.1 models by test<strong>in</strong>g <strong>the</strong>ir ability to reconstructknown climatic conditions <strong>in</strong> <strong>the</strong> past, a process knownas “h<strong>in</strong>d-cast<strong>in</strong>g” or “back-cast<strong>in</strong>g.” None of <strong>the</strong> modelsprovided perfect reconstructions of <strong>the</strong> past five decades,over- or underestimat<strong>in</strong>g <strong>the</strong> magnitudes of trends andoften misrepresent<strong>in</strong>g patterns of short-term variability, but<strong>in</strong> general <strong>the</strong> models more accurately reproduced temperaturethan precipitation.All of <strong>the</strong> models predicted a trend of ris<strong>in</strong>g annual meantemperatures throughout <strong>the</strong> rest of this century, although<strong>the</strong> magnitudes of change varied among models and emissionsscenarios. Presumably, that unanimity <strong>in</strong> <strong>the</strong> basicprediction of future warm<strong>in</strong>g largely reflects <strong>the</strong> well-documented<strong>in</strong>fluence of ris<strong>in</strong>g greenhouse gas concentrationson global atmospheric temperatures. In <strong>the</strong> B1 scenario,emissions of heat-trapp<strong>in</strong>g gases are expected to bemuch lower than those <strong>in</strong> <strong>the</strong> A2 scenario, and <strong>the</strong>refore<strong>the</strong> modeled warm<strong>in</strong>g projections for B1, rang<strong>in</strong>g closeto 1–6°F (0.5–3.3°C), are lower than those for A2, whichrange close to 6–11°F (3.3–6.1°C).<strong>The</strong> history of warm<strong>in</strong>g <strong>in</strong> <strong>the</strong> Champla<strong>in</strong> Bas<strong>in</strong> dur<strong>in</strong>g<strong>the</strong> 1976-2005 <strong>in</strong>terval lends support to <strong>the</strong> approximate6–11°F range of 21st century warm<strong>in</strong>g that is producedthrough most of <strong>the</strong> <strong>Climate</strong> Wizard model runs for <strong>the</strong> A211