Morphology of Experimental and Simulated Turing Patterns
Morphology of Experimental and Simulated Turing Patterns
Morphology of Experimental and Simulated Turing Patterns

You also want an ePaper? Increase the reach of your titles
YUMPU automatically turns print PDFs into web optimized ePapers that Google loves.
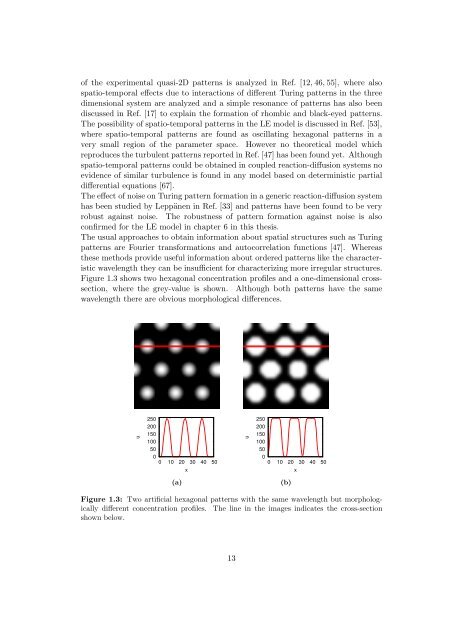
<strong>of</strong> the experimental quasi-2D patterns is analyzed in Ref. [12, 46, 55], where alsospatio-temporal effects due to interactions <strong>of</strong> different <strong>Turing</strong> patterns in the threedimensional system are analyzed <strong>and</strong> a simple resonance <strong>of</strong> patterns has also beendiscussed in Ref. [17] to explain the formation <strong>of</strong> rhombic <strong>and</strong> black-eyed patterns.The possibility <strong>of</strong> spatio-temporal patterns in the LE model is discussed in Ref. [53],where spatio-temporal patterns are found as oscillating hexagonal patterns in avery small region <strong>of</strong> the parameter space. However no theoretical model whichreproduces the turbulent patterns reported in Ref. [47] has been found yet. Althoughspatio-temporal patterns could be obtained in coupled reaction-diffusion systems noevidence <strong>of</strong> similar turbulence is found in any model based on deterministic partialdifferential equations [67].The effect <strong>of</strong> noise on <strong>Turing</strong> pattern formation in a generic reaction-diffusion systemhas been studied by Leppänen in Ref. [33] <strong>and</strong> patterns have been found to be veryrobust against noise. The robustness <strong>of</strong> pattern formation against noise is alsoconfirmed for the LE model in chapter 6 in this thesis.The usual approaches to obtain information about spatial structures such as <strong>Turing</strong>patterns are Fourier transformations <strong>and</strong> autocorrelation functions [47]. Whereasthese methods provide useful information about ordered patterns like the characteristicwavelength they can be insufficient for characterizing more irregular structures.Figure 1.3 shows two hexagonal concentration pr<strong>of</strong>iles <strong>and</strong> a one-dimensional crosssection,where the grey-value is shown. Although both patterns have the samewavelength there are obvious morphological differences.u2502001501005000 10 20 30 40 50xu2502001501005000 10 20 30 40 50x(a)(b)Figure 1.3: Two artificial hexagonal patterns with the same wavelength but morphologicallydifferent concentration pr<strong>of</strong>iles. The line in the images indicates the cross-sectionshown below.13