Morphology of Experimental and Simulated Turing Patterns
Morphology of Experimental and Simulated Turing Patterns
Morphology of Experimental and Simulated Turing Patterns
SHOW LESS

Create successful ePaper yourself
Turn your PDF publications into a flip-book with our unique Google optimized e-Paper software.
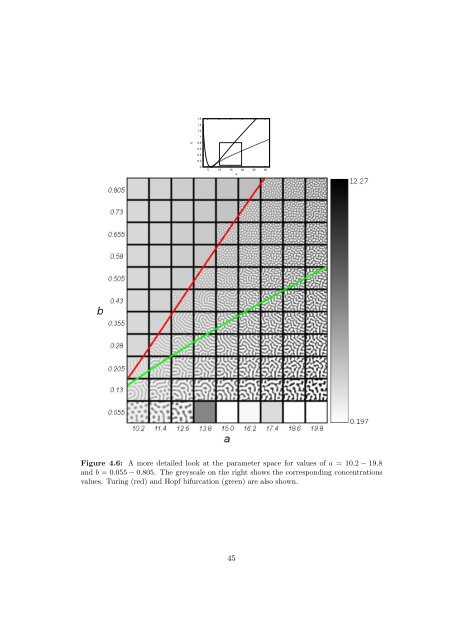
1.61.41.21b0.80.60.40.205 10 15 20 25 30aFigure 4.6: A more detailed look at the parameter space for values <strong>of</strong> a = 10.2 − 19.8<strong>and</strong> b = 0.055 − 0.805. The greyscale on the right shows the corresponding concentrationsvalues. <strong>Turing</strong> (red) <strong>and</strong> Hopf bifurcation (green) are also shown.45